Lake Fenton, MI Map & Demographics
Lake Fenton Map
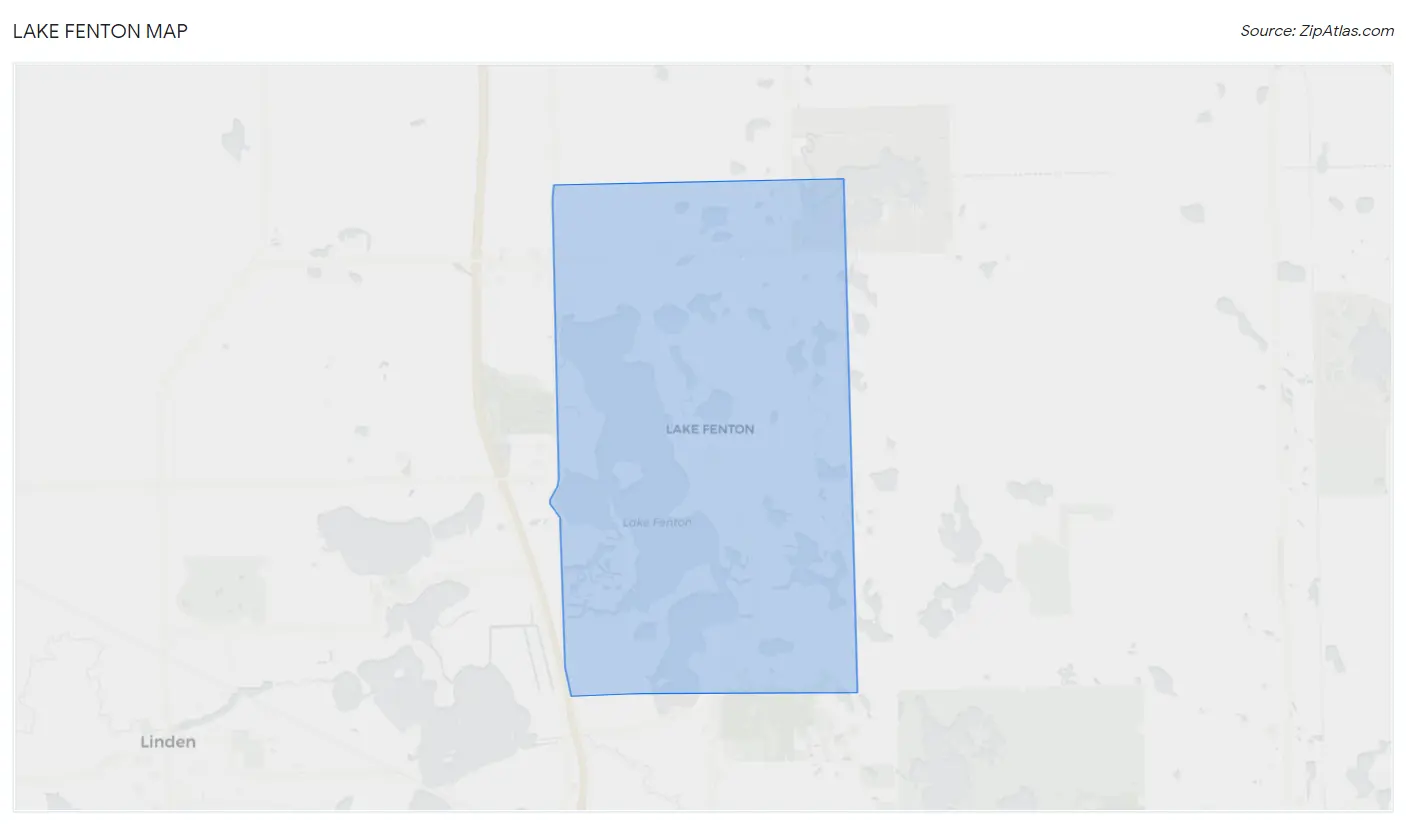
Lake Fenton Overview
$73,292
PER CAPITA INCOME
$122,209
AVG FAMILY INCOME
$108,887
AVG HOUSEHOLD INCOME
44.2%
WAGE / INCOME GAP [ % ]
55.8¢/ $1
WAGE / INCOME GAP [ $ ]
0.53
INEQUALITY / GINI INDEX
6,316
TOTAL POPULATION
3,093
MALE POPULATION
3,223
FEMALE POPULATION
95.97
MALES / 100 FEMALES
104.20
FEMALES / 100 MALES
48.3
MEDIAN AGE
2.8
AVG FAMILY SIZE
2.5
AVG HOUSEHOLD SIZE
2,521
LABOR FORCE [ PEOPLE ]
46.8%
PERCENT IN LABOR FORCE
4.0%
UNEMPLOYMENT RATE
Income in Lake Fenton
Income Overview in Lake Fenton
Per Capita Income in Lake Fenton is $73,292, while median incomes of families and households are $122,209 and $108,887 respectively.
| Characteristic | Number | Measure |
| Per Capita Income | 6,316 | $73,292 |
| Median Family Income | 1,924 | $122,209 |
| Mean Family Income | 1,924 | $218,197 |
| Median Household Income | 2,551 | $108,887 |
| Mean Household Income | 2,551 | $181,325 |
| Income Deficit | 1,924 | $0 |
| Wage / Income Gap (%) | 6,316 | 44.22% |
| Wage / Income Gap ($) | 6,316 | 55.78¢ per $1 |
| Gini / Inequality Index | 6,316 | 0.53 |
Earnings by Sex in Lake Fenton
Average Earnings in Lake Fenton are $50,221, $70,259 for men and $39,188 for women, a difference of 44.2%.
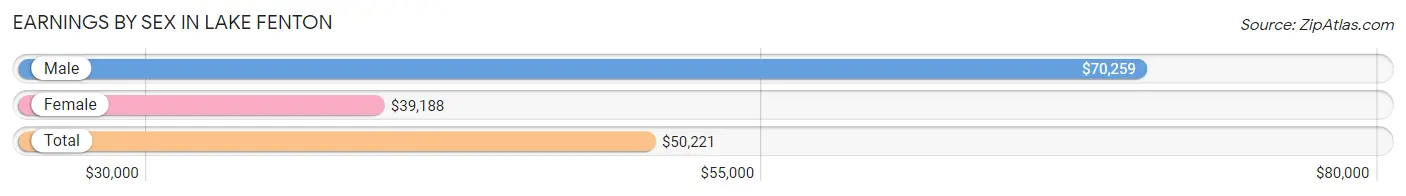
| Sex | Number | Average Earnings |
| Male | 1,470 (52.8%) | $70,259 |
| Female | 1,316 (47.2%) | $39,188 |
| Total | 2,786 (100.0%) | $50,221 |
Earnings by Sex by Income Bracket in Lake Fenton
The most common earnings brackets in Lake Fenton are $100,000+ for men (436 | 29.7%) and $100,000+ for women (160 | 12.2%).
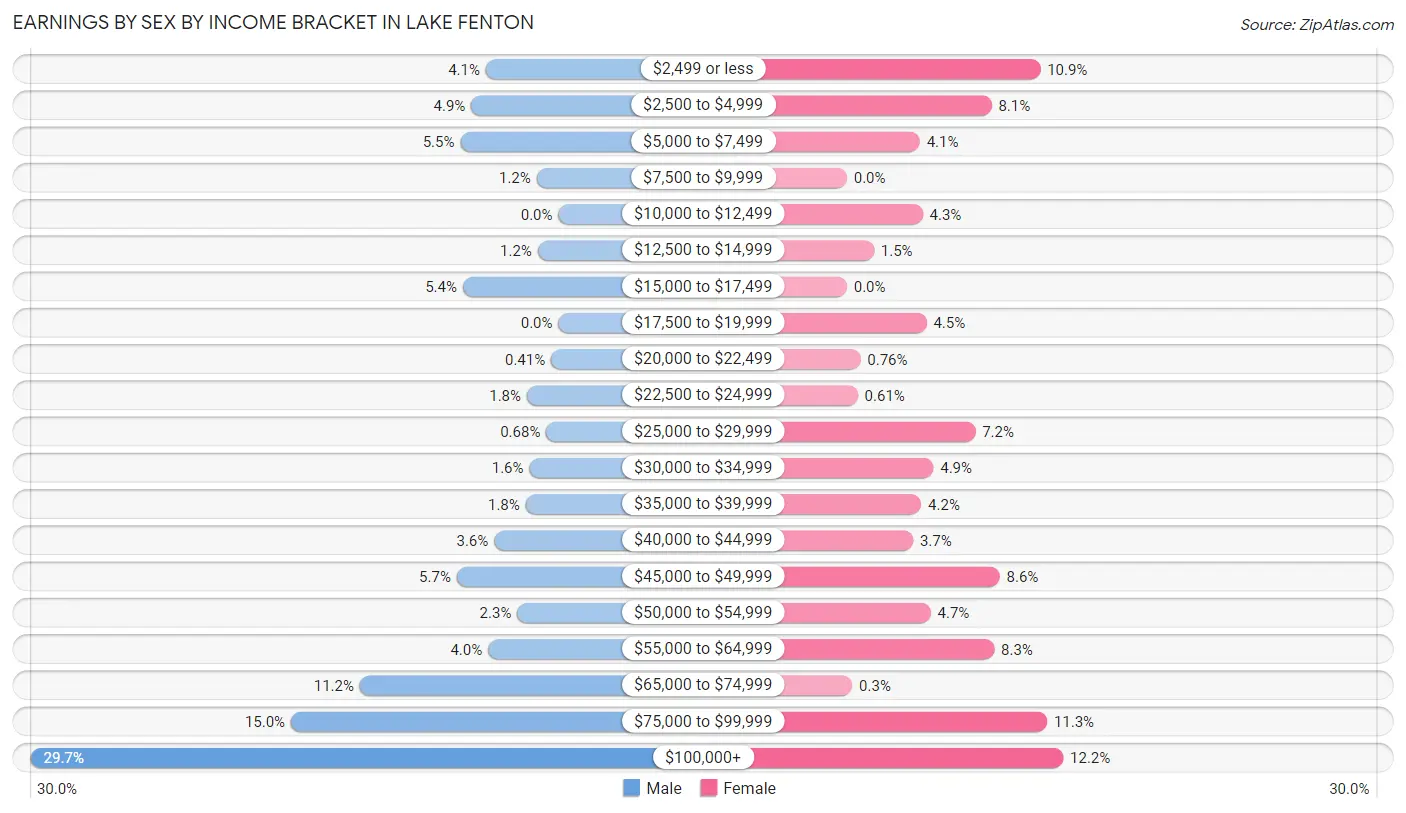
| Income | Male | Female |
| $2,499 or less | 60 (4.1%) | 143 (10.9%) |
| $2,500 to $4,999 | 72 (4.9%) | 107 (8.1%) |
| $5,000 to $7,499 | 81 (5.5%) | 54 (4.1%) |
| $7,500 to $9,999 | 18 (1.2%) | 0 (0.0%) |
| $10,000 to $12,499 | 0 (0.0%) | 56 (4.3%) |
| $12,500 to $14,999 | 17 (1.2%) | 20 (1.5%) |
| $15,000 to $17,499 | 79 (5.4%) | 0 (0.0%) |
| $17,500 to $19,999 | 0 (0.0%) | 59 (4.5%) |
| $20,000 to $22,499 | 6 (0.4%) | 10 (0.8%) |
| $22,500 to $24,999 | 26 (1.8%) | 8 (0.6%) |
| $25,000 to $29,999 | 10 (0.7%) | 95 (7.2%) |
| $30,000 to $34,999 | 24 (1.6%) | 64 (4.9%) |
| $35,000 to $39,999 | 27 (1.8%) | 55 (4.2%) |
| $40,000 to $44,999 | 53 (3.6%) | 49 (3.7%) |
| $45,000 to $49,999 | 84 (5.7%) | 113 (8.6%) |
| $50,000 to $54,999 | 34 (2.3%) | 62 (4.7%) |
| $55,000 to $64,999 | 58 (4.0%) | 109 (8.3%) |
| $65,000 to $74,999 | 164 (11.2%) | 4 (0.3%) |
| $75,000 to $99,999 | 221 (15.0%) | 148 (11.3%) |
| $100,000+ | 436 (29.7%) | 160 (12.2%) |
| Total | 1,470 (100.0%) | 1,316 (100.0%) |
Earnings by Sex by Educational Attainment in Lake Fenton
Average earnings in Lake Fenton are $78,250 for men and $41,888 for women, a difference of 46.5%. Men with an educational attainment of graduate degree enjoy the highest average annual earnings of $115,578, while those with college or associate's degree education earn the least with $49,609. Women with an educational attainment of graduate degree earn the most with the average annual earnings of $77,981, while those with college or associate's degree education have the smallest earnings of $29,103.
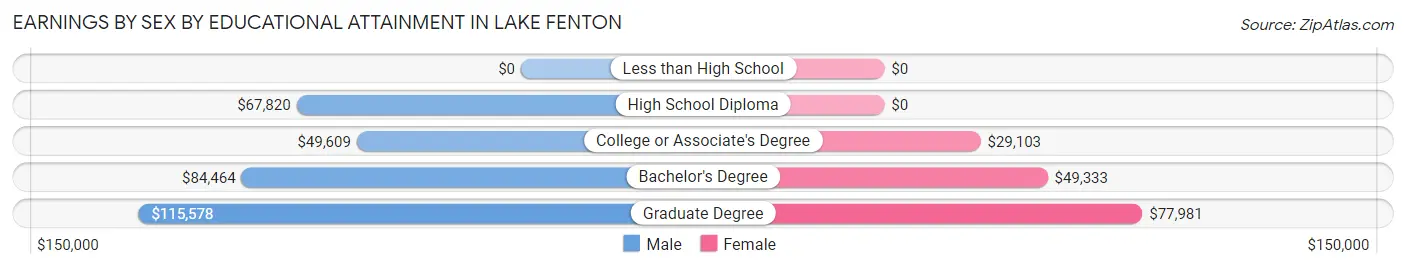
| Educational Attainment | Male Income | Female Income |
| Less than High School | - | - |
| High School Diploma | $67,820 | $0 |
| College or Associate's Degree | $49,609 | $29,103 |
| Bachelor's Degree | $84,464 | $49,333 |
| Graduate Degree | $115,578 | $77,981 |
| Total | $78,250 | $41,888 |
Family Income in Lake Fenton
Family Income Brackets in Lake Fenton
According to the Lake Fenton family income data, there are 562 families falling into the $200,000+ income range, which is the most common income bracket and makes up 29.2% of all families.
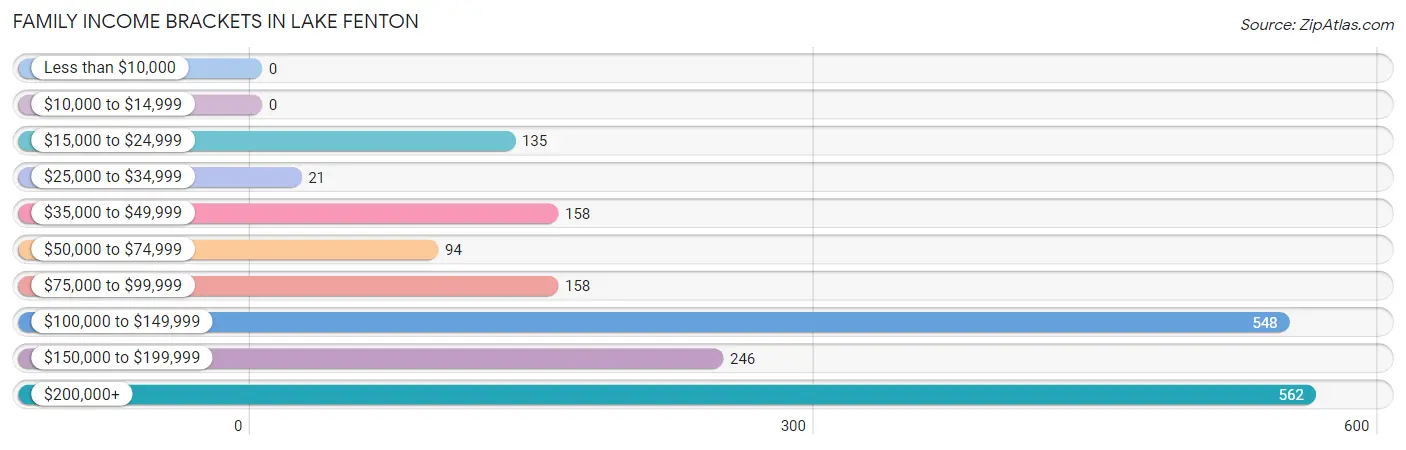
| Income Bracket | # Families | % Families |
| Less than $10,000 | 0 | 0.0% |
| $10,000 to $14,999 | 0 | 0.0% |
| $15,000 to $24,999 | 135 | 7.0% |
| $25,000 to $34,999 | 21 | 1.1% |
| $35,000 to $49,999 | 158 | 8.2% |
| $50,000 to $74,999 | 94 | 4.9% |
| $75,000 to $99,999 | 158 | 8.2% |
| $100,000 to $149,999 | 548 | 28.5% |
| $150,000 to $199,999 | 246 | 12.8% |
| $200,000+ | 562 | 29.2% |
Family Income by Famaliy Size in Lake Fenton
5-person families (142 | 7.4%) account for the highest median family income in Lake Fenton with $226,250 per family, while 2-person families (1,080 | 56.1%) have the highest median income of $57,386 per family member.
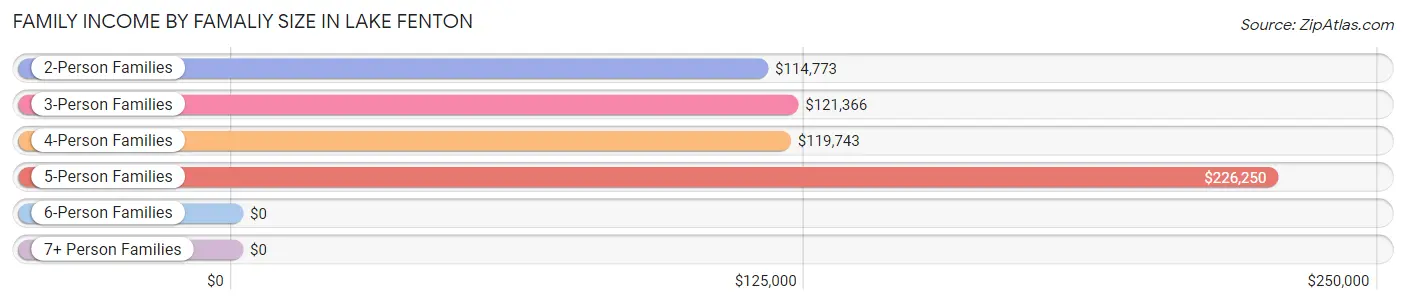
| Income Bracket | # Families | Median Income |
| 2-Person Families | 1,080 (56.1%) | $114,773 |
| 3-Person Families | 253 (13.2%) | $121,366 |
| 4-Person Families | 449 (23.3%) | $119,743 |
| 5-Person Families | 142 (7.4%) | $226,250 |
| 6-Person Families | 0 (0.0%) | $0 |
| 7+ Person Families | 0 (0.0%) | $0 |
| Total | 1,924 (100.0%) | $122,209 |
Family Income by Number of Earners in Lake Fenton
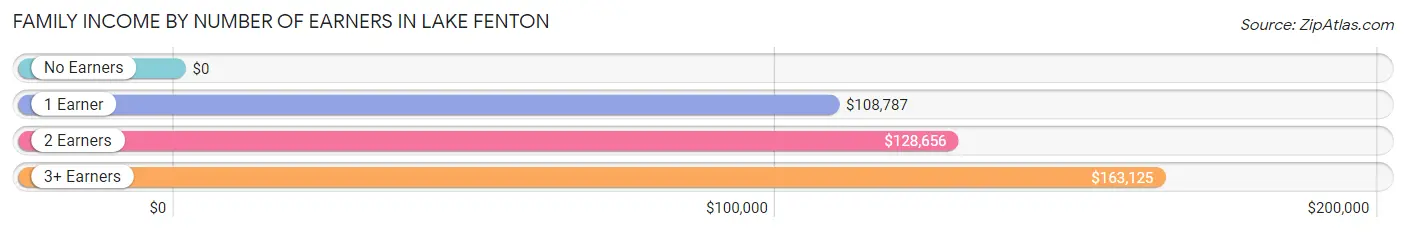
| Number of Earners | # Families | Median Income |
| No Earners | 596 (31.0%) | $0 |
| 1 Earner | 615 (32.0%) | $108,787 |
| 2 Earners | 557 (28.9%) | $128,656 |
| 3+ Earners | 156 (8.1%) | $163,125 |
| Total | 1,924 (100.0%) | $122,209 |
Household Income in Lake Fenton
Household Income Brackets in Lake Fenton
With 599 households falling in the category, the $100,000 to $149,999 income range is the most frequent in Lake Fenton, accounting for 23.5% of all households.
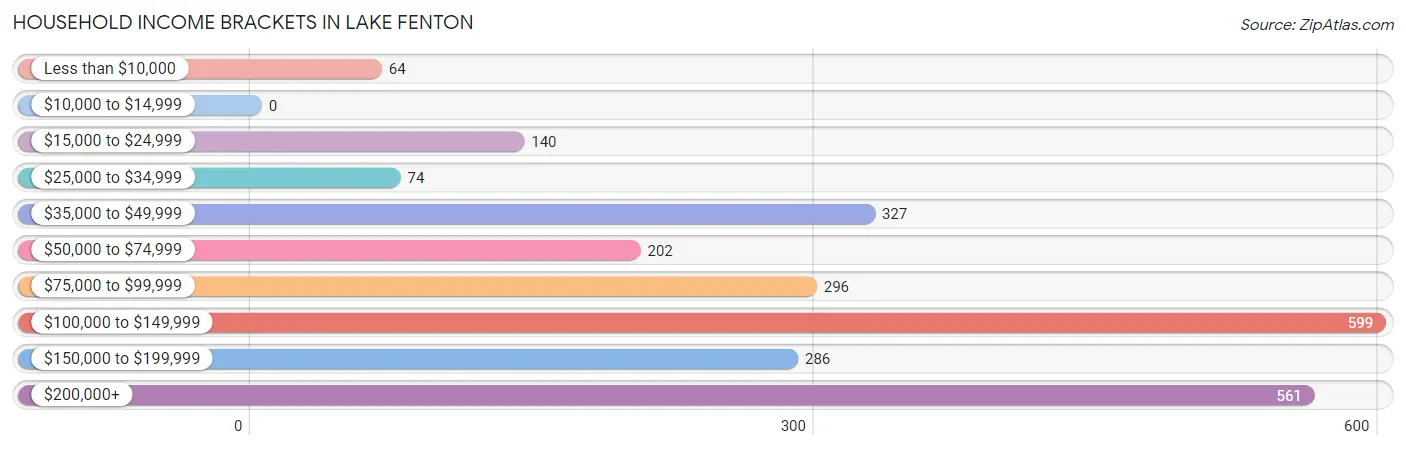
| Income Bracket | # Households | % Households |
| Less than $10,000 | 64 | 2.5% |
| $10,000 to $14,999 | 0 | 0.0% |
| $15,000 to $24,999 | 140 | 5.5% |
| $25,000 to $34,999 | 74 | 2.9% |
| $35,000 to $49,999 | 327 | 12.8% |
| $50,000 to $74,999 | 202 | 7.9% |
| $75,000 to $99,999 | 296 | 11.6% |
| $100,000 to $149,999 | 599 | 23.5% |
| $150,000 to $199,999 | 286 | 11.2% |
| $200,000+ | 561 | 22.0% |
Household Income by Householder Age in Lake Fenton
The median household income in Lake Fenton is $108,887, with the highest median household income of $110,024 found in the 25 to 44 years age bracket for the primary householder. A total of 615 households (24.1%) fall into this category. Meanwhile, the 15 to 24 years age bracket for the primary householder has the lowest median household income of $0, with 31 households (1.2%) in this group.
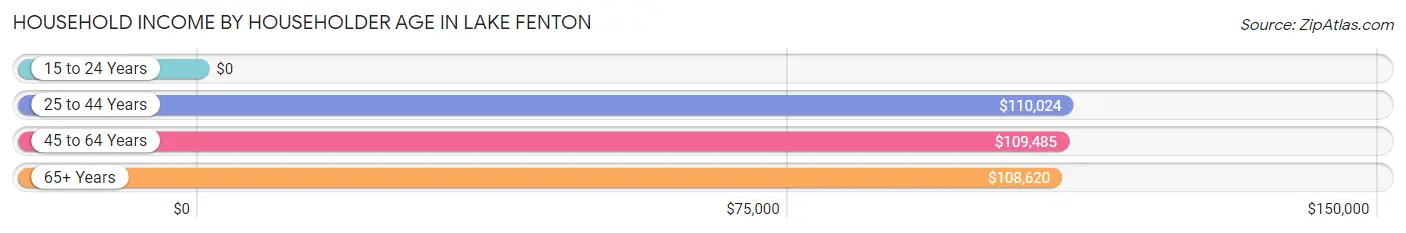
| Income Bracket | # Households | Median Income |
| 15 to 24 Years | 31 (1.2%) | $0 |
| 25 to 44 Years | 615 (24.1%) | $110,024 |
| 45 to 64 Years | 990 (38.8%) | $109,485 |
| 65+ Years | 915 (35.9%) | $108,620 |
| Total | 2,551 (100.0%) | $108,887 |
Poverty in Lake Fenton
Income Below Poverty by Sex and Age in Lake Fenton
With 8.7% poverty level for males and 9.7% for females among the residents of Lake Fenton, 15 year old males and 55 to 64 year old females are the most vulnerable to poverty, with 17 males (29.8%) and 161 females (34.5%) in their respective age groups living below the poverty level.
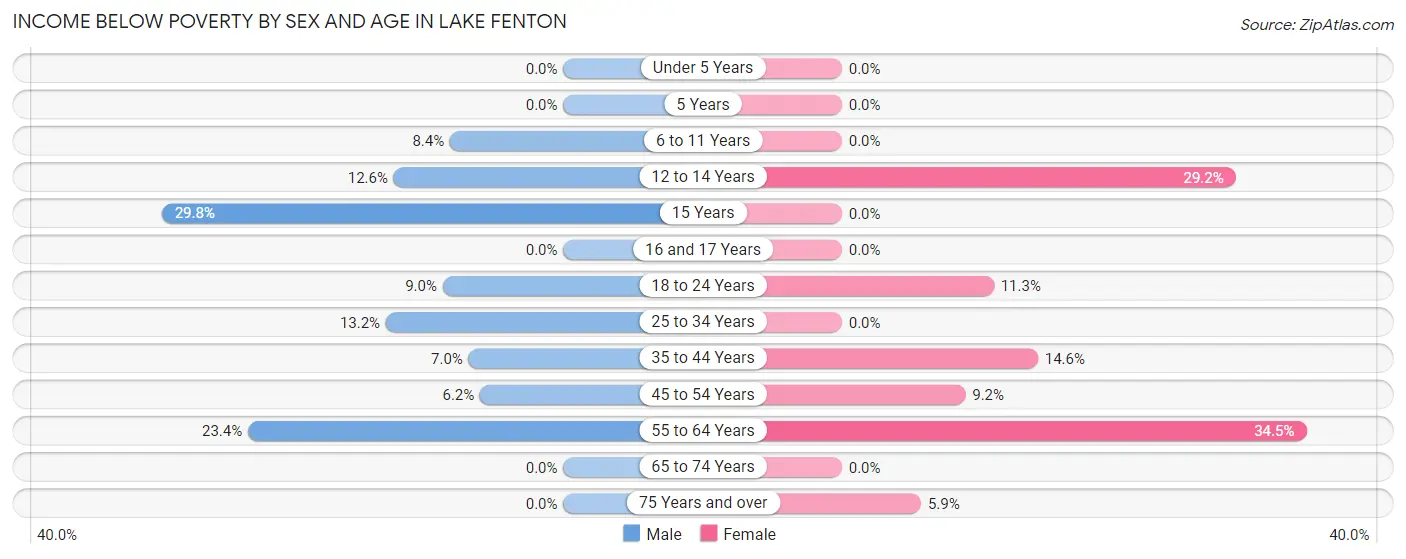
| Age Bracket | Male | Female |
| Under 5 Years | 0 (0.0%) | 0 (0.0%) |
| 5 Years | 0 (0.0%) | 0 (0.0%) |
| 6 to 11 Years | 18 (8.4%) | 0 (0.0%) |
| 12 to 14 Years | 18 (12.6%) | 19 (29.2%) |
| 15 Years | 17 (29.8%) | 0 (0.0%) |
| 16 and 17 Years | 0 (0.0%) | 0 (0.0%) |
| 18 to 24 Years | 17 (8.9%) | 15 (11.3%) |
| 25 to 34 Years | 42 (13.2%) | 0 (0.0%) |
| 35 to 44 Years | 31 (7.0%) | 56 (14.5%) |
| 45 to 54 Years | 22 (6.2%) | 41 (9.2%) |
| 55 to 64 Years | 103 (23.4%) | 161 (34.5%) |
| 65 to 74 Years | 0 (0.0%) | 0 (0.0%) |
| 75 Years and over | 0 (0.0%) | 20 (5.9%) |
| Total | 268 (8.7%) | 312 (9.7%) |
Income Above Poverty by Sex and Age in Lake Fenton
According to the poverty statistics in Lake Fenton, males aged under 5 years and females aged under 5 years are the age groups that are most secure financially, with 100.0% of males and 100.0% of females in these age groups living above the poverty line.
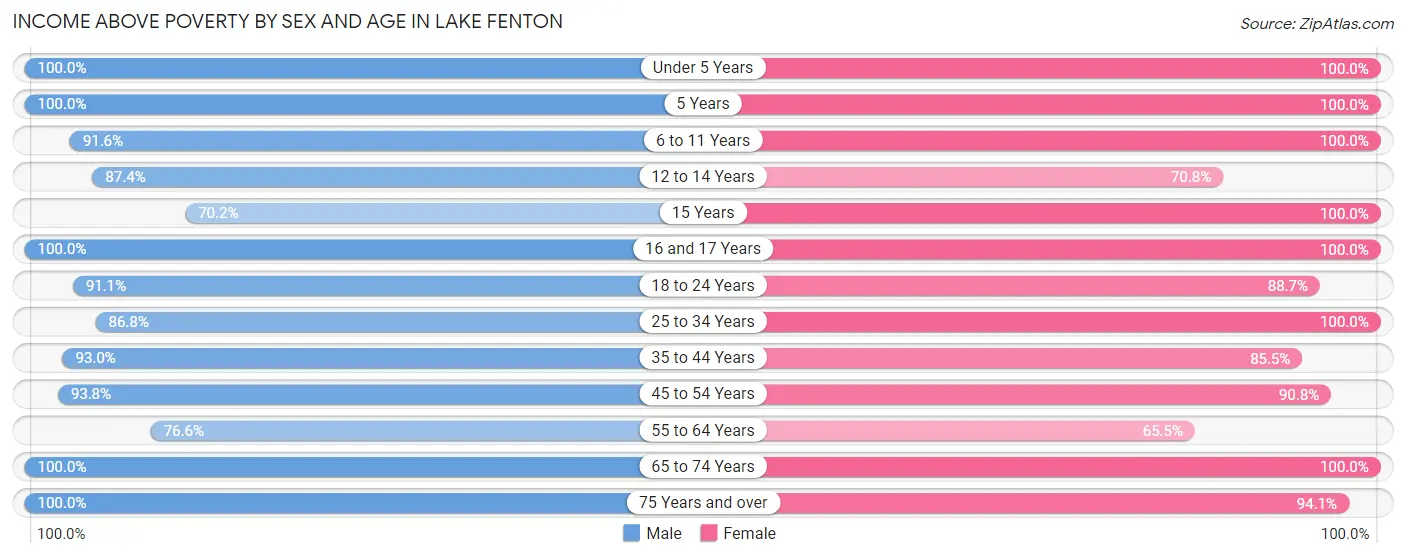
| Age Bracket | Male | Female |
| Under 5 Years | 34 (100.0%) | 136 (100.0%) |
| 5 Years | 25 (100.0%) | 22 (100.0%) |
| 6 to 11 Years | 196 (91.6%) | 198 (100.0%) |
| 12 to 14 Years | 125 (87.4%) | 46 (70.8%) |
| 15 Years | 40 (70.2%) | 35 (100.0%) |
| 16 and 17 Years | 93 (100.0%) | 73 (100.0%) |
| 18 to 24 Years | 173 (91.0%) | 118 (88.7%) |
| 25 to 34 Years | 277 (86.8%) | 285 (100.0%) |
| 35 to 44 Years | 410 (93.0%) | 329 (85.5%) |
| 45 to 54 Years | 334 (93.8%) | 406 (90.8%) |
| 55 to 64 Years | 337 (76.6%) | 306 (65.5%) |
| 65 to 74 Years | 577 (100.0%) | 637 (100.0%) |
| 75 Years and over | 204 (100.0%) | 320 (94.1%) |
| Total | 2,825 (91.3%) | 2,911 (90.3%) |
Income Below Poverty Among Married-Couple Families in Lake Fenton
The poverty statistics for married-couple families in Lake Fenton show that 5.8% or 99 of the total 1,721 families live below the poverty line. Families with no children have the highest poverty rate of 7.7%, comprising of 99 families. On the other hand, families with 1 or 2 children have the lowest poverty rate of 0.0%, which includes 0 families.
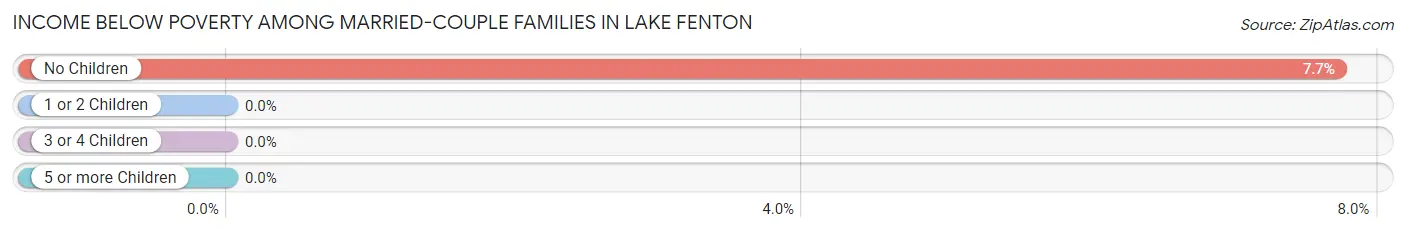
| Children | Above Poverty | Below Poverty |
| No Children | 1,183 (92.3%) | 99 (7.7%) |
| 1 or 2 Children | 387 (100.0%) | 0 (0.0%) |
| 3 or 4 Children | 52 (100.0%) | 0 (0.0%) |
| 5 or more Children | 0 (0.0%) | 0 (0.0%) |
| Total | 1,622 (94.3%) | 99 (5.8%) |
Income Below Poverty Among Single-Parent Households in Lake Fenton
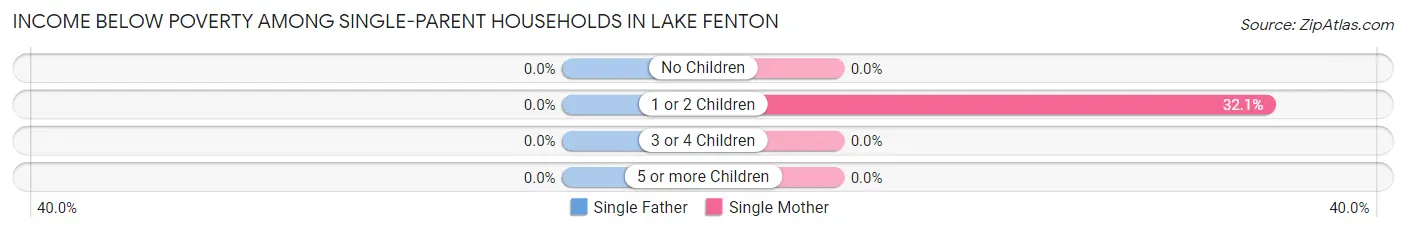
| Children | Single Father | Single Mother |
| No Children | 0 (0.0%) | 0 (0.0%) |
| 1 or 2 Children | 0 (0.0%) | 36 (32.1%) |
| 3 or 4 Children | 0 (0.0%) | 0 (0.0%) |
| 5 or more Children | 0 (0.0%) | 0 (0.0%) |
| Total | 0 (0.0%) | 36 (26.3%) |
Income Below Poverty Among Married-Couple vs Single-Parent Households in Lake Fenton
The poverty data for Lake Fenton shows that 99 of the married-couple family households (5.8%) and 36 of the single-parent households (17.7%) are living below the poverty level. Within the married-couple family households, those with no children have the highest poverty rate, with 99 households (7.7%) falling below the poverty line. Among the single-parent households, those with 1 or 2 children have the highest poverty rate, with 36 household (21.7%) living below poverty.
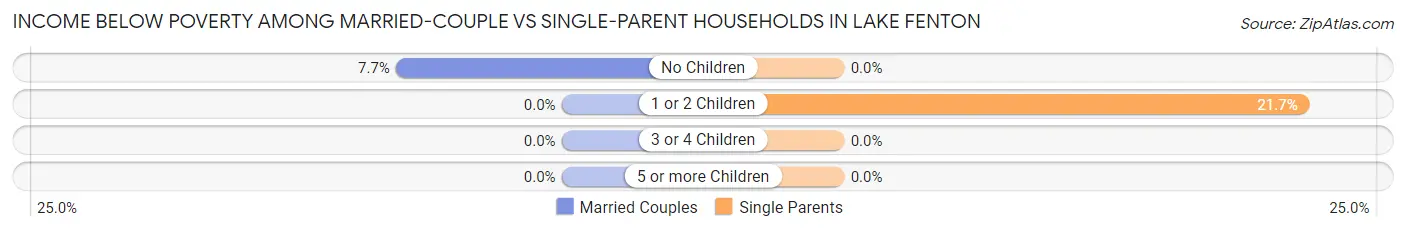
| Children | Married-Couple Families | Single-Parent Households |
| No Children | 99 (7.7%) | 0 (0.0%) |
| 1 or 2 Children | 0 (0.0%) | 36 (21.7%) |
| 3 or 4 Children | 0 (0.0%) | 0 (0.0%) |
| 5 or more Children | 0 (0.0%) | 0 (0.0%) |
| Total | 99 (5.8%) | 36 (17.7%) |
Race in Lake Fenton
The most populous races in Lake Fenton are White / Caucasian (6,217 | 98.4%), Hispanic or Latino (139 | 2.2%), and Two or more Races (53 | 0.8%).
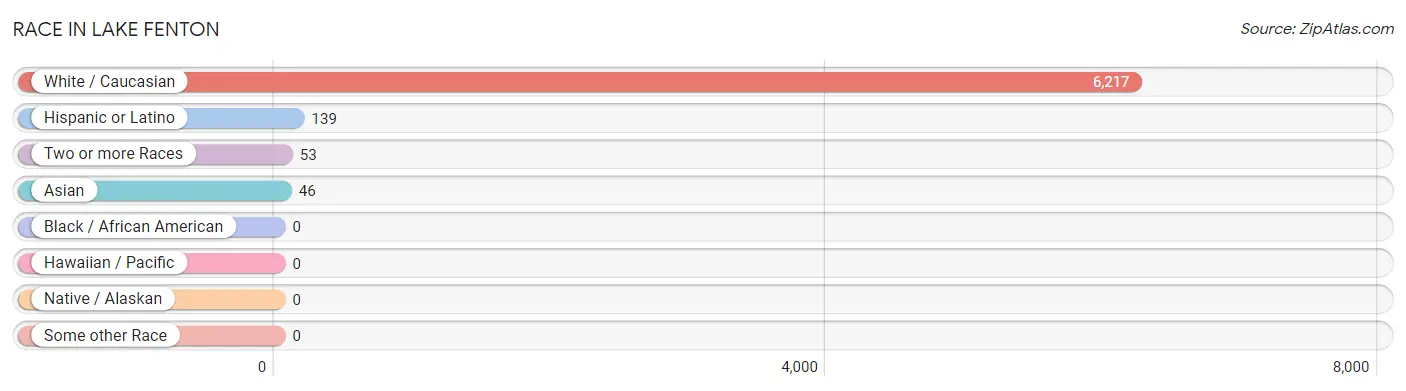
| Race | # Population | % Population |
| Asian | 46 | 0.7% |
| Black / African American | 0 | 0.0% |
| Hawaiian / Pacific | 0 | 0.0% |
| Hispanic or Latino | 139 | 2.2% |
| Native / Alaskan | 0 | 0.0% |
| White / Caucasian | 6,217 | 98.4% |
| Two or more Races | 53 | 0.8% |
| Some other Race | 0 | 0.0% |
| Total | 6,316 | 100.0% |
Ancestry in Lake Fenton
The most populous ancestries reported in Lake Fenton are German (1,352 | 21.4%), Irish (984 | 15.6%), English (979 | 15.5%), Polish (614 | 9.7%), and French (322 | 5.1%), together accounting for 67.3% of all Lake Fenton residents.
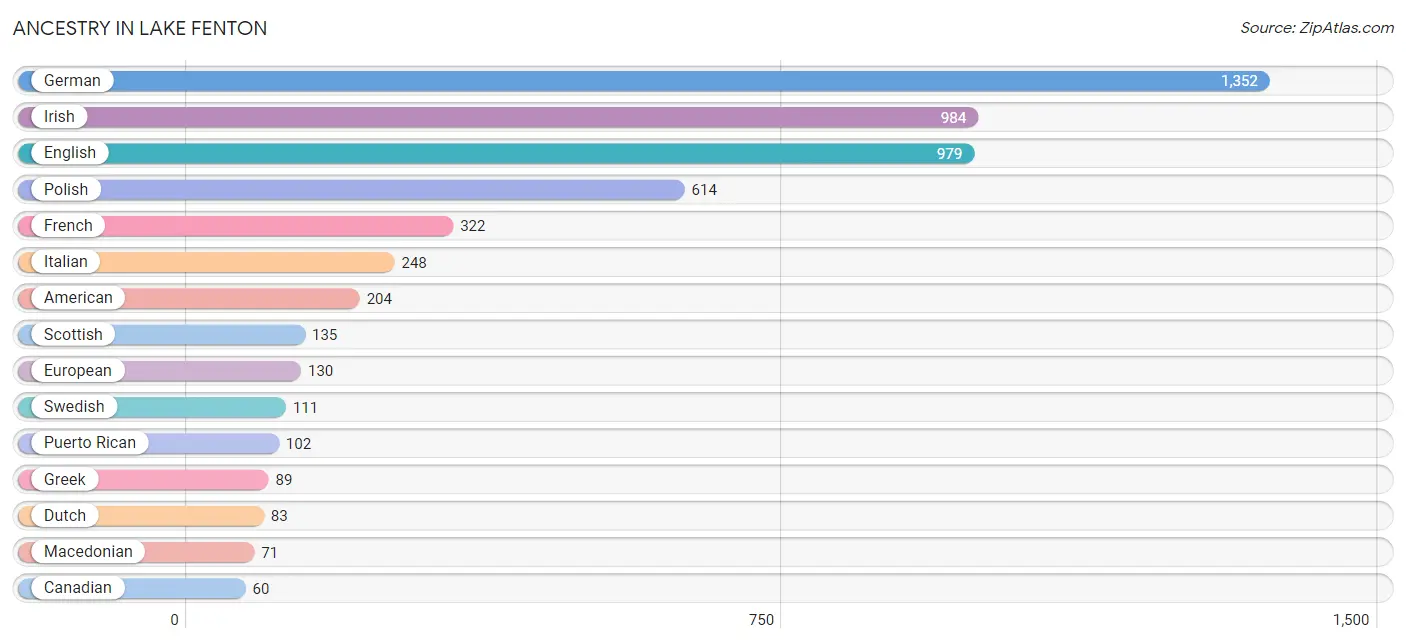
| Ancestry | # Population | % Population |
| American | 204 | 3.2% |
| Arab | 25 | 0.4% |
| Assyrian / Chaldean / Syriac | 10 | 0.2% |
| Belgian | 14 | 0.2% |
| Blackfeet | 17 | 0.3% |
| British | 19 | 0.3% |
| Burmese | 46 | 0.7% |
| Canadian | 60 | 0.9% |
| Czechoslovakian | 60 | 0.9% |
| Danish | 46 | 0.7% |
| Dutch | 83 | 1.3% |
| English | 979 | 15.5% |
| European | 130 | 2.1% |
| French | 322 | 5.1% |
| French Canadian | 57 | 0.9% |
| German | 1,352 | 21.4% |
| Greek | 89 | 1.4% |
| Hungarian | 4 | 0.1% |
| Irish | 984 | 15.6% |
| Italian | 248 | 3.9% |
| Lebanese | 25 | 0.4% |
| Macedonian | 71 | 1.1% |
| Mexican | 37 | 0.6% |
| Norwegian | 29 | 0.5% |
| Polish | 614 | 9.7% |
| Puerto Rican | 102 | 1.6% |
| Scotch-Irish | 35 | 0.5% |
| Scottish | 135 | 2.1% |
| Slovak | 51 | 0.8% |
| Swedish | 111 | 1.8% | View All 30 Rows |
Immigrants in Lake Fenton
The most numerous immigrant groups reported in Lake Fenton came from Asia (46 | 0.7%), Eastern Asia (46 | 0.7%), Korea (46 | 0.7%), Europe (34 | 0.5%), and Canada (33 | 0.5%), together accounting for 3.3% of all Lake Fenton residents.
| Immigration Origin | # Population | % Population |
| Asia | 46 | 0.7% |
| Canada | 33 | 0.5% |
| Eastern Asia | 46 | 0.7% |
| Eastern Europe | 21 | 0.3% |
| Europe | 34 | 0.5% |
| Germany | 13 | 0.2% |
| Korea | 46 | 0.7% |
| Poland | 21 | 0.3% |
| Western Europe | 13 | 0.2% | View All 9 Rows |
Sex and Age in Lake Fenton
Sex and Age in Lake Fenton
The most populous age groups in Lake Fenton are 70 to 74 Years (468 | 15.1%) for men and 70 to 74 Years (436 | 13.5%) for women.
| Age Bracket | Male | Female |
| Under 5 Years | 34 (1.1%) | 136 (4.2%) |
| 5 to 9 Years | 208 (6.7%) | 115 (3.6%) |
| 10 to 14 Years | 174 (5.6%) | 170 (5.3%) |
| 15 to 19 Years | 258 (8.3%) | 164 (5.1%) |
| 20 to 24 Years | 82 (2.6%) | 77 (2.4%) |
| 25 to 29 Years | 161 (5.2%) | 214 (6.6%) |
| 30 to 34 Years | 158 (5.1%) | 71 (2.2%) |
| 35 to 39 Years | 290 (9.4%) | 304 (9.4%) |
| 40 to 44 Years | 151 (4.9%) | 81 (2.5%) |
| 45 to 49 Years | 225 (7.3%) | 219 (6.8%) |
| 50 to 54 Years | 131 (4.2%) | 228 (7.1%) |
| 55 to 59 Years | 288 (9.3%) | 234 (7.3%) |
| 60 to 64 Years | 152 (4.9%) | 233 (7.2%) |
| 65 to 69 Years | 109 (3.5%) | 201 (6.2%) |
| 70 to 74 Years | 468 (15.1%) | 436 (13.5%) |
| 75 to 79 Years | 94 (3.0%) | 196 (6.1%) |
| 80 to 84 Years | 74 (2.4%) | 53 (1.6%) |
| 85 Years and over | 36 (1.2%) | 91 (2.8%) |
| Total | 3,093 (100.0%) | 3,223 (100.0%) |
Families and Households in Lake Fenton
Median Family Size in Lake Fenton
The median family size in Lake Fenton is 2.82 persons per family, with single female/mother families (137 | 7.1%) accounting for the largest median family size of 3.74 persons per family. On the other hand, single male/father families (66 | 3.4%) represent the smallest median family size with 2.70 persons per family.
| Family Type | # Families | Family Size |
| Married-Couple | 1,721 (89.4%) | 2.75 |
| Single Male/Father | 66 (3.4%) | 2.70 |
| Single Female/Mother | 137 (7.1%) | 3.74 |
| Total Families | 1,924 (100.0%) | 2.82 |
Median Household Size in Lake Fenton
The median household size in Lake Fenton is 2.47 persons per household, with single female/mother households (137 | 5.4%) accounting for the largest median household size of 3.99 persons per household. non-family households (627 | 24.6%) represent the smallest median household size with 1.31 persons per household.
| Household Type | # Households | Household Size |
| Married-Couple | 1,721 (67.5%) | 2.77 |
| Single Male/Father | 66 (2.6%) | 2.70 |
| Single Female/Mother | 137 (5.4%) | 3.99 |
| Non-family | 627 (24.6%) | 1.31 |
| Total Households | 2,551 (100.0%) | 2.47 |
Household Size by Marriage Status in Lake Fenton
Out of a total of 2,551 households in Lake Fenton, 1,924 (75.4%) are family households, while 627 (24.6%) are nonfamily households. The most numerous type of family households are 2-person households, comprising 1,046, and the most common type of nonfamily households are 1-person households, comprising 431.
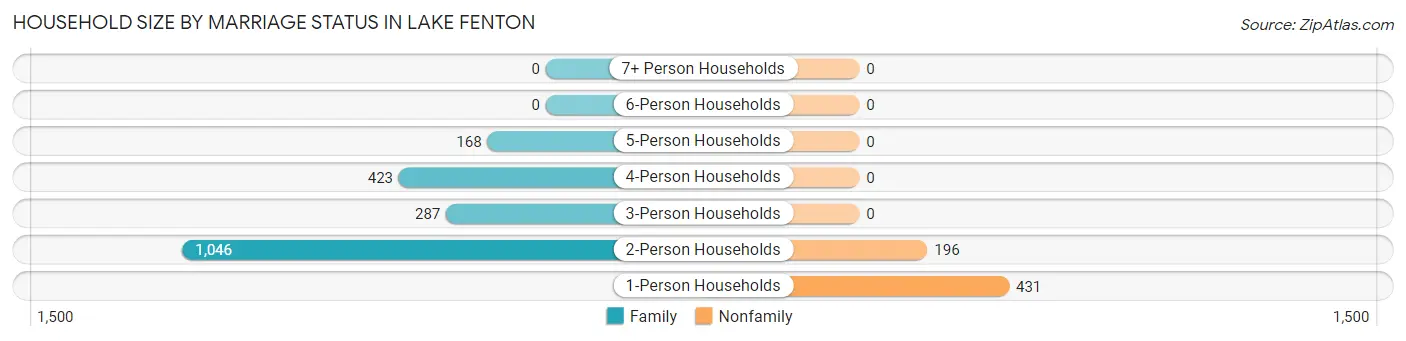
| Household Size | Family Households | Nonfamily Households |
| 1-Person Households | - | 431 (16.9%) |
| 2-Person Households | 1,046 (41.0%) | 196 (7.7%) |
| 3-Person Households | 287 (11.3%) | 0 (0.0%) |
| 4-Person Households | 423 (16.6%) | 0 (0.0%) |
| 5-Person Households | 168 (6.6%) | 0 (0.0%) |
| 6-Person Households | 0 (0.0%) | 0 (0.0%) |
| 7+ Person Households | 0 (0.0%) | 0 (0.0%) |
| Total | 1,924 (75.4%) | 627 (24.6%) |
Female Fertility in Lake Fenton
Fertility by Age in Lake Fenton
Average fertility rate in Lake Fenton is 9.0 births per 1,000 women. Women in the age bracket of 20 to 34 years have the highest fertility rate with 28.0 births per 1,000 women. Women in the age bracket of 20 to 34 years acount for 100.0% of all women with births.
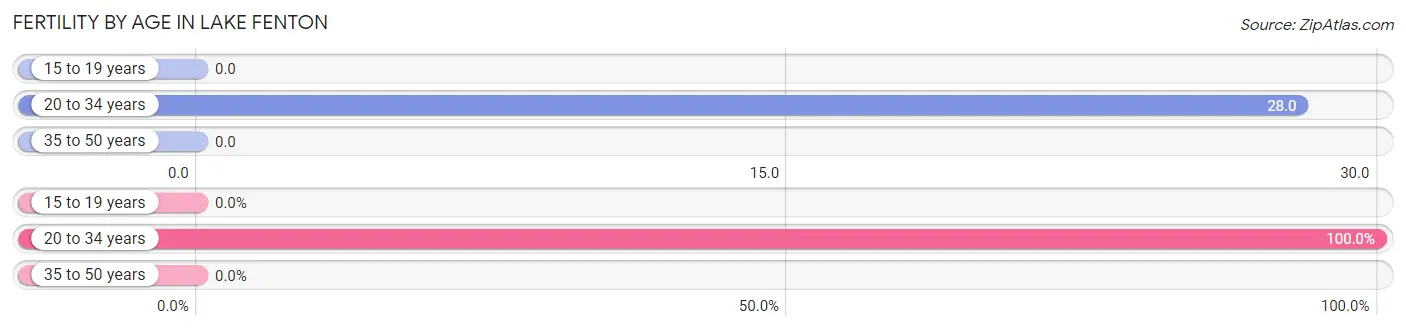
| Age Bracket | Women with Births | Births / 1,000 Women |
| 15 to 19 years | 0 (0.0%) | 0.0 |
| 20 to 34 years | 10 (100.0%) | 28.0 |
| 35 to 50 years | 0 (0.0%) | 0.0 |
| Total | 10 (100.0%) | 9.0 |
Fertility by Age by Marriage Status in Lake Fenton
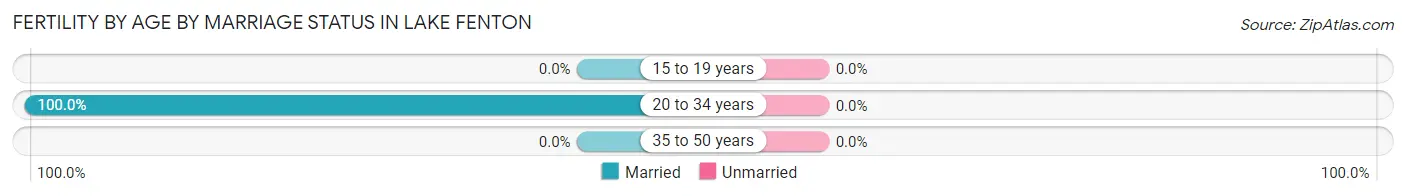
| Age Bracket | Married | Unmarried |
| 15 to 19 years | 0 (0.0%) | 0 (0.0%) |
| 20 to 34 years | 10 (100.0%) | 0 (0.0%) |
| 35 to 50 years | 0 (0.0%) | 0 (0.0%) |
| Total | 10 (100.0%) | 0 (0.0%) |
Fertility by Education in Lake Fenton
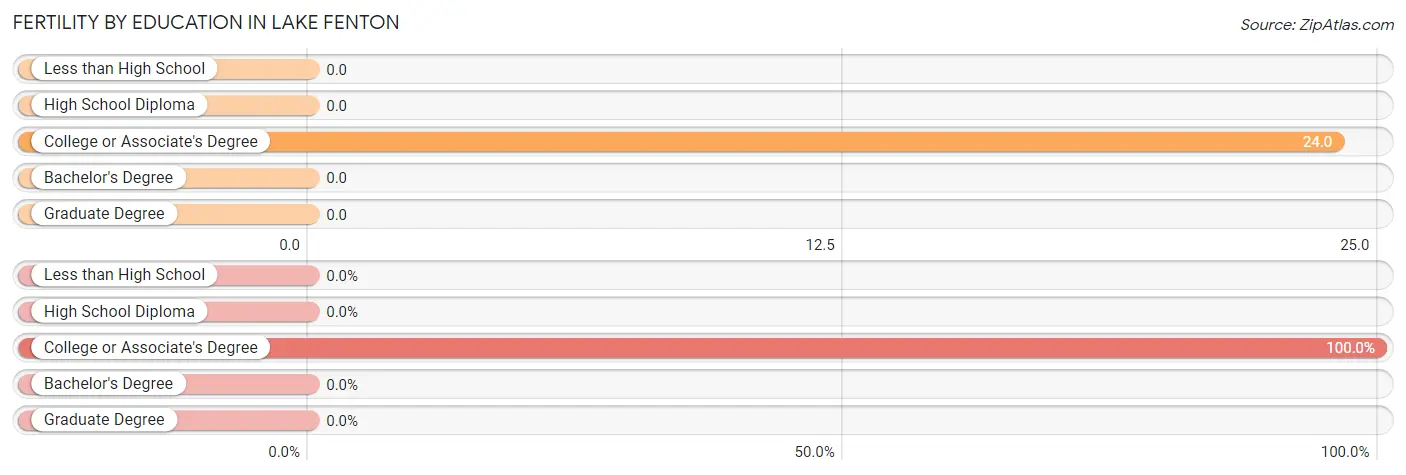
| Educational Attainment | Women with Births | Births / 1,000 Women |
| Less than High School | 0 (0.0%) | 0.0 |
| High School Diploma | 0 (0.0%) | 0.0 |
| College or Associate's Degree | 10 (100.0%) | 24.0 |
| Bachelor's Degree | 0 (0.0%) | 0.0 |
| Graduate Degree | 0 (0.0%) | 0.0 |
| Total | 10 (100.0%) | 9.0 |
Fertility by Education by Marriage Status in Lake Fenton
| Educational Attainment | Married | Unmarried |
| Less than High School | 0 (0.0%) | 0 (0.0%) |
| High School Diploma | 0 (0.0%) | 0 (0.0%) |
| College or Associate's Degree | 10 (100.0%) | 0 (0.0%) |
| Bachelor's Degree | 0 (0.0%) | 0 (0.0%) |
| Graduate Degree | 0 (0.0%) | 0 (0.0%) |
| Total | 10 (100.0%) | 0 (0.0%) |
Employment Characteristics in Lake Fenton
Employment by Class of Employer in Lake Fenton
Among the 2,398 employed individuals in Lake Fenton, private company employees (1,610 | 67.1%), not-for-profit organizations (242 | 10.1%), and self-employed (incorporated) (145 | 6.0%) make up the most common classes of employment.
| Employer Class | # Employees | % Employees |
| Private Company Employees | 1,610 | 67.1% |
| Self-Employed (Incorporated) | 145 | 6.0% |
| Self-Employed (Not Incorporated) | 131 | 5.5% |
| Not-for-profit Organizations | 242 | 10.1% |
| Local Government Employees | 126 | 5.2% |
| State Government Employees | 57 | 2.4% |
| Federal Government Employees | 81 | 3.4% |
| Unpaid Family Workers | 6 | 0.3% |
| Total | 2,398 | 100.0% |
Employment Status by Age in Lake Fenton
According to the labor force statistics for Lake Fenton, out of the total population over 16 years of age (5,387), 46.8% or 2,521 individuals are in the labor force, with 4.0% or 101 of them unemployed. The age group with the highest labor force participation rate is 20 to 24 years, with 83.6% or 133 individuals in the labor force. Within the labor force, the 65 to 74 years age range has the highest percentage of unemployed individuals, with 10.4% or 11 of them being unemployed.
| Age Bracket | In Labor Force | Unemployed |
| 16 to 19 Years | 114 (34.5%) | 0 (0.0%) |
| 20 to 24 Years | 133 (83.6%) | 9 (6.8%) |
| 25 to 29 Years | 284 (75.7%) | 0 (0.0%) |
| 30 to 34 Years | 152 (66.4%) | 0 (0.0%) |
| 35 to 44 Years | 661 (80.0%) | 20 (3.0%) |
| 45 to 54 Years | 602 (75.0%) | 37 (6.1%) |
| 55 to 59 Years | 229 (43.9%) | 9 (3.9%) |
| 60 to 64 Years | 204 (53.0%) | 14 (6.9%) |
| 65 to 74 Years | 106 (8.7%) | 11 (10.4%) |
| 75 Years and over | 37 (6.8%) | 0 (0.0%) |
| Total | 2,521 (46.8%) | 101 (4.0%) |
Employment Status by Educational Attainment in Lake Fenton
According to labor force statistics for Lake Fenton, 67.9% of individuals (2,132) out of the total population between 25 and 64 years of age (3,140) are in the labor force, with 3.8% or 81 of them being unemployed. The group with the highest labor force participation rate are those with the educational attainment of bachelor's degree or higher, with 86.4% or 1,191 individuals in the labor force. Within the labor force, individuals with high school diploma education have the highest percentage of unemployment, with 11.3% or 41 of them being unemployed.
| Educational Attainment | In Labor Force | Unemployed |
| Less than High School | 23 (10.4%) | 0 (0.0%) |
| High School Diploma | 362 (70.6%) | 58 (11.3%) |
| College / Associate Degree | 557 (54.2%) | 46 (4.5%) |
| Bachelor's Degree or higher | 1,191 (86.4%) | 17 (1.2%) |
| Total | 2,132 (67.9%) | 119 (3.8%) |
Employment Occupations by Sex in Lake Fenton
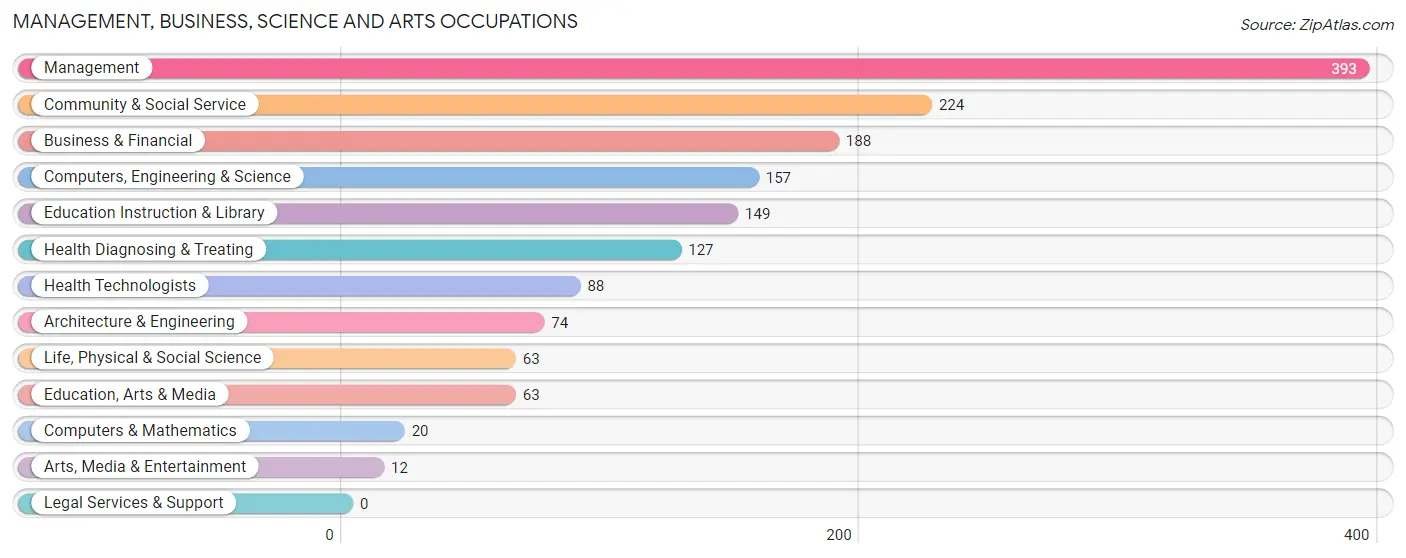
Management, Business, Science and Arts Occupations
The most common Management, Business, Science and Arts occupations in Lake Fenton are Management (393 | 16.2%), Community & Social Service (224 | 9.2%), Business & Financial (188 | 7.8%), Computers, Engineering & Science (157 | 6.5%), and Education Instruction & Library (149 | 6.1%).
Management, Business, Science and Arts Occupations by Sex
Within the Management, Business, Science and Arts occupations in Lake Fenton, the most male-oriented occupations are Computers & Mathematics (100.0%), Architecture & Engineering (100.0%), and Arts, Media & Entertainment (100.0%), while the most female-oriented occupations are Health Diagnosing & Treating (74.8%), Health Technologists (63.6%), and Business & Financial (43.1%).
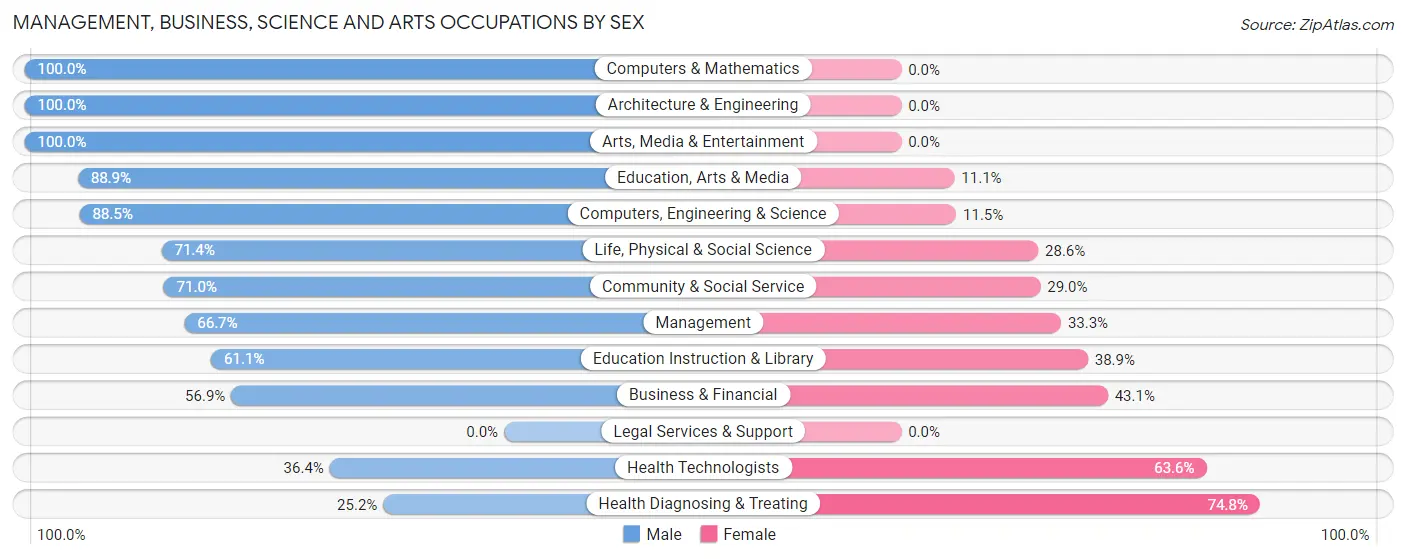
| Occupation | Male | Female |
| Management | 262 (66.7%) | 131 (33.3%) |
| Business & Financial | 107 (56.9%) | 81 (43.1%) |
| Computers, Engineering & Science | 139 (88.5%) | 18 (11.5%) |
| Computers & Mathematics | 20 (100.0%) | 0 (0.0%) |
| Architecture & Engineering | 74 (100.0%) | 0 (0.0%) |
| Life, Physical & Social Science | 45 (71.4%) | 18 (28.6%) |
| Community & Social Service | 159 (71.0%) | 65 (29.0%) |
| Education, Arts & Media | 56 (88.9%) | 7 (11.1%) |
| Legal Services & Support | 0 (0.0%) | 0 (0.0%) |
| Education Instruction & Library | 91 (61.1%) | 58 (38.9%) |
| Arts, Media & Entertainment | 12 (100.0%) | 0 (0.0%) |
| Health Diagnosing & Treating | 32 (25.2%) | 95 (74.8%) |
| Health Technologists | 32 (36.4%) | 56 (63.6%) |
| Total (Category) | 699 (64.2%) | 390 (35.8%) |
| Total (Overall) | 1,290 (53.3%) | 1,132 (46.7%) |
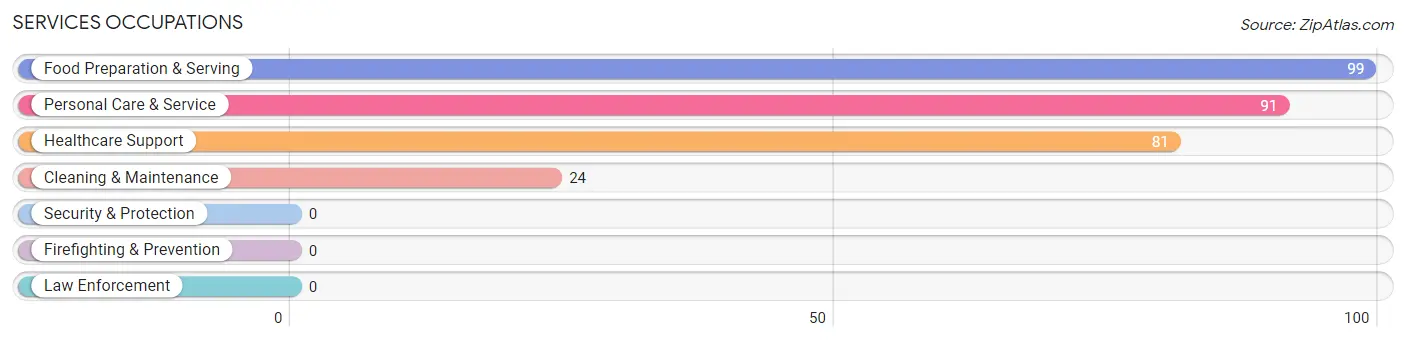
Services Occupations
The most common Services occupations in Lake Fenton are Food Preparation & Serving (99 | 4.1%), Personal Care & Service (91 | 3.8%), Healthcare Support (81 | 3.3%), and Cleaning & Maintenance (24 | 1.0%).
Services Occupations by Sex
Within the Services occupations in Lake Fenton, the most male-oriented occupations are Cleaning & Maintenance (100.0%), Healthcare Support (42.0%), and Food Preparation & Serving (40.4%), while the most female-oriented occupations are Personal Care & Service (100.0%), Food Preparation & Serving (59.6%), and Healthcare Support (58.0%).
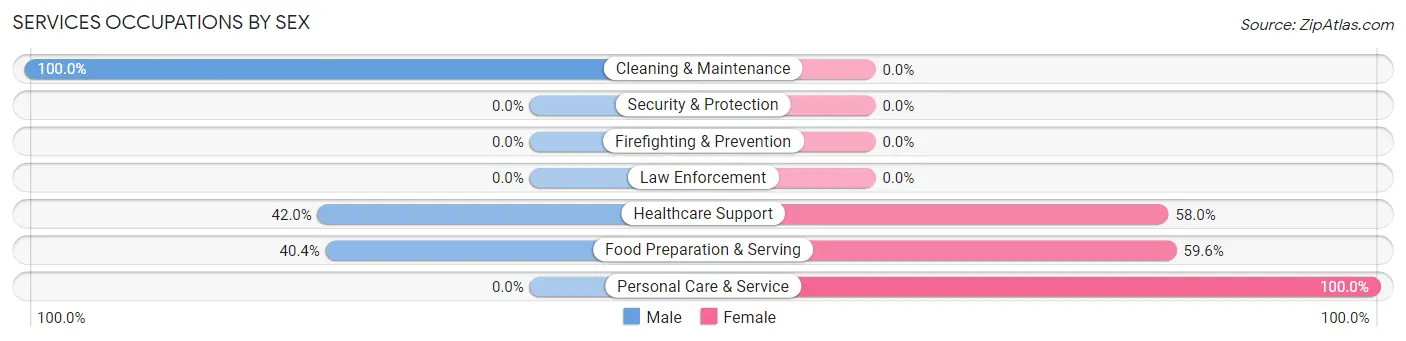
| Occupation | Male | Female |
| Healthcare Support | 34 (42.0%) | 47 (58.0%) |
| Security & Protection | 0 (0.0%) | 0 (0.0%) |
| Firefighting & Prevention | 0 (0.0%) | 0 (0.0%) |
| Law Enforcement | 0 (0.0%) | 0 (0.0%) |
| Food Preparation & Serving | 40 (40.4%) | 59 (59.6%) |
| Cleaning & Maintenance | 24 (100.0%) | 0 (0.0%) |
| Personal Care & Service | 0 (0.0%) | 91 (100.0%) |
| Total (Category) | 98 (33.2%) | 197 (66.8%) |
| Total (Overall) | 1,290 (53.3%) | 1,132 (46.7%) |
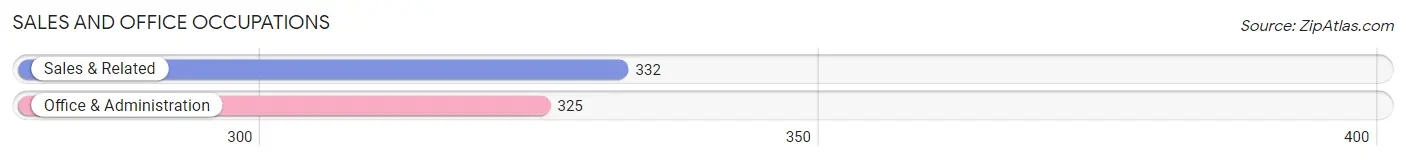
Sales and Office Occupations
The most common Sales and Office occupations in Lake Fenton are Sales & Related (332 | 13.7%), and Office & Administration (325 | 13.4%).
Sales and Office Occupations by Sex
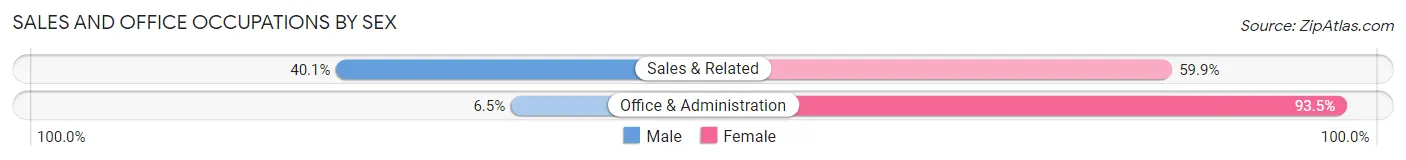
| Occupation | Male | Female |
| Sales & Related | 133 (40.1%) | 199 (59.9%) |
| Office & Administration | 21 (6.5%) | 304 (93.5%) |
| Total (Category) | 154 (23.4%) | 503 (76.6%) |
| Total (Overall) | 1,290 (53.3%) | 1,132 (46.7%) |
Natural Resources, Construction and Maintenance Occupations
The most common Natural Resources, Construction and Maintenance occupations in Lake Fenton are Construction & Extraction (91 | 3.8%), and Installation, Maintenance & Repair (23 | 0.9%).
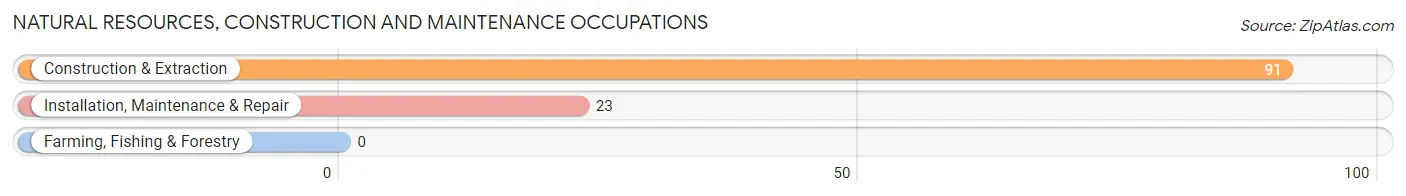
Natural Resources, Construction and Maintenance Occupations by Sex
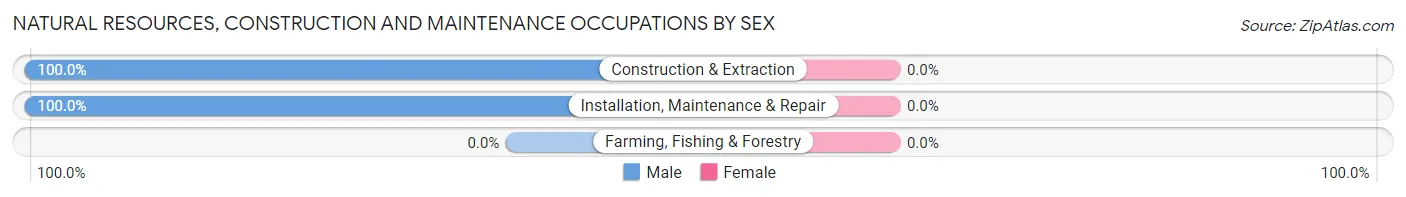
| Occupation | Male | Female |
| Farming, Fishing & Forestry | 0 (0.0%) | 0 (0.0%) |
| Construction & Extraction | 91 (100.0%) | 0 (0.0%) |
| Installation, Maintenance & Repair | 23 (100.0%) | 0 (0.0%) |
| Total (Category) | 114 (100.0%) | 0 (0.0%) |
| Total (Overall) | 1,290 (53.3%) | 1,132 (46.7%) |
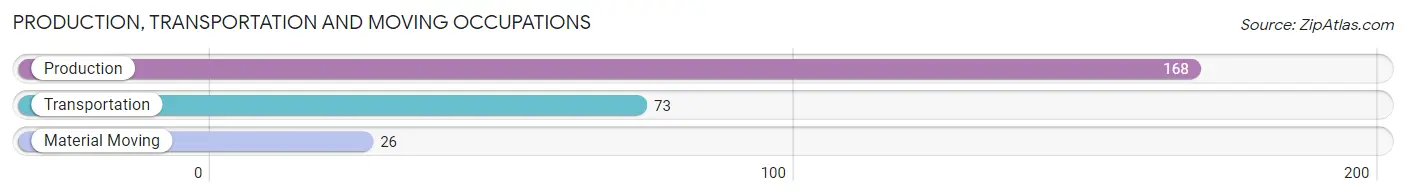
Production, Transportation and Moving Occupations
The most common Production, Transportation and Moving occupations in Lake Fenton are Production (168 | 6.9%), Transportation (73 | 3.0%), and Material Moving (26 | 1.1%).
Production, Transportation and Moving Occupations by Sex
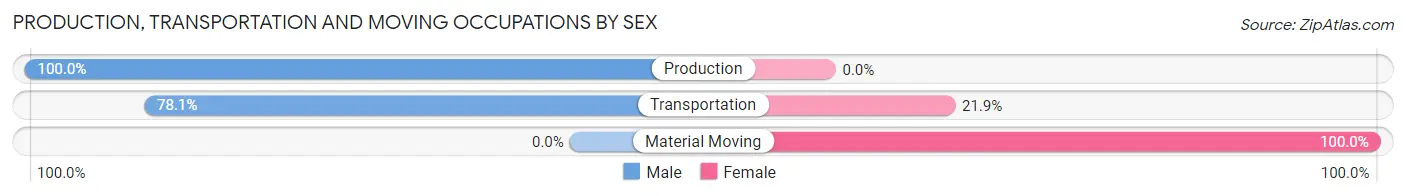
| Occupation | Male | Female |
| Production | 168 (100.0%) | 0 (0.0%) |
| Transportation | 57 (78.1%) | 16 (21.9%) |
| Material Moving | 0 (0.0%) | 26 (100.0%) |
| Total (Category) | 225 (84.3%) | 42 (15.7%) |
| Total (Overall) | 1,290 (53.3%) | 1,132 (46.7%) |
Employment Industries by Sex in Lake Fenton
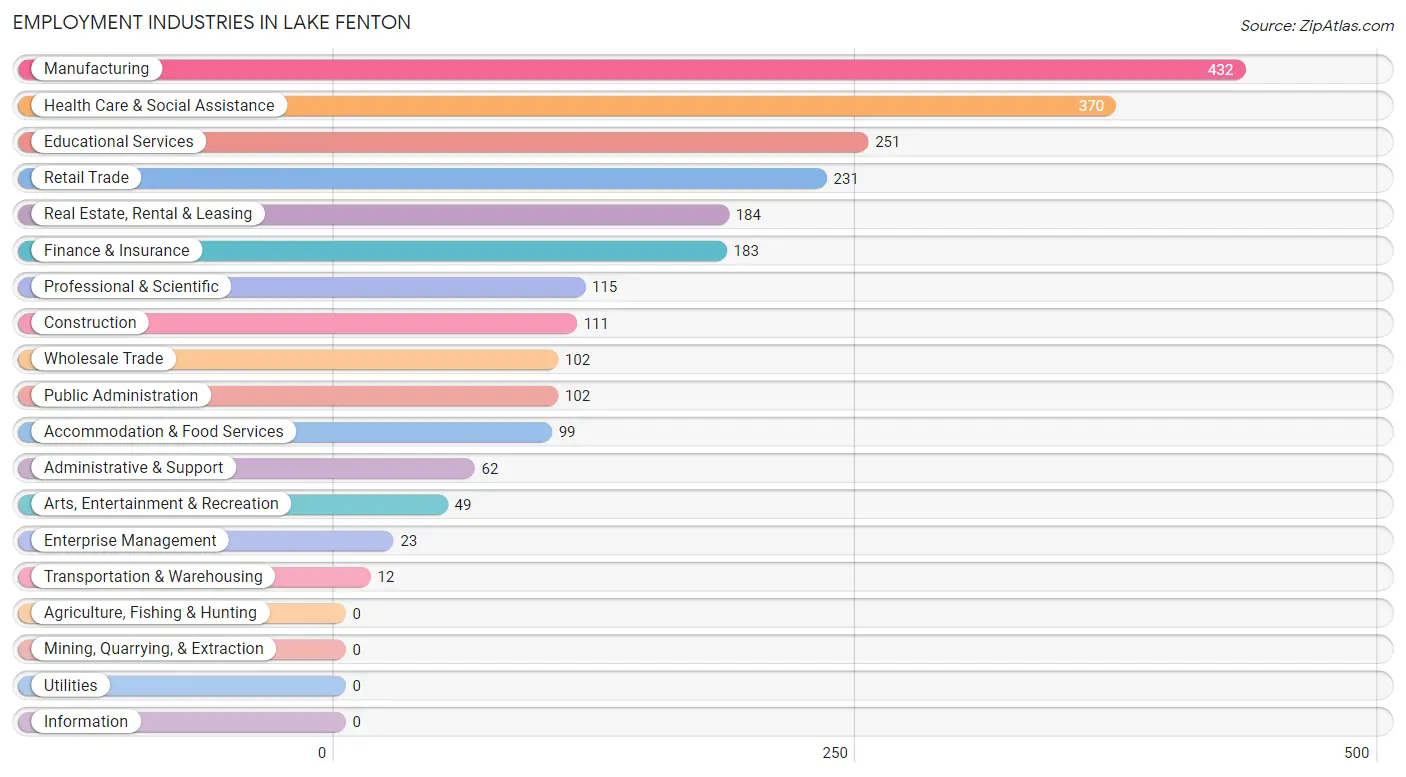
Employment Industries in Lake Fenton
The major employment industries in Lake Fenton include Manufacturing (432 | 17.8%), Health Care & Social Assistance (370 | 15.3%), Educational Services (251 | 10.4%), Retail Trade (231 | 9.5%), and Real Estate, Rental & Leasing (184 | 7.6%).
Employment Industries by Sex in Lake Fenton
The Lake Fenton industries that see more men than women are Construction (100.0%), Transportation & Warehousing (100.0%), and Administrative & Support (100.0%), whereas the industries that tend to have a higher number of women are Enterprise Management (100.0%), Arts, Entertainment & Recreation (100.0%), and Wholesale Trade (83.3%).
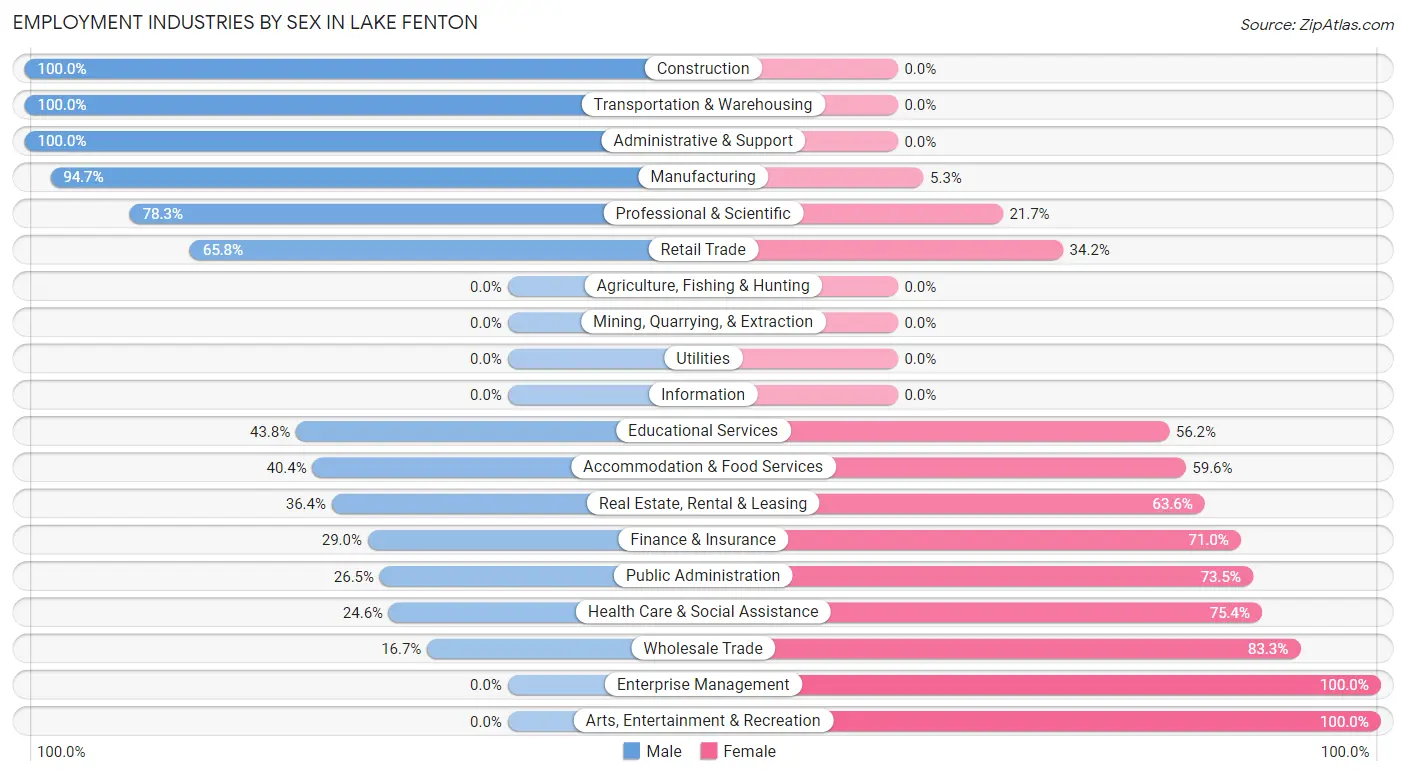
| Industry | Male | Female |
| Agriculture, Fishing & Hunting | 0 (0.0%) | 0 (0.0%) |
| Mining, Quarrying, & Extraction | 0 (0.0%) | 0 (0.0%) |
| Construction | 111 (100.0%) | 0 (0.0%) |
| Manufacturing | 409 (94.7%) | 23 (5.3%) |
| Wholesale Trade | 17 (16.7%) | 85 (83.3%) |
| Retail Trade | 152 (65.8%) | 79 (34.2%) |
| Transportation & Warehousing | 12 (100.0%) | 0 (0.0%) |
| Utilities | 0 (0.0%) | 0 (0.0%) |
| Information | 0 (0.0%) | 0 (0.0%) |
| Finance & Insurance | 53 (29.0%) | 130 (71.0%) |
| Real Estate, Rental & Leasing | 67 (36.4%) | 117 (63.6%) |
| Professional & Scientific | 90 (78.3%) | 25 (21.7%) |
| Enterprise Management | 0 (0.0%) | 23 (100.0%) |
| Administrative & Support | 62 (100.0%) | 0 (0.0%) |
| Educational Services | 110 (43.8%) | 141 (56.2%) |
| Health Care & Social Assistance | 91 (24.6%) | 279 (75.4%) |
| Arts, Entertainment & Recreation | 0 (0.0%) | 49 (100.0%) |
| Accommodation & Food Services | 40 (40.4%) | 59 (59.6%) |
| Public Administration | 27 (26.5%) | 75 (73.5%) |
| Total | 1,290 (53.3%) | 1,132 (46.7%) |
Education in Lake Fenton
School Enrollment in Lake Fenton
The most common levels of schooling among the 1,267 students in Lake Fenton are high school (401 | 31.7%), elementary school (310 | 24.5%), and middle school (237 | 18.7%).
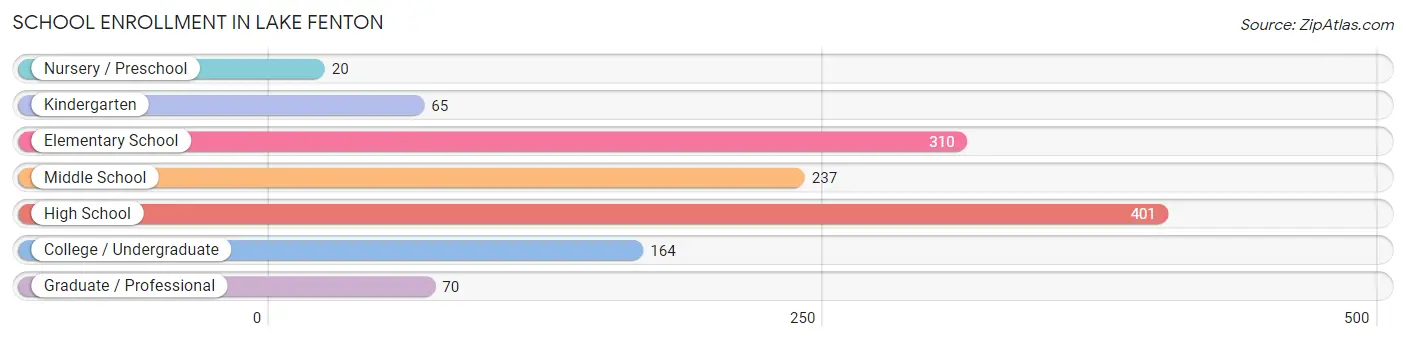
| School Level | # Students | % Students |
| Nursery / Preschool | 20 | 1.6% |
| Kindergarten | 65 | 5.1% |
| Elementary School | 310 | 24.5% |
| Middle School | 237 | 18.7% |
| High School | 401 | 31.7% |
| College / Undergraduate | 164 | 12.9% |
| Graduate / Professional | 70 | 5.5% |
| Total | 1,267 | 100.0% |
School Enrollment by Age by Funding Source in Lake Fenton
Out of a total of 1,267 students who are enrolled in schools in Lake Fenton, 128 (10.1%) attend a private institution, while the remaining 1,139 (89.9%) are enrolled in public schools. The age group of 35 years and over has the highest likelihood of being enrolled in private schools, with 53 (72.6% in the age bracket) enrolled. Conversely, the age group of 3 to 4 year olds has the lowest likelihood of being enrolled in a private school, with 20 (100.0% in the age bracket) attending a public institution.
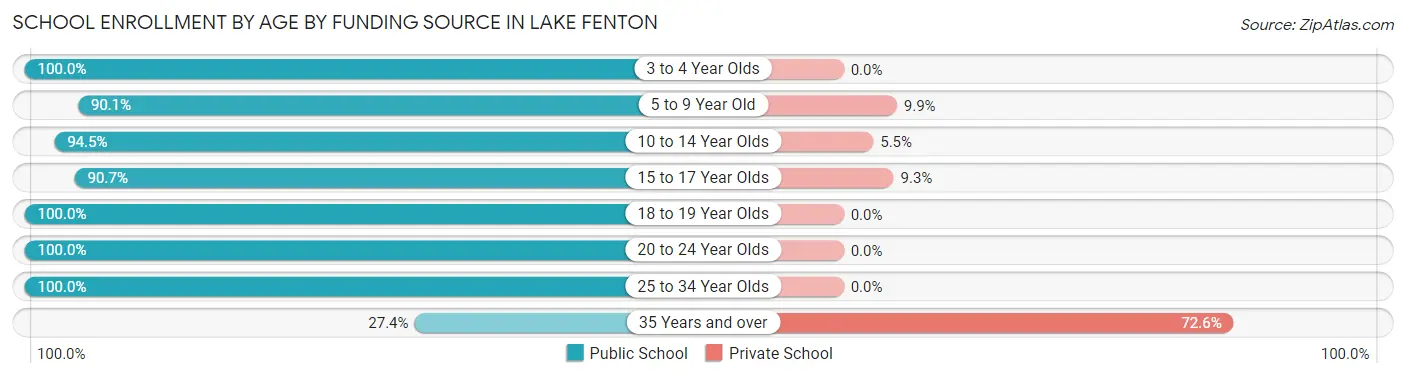
| Age Bracket | Public School | Private School |
| 3 to 4 Year Olds | 20 (100.0%) | 0 (0.0%) |
| 5 to 9 Year Old | 291 (90.1%) | 32 (9.9%) |
| 10 to 14 Year Olds | 325 (94.5%) | 19 (5.5%) |
| 15 to 17 Year Olds | 234 (90.7%) | 24 (9.3%) |
| 18 to 19 Year Olds | 131 (100.0%) | 0 (0.0%) |
| 20 to 24 Year Olds | 65 (100.0%) | 0 (0.0%) |
| 25 to 34 Year Olds | 53 (100.0%) | 0 (0.0%) |
| 35 Years and over | 20 (27.4%) | 53 (72.6%) |
| Total | 1,139 (89.9%) | 128 (10.1%) |
Educational Attainment by Field of Study in Lake Fenton
Business (517 | 21.8%), arts & humanities (460 | 19.4%), engineering (390 | 16.5%), education (280 | 11.8%), and science & technology (170 | 7.2%) are the most common fields of study among 2,369 individuals in Lake Fenton who have obtained a bachelor's degree or higher.
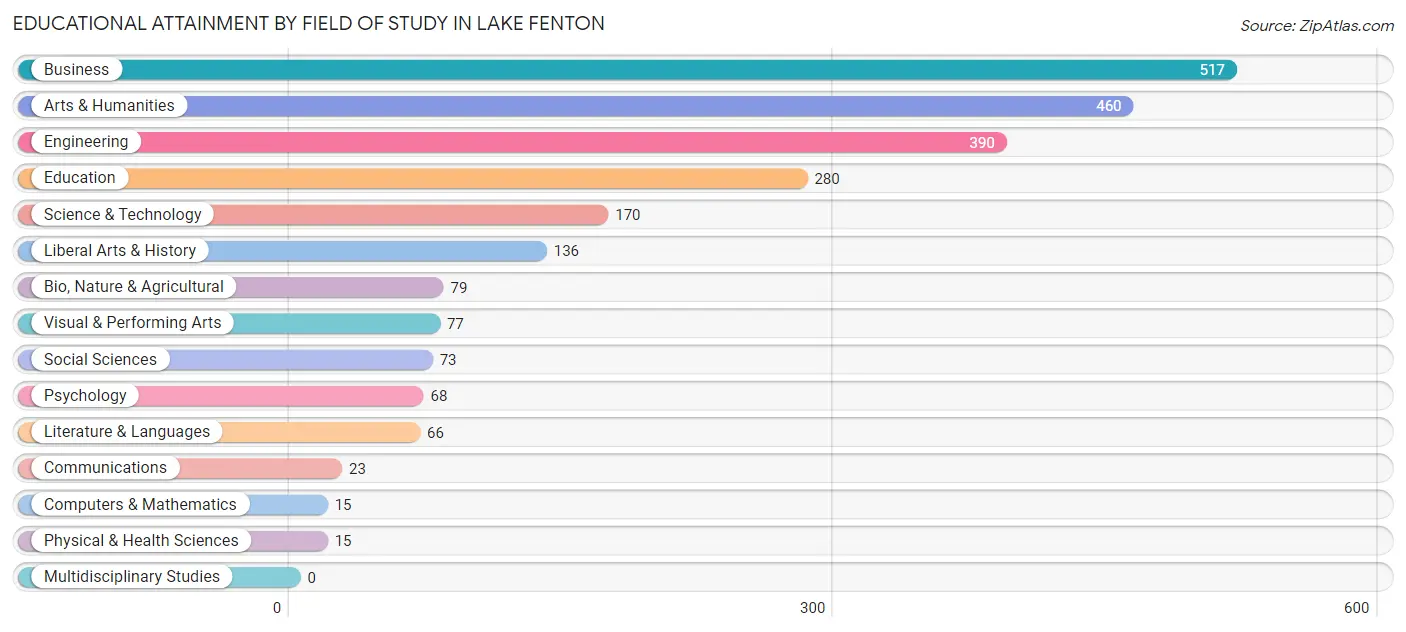
| Field of Study | # Graduates | % Graduates |
| Computers & Mathematics | 15 | 0.6% |
| Bio, Nature & Agricultural | 79 | 3.3% |
| Physical & Health Sciences | 15 | 0.6% |
| Psychology | 68 | 2.9% |
| Social Sciences | 73 | 3.1% |
| Engineering | 390 | 16.5% |
| Multidisciplinary Studies | 0 | 0.0% |
| Science & Technology | 170 | 7.2% |
| Business | 517 | 21.8% |
| Education | 280 | 11.8% |
| Literature & Languages | 66 | 2.8% |
| Liberal Arts & History | 136 | 5.7% |
| Visual & Performing Arts | 77 | 3.3% |
| Communications | 23 | 1.0% |
| Arts & Humanities | 460 | 19.4% |
| Total | 2,369 | 100.0% |
Transportation & Commute in Lake Fenton
Vehicle Availability by Sex in Lake Fenton
The most prevalent vehicle ownership categories in Lake Fenton are males with 2 vehicles (609, accounting for 48.1%) and females with 2 vehicles (387, making up 53.8%).
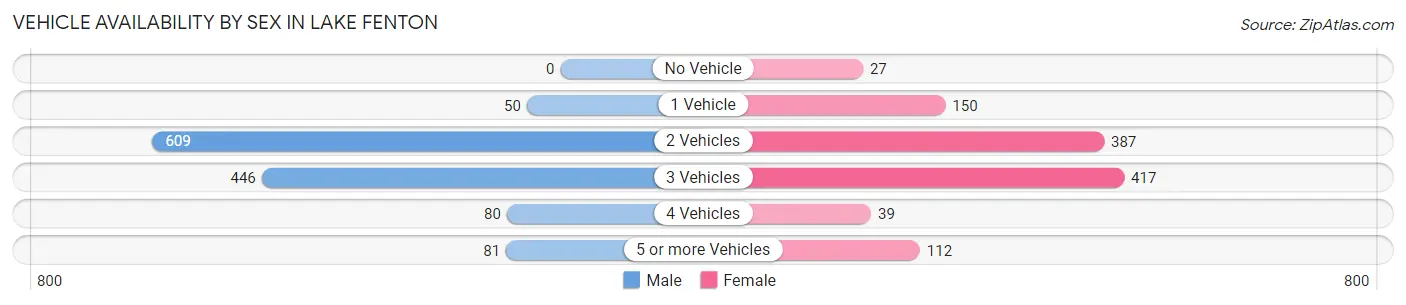
| Vehicles Available | Male | Female |
| No Vehicle | 0 (0.0%) | 27 (2.4%) |
| 1 Vehicle | 50 (4.0%) | 150 (13.3%) |
| 2 Vehicles | 609 (48.1%) | 387 (34.2%) |
| 3 Vehicles | 446 (35.2%) | 417 (36.8%) |
| 4 Vehicles | 80 (6.3%) | 39 (3.5%) |
| 5 or more Vehicles | 81 (6.4%) | 112 (9.9%) |
| Total | 1,266 (100.0%) | 1,132 (100.0%) |
Commute Time in Lake Fenton
The most frequently occuring commute durations in Lake Fenton are 45 to 59 minutes (411 commuters, 18.1%), 15 to 19 minutes (407 commuters, 17.9%), and 20 to 24 minutes (392 commuters, 17.3%).
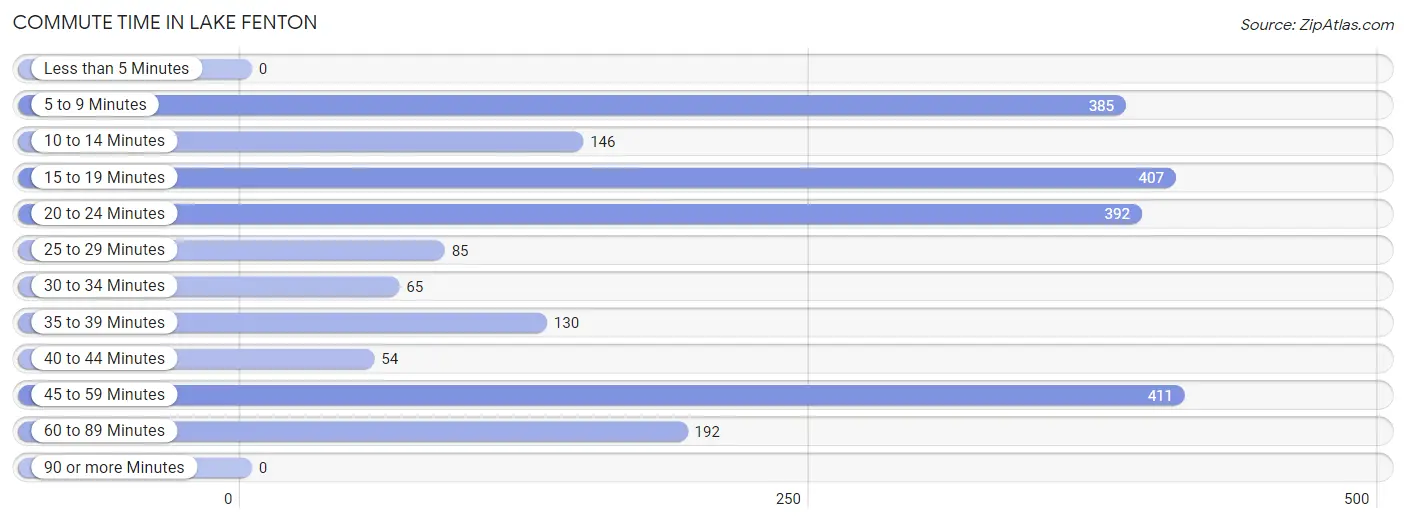
| Commute Time | # Commuters | % Commuters |
| Less than 5 Minutes | 0 | 0.0% |
| 5 to 9 Minutes | 385 | 17.0% |
| 10 to 14 Minutes | 146 | 6.4% |
| 15 to 19 Minutes | 407 | 17.9% |
| 20 to 24 Minutes | 392 | 17.3% |
| 25 to 29 Minutes | 85 | 3.7% |
| 30 to 34 Minutes | 65 | 2.9% |
| 35 to 39 Minutes | 130 | 5.7% |
| 40 to 44 Minutes | 54 | 2.4% |
| 45 to 59 Minutes | 411 | 18.1% |
| 60 to 89 Minutes | 192 | 8.5% |
| 90 or more Minutes | 0 | 0.0% |
Commute Time by Sex in Lake Fenton
The most common commute times in Lake Fenton are 45 to 59 minutes (325 commuters, 27.4%) for males and 15 to 19 minutes (230 commuters, 21.3%) for females.
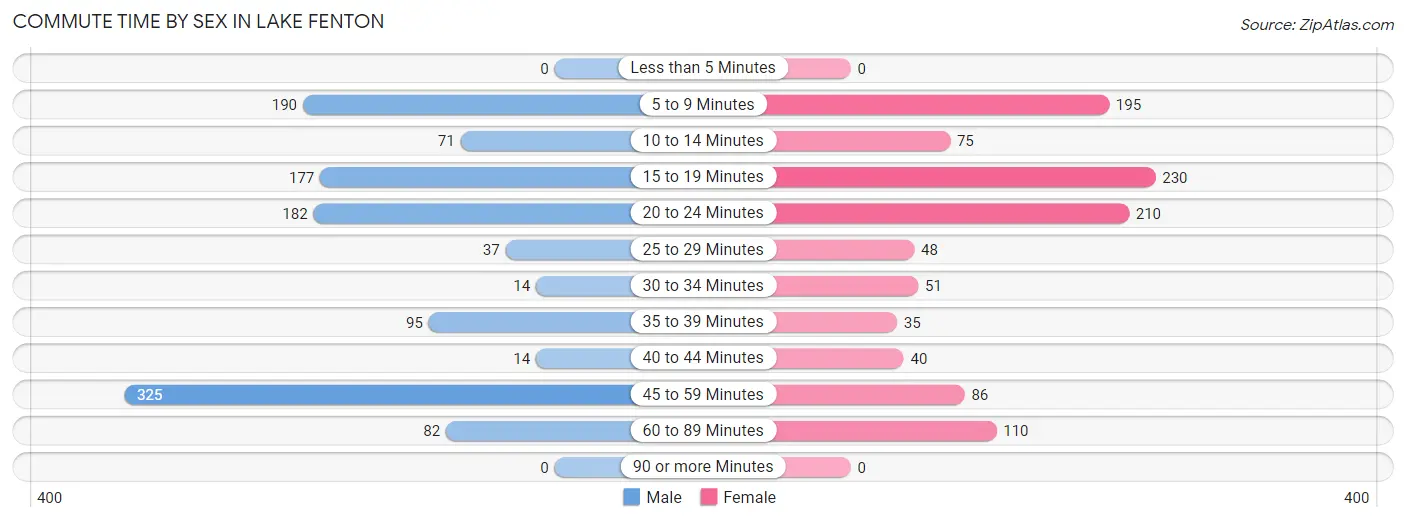
| Commute Time | Male | Female |
| Less than 5 Minutes | 0 (0.0%) | 0 (0.0%) |
| 5 to 9 Minutes | 190 (16.0%) | 195 (18.1%) |
| 10 to 14 Minutes | 71 (6.0%) | 75 (6.9%) |
| 15 to 19 Minutes | 177 (14.9%) | 230 (21.3%) |
| 20 to 24 Minutes | 182 (15.3%) | 210 (19.4%) |
| 25 to 29 Minutes | 37 (3.1%) | 48 (4.4%) |
| 30 to 34 Minutes | 14 (1.2%) | 51 (4.7%) |
| 35 to 39 Minutes | 95 (8.0%) | 35 (3.2%) |
| 40 to 44 Minutes | 14 (1.2%) | 40 (3.7%) |
| 45 to 59 Minutes | 325 (27.4%) | 86 (8.0%) |
| 60 to 89 Minutes | 82 (6.9%) | 110 (10.2%) |
| 90 or more Minutes | 0 (0.0%) | 0 (0.0%) |
Time of Departure to Work by Sex in Lake Fenton
The most frequent times of departure to work in Lake Fenton are 8:00 AM to 8:29 AM (321, 27.0%) for males and 9:00 AM to 9:59 AM (195, 18.1%) for females.
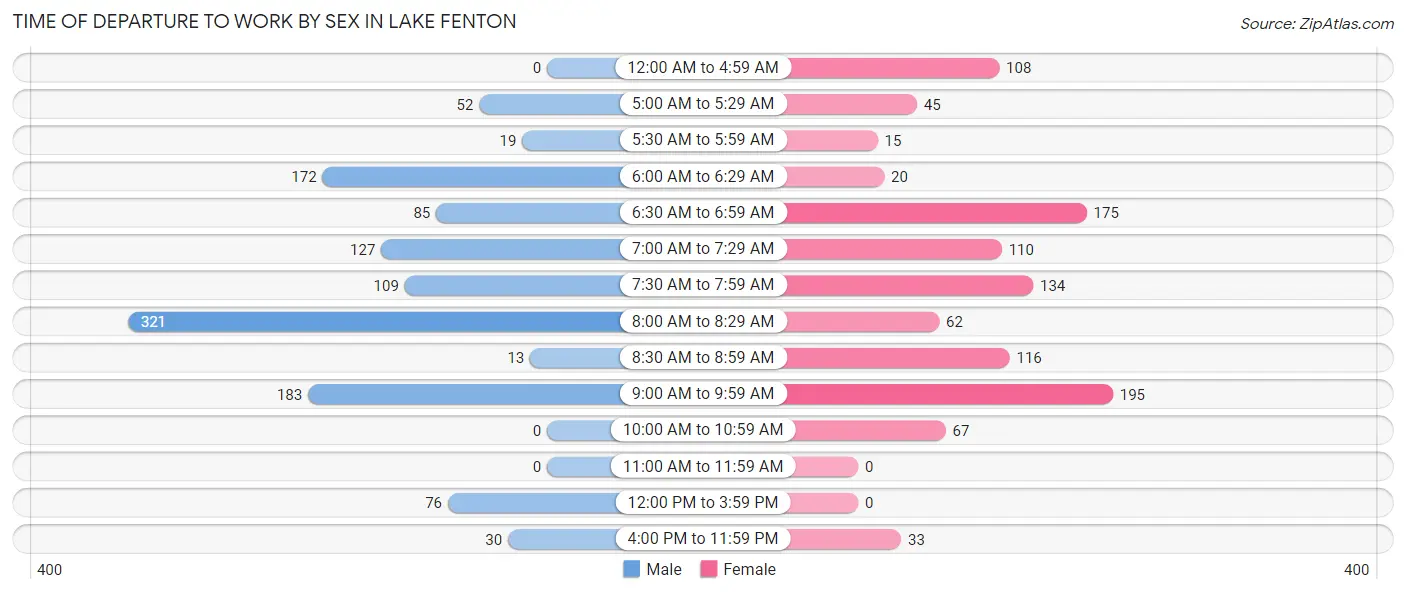
| Time of Departure | Male | Female |
| 12:00 AM to 4:59 AM | 0 (0.0%) | 108 (10.0%) |
| 5:00 AM to 5:29 AM | 52 (4.4%) | 45 (4.2%) |
| 5:30 AM to 5:59 AM | 19 (1.6%) | 15 (1.4%) |
| 6:00 AM to 6:29 AM | 172 (14.5%) | 20 (1.8%) |
| 6:30 AM to 6:59 AM | 85 (7.2%) | 175 (16.2%) |
| 7:00 AM to 7:29 AM | 127 (10.7%) | 110 (10.2%) |
| 7:30 AM to 7:59 AM | 109 (9.2%) | 134 (12.4%) |
| 8:00 AM to 8:29 AM | 321 (27.0%) | 62 (5.7%) |
| 8:30 AM to 8:59 AM | 13 (1.1%) | 116 (10.7%) |
| 9:00 AM to 9:59 AM | 183 (15.4%) | 195 (18.1%) |
| 10:00 AM to 10:59 AM | 0 (0.0%) | 67 (6.2%) |
| 11:00 AM to 11:59 AM | 0 (0.0%) | 0 (0.0%) |
| 12:00 PM to 3:59 PM | 76 (6.4%) | 0 (0.0%) |
| 4:00 PM to 11:59 PM | 30 (2.5%) | 33 (3.1%) |
| Total | 1,187 (100.0%) | 1,080 (100.0%) |
Housing Occupancy in Lake Fenton
Occupancy by Ownership in Lake Fenton
Of the total 2,551 dwellings in Lake Fenton, owner-occupied units account for 2,317 (90.8%), while renter-occupied units make up 234 (9.2%).
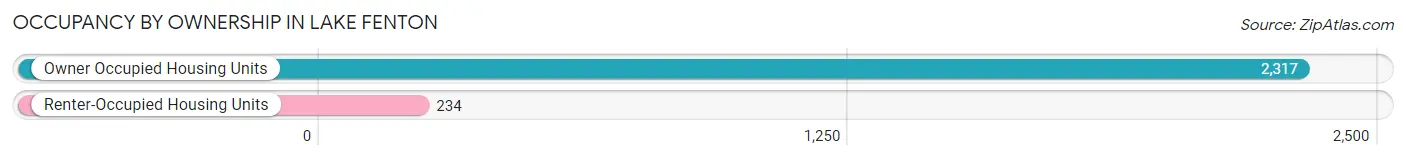
| Occupancy | # Housing Units | % Housing Units |
| Owner Occupied Housing Units | 2,317 | 90.8% |
| Renter-Occupied Housing Units | 234 | 9.2% |
| Total Occupied Housing Units | 2,551 | 100.0% |
Occupancy by Household Size in Lake Fenton
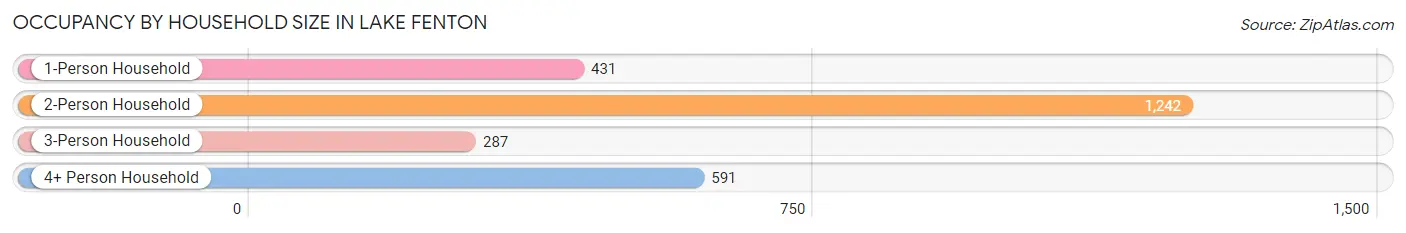
| Household Size | # Housing Units | % Housing Units |
| 1-Person Household | 431 | 16.9% |
| 2-Person Household | 1,242 | 48.7% |
| 3-Person Household | 287 | 11.3% |
| 4+ Person Household | 591 | 23.2% |
| Total Housing Units | 2,551 | 100.0% |
Occupancy by Ownership by Household Size in Lake Fenton
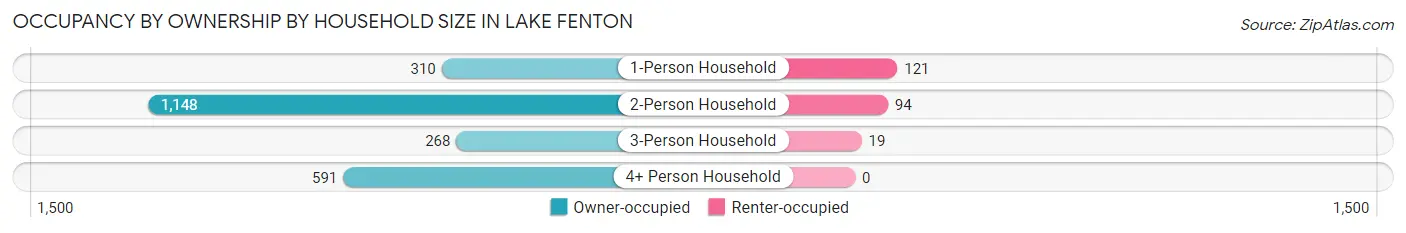
| Household Size | Owner-occupied | Renter-occupied |
| 1-Person Household | 310 (71.9%) | 121 (28.1%) |
| 2-Person Household | 1,148 (92.4%) | 94 (7.6%) |
| 3-Person Household | 268 (93.4%) | 19 (6.6%) |
| 4+ Person Household | 591 (100.0%) | 0 (0.0%) |
| Total Housing Units | 2,317 (90.8%) | 234 (9.2%) |
Occupancy by Educational Attainment in Lake Fenton
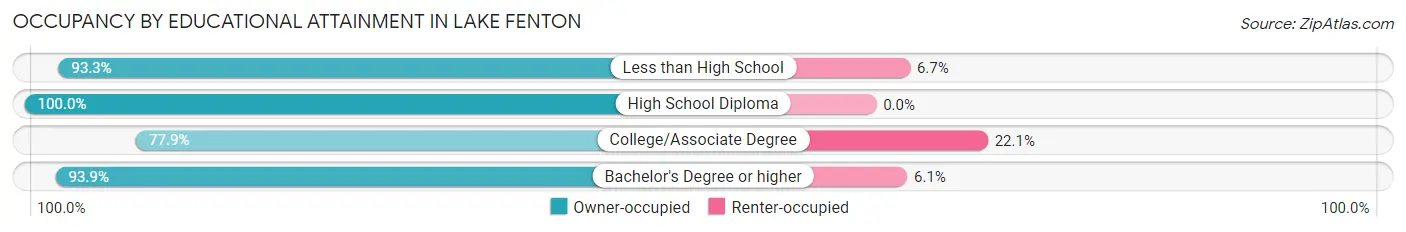
| Household Size | Owner-occupied | Renter-occupied |
| Less than High School | 167 (93.3%) | 12 (6.7%) |
| High School Diploma | 378 (100.0%) | 0 (0.0%) |
| College/Associate Degree | 486 (77.9%) | 138 (22.1%) |
| Bachelor's Degree or higher | 1,286 (93.9%) | 84 (6.1%) |
Occupancy by Age of Householder in Lake Fenton
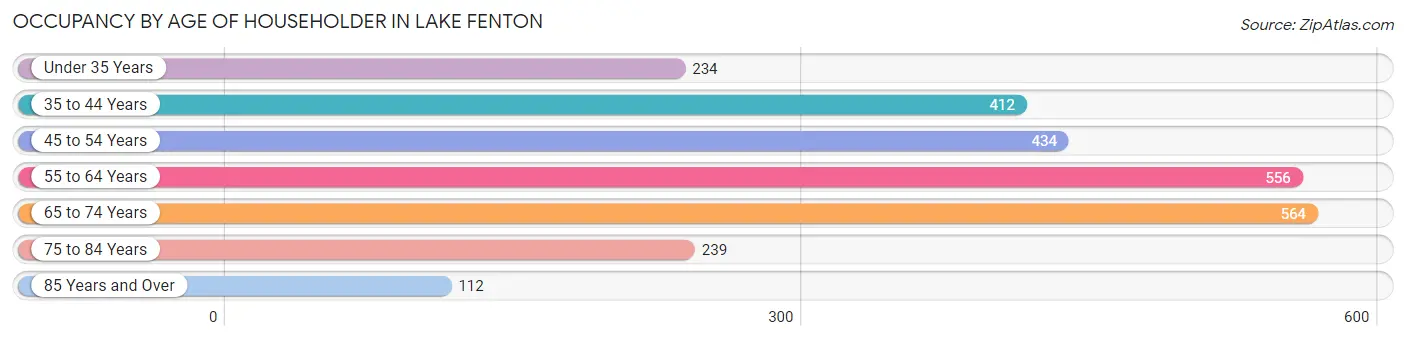
| Age Bracket | # Households | % Households |
| Under 35 Years | 234 | 9.2% |
| 35 to 44 Years | 412 | 16.2% |
| 45 to 54 Years | 434 | 17.0% |
| 55 to 64 Years | 556 | 21.8% |
| 65 to 74 Years | 564 | 22.1% |
| 75 to 84 Years | 239 | 9.4% |
| 85 Years and Over | 112 | 4.4% |
| Total | 2,551 | 100.0% |
Housing Finances in Lake Fenton
Median Income by Occupancy in Lake Fenton
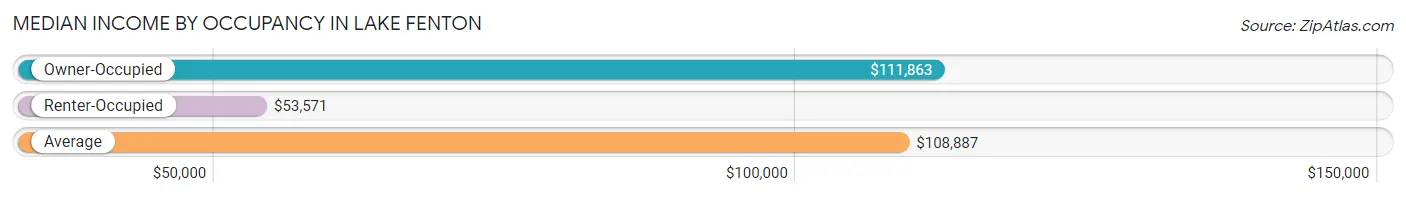
| Occupancy Type | # Households | Median Income |
| Owner-Occupied | 2,317 (90.8%) | $111,863 |
| Renter-Occupied | 234 (9.2%) | $53,571 |
| Average | 2,551 (100.0%) | $108,887 |
Occupancy by Householder Income Bracket in Lake Fenton
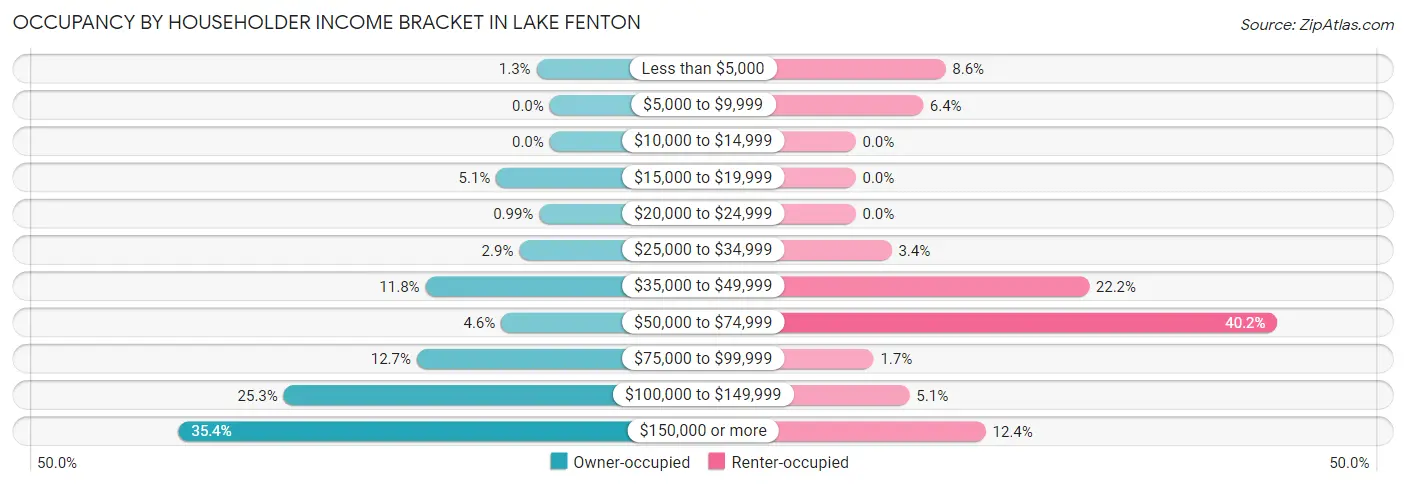
| Income Bracket | Owner-occupied | Renter-occupied |
| Less than $5,000 | 29 (1.3%) | 20 (8.6%) |
| $5,000 to $9,999 | 0 (0.0%) | 15 (6.4%) |
| $10,000 to $14,999 | 0 (0.0%) | 0 (0.0%) |
| $15,000 to $19,999 | 118 (5.1%) | 0 (0.0%) |
| $20,000 to $24,999 | 23 (1.0%) | 0 (0.0%) |
| $25,000 to $34,999 | 67 (2.9%) | 8 (3.4%) |
| $35,000 to $49,999 | 274 (11.8%) | 52 (22.2%) |
| $50,000 to $74,999 | 107 (4.6%) | 94 (40.2%) |
| $75,000 to $99,999 | 293 (12.7%) | 4 (1.7%) |
| $100,000 to $149,999 | 587 (25.3%) | 12 (5.1%) |
| $150,000 or more | 819 (35.3%) | 29 (12.4%) |
| Total | 2,317 (100.0%) | 234 (100.0%) |
Monthly Housing Cost Tiers in Lake Fenton
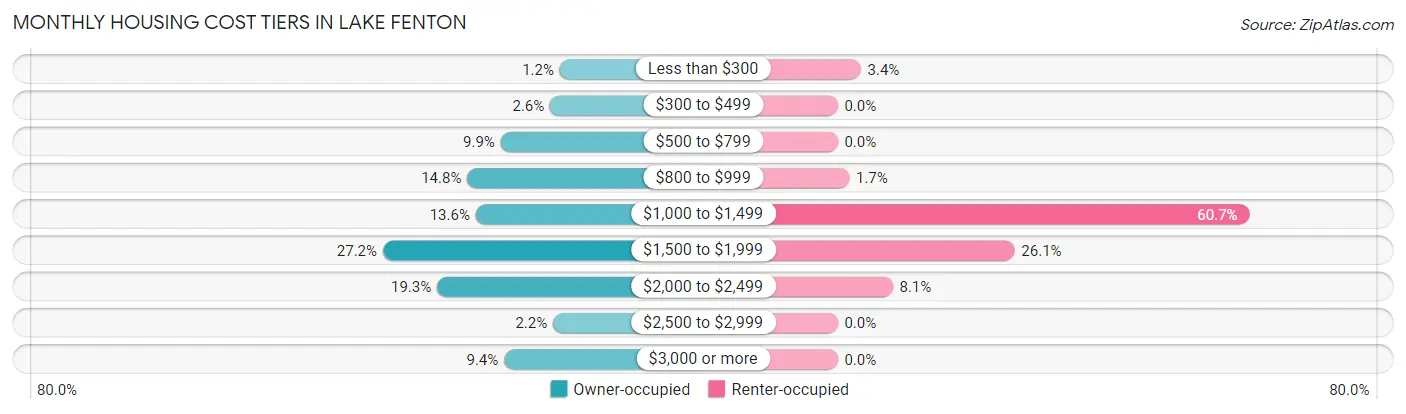
| Monthly Cost | Owner-occupied | Renter-occupied |
| Less than $300 | 27 (1.2%) | 8 (3.4%) |
| $300 to $499 | 60 (2.6%) | 0 (0.0%) |
| $500 to $799 | 229 (9.9%) | 0 (0.0%) |
| $800 to $999 | 343 (14.8%) | 4 (1.7%) |
| $1,000 to $1,499 | 314 (13.6%) | 142 (60.7%) |
| $1,500 to $1,999 | 631 (27.2%) | 61 (26.1%) |
| $2,000 to $2,499 | 446 (19.3%) | 19 (8.1%) |
| $2,500 to $2,999 | 50 (2.2%) | 0 (0.0%) |
| $3,000 or more | 217 (9.4%) | 0 (0.0%) |
| Total | 2,317 (100.0%) | 234 (100.0%) |
Physical Housing Characteristics in Lake Fenton
Housing Structures in Lake Fenton
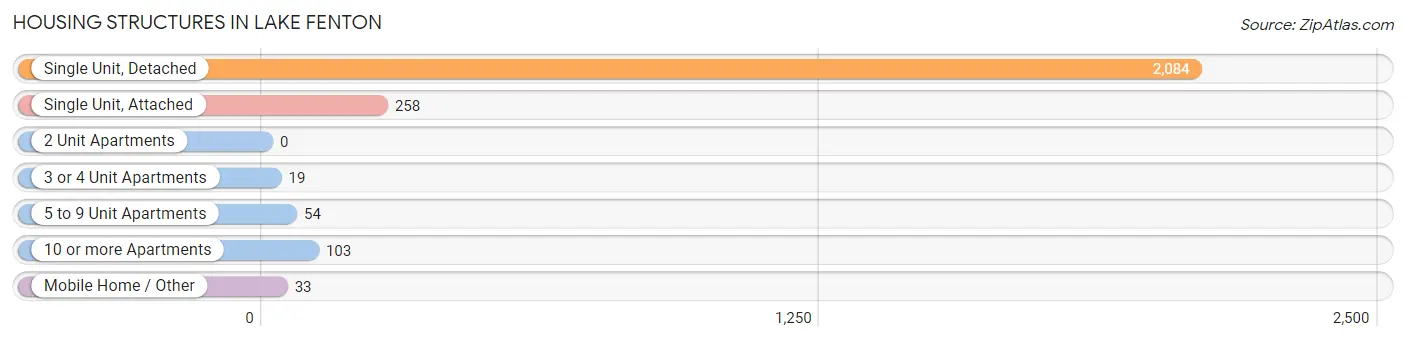
| Structure Type | # Housing Units | % Housing Units |
| Single Unit, Detached | 2,084 | 81.7% |
| Single Unit, Attached | 258 | 10.1% |
| 2 Unit Apartments | 0 | 0.0% |
| 3 or 4 Unit Apartments | 19 | 0.7% |
| 5 to 9 Unit Apartments | 54 | 2.1% |
| 10 or more Apartments | 103 | 4.0% |
| Mobile Home / Other | 33 | 1.3% |
| Total | 2,551 | 100.0% |
Housing Structures by Occupancy in Lake Fenton
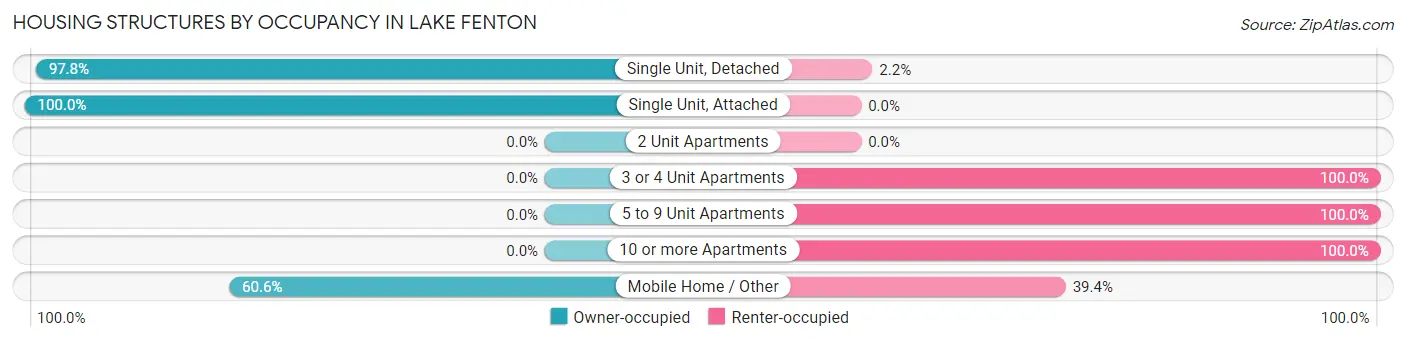
| Structure Type | Owner-occupied | Renter-occupied |
| Single Unit, Detached | 2,039 (97.8%) | 45 (2.2%) |
| Single Unit, Attached | 258 (100.0%) | 0 (0.0%) |
| 2 Unit Apartments | 0 (0.0%) | 0 (0.0%) |
| 3 or 4 Unit Apartments | 0 (0.0%) | 19 (100.0%) |
| 5 to 9 Unit Apartments | 0 (0.0%) | 54 (100.0%) |
| 10 or more Apartments | 0 (0.0%) | 103 (100.0%) |
| Mobile Home / Other | 20 (60.6%) | 13 (39.4%) |
| Total | 2,317 (90.8%) | 234 (9.2%) |
Housing Structures by Number of Rooms in Lake Fenton
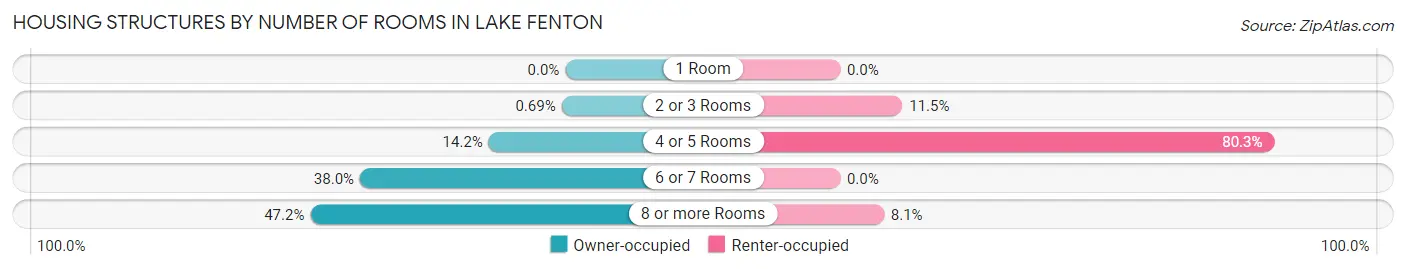
| Number of Rooms | Owner-occupied | Renter-occupied |
| 1 Room | 0 (0.0%) | 0 (0.0%) |
| 2 or 3 Rooms | 16 (0.7%) | 27 (11.5%) |
| 4 or 5 Rooms | 328 (14.2%) | 188 (80.3%) |
| 6 or 7 Rooms | 880 (38.0%) | 0 (0.0%) |
| 8 or more Rooms | 1,093 (47.2%) | 19 (8.1%) |
| Total | 2,317 (100.0%) | 234 (100.0%) |
Housing Structure by Heating Type in Lake Fenton
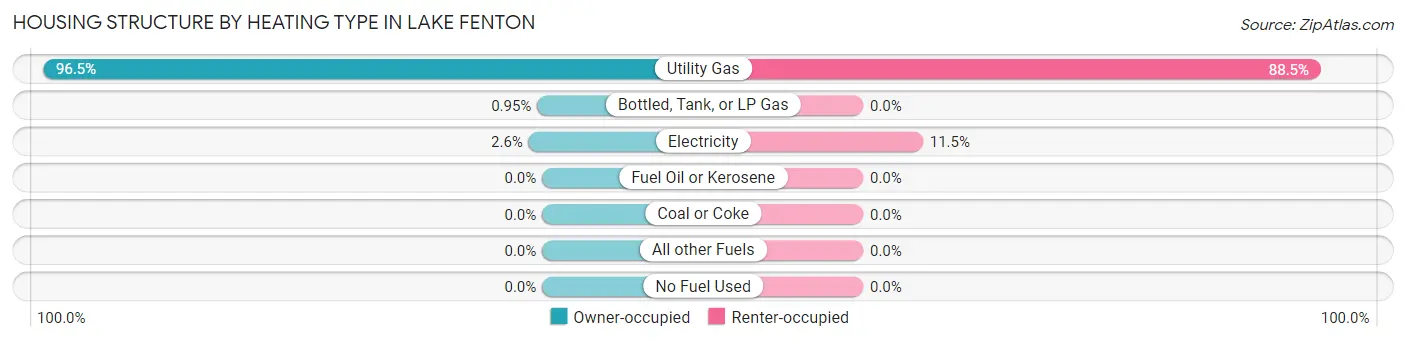
| Heating Type | Owner-occupied | Renter-occupied |
| Utility Gas | 2,235 (96.5%) | 207 (88.5%) |
| Bottled, Tank, or LP Gas | 22 (0.9%) | 0 (0.0%) |
| Electricity | 60 (2.6%) | 27 (11.5%) |
| Fuel Oil or Kerosene | 0 (0.0%) | 0 (0.0%) |
| Coal or Coke | 0 (0.0%) | 0 (0.0%) |
| All other Fuels | 0 (0.0%) | 0 (0.0%) |
| No Fuel Used | 0 (0.0%) | 0 (0.0%) |
| Total | 2,317 (100.0%) | 234 (100.0%) |
Household Vehicle Usage in Lake Fenton
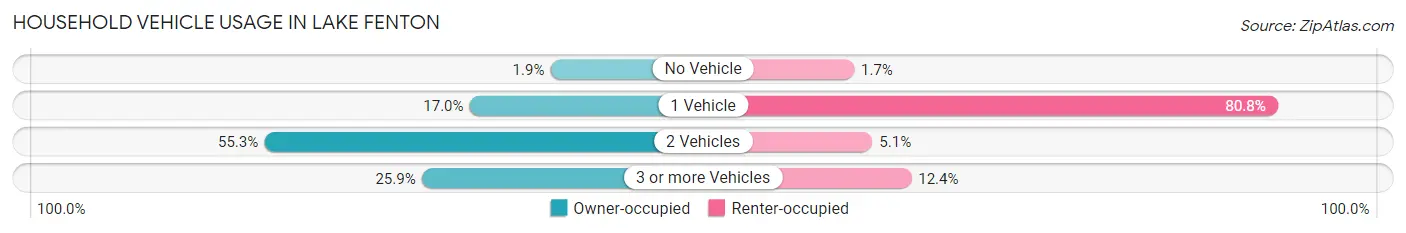
| Vehicles per Household | Owner-occupied | Renter-occupied |
| No Vehicle | 43 (1.9%) | 4 (1.7%) |
| 1 Vehicle | 393 (17.0%) | 189 (80.8%) |
| 2 Vehicles | 1,281 (55.3%) | 12 (5.1%) |
| 3 or more Vehicles | 600 (25.9%) | 29 (12.4%) |
| Total | 2,317 (100.0%) | 234 (100.0%) |
Real Estate & Mortgages in Lake Fenton
Real Estate and Mortgage Overview in Lake Fenton
| Characteristic | Without Mortgage | With Mortgage |
| Housing Units | 980 | 1,337 |
| Median Property Value | $344,900 | $326,000 |
| Median Household Income | $129,000 | $389 |
| Monthly Housing Costs | $928 | $211 |
| Real Estate Taxes | $4,453 | $0 |
Property Value by Mortgage Status in Lake Fenton
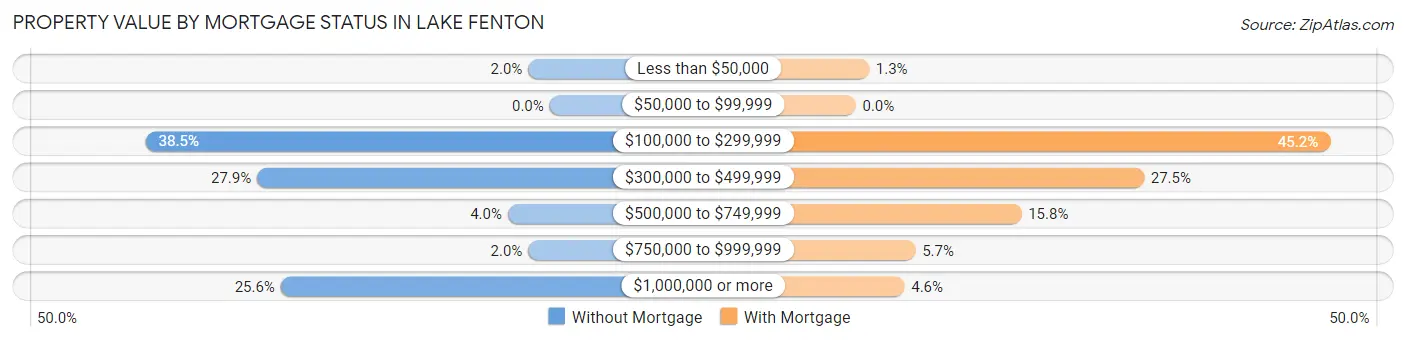
| Property Value | Without Mortgage | With Mortgage |
| Less than $50,000 | 20 (2.0%) | 17 (1.3%) |
| $50,000 to $99,999 | 0 (0.0%) | 0 (0.0%) |
| $100,000 to $299,999 | 377 (38.5%) | 604 (45.2%) |
| $300,000 to $499,999 | 273 (27.9%) | 367 (27.5%) |
| $500,000 to $749,999 | 39 (4.0%) | 211 (15.8%) |
| $750,000 to $999,999 | 20 (2.0%) | 76 (5.7%) |
| $1,000,000 or more | 251 (25.6%) | 62 (4.6%) |
| Total | 980 (100.0%) | 1,337 (100.0%) |
Household Income by Mortgage Status in Lake Fenton
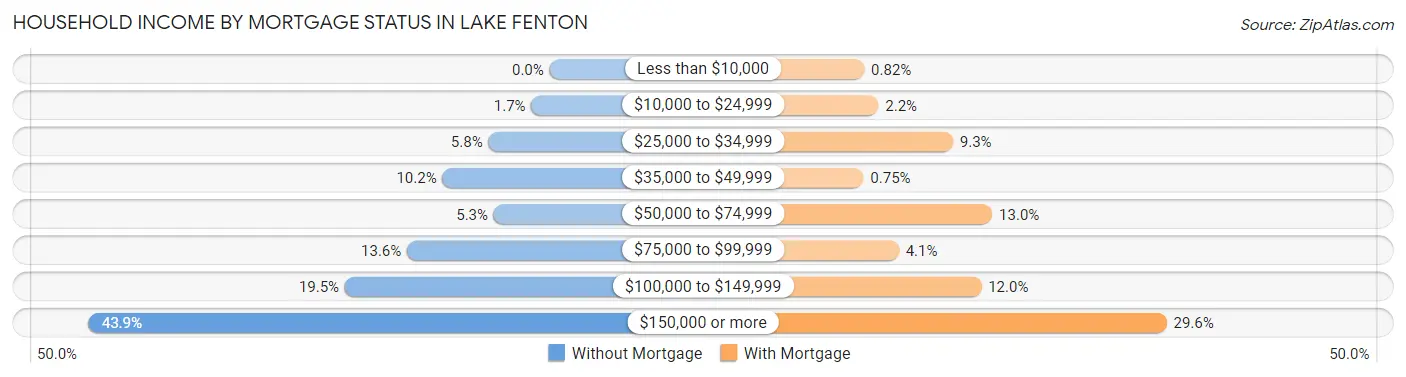
| Household Income | Without Mortgage | With Mortgage |
| Less than $10,000 | 0 (0.0%) | 11 (0.8%) |
| $10,000 to $24,999 | 17 (1.7%) | 29 (2.2%) |
| $25,000 to $34,999 | 57 (5.8%) | 124 (9.3%) |
| $35,000 to $49,999 | 100 (10.2%) | 10 (0.7%) |
| $50,000 to $74,999 | 52 (5.3%) | 174 (13.0%) |
| $75,000 to $99,999 | 133 (13.6%) | 55 (4.1%) |
| $100,000 to $149,999 | 191 (19.5%) | 160 (12.0%) |
| $150,000 or more | 430 (43.9%) | 396 (29.6%) |
| Total | 980 (100.0%) | 1,337 (100.0%) |
Property Value to Household Income Ratio in Lake Fenton
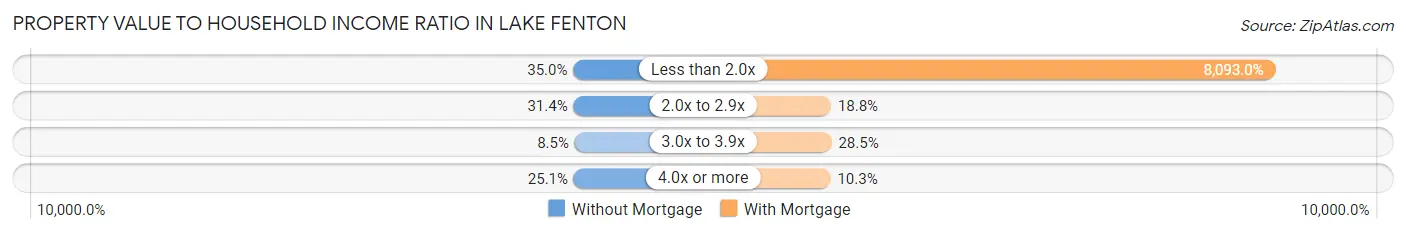
| Value-to-Income Ratio | Without Mortgage | With Mortgage |
| Less than 2.0x | 343 (35.0%) | 108,203 (8,093.0%) |
| 2.0x to 2.9x | 308 (31.4%) | 251 (18.8%) |
| 3.0x to 3.9x | 83 (8.5%) | 381 (28.5%) |
| 4.0x or more | 246 (25.1%) | 137 (10.2%) |
| Total | 980 (100.0%) | 1,337 (100.0%) |
Real Estate Taxes by Mortgage Status in Lake Fenton
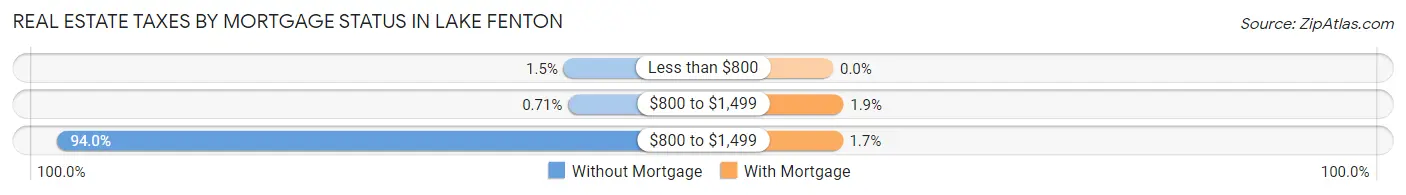
| Property Taxes | Without Mortgage | With Mortgage |
| Less than $800 | 15 (1.5%) | 0 (0.0%) |
| $800 to $1,499 | 7 (0.7%) | 25 (1.9%) |
| $800 to $1,499 | 921 (94.0%) | 23 (1.7%) |
| Total | 980 (100.0%) | 1,337 (100.0%) |
Health & Disability in Lake Fenton
Health Insurance Coverage by Age in Lake Fenton
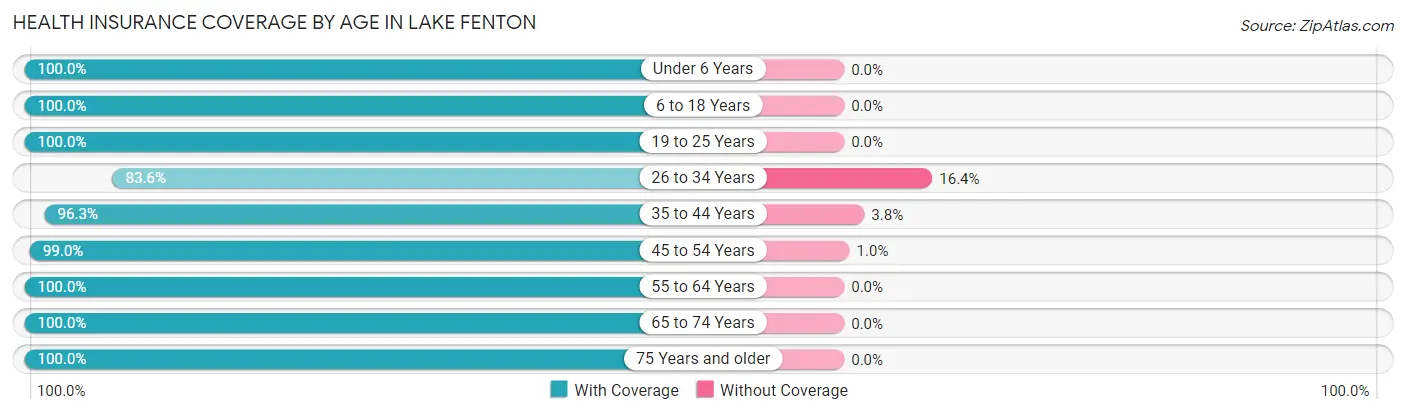
| Age Bracket | With Coverage | Without Coverage |
| Under 6 Years | 217 (100.0%) | 0 (0.0%) |
| 6 to 18 Years | 977 (100.0%) | 0 (0.0%) |
| 19 to 25 Years | 347 (100.0%) | 0 (0.0%) |
| 26 to 34 Years | 402 (83.6%) | 79 (16.4%) |
| 35 to 44 Years | 795 (96.3%) | 31 (3.7%) |
| 45 to 54 Years | 795 (99.0%) | 8 (1.0%) |
| 55 to 64 Years | 907 (100.0%) | 0 (0.0%) |
| 65 to 74 Years | 1,214 (100.0%) | 0 (0.0%) |
| 75 Years and older | 544 (100.0%) | 0 (0.0%) |
| Total | 6,198 (98.1%) | 118 (1.9%) |
Health Insurance Coverage by Citizenship Status in Lake Fenton
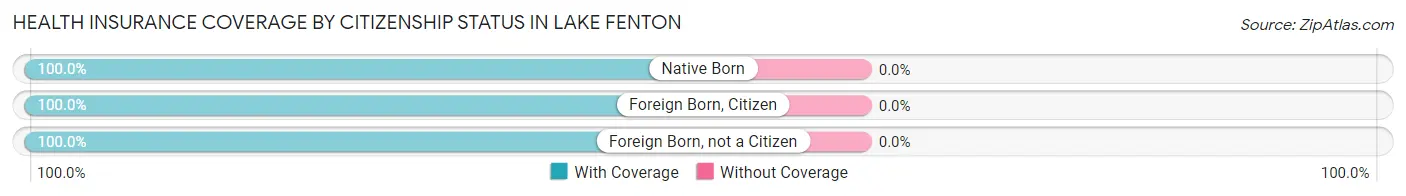
| Citizenship Status | With Coverage | Without Coverage |
| Native Born | 217 (100.0%) | 0 (0.0%) |
| Foreign Born, Citizen | 977 (100.0%) | 0 (0.0%) |
| Foreign Born, not a Citizen | 347 (100.0%) | 0 (0.0%) |
Health Insurance Coverage by Household Income in Lake Fenton
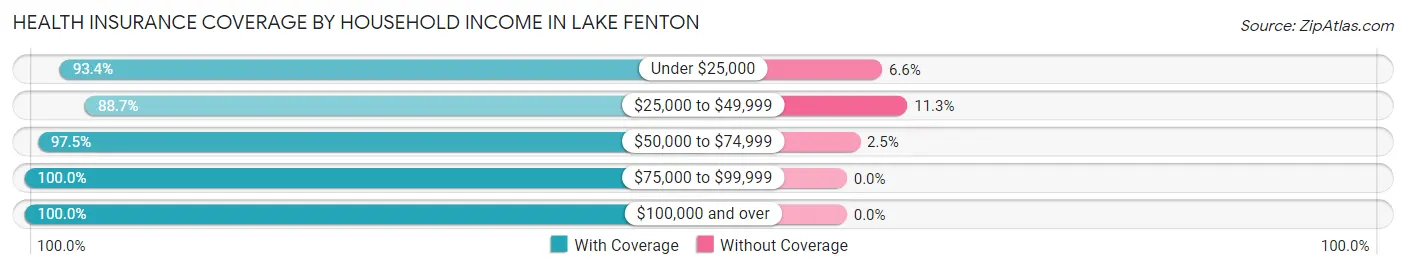
| Household Income | With Coverage | Without Coverage |
| Under $25,000 | 439 (93.4%) | 31 (6.6%) |
| $25,000 to $49,999 | 618 (88.7%) | 79 (11.3%) |
| $50,000 to $74,999 | 314 (97.5%) | 8 (2.5%) |
| $75,000 to $99,999 | 617 (100.0%) | 0 (0.0%) |
| $100,000 and over | 4,207 (100.0%) | 0 (0.0%) |
Public vs Private Health Insurance Coverage by Age in Lake Fenton
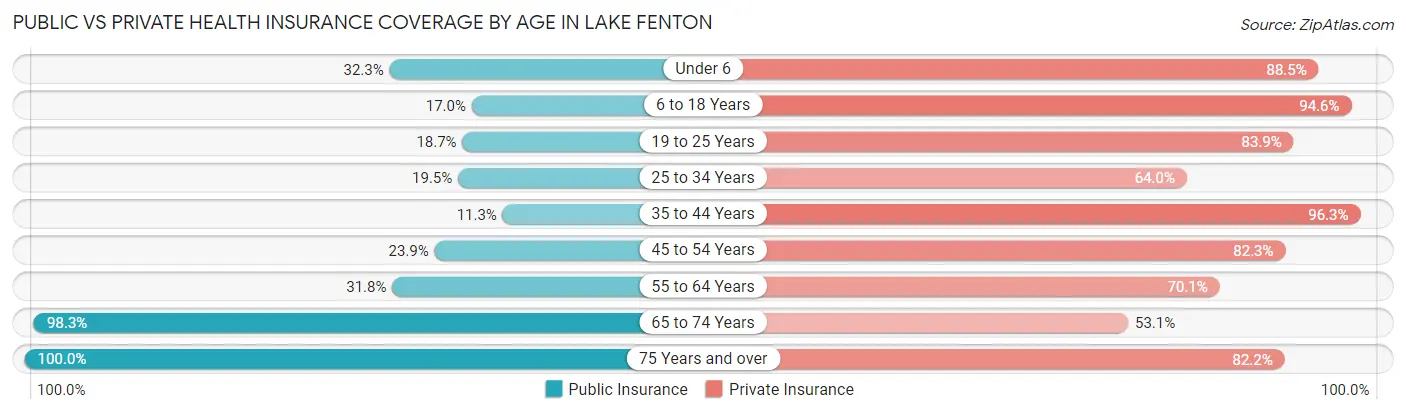
| Age Bracket | Public Insurance | Private Insurance |
| Under 6 | 70 (32.3%) | 192 (88.5%) |
| 6 to 18 Years | 166 (17.0%) | 924 (94.6%) |
| 19 to 25 Years | 65 (18.7%) | 291 (83.9%) |
| 25 to 34 Years | 94 (19.5%) | 308 (64.0%) |
| 35 to 44 Years | 93 (11.3%) | 795 (96.3%) |
| 45 to 54 Years | 192 (23.9%) | 661 (82.3%) |
| 55 to 64 Years | 288 (31.8%) | 636 (70.1%) |
| 65 to 74 Years | 1,193 (98.3%) | 645 (53.1%) |
| 75 Years and over | 544 (100.0%) | 447 (82.2%) |
| Total | 2,705 (42.8%) | 4,899 (77.6%) |
Disability Status by Sex by Age in Lake Fenton
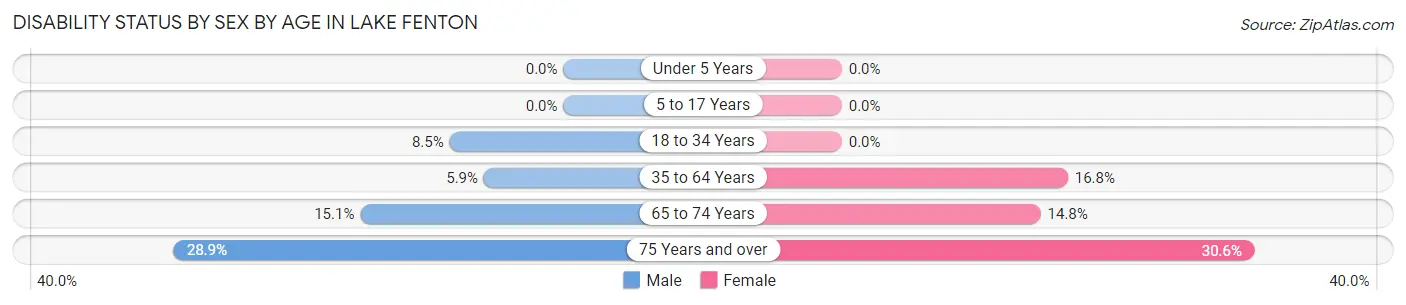
| Age Bracket | Male | Female |
| Under 5 Years | 0 (0.0%) | 0 (0.0%) |
| 5 to 17 Years | 0 (0.0%) | 0 (0.0%) |
| 18 to 34 Years | 43 (8.5%) | 0 (0.0%) |
| 35 to 64 Years | 73 (5.9%) | 218 (16.8%) |
| 65 to 74 Years | 87 (15.1%) | 94 (14.8%) |
| 75 Years and over | 59 (28.9%) | 104 (30.6%) |
Disability Class by Sex by Age in Lake Fenton
Disability Class: Hearing Difficulty
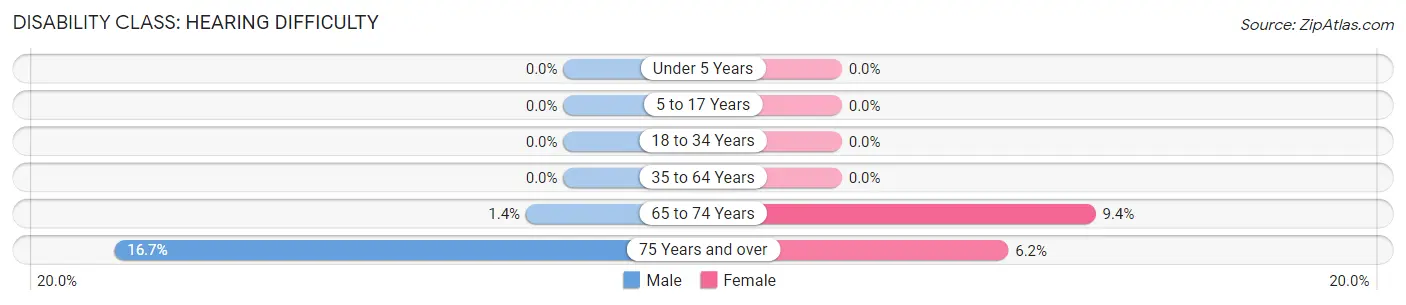
| Age Bracket | Male | Female |
| Under 5 Years | 0 (0.0%) | 0 (0.0%) |
| 5 to 17 Years | 0 (0.0%) | 0 (0.0%) |
| 18 to 34 Years | 0 (0.0%) | 0 (0.0%) |
| 35 to 64 Years | 0 (0.0%) | 0 (0.0%) |
| 65 to 74 Years | 8 (1.4%) | 60 (9.4%) |
| 75 Years and over | 34 (16.7%) | 21 (6.2%) |
Disability Class: Vision Difficulty
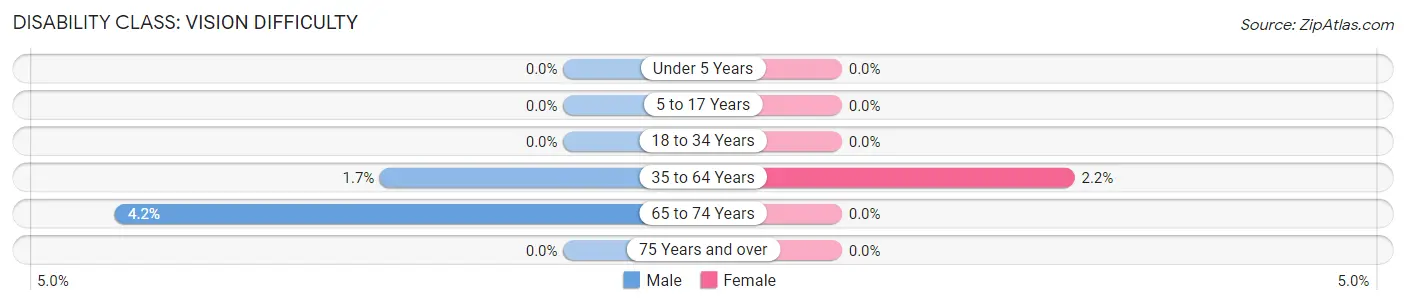
| Age Bracket | Male | Female |
| Under 5 Years | 0 (0.0%) | 0 (0.0%) |
| 5 to 17 Years | 0 (0.0%) | 0 (0.0%) |
| 18 to 34 Years | 0 (0.0%) | 0 (0.0%) |
| 35 to 64 Years | 21 (1.7%) | 28 (2.2%) |
| 65 to 74 Years | 24 (4.2%) | 0 (0.0%) |
| 75 Years and over | 0 (0.0%) | 0 (0.0%) |
Disability Class: Cognitive Difficulty
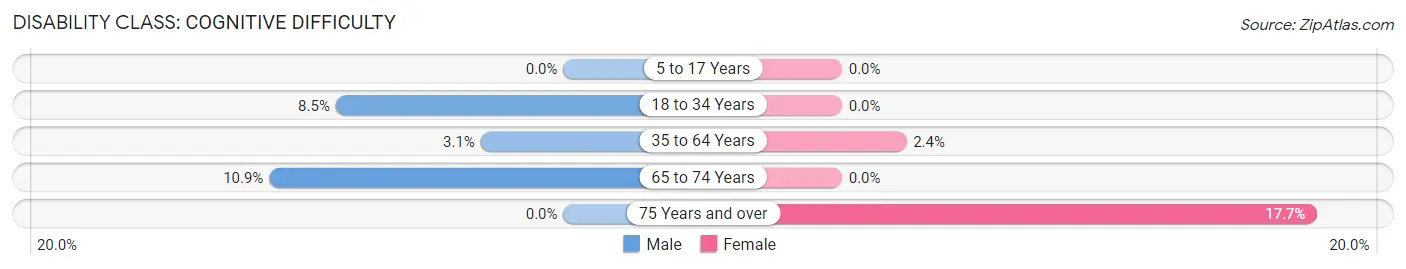
| Age Bracket | Male | Female |
| 5 to 17 Years | 0 (0.0%) | 0 (0.0%) |
| 18 to 34 Years | 43 (8.5%) | 0 (0.0%) |
| 35 to 64 Years | 38 (3.1%) | 31 (2.4%) |
| 65 to 74 Years | 63 (10.9%) | 0 (0.0%) |
| 75 Years and over | 0 (0.0%) | 60 (17.6%) |
Disability Class: Ambulatory Difficulty
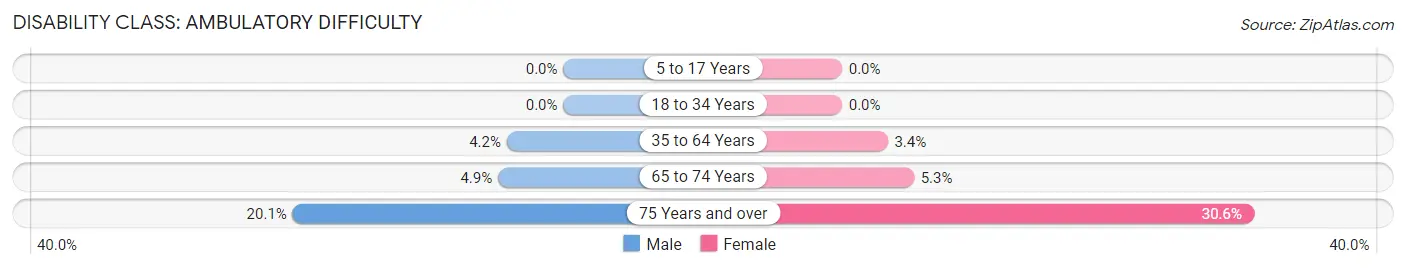
| Age Bracket | Male | Female |
| 5 to 17 Years | 0 (0.0%) | 0 (0.0%) |
| 18 to 34 Years | 0 (0.0%) | 0 (0.0%) |
| 35 to 64 Years | 52 (4.2%) | 44 (3.4%) |
| 65 to 74 Years | 28 (4.9%) | 34 (5.3%) |
| 75 Years and over | 41 (20.1%) | 104 (30.6%) |
Disability Class: Self-Care Difficulty
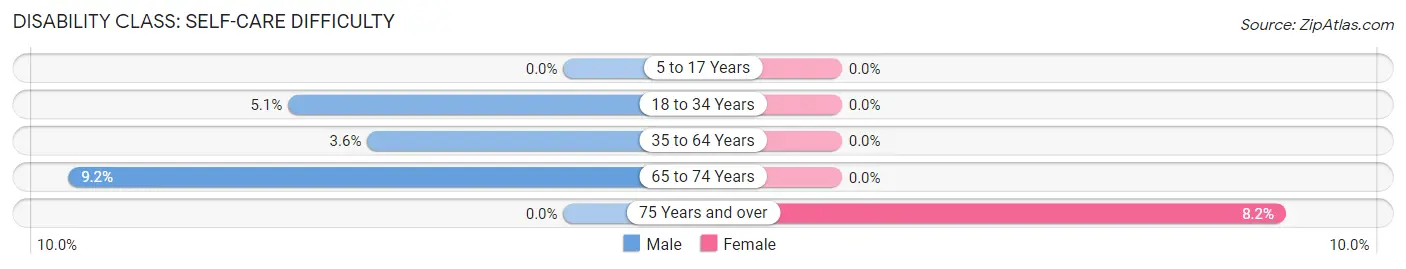
| Age Bracket | Male | Female |
| 5 to 17 Years | 0 (0.0%) | 0 (0.0%) |
| 18 to 34 Years | 26 (5.1%) | 0 (0.0%) |
| 35 to 64 Years | 45 (3.6%) | 0 (0.0%) |
| 65 to 74 Years | 53 (9.2%) | 0 (0.0%) |
| 75 Years and over | 0 (0.0%) | 28 (8.2%) |
Technology Access in Lake Fenton
Computing Device Access in Lake Fenton
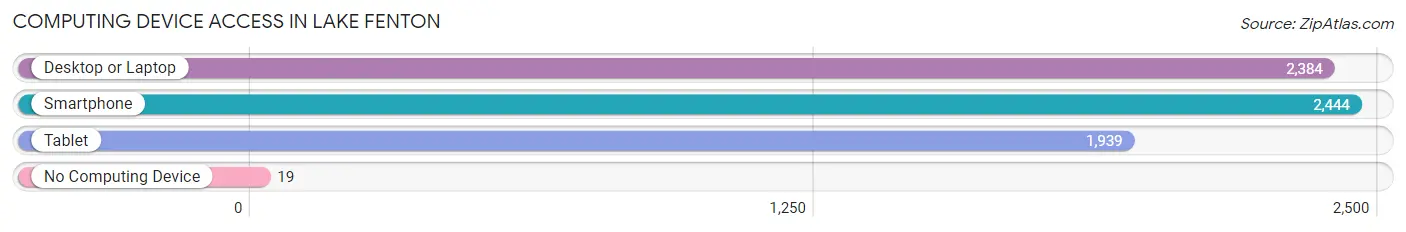
| Device Type | # Households | % Households |
| Desktop or Laptop | 2,384 | 93.4% |
| Smartphone | 2,444 | 95.8% |
| Tablet | 1,939 | 76.0% |
| No Computing Device | 19 | 0.7% |
| Total | 2,551 | 100.0% |
Internet Access in Lake Fenton
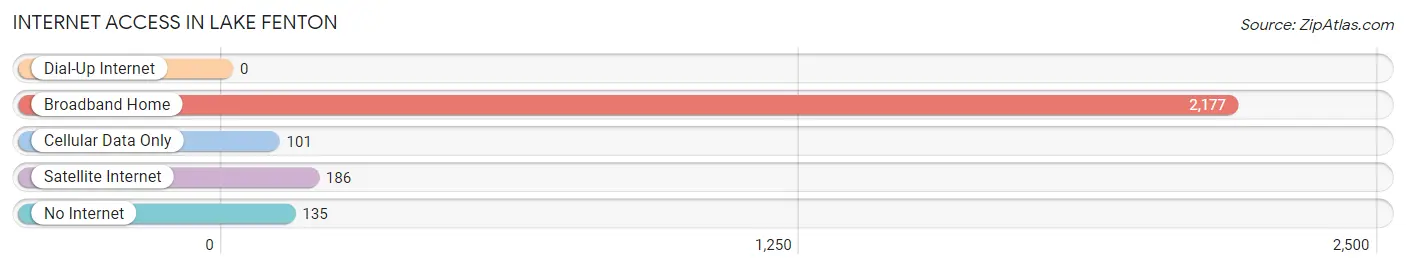
| Internet Type | # Households | % Households |
| Dial-Up Internet | 0 | 0.0% |
| Broadband Home | 2,177 | 85.3% |
| Cellular Data Only | 101 | 4.0% |
| Satellite Internet | 186 | 7.3% |
| No Internet | 135 | 5.3% |
| Total | 2,551 | 100.0% |
Lake Fenton Summary
Lake Fenton is a small village located in Genesee County, Michigan. It is situated on the eastern shore of Lake Fenton, a small lake that is part of the Flint River watershed. The village is located approximately 10 miles northwest of Flint, Michigan and is part of the Flint Metropolitan Statistical Area. The population of Lake Fenton was 2,845 at the 2010 census.
History
The area that is now Lake Fenton was first settled in the early 1800s by settlers from New York and Pennsylvania. The first settlers were mostly farmers and the area was known as Fentonville. In 1837, the village was officially incorporated as the Village of Fentonville. The village was named after the lake, which was named after the Fenton family, who were early settlers in the area.
In 1871, the village was renamed Lake Fenton. The name change was made to distinguish the village from the nearby town of Fenton. The village was reincorporated in 1873 and the first mayor was elected in 1874.
In the late 1800s, the village began to grow and prosper. The village was home to several businesses, including a sawmill, a grist mill, a blacksmith shop, a general store, and a hotel. The village also had a post office, a school, and a church.
In the early 1900s, the village continued to grow and prosper. The village was home to several businesses, including a bank, a newspaper, a movie theater, and a variety of stores. The village also had a library, a fire department, and a police department.
In the late 1900s, the village began to decline. Many of the businesses closed and the population began to decline. In the early 2000s, the village began to experience a resurgence. Several new businesses opened and the population began to increase.
Geography
Lake Fenton is located at 42°59'N, 83°48'W (42.983, -83.800). The village is situated on the eastern shore of Lake Fenton, a small lake that is part of the Flint River watershed. The village is located approximately 10 miles northwest of Flint, Michigan and is part of the Flint Metropolitan Statistical Area.
The village has a total area of 1.2 square miles, all of which is land. The village is located in a rural area and is surrounded by farmland. The terrain is mostly flat with some rolling hills.
Economy
The economy of Lake Fenton is largely based on agriculture and tourism. The village is home to several small businesses, including restaurants, retail stores, and service businesses. The village is also home to several farms, which produce a variety of crops, including corn, soybeans, and wheat.
The village is also home to several tourist attractions, including the Lake Fenton Historical Museum, the Lake Fenton Nature Center, and the Lake Fenton Marina. The village also hosts several annual events, including the Lake Fenton Festival and the Lake Fenton Art Fair.
Demographics
As of the 2010 census, the population of Lake Fenton was 2,845. The racial makeup of the village was 97.2% White, 0.7% African American, 0.3% Native American, 0.3% Asian, 0.1% Pacific Islander, 0.3% from other races, and 1.2% from two or more races. Hispanic or Latino of any race were 1.7% of the population.
The median household income in the village was $45,938 and the median family income was $51,938. The per capita income in the village was $20,938. About 8.3% of families and 10.2% of the population were below the poverty line, including 14.2% of those under age 18 and 5.2% of those age 65 or over.
Common Questions
What is Per Capita Income in Lake Fenton?
Per Capita income in Lake Fenton is $73,292.
What is the Median Family Income in Lake Fenton?
Median Family Income in Lake Fenton is $122,209.
What is the Median Household income in Lake Fenton?
Median Household Income in Lake Fenton is $108,887.
What is Income or Wage Gap in Lake Fenton?
Income or Wage Gap in Lake Fenton is 44.2%.
Women in Lake Fenton earn 55.8 cents for every dollar earned by a man.
What is Inequality or Gini Index in Lake Fenton?
Inequality or Gini Index in Lake Fenton is 0.53.
What is the Total Population of Lake Fenton?
Total Population of Lake Fenton is 6,316.
What is the Total Male Population of Lake Fenton?
Total Male Population of Lake Fenton is 3,093.
What is the Total Female Population of Lake Fenton?
Total Female Population of Lake Fenton is 3,223.
What is the Ratio of Males per 100 Females in Lake Fenton?
There are 95.97 Males per 100 Females in Lake Fenton.
What is the Ratio of Females per 100 Males in Lake Fenton?
There are 104.20 Females per 100 Males in Lake Fenton.
What is the Median Population Age in Lake Fenton?
Median Population Age in Lake Fenton is 48.3 Years.
What is the Average Family Size in Lake Fenton
Average Family Size in Lake Fenton is 2.8 People.
What is the Average Household Size in Lake Fenton
Average Household Size in Lake Fenton is 2.5 People.
How Large is the Labor Force in Lake Fenton?
There are 2,521 People in the Labor Forcein in Lake Fenton.
What is the Percentage of People in the Labor Force in Lake Fenton?
46.8% of People are in the Labor Force in Lake Fenton.
What is the Unemployment Rate in Lake Fenton?
Unemployment Rate in Lake Fenton is 4.0%.