Zip Codes with the Highest Percentage of Families with Income Above $200,000 in Michigan
RELATED REPORTS & OPTIONS
Family Income | $200k+
Michigan
Compare Zip Codes
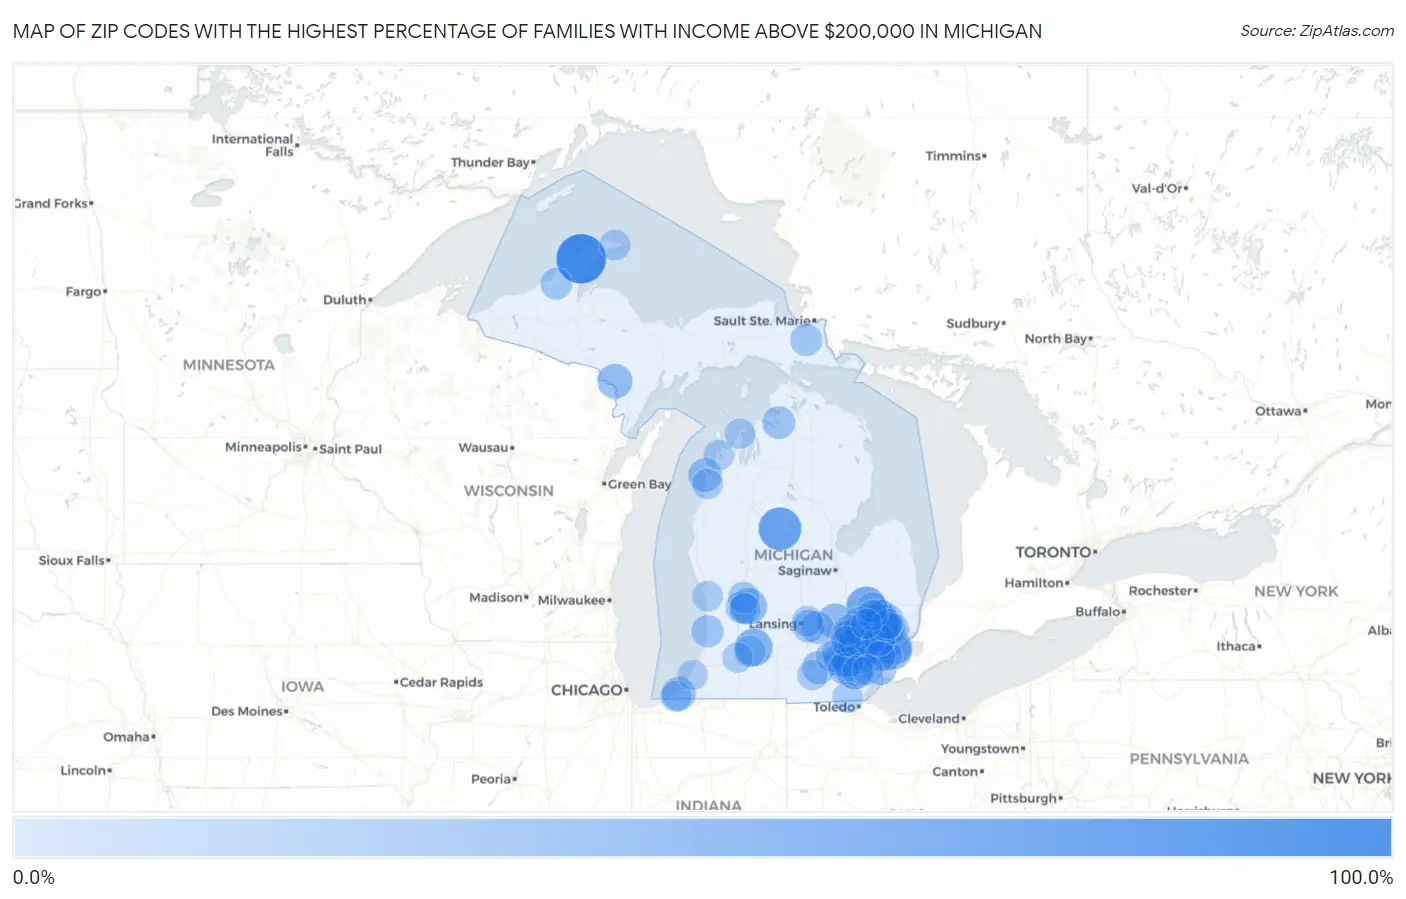
Map of Zip Codes with the Highest Percentage of Families with Income Above $200,000 in Michigan
0.0%
100.0%
Zip Codes with the Highest Percentage of Families with Income Above $200,000 in Michigan
| Zip Code | Families with Income > $200k | vs State | vs National | |
| 1. | 49942 | 100.0% | 11.3%(+88.7)#1 | 14.8%(+85.2)#28 |
| 2. | 48633 | 71.0% | 11.3%(+59.7)#2 | 14.8%(+56.2)#112 |
| 3. | 48440 | 57.1% | 11.3%(+45.8)#3 | 14.8%(+42.3)#383 |
| 4. | 48009 | 56.6% | 11.3%(+45.3)#4 | 14.8%(+41.8)#397 |
| 5. | 48302 | 54.4% | 11.3%(+43.1)#5 | 14.8%(+39.6)#479 |
| 6. | 48190 | 52.9% | 11.3%(+41.6)#6 | 14.8%(+38.1)#542 |
| 7. | 48301 | 51.9% | 11.3%(+40.6)#7 | 14.8%(+37.1)#578 |
| 8. | 48374 | 50.7% | 11.3%(+39.4)#8 | 14.8%(+35.9)#636 |
| 9. | 48070 | 49.5% | 11.3%(+38.2)#9 | 14.8%(+34.7)#694 |
| 10. | 48025 | 49.1% | 11.3%(+37.8)#10 | 14.8%(+34.3)#712 |
| 11. | 49060 | 49.1% | 11.3%(+37.8)#11 | 14.8%(+34.3)#713 |
| 12. | 48069 | 47.7% | 11.3%(+36.4)#12 | 14.8%(+32.9)#780 |
| 13. | 48304 | 45.5% | 11.3%(+34.2)#13 | 14.8%(+30.7)#905 |
| 14. | 48168 | 45.4% | 11.3%(+34.1)#14 | 14.8%(+30.6)#915 |
| 15. | 49301 | 43.9% | 11.3%(+32.6)#15 | 14.8%(+29.1)#998 |
| 16. | 48323 | 42.2% | 11.3%(+30.9)#16 | 14.8%(+27.4)#1,123 |
| 17. | 48230 | 41.7% | 11.3%(+30.4)#17 | 14.8%(+26.9)#1,170 |
| 18. | 48306 | 41.0% | 11.3%(+29.7)#18 | 14.8%(+26.2)#1,221 |
| 19. | 48098 | 41.0% | 11.3%(+29.7)#19 | 14.8%(+26.2)#1,223 |
| 20. | 48816 | 40.0% | 11.3%(+28.7)#20 | 14.8%(+25.2)#1,315 |
| 21. | 48363 | 39.0% | 11.3%(+27.7)#21 | 14.8%(+24.2)#1,413 |
| 22. | 48105 | 38.6% | 11.3%(+27.3)#22 | 14.8%(+23.8)#1,447 |
| 23. | 48104 | 37.8% | 11.3%(+26.5)#23 | 14.8%(+23.0)#1,515 |
| 24. | 49852 | 37.5% | 11.3%(+26.2)#24 | 14.8%(+22.7)#1,560 |
| 25. | 48324 | 37.0% | 11.3%(+25.7)#25 | 14.8%(+22.2)#1,603 |
| 26. | 48167 | 36.6% | 11.3%(+25.3)#26 | 14.8%(+21.8)#1,655 |
| 27. | 48103 | 35.6% | 11.3%(+24.3)#27 | 14.8%(+20.8)#1,764 |
| 28. | 48236 | 35.5% | 11.3%(+24.2)#28 | 14.8%(+20.7)#1,779 |
| 29. | 48178 | 34.5% | 11.3%(+23.2)#29 | 14.8%(+19.7)#1,901 |
| 30. | 48309 | 33.3% | 11.3%(+22.0)#30 | 14.8%(+18.5)#2,046 |
| 31. | 49129 | 33.1% | 11.3%(+21.8)#31 | 14.8%(+18.3)#2,100 |
| 32. | 49628 | 32.7% | 11.3%(+21.4)#32 | 14.8%(+17.9)#2,149 |
| 33. | 49261 | 31.5% | 11.3%(+20.2)#33 | 14.8%(+16.7)#2,302 |
| 34. | 48170 | 30.7% | 11.3%(+19.4)#34 | 14.8%(+15.9)#2,416 |
| 35. | 48348 | 29.9% | 11.3%(+18.6)#35 | 14.8%(+15.1)#2,526 |
| 36. | 48138 | 29.8% | 11.3%(+18.5)#36 | 14.8%(+15.0)#2,545 |
| 37. | 48130 | 29.7% | 11.3%(+18.4)#37 | 14.8%(+14.9)#2,558 |
| 38. | 49796 | 29.1% | 11.3%(+17.8)#38 | 14.8%(+14.3)#2,656 |
| 39. | 48381 | 28.5% | 11.3%(+17.2)#39 | 14.8%(+13.7)#2,783 |
| 40. | 48067 | 28.4% | 11.3%(+17.1)#40 | 14.8%(+13.6)#2,797 |
| 41. | 48380 | 28.4% | 11.3%(+17.1)#41 | 14.8%(+13.6)#2,801 |
| 42. | 48895 | 28.3% | 11.3%(+17.0)#42 | 14.8%(+13.5)#2,819 |
| 43. | 48864 | 28.0% | 11.3%(+16.7)#43 | 14.8%(+13.2)#2,863 |
| 44. | 48085 | 27.4% | 11.3%(+16.1)#44 | 14.8%(+12.6)#2,970 |
| 45. | 48322 | 27.2% | 11.3%(+15.9)#45 | 14.8%(+12.4)#3,017 |
| 46. | 48382 | 27.1% | 11.3%(+15.8)#46 | 14.8%(+12.3)#3,031 |
| 47. | 49406 | 27.0% | 11.3%(+15.7)#47 | 14.8%(+12.2)#3,059 |
| 48. | 48370 | 26.6% | 11.3%(+15.3)#48 | 14.8%(+11.8)#3,135 |
| 49. | 48331 | 26.5% | 11.3%(+15.2)#49 | 14.8%(+11.7)#3,146 |
| 50. | 49752 | 26.2% | 11.3%(+14.9)#50 | 14.8%(+11.4)#3,204 |
| 51. | 48095 | 25.7% | 11.3%(+14.4)#51 | 14.8%(+10.9)#3,305 |
| 52. | 48360 | 25.6% | 11.3%(+14.3)#52 | 14.8%(+10.8)#3,328 |
| 53. | 48188 | 25.2% | 11.3%(+13.9)#53 | 14.8%(+10.4)#3,403 |
| 54. | 48320 | 25.2% | 11.3%(+13.9)#54 | 14.8%(+10.4)#3,419 |
| 55. | 49965 | 24.9% | 11.3%(+13.6)#55 | 14.8%(+10.1)#3,514 |
| 56. | 48084 | 24.7% | 11.3%(+13.4)#56 | 14.8%(+9.90)#3,542 |
| 57. | 48307 | 24.6% | 11.3%(+13.3)#57 | 14.8%(+9.80)#3,566 |
| 58. | 48226 | 24.4% | 11.3%(+13.1)#58 | 14.8%(+9.60)#3,630 |
| 59. | 49506 | 23.9% | 11.3%(+12.6)#59 | 14.8%(+9.10)#3,720 |
| 60. | 49306 | 23.2% | 11.3%(+11.9)#60 | 14.8%(+8.40)#3,899 |
| 61. | 48375 | 23.1% | 11.3%(+11.8)#61 | 14.8%(+8.30)#3,918 |
| 62. | 49546 | 22.8% | 11.3%(+11.5)#62 | 14.8%(+8.00)#3,989 |
| 63. | 48315 | 22.8% | 11.3%(+11.5)#63 | 14.8%(+8.00)#3,990 |
| 64. | 48187 | 22.6% | 11.3%(+11.3)#64 | 14.8%(+7.80)#4,034 |
| 65. | 49083 | 22.6% | 11.3%(+11.3)#65 | 14.8%(+7.80)#4,055 |
| 66. | 48350 | 22.5% | 11.3%(+11.2)#66 | 14.8%(+7.70)#4,086 |
| 67. | 48114 | 22.3% | 11.3%(+11.0)#67 | 14.8%(+7.50)#4,135 |
| 68. | 49117 | 22.1% | 11.3%(+10.8)#68 | 14.8%(+7.30)#4,195 |
| 69. | 48118 | 22.0% | 11.3%(+10.7)#69 | 14.8%(+7.20)#4,210 |
| 70. | 48108 | 21.9% | 11.3%(+10.6)#70 | 14.8%(+7.10)#4,238 |
| 71. | 48176 | 21.8% | 11.3%(+10.5)#71 | 14.8%(+7.00)#4,269 |
| 72. | 48072 | 21.8% | 11.3%(+10.5)#72 | 14.8%(+7.00)#4,274 |
| 73. | 48362 | 21.6% | 11.3%(+10.3)#73 | 14.8%(+6.80)#4,331 |
| 74. | 48823 | 21.2% | 11.3%(+9.90)#74 | 14.8%(+6.40)#4,431 |
| 75. | 48359 | 21.1% | 11.3%(+9.80)#75 | 14.8%(+6.30)#4,476 |
| 76. | 48383 | 21.0% | 11.3%(+9.70)#76 | 14.8%(+6.20)#4,505 |
| 77. | 49613 | 21.0% | 11.3%(+9.70)#77 | 14.8%(+6.20)#4,518 |
| 78. | 48367 | 20.9% | 11.3%(+9.60)#78 | 14.8%(+6.10)#4,547 |
| 79. | 48165 | 20.8% | 11.3%(+9.50)#79 | 14.8%(+6.00)#4,578 |
| 80. | 49918 | 20.7% | 11.3%(+9.40)#80 | 14.8%(+5.90)#4,616 |
| 81. | 48042 | 20.4% | 11.3%(+9.10)#81 | 14.8%(+5.60)#4,674 |
| 82. | 48073 | 20.3% | 11.3%(+9.00)#82 | 14.8%(+5.50)#4,719 |
| 83. | 49456 | 20.0% | 11.3%(+8.70)#83 | 14.8%(+5.20)#4,813 |
| 84. | 48334 | 19.9% | 11.3%(+8.60)#84 | 14.8%(+5.10)#4,853 |
| 85. | 48120 | 19.9% | 11.3%(+8.60)#85 | 14.8%(+5.10)#4,863 |
| 86. | 48191 | 19.9% | 11.3%(+8.60)#86 | 14.8%(+5.10)#4,870 |
| 87. | 48316 | 19.8% | 11.3%(+8.50)#87 | 14.8%(+5.00)#4,887 |
| 88. | 49267 | 19.8% | 11.3%(+8.50)#88 | 14.8%(+5.00)#4,895 |
| 89. | 49009 | 19.6% | 11.3%(+8.30)#89 | 14.8%(+4.80)#4,933 |
| 90. | 49636 | 19.4% | 11.3%(+8.10)#90 | 14.8%(+4.60)#5,031 |
| 91. | 48455 | 19.3% | 11.3%(+8.00)#91 | 14.8%(+4.50)#5,056 |
| 92. | 48353 | 19.3% | 11.3%(+8.00)#92 | 14.8%(+4.50)#5,058 |
| 93. | 49670 | 19.3% | 11.3%(+8.00)#93 | 14.8%(+4.50)#5,065 |
| 94. | 48116 | 19.2% | 11.3%(+7.90)#94 | 14.8%(+4.40)#5,078 |
| 95. | 48164 | 19.2% | 11.3%(+7.90)#95 | 14.8%(+4.40)#5,088 |
| 96. | 49233 | 19.2% | 11.3%(+7.90)#96 | 14.8%(+4.40)#5,093 |
| 97. | 49085 | 19.1% | 11.3%(+7.80)#97 | 14.8%(+4.30)#5,109 |
| 98. | 48094 | 19.1% | 11.3%(+7.80)#98 | 14.8%(+4.30)#5,113 |
| 99. | 48371 | 19.0% | 11.3%(+7.70)#99 | 14.8%(+4.20)#5,143 |
| 100. | 48346 | 19.0% | 11.3%(+7.70)#100 | 14.8%(+4.20)#5,145 |
Common Questions
What are the Top 10 Zip Codes with the Highest Percentage of Families with Income Above $200,000 in Michigan?
Top 10 Zip Codes with the Highest Percentage of Families with Income Above $200,000 in Michigan are:
What zip code has the Highest Percentage of Families with Income Above $200,000 in Michigan?
49942 has the Highest Percentage of Families with Income Above $200,000 in Michigan with 100.0%.
What is the Percentage of Families with Income Above $200,000 in the State of Michigan?
Percentage of Families with Income Above $200,000 in Michigan is 11.3%.
What is the Percentage of Families with Income Above $200,000 in the United States?
Percentage of Families with Income Above $200,000 in the United States is 14.8%.