Lathrup Village, MI Map & Demographics
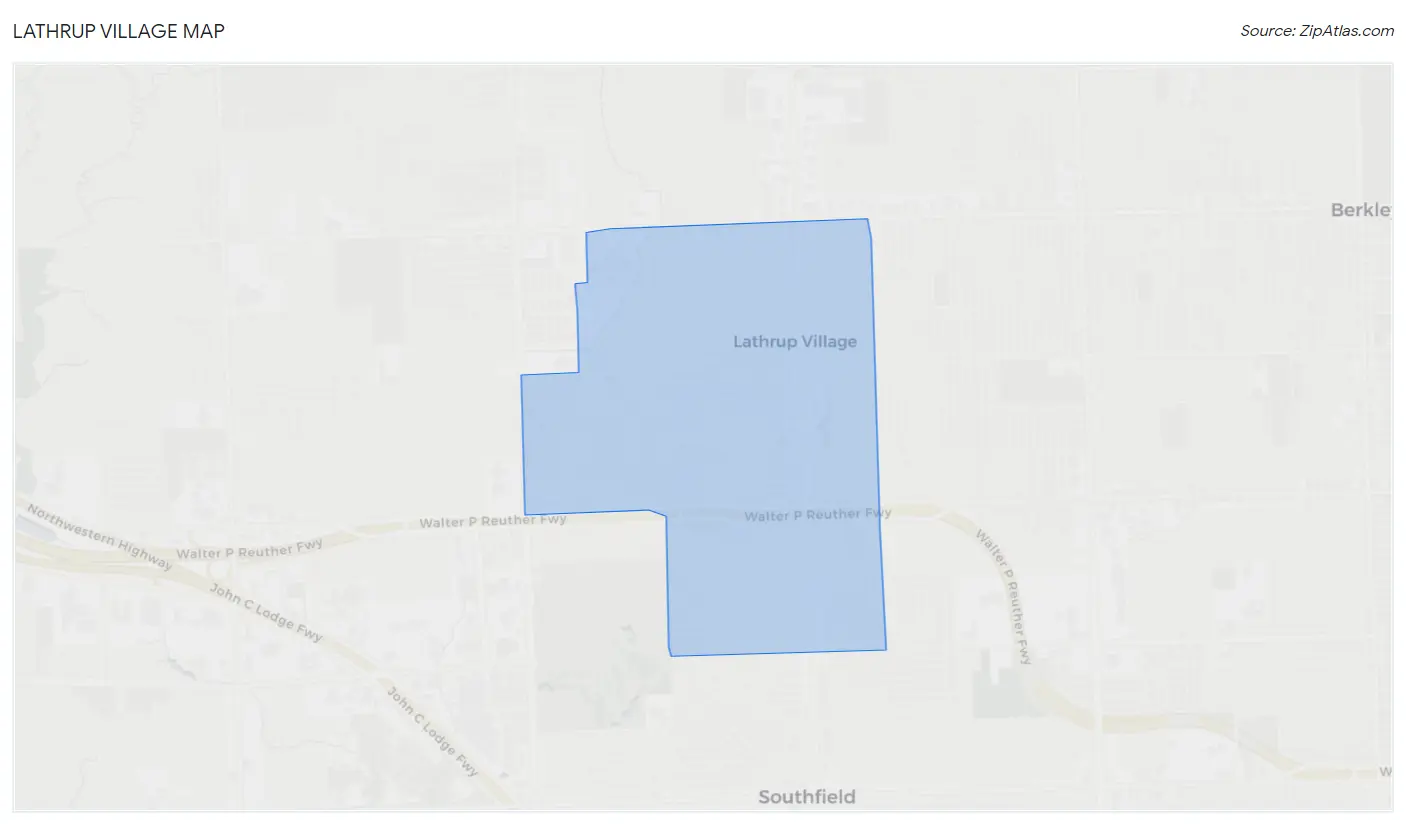
Lathrup Village Map
Lathrup Village Overview
$54,461
PER CAPITA INCOME
$115,577
AVG FAMILY INCOME
$97,750
AVG HOUSEHOLD INCOME
26.3%
WAGE / INCOME GAP [ % ]
73.7¢/ $1
WAGE / INCOME GAP [ $ ]
0.43
INEQUALITY / GINI INDEX
4,076
TOTAL POPULATION
2,076
MALE POPULATION
2,000
FEMALE POPULATION
103.80
MALES / 100 FEMALES
96.34
FEMALES / 100 MALES
48.2
MEDIAN AGE
3.1
AVG FAMILY SIZE
2.6
AVG HOUSEHOLD SIZE
2,228
LABOR FORCE [ PEOPLE ]
61.0%
PERCENT IN LABOR FORCE
7.5%
UNEMPLOYMENT RATE
Income in Lathrup Village
Income Overview in Lathrup Village
Per Capita Income in Lathrup Village is $54,461, while median incomes of families and households are $115,577 and $97,750 respectively.
| Characteristic | Number | Measure |
| Per Capita Income | 4,076 | $54,461 |
| Median Family Income | 1,092 | $115,577 |
| Mean Family Income | 1,092 | $161,829 |
| Median Household Income | 1,574 | $97,750 |
| Mean Household Income | 1,574 | $139,401 |
| Income Deficit | 1,092 | $0 |
| Wage / Income Gap (%) | 4,076 | 26.33% |
| Wage / Income Gap ($) | 4,076 | 73.67¢ per $1 |
| Gini / Inequality Index | 4,076 | 0.43 |
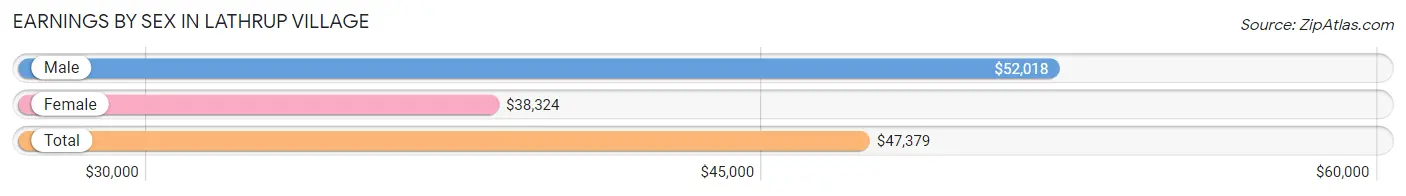
Earnings by Sex in Lathrup Village
Average Earnings in Lathrup Village are $47,379, $52,018 for men and $38,324 for women, a difference of 26.3%.
| Sex | Number | Average Earnings |
| Male | 1,023 (46.3%) | $52,018 |
| Female | 1,185 (53.7%) | $38,324 |
| Total | 2,208 (100.0%) | $47,379 |
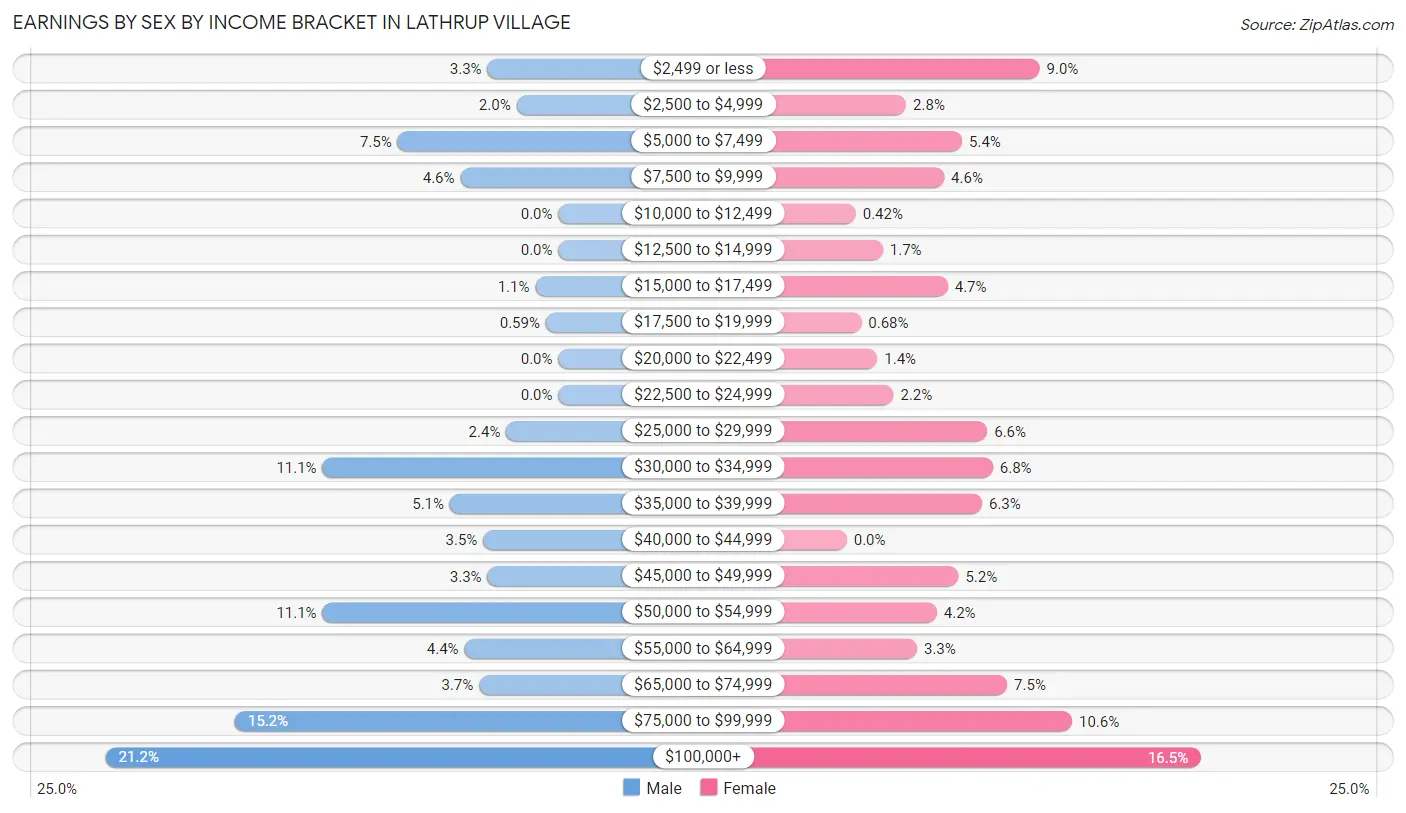
Earnings by Sex by Income Bracket in Lathrup Village
The most common earnings brackets in Lathrup Village are $100,000+ for men (217 | 21.2%) and $100,000+ for women (196 | 16.5%).
| Income | Male | Female |
| $2,499 or less | 34 (3.3%) | 107 (9.0%) |
| $2,500 to $4,999 | 20 (2.0%) | 33 (2.8%) |
| $5,000 to $7,499 | 77 (7.5%) | 64 (5.4%) |
| $7,500 to $9,999 | 47 (4.6%) | 54 (4.6%) |
| $10,000 to $12,499 | 0 (0.0%) | 5 (0.4%) |
| $12,500 to $14,999 | 0 (0.0%) | 20 (1.7%) |
| $15,000 to $17,499 | 11 (1.1%) | 56 (4.7%) |
| $17,500 to $19,999 | 6 (0.6%) | 8 (0.7%) |
| $20,000 to $22,499 | 0 (0.0%) | 17 (1.4%) |
| $22,500 to $24,999 | 0 (0.0%) | 26 (2.2%) |
| $25,000 to $29,999 | 25 (2.4%) | 78 (6.6%) |
| $30,000 to $34,999 | 113 (11.1%) | 81 (6.8%) |
| $35,000 to $39,999 | 52 (5.1%) | 75 (6.3%) |
| $40,000 to $44,999 | 36 (3.5%) | 0 (0.0%) |
| $45,000 to $49,999 | 34 (3.3%) | 62 (5.2%) |
| $50,000 to $54,999 | 113 (11.1%) | 50 (4.2%) |
| $55,000 to $64,999 | 45 (4.4%) | 39 (3.3%) |
| $65,000 to $74,999 | 38 (3.7%) | 89 (7.5%) |
| $75,000 to $99,999 | 155 (15.1%) | 125 (10.5%) |
| $100,000+ | 217 (21.2%) | 196 (16.5%) |
| Total | 1,023 (100.0%) | 1,185 (100.0%) |
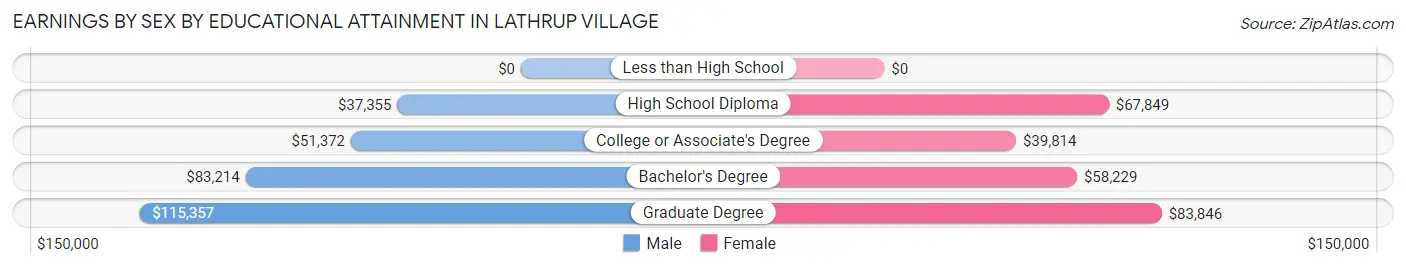
Earnings by Sex by Educational Attainment in Lathrup Village
Average earnings in Lathrup Village are $54,302 for men and $54,773 for women, a difference of 0.9%. Men with an educational attainment of graduate degree enjoy the highest average annual earnings of $115,357, while those with high school diploma education earn the least with $37,355. Women with an educational attainment of graduate degree earn the most with the average annual earnings of $83,846, while those with college or associate's degree education have the smallest earnings of $39,814.
| Educational Attainment | Male Income | Female Income |
| Less than High School | - | - |
| High School Diploma | $37,355 | $67,849 |
| College or Associate's Degree | $51,372 | $39,814 |
| Bachelor's Degree | $83,214 | $58,229 |
| Graduate Degree | $115,357 | $83,846 |
| Total | $54,302 | $54,773 |
Family Income in Lathrup Village
Family Income Brackets in Lathrup Village
According to the Lathrup Village family income data, there are 268 families falling into the $100,000 to $149,999 income range, which is the most common income bracket and makes up 24.5% of all families.
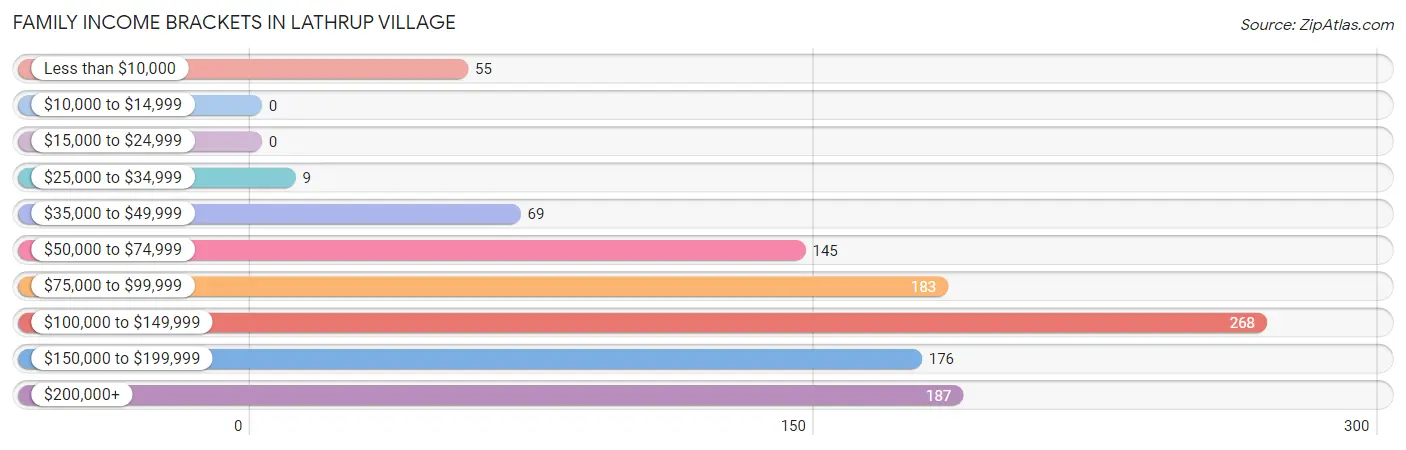
| Income Bracket | # Families | % Families |
| Less than $10,000 | 55 | 5.0% |
| $10,000 to $14,999 | 0 | 0.0% |
| $15,000 to $24,999 | 0 | 0.0% |
| $25,000 to $34,999 | 9 | 0.8% |
| $35,000 to $49,999 | 69 | 6.3% |
| $50,000 to $74,999 | 145 | 13.3% |
| $75,000 to $99,999 | 183 | 16.8% |
| $100,000 to $149,999 | 268 | 24.5% |
| $150,000 to $199,999 | 176 | 16.1% |
| $200,000+ | 187 | 17.1% |
Family Income by Famaliy Size in Lathrup Village
3-person families (145 | 13.3%) account for the highest median family income in Lathrup Village with $163,094 per family, while 3-person families (145 | 13.3%) have the highest median income of $54,365 per family member.
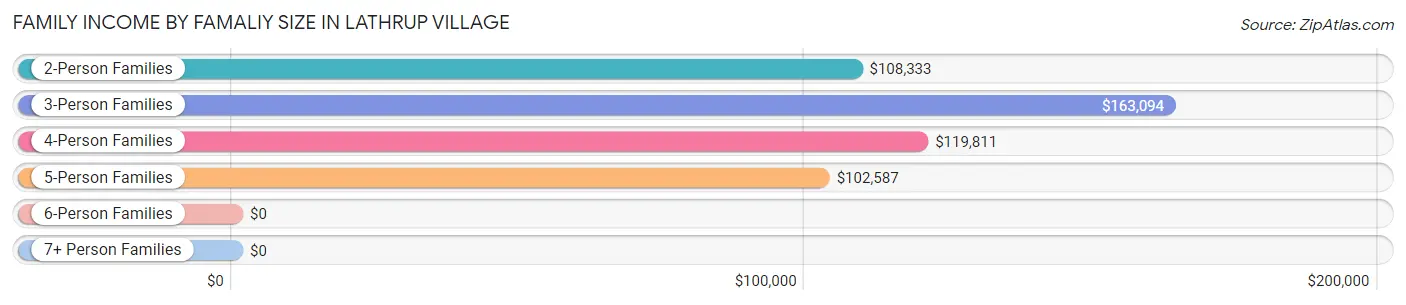
| Income Bracket | # Families | Median Income |
| 2-Person Families | 620 (56.8%) | $108,333 |
| 3-Person Families | 145 (13.3%) | $163,094 |
| 4-Person Families | 137 (12.6%) | $119,811 |
| 5-Person Families | 145 (13.3%) | $102,587 |
| 6-Person Families | 39 (3.6%) | $0 |
| 7+ Person Families | 6 (0.5%) | $0 |
| Total | 1,092 (100.0%) | $115,577 |
Family Income by Number of Earners in Lathrup Village
The median family income in Lathrup Village is $115,577, with families comprising 2 earners (380) having the highest median family income of $128,000, while families with 1 earner (297) have the lowest median family income of $91,607, accounting for 34.8% and 27.2% of families, respectively.
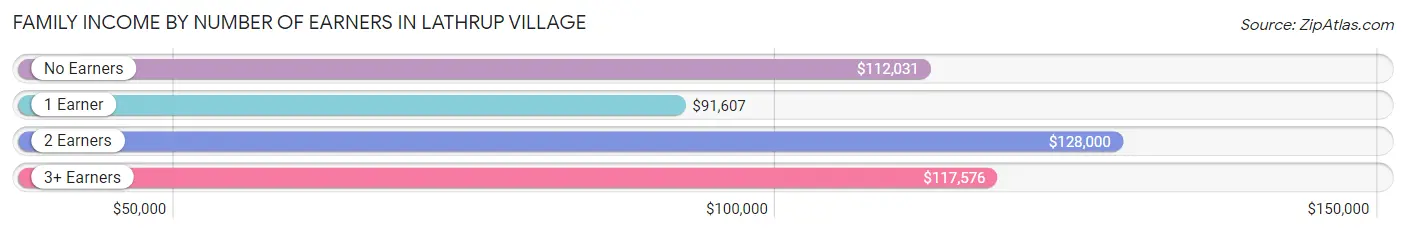
| Number of Earners | # Families | Median Income |
| No Earners | 217 (19.9%) | $112,031 |
| 1 Earner | 297 (27.2%) | $91,607 |
| 2 Earners | 380 (34.8%) | $128,000 |
| 3+ Earners | 198 (18.1%) | $117,576 |
| Total | 1,092 (100.0%) | $115,577 |
Household Income in Lathrup Village
Household Income Brackets in Lathrup Village
With 360 households falling in the category, the $100,000 to $149,999 income range is the most frequent in Lathrup Village, accounting for 22.9% of all households.
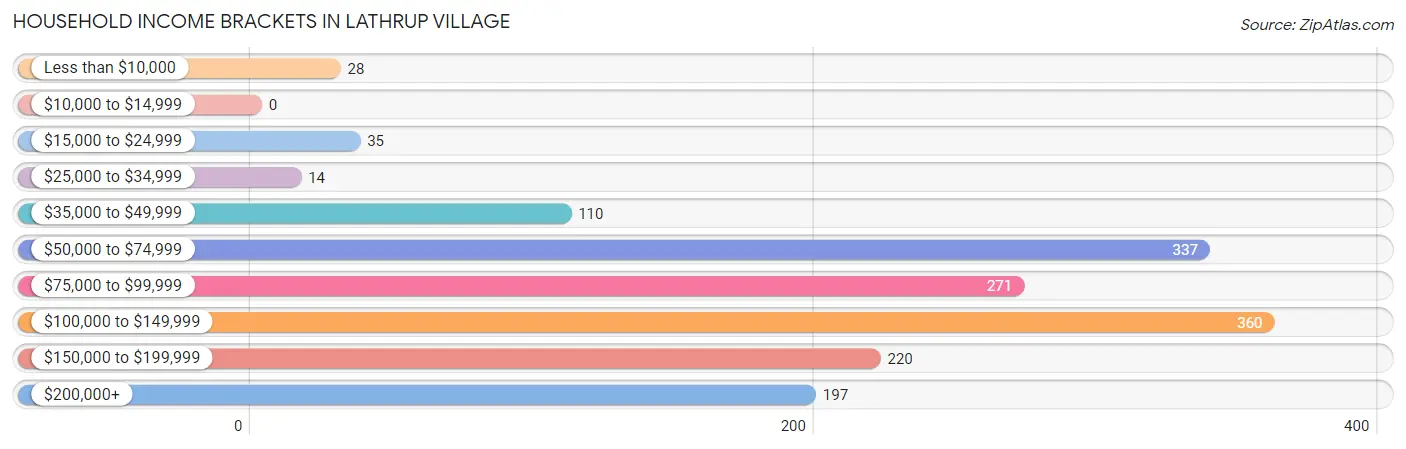
| Income Bracket | # Households | % Households |
| Less than $10,000 | 28 | 1.8% |
| $10,000 to $14,999 | 0 | 0.0% |
| $15,000 to $24,999 | 35 | 2.2% |
| $25,000 to $34,999 | 14 | 0.9% |
| $35,000 to $49,999 | 110 | 7.0% |
| $50,000 to $74,999 | 337 | 21.4% |
| $75,000 to $99,999 | 271 | 17.2% |
| $100,000 to $149,999 | 360 | 22.9% |
| $150,000 to $199,999 | 220 | 14.0% |
| $200,000+ | 197 | 12.5% |
Household Income by Householder Age in Lathrup Village
The median household income in Lathrup Village is $97,750, with the highest median household income of $110,313 found in the 65+ years age bracket for the primary householder. A total of 590 households (37.5%) fall into this category.
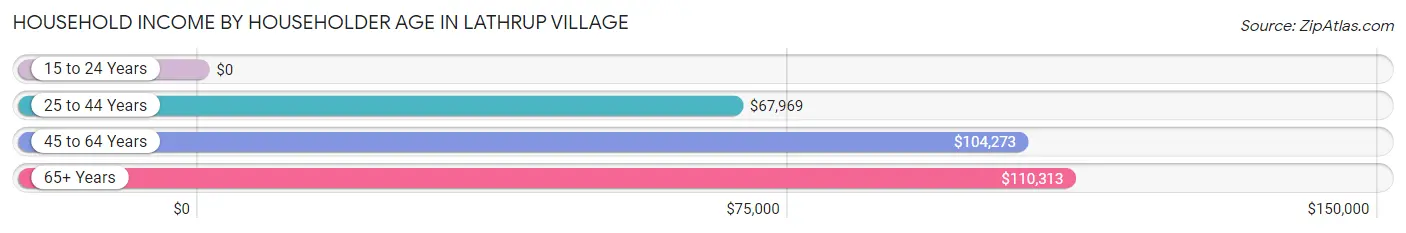
| Income Bracket | # Households | Median Income |
| 15 to 24 Years | 0 (0.0%) | $0 |
| 25 to 44 Years | 239 (15.2%) | $67,969 |
| 45 to 64 Years | 745 (47.3%) | $104,273 |
| 65+ Years | 590 (37.5%) | $110,313 |
| Total | 1,574 (100.0%) | $97,750 |
Poverty in Lathrup Village
Income Below Poverty by Sex and Age in Lathrup Village
With 6.0% poverty level for males and 6.2% for females among the residents of Lathrup Village, 6 to 11 year old males and under 5 year old females are the most vulnerable to poverty, with 28 males (25.5%) and 33 females (68.8%) in their respective age groups living below the poverty level.
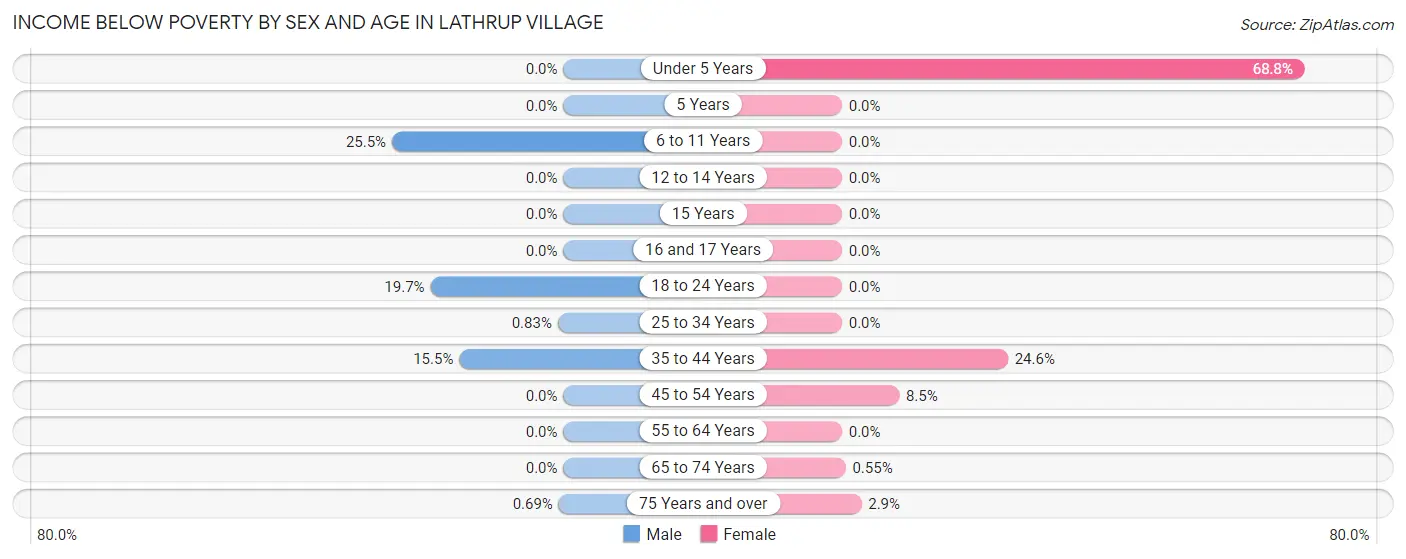
| Age Bracket | Male | Female |
| Under 5 Years | 0 (0.0%) | 33 (68.8%) |
| 5 Years | 0 (0.0%) | 0 (0.0%) |
| 6 to 11 Years | 28 (25.5%) | 0 (0.0%) |
| 12 to 14 Years | 0 (0.0%) | 0 (0.0%) |
| 15 Years | 0 (0.0%) | 0 (0.0%) |
| 16 and 17 Years | 0 (0.0%) | 0 (0.0%) |
| 18 to 24 Years | 61 (19.7%) | 0 (0.0%) |
| 25 to 34 Years | 2 (0.8%) | 0 (0.0%) |
| 35 to 44 Years | 32 (15.5%) | 51 (24.6%) |
| 45 to 54 Years | 0 (0.0%) | 31 (8.5%) |
| 55 to 64 Years | 0 (0.0%) | 0 (0.0%) |
| 65 to 74 Years | 0 (0.0%) | 2 (0.5%) |
| 75 Years and over | 2 (0.7%) | 5 (2.9%) |
| Total | 125 (6.0%) | 122 (6.2%) |
Income Above Poverty by Sex and Age in Lathrup Village
According to the poverty statistics in Lathrup Village, males aged under 5 years and females aged 6 to 11 years are the age groups that are most secure financially, with 100.0% of males and 100.0% of females in these age groups living above the poverty line.
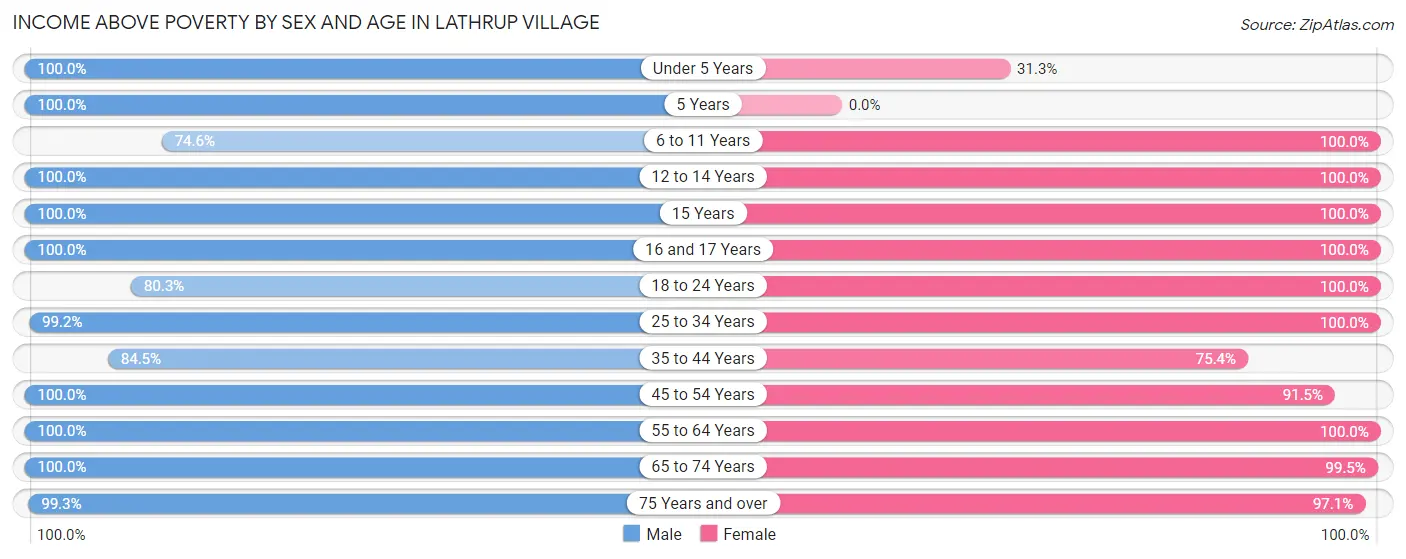
| Age Bracket | Male | Female |
| Under 5 Years | 59 (100.0%) | 15 (31.2%) |
| 5 Years | 60 (100.0%) | 0 (0.0%) |
| 6 to 11 Years | 82 (74.6%) | 33 (100.0%) |
| 12 to 14 Years | 41 (100.0%) | 36 (100.0%) |
| 15 Years | 11 (100.0%) | 26 (100.0%) |
| 16 and 17 Years | 13 (100.0%) | 75 (100.0%) |
| 18 to 24 Years | 248 (80.3%) | 245 (100.0%) |
| 25 to 34 Years | 239 (99.2%) | 137 (100.0%) |
| 35 to 44 Years | 175 (84.5%) | 156 (75.4%) |
| 45 to 54 Years | 293 (100.0%) | 334 (91.5%) |
| 55 to 64 Years | 254 (100.0%) | 266 (100.0%) |
| 65 to 74 Years | 185 (100.0%) | 364 (99.5%) |
| 75 Years and over | 287 (99.3%) | 168 (97.1%) |
| Total | 1,947 (94.0%) | 1,855 (93.8%) |
Income Below Poverty Among Married-Couple Families in Lathrup Village
The poverty statistics for married-couple families in Lathrup Village show that 3.8% or 29 of the total 760 families live below the poverty line. Families with 1 or 2 children have the highest poverty rate of 12.4%, comprising of 29 families. On the other hand, families with no children have the lowest poverty rate of 0.0%, which includes 0 families.
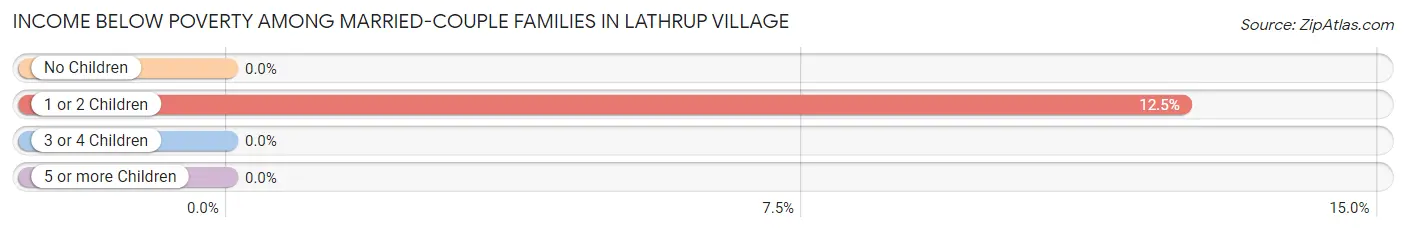
| Children | Above Poverty | Below Poverty |
| No Children | 509 (100.0%) | 0 (0.0%) |
| 1 or 2 Children | 204 (87.5%) | 29 (12.4%) |
| 3 or 4 Children | 18 (100.0%) | 0 (0.0%) |
| 5 or more Children | 0 (0.0%) | 0 (0.0%) |
| Total | 731 (96.2%) | 29 (3.8%) |
Income Below Poverty Among Single-Parent Households in Lathrup Village
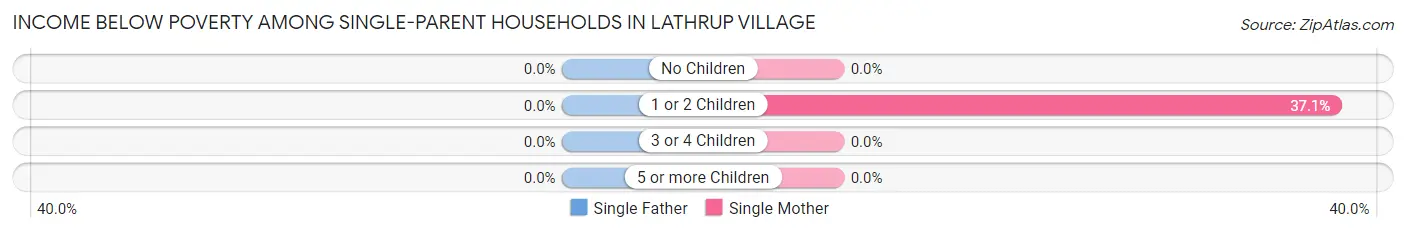
| Children | Single Father | Single Mother |
| No Children | 0 (0.0%) | 0 (0.0%) |
| 1 or 2 Children | 0 (0.0%) | 26 (37.1%) |
| 3 or 4 Children | 0 (0.0%) | 0 (0.0%) |
| 5 or more Children | 0 (0.0%) | 0 (0.0%) |
| Total | 0 (0.0%) | 26 (14.9%) |
Income Below Poverty Among Married-Couple vs Single-Parent Households in Lathrup Village
The poverty data for Lathrup Village shows that 29 of the married-couple family households (3.8%) and 26 of the single-parent households (7.8%) are living below the poverty level. Within the married-couple family households, those with 1 or 2 children have the highest poverty rate, with 29 households (12.4%) falling below the poverty line. Among the single-parent households, those with 1 or 2 children have the highest poverty rate, with 26 household (37.1%) living below poverty.
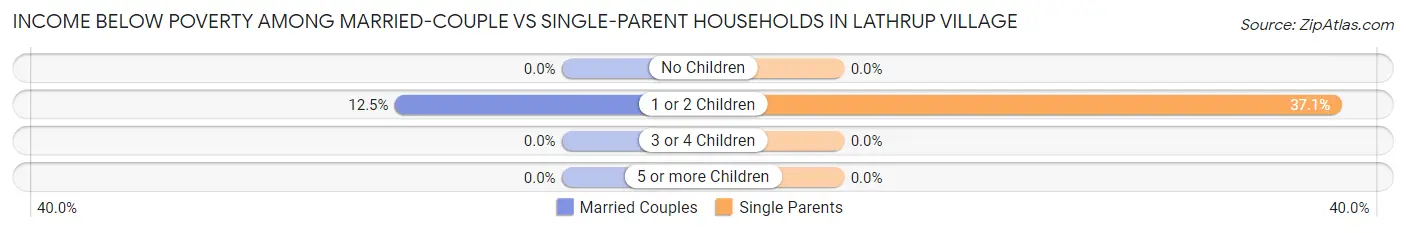
| Children | Married-Couple Families | Single-Parent Households |
| No Children | 0 (0.0%) | 0 (0.0%) |
| 1 or 2 Children | 29 (12.4%) | 26 (37.1%) |
| 3 or 4 Children | 0 (0.0%) | 0 (0.0%) |
| 5 or more Children | 0 (0.0%) | 0 (0.0%) |
| Total | 29 (3.8%) | 26 (7.8%) |
Race in Lathrup Village
The most populous races in Lathrup Village are Black / African American (2,701 | 66.3%), White / Caucasian (1,261 | 30.9%), and Hispanic or Latino (147 | 3.6%).
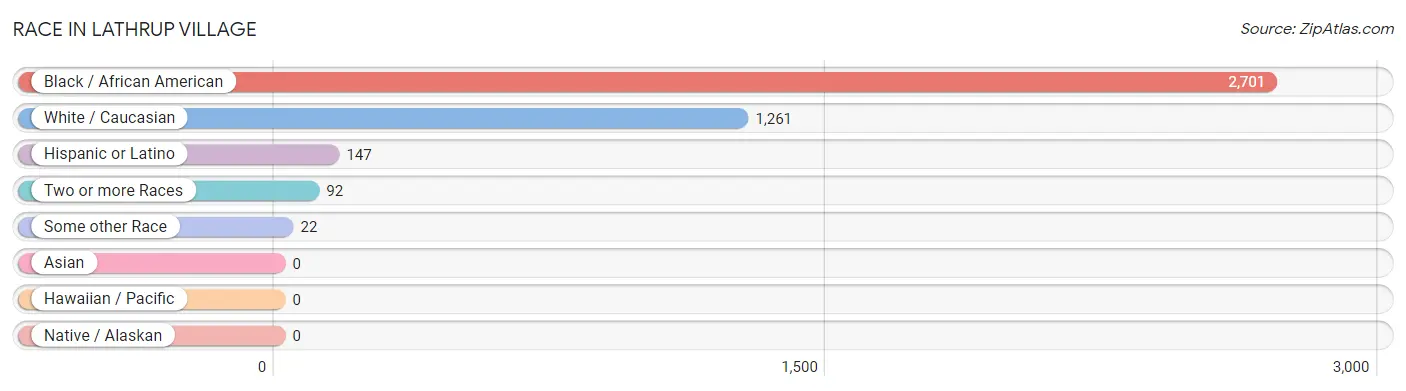
| Race | # Population | % Population |
| Asian | 0 | 0.0% |
| Black / African American | 2,701 | 66.3% |
| Hawaiian / Pacific | 0 | 0.0% |
| Hispanic or Latino | 147 | 3.6% |
| Native / Alaskan | 0 | 0.0% |
| White / Caucasian | 1,261 | 30.9% |
| Two or more Races | 92 | 2.3% |
| Some other Race | 22 | 0.5% |
| Total | 4,076 | 100.0% |
Ancestry in Lathrup Village
The most populous ancestries reported in Lathrup Village are German (304 | 7.5%), English (180 | 4.4%), Polish (173 | 4.2%), Irish (150 | 3.7%), and Italian (110 | 2.7%), together accounting for 22.5% of all Lathrup Village residents.
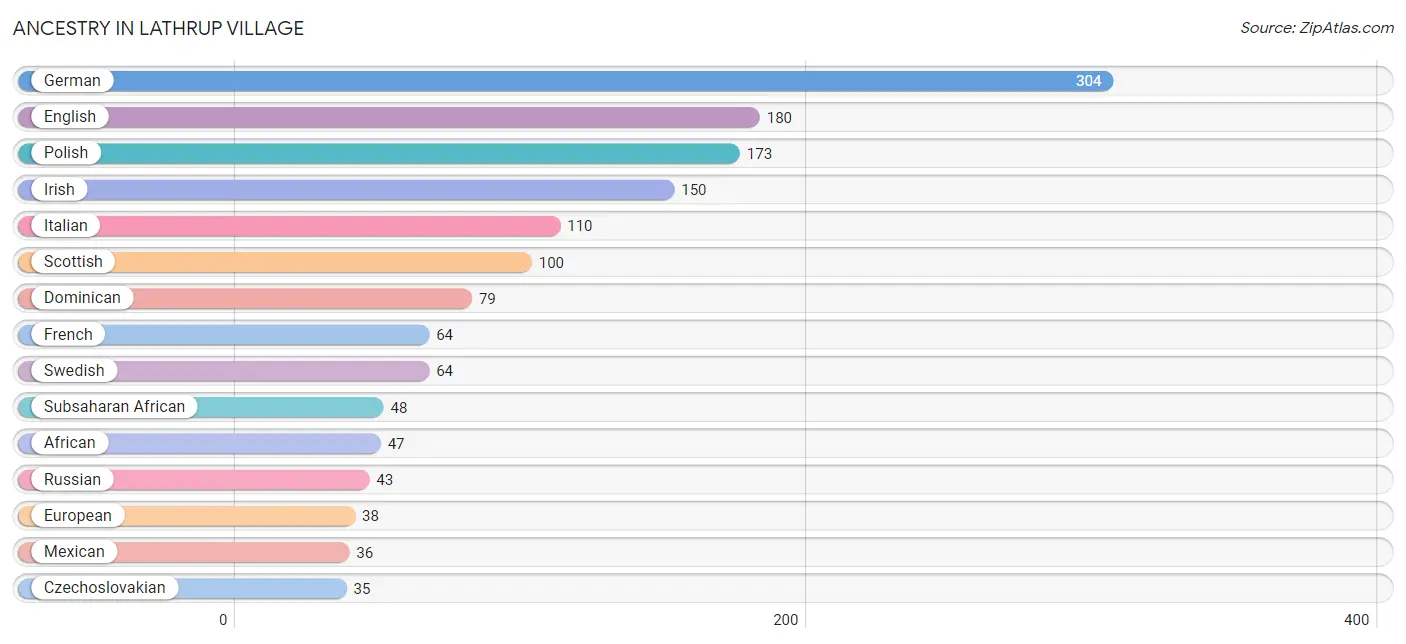
| Ancestry | # Population | % Population |
| African | 47 | 1.1% |
| American | 21 | 0.5% |
| Arab | 23 | 0.6% |
| Armenian | 10 | 0.3% |
| Assyrian / Chaldean / Syriac | 15 | 0.4% |
| Austrian | 9 | 0.2% |
| British | 27 | 0.7% |
| Burmese | 14 | 0.3% |
| Canadian | 22 | 0.5% |
| Czech | 10 | 0.3% |
| Czechoslovakian | 35 | 0.9% |
| Dominican | 79 | 1.9% |
| Dutch | 8 | 0.2% |
| Eastern European | 17 | 0.4% |
| Egyptian | 16 | 0.4% |
| English | 180 | 4.4% |
| European | 38 | 0.9% |
| Finnish | 17 | 0.4% |
| French | 64 | 1.6% |
| French Canadian | 14 | 0.3% |
| German | 304 | 7.5% |
| Ghanaian | 1 | 0.0% |
| Hungarian | 24 | 0.6% |
| Iraqi | 7 | 0.2% |
| Irish | 150 | 3.7% |
| Italian | 110 | 2.7% |
| Jamaican | 25 | 0.6% |
| Kenyan | 25 | 0.6% |
| Maltese | 21 | 0.5% |
| Mexican | 36 | 0.9% |
| Northern European | 8 | 0.2% |
| Norwegian | 13 | 0.3% |
| Polish | 173 | 4.2% |
| Puerto Rican | 9 | 0.2% |
| Romanian | 16 | 0.4% |
| Russian | 43 | 1.1% |
| Scandinavian | 3 | 0.1% |
| Scotch-Irish | 26 | 0.6% |
| Scottish | 100 | 2.5% |
| Slovak | 19 | 0.5% |
| Spaniard | 23 | 0.6% |
| Subsaharan African | 48 | 1.2% |
| Swedish | 64 | 1.6% |
| Ukrainian | 17 | 0.4% |
| Welsh | 7 | 0.2% | View All 45 Rows |
Immigrants in Lathrup Village
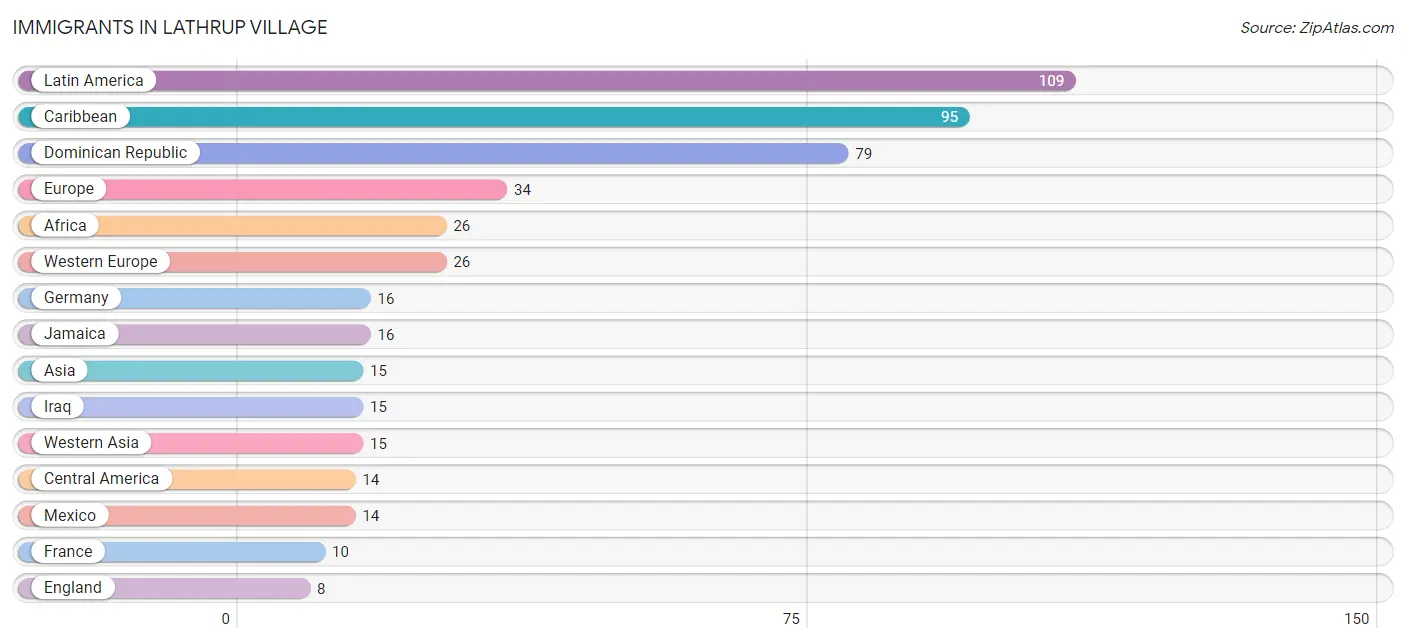
The most numerous immigrant groups reported in Lathrup Village came from Latin America (109 | 2.7%), Caribbean (95 | 2.3%), Dominican Republic (79 | 1.9%), Europe (34 | 0.8%), and Africa (26 | 0.6%), together accounting for 8.4% of all Lathrup Village residents.
| Immigration Origin | # Population | % Population |
| Africa | 26 | 0.6% |
| Asia | 15 | 0.4% |
| Caribbean | 95 | 2.3% |
| Central America | 14 | 0.3% |
| Dominican Republic | 79 | 1.9% |
| England | 8 | 0.2% |
| Europe | 34 | 0.8% |
| France | 10 | 0.3% |
| Germany | 16 | 0.4% |
| Ghana | 1 | 0.0% |
| Iraq | 15 | 0.4% |
| Jamaica | 16 | 0.4% |
| Latin America | 109 | 2.7% |
| Mexico | 14 | 0.3% |
| Northern Europe | 8 | 0.2% |
| Western Africa | 1 | 0.0% |
| Western Asia | 15 | 0.4% |
| Western Europe | 26 | 0.6% | View All 18 Rows |
Sex and Age in Lathrup Village
Sex and Age in Lathrup Village
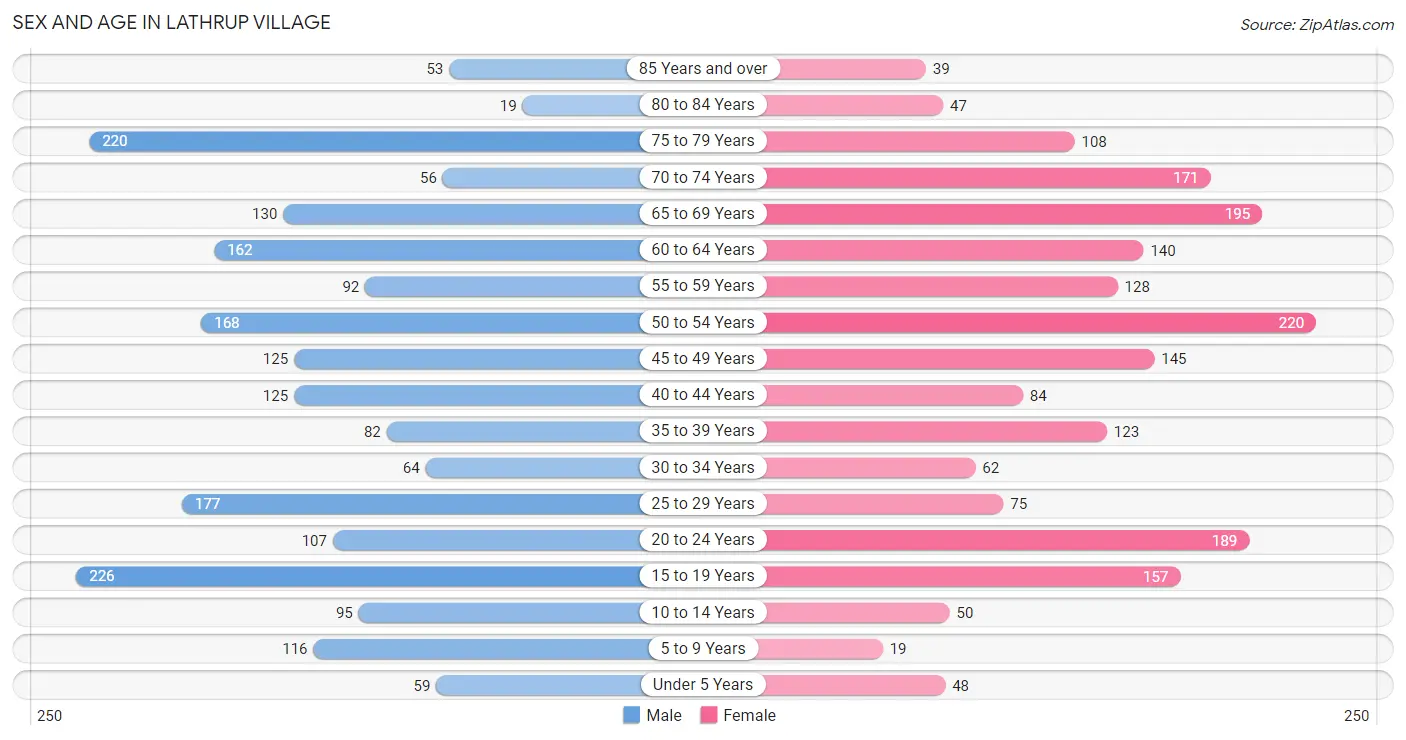
The most populous age groups in Lathrup Village are 15 to 19 Years (226 | 10.9%) for men and 50 to 54 Years (220 | 11.0%) for women.
| Age Bracket | Male | Female |
| Under 5 Years | 59 (2.8%) | 48 (2.4%) |
| 5 to 9 Years | 116 (5.6%) | 19 (0.9%) |
| 10 to 14 Years | 95 (4.6%) | 50 (2.5%) |
| 15 to 19 Years | 226 (10.9%) | 157 (7.9%) |
| 20 to 24 Years | 107 (5.1%) | 189 (9.5%) |
| 25 to 29 Years | 177 (8.5%) | 75 (3.7%) |
| 30 to 34 Years | 64 (3.1%) | 62 (3.1%) |
| 35 to 39 Years | 82 (4.0%) | 123 (6.1%) |
| 40 to 44 Years | 125 (6.0%) | 84 (4.2%) |
| 45 to 49 Years | 125 (6.0%) | 145 (7.2%) |
| 50 to 54 Years | 168 (8.1%) | 220 (11.0%) |
| 55 to 59 Years | 92 (4.4%) | 128 (6.4%) |
| 60 to 64 Years | 162 (7.8%) | 140 (7.0%) |
| 65 to 69 Years | 130 (6.3%) | 195 (9.8%) |
| 70 to 74 Years | 56 (2.7%) | 171 (8.6%) |
| 75 to 79 Years | 220 (10.6%) | 108 (5.4%) |
| 80 to 84 Years | 19 (0.9%) | 47 (2.4%) |
| 85 Years and over | 53 (2.5%) | 39 (1.9%) |
| Total | 2,076 (100.0%) | 2,000 (100.0%) |
Families and Households in Lathrup Village
Median Family Size in Lathrup Village
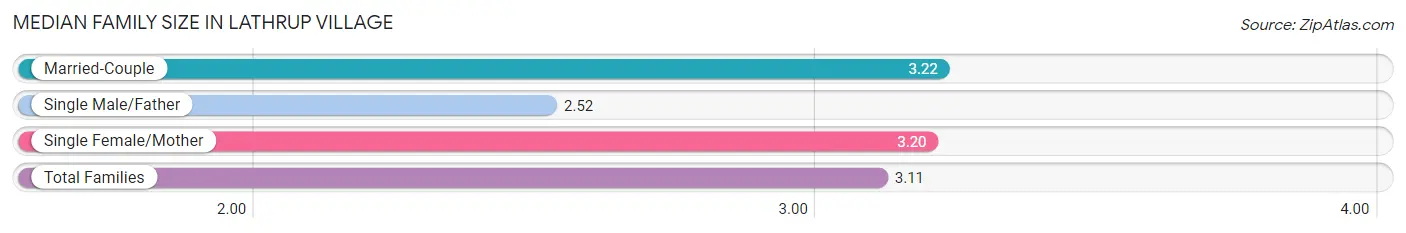
The median family size in Lathrup Village is 3.11 persons per family, with married-couple families (760 | 69.6%) accounting for the largest median family size of 3.22 persons per family. On the other hand, single male/father families (158 | 14.5%) represent the smallest median family size with 2.52 persons per family.
| Family Type | # Families | Family Size |
| Married-Couple | 760 (69.6%) | 3.22 |
| Single Male/Father | 158 (14.5%) | 2.52 |
| Single Female/Mother | 174 (15.9%) | 3.20 |
| Total Families | 1,092 (100.0%) | 3.11 |
Median Household Size in Lathrup Village
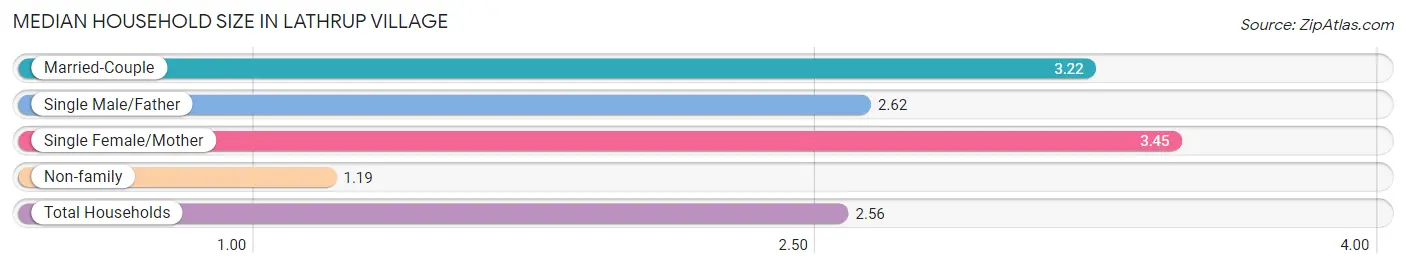
The median household size in Lathrup Village is 2.56 persons per household, with single female/mother households (174 | 11.1%) accounting for the largest median household size of 3.45 persons per household. non-family households (482 | 30.6%) represent the smallest median household size with 1.19 persons per household.
| Household Type | # Households | Household Size |
| Married-Couple | 760 (48.3%) | 3.22 |
| Single Male/Father | 158 (10.0%) | 2.62 |
| Single Female/Mother | 174 (11.1%) | 3.45 |
| Non-family | 482 (30.6%) | 1.19 |
| Total Households | 1,574 (100.0%) | 2.56 |
Household Size by Marriage Status in Lathrup Village
Out of a total of 1,574 households in Lathrup Village, 1,092 (69.4%) are family households, while 482 (30.6%) are nonfamily households. The most numerous type of family households are 2-person households, comprising 567, and the most common type of nonfamily households are 1-person households, comprising 395.
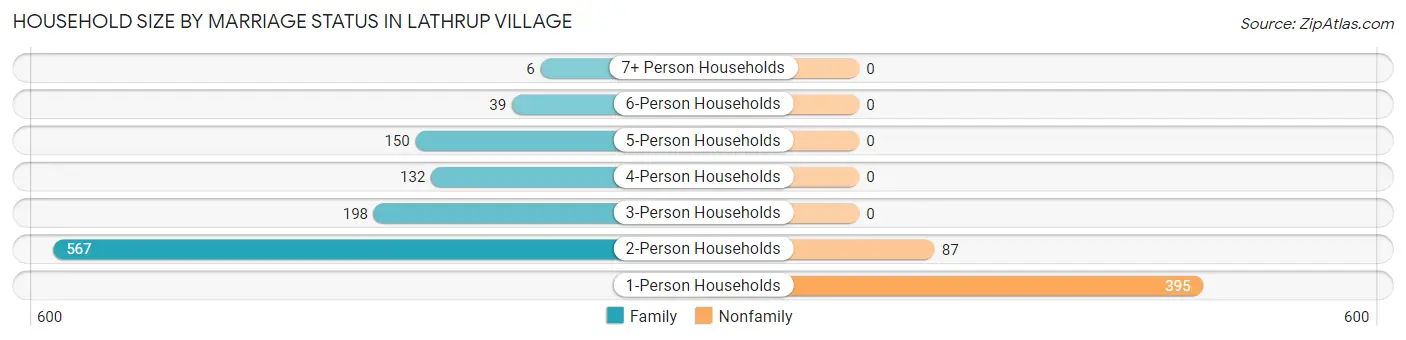
| Household Size | Family Households | Nonfamily Households |
| 1-Person Households | - | 395 (25.1%) |
| 2-Person Households | 567 (36.0%) | 87 (5.5%) |
| 3-Person Households | 198 (12.6%) | 0 (0.0%) |
| 4-Person Households | 132 (8.4%) | 0 (0.0%) |
| 5-Person Households | 150 (9.5%) | 0 (0.0%) |
| 6-Person Households | 39 (2.5%) | 0 (0.0%) |
| 7+ Person Households | 6 (0.4%) | 0 (0.0%) |
| Total | 1,092 (69.4%) | 482 (30.6%) |
Female Fertility in Lathrup Village
Fertility by Age in Lathrup Village
Average fertility rate in Lathrup Village is 37.0 births per 1,000 women. Women in the age bracket of 20 to 34 years have the highest fertility rate with 64.0 births per 1,000 women. Women in the age bracket of 20 to 34 years acount for 63.6% of all women with births.
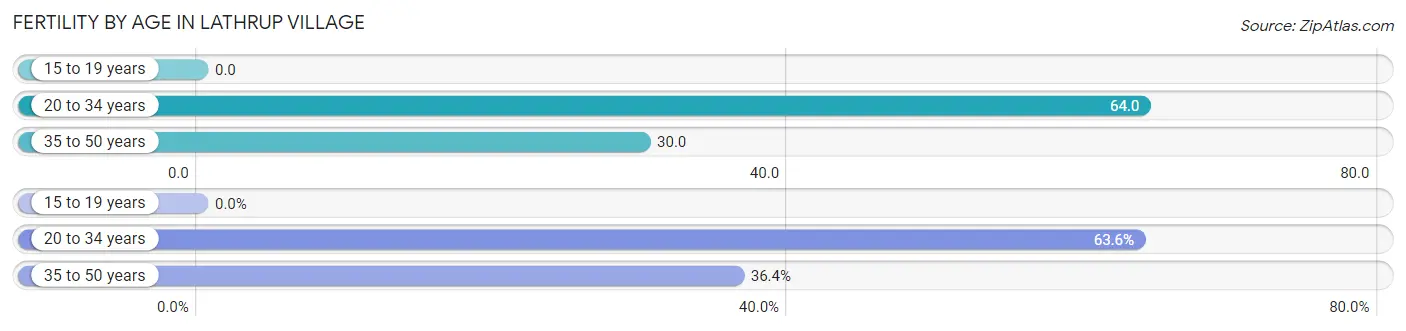
| Age Bracket | Women with Births | Births / 1,000 Women |
| 15 to 19 years | 0 (0.0%) | 0.0 |
| 20 to 34 years | 21 (63.6%) | 64.0 |
| 35 to 50 years | 12 (36.4%) | 30.0 |
| Total | 33 (100.0%) | 37.0 |
Fertility by Age by Marriage Status in Lathrup Village
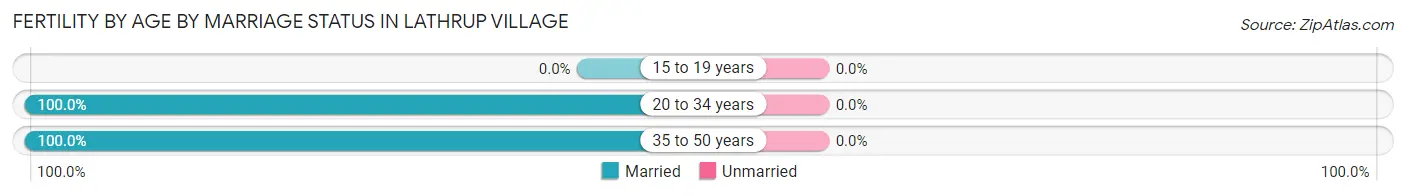
| Age Bracket | Married | Unmarried |
| 15 to 19 years | 0 (0.0%) | 0 (0.0%) |
| 20 to 34 years | 21 (100.0%) | 0 (0.0%) |
| 35 to 50 years | 12 (100.0%) | 0 (0.0%) |
| Total | 33 (100.0%) | 0 (0.0%) |
Fertility by Education in Lathrup Village
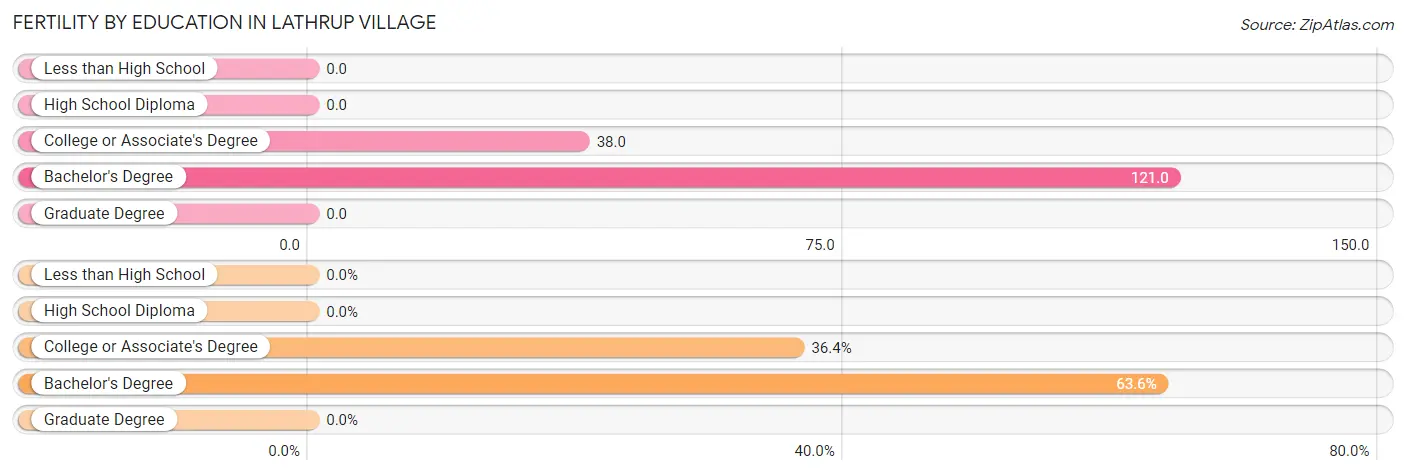
| Educational Attainment | Women with Births | Births / 1,000 Women |
| Less than High School | 0 (0.0%) | 0.0 |
| High School Diploma | 0 (0.0%) | 0.0 |
| College or Associate's Degree | 12 (36.4%) | 38.0 |
| Bachelor's Degree | 21 (63.6%) | 121.0 |
| Graduate Degree | 0 (0.0%) | 0.0 |
| Total | 33 (100.0%) | 37.0 |
Fertility by Education by Marriage Status in Lathrup Village
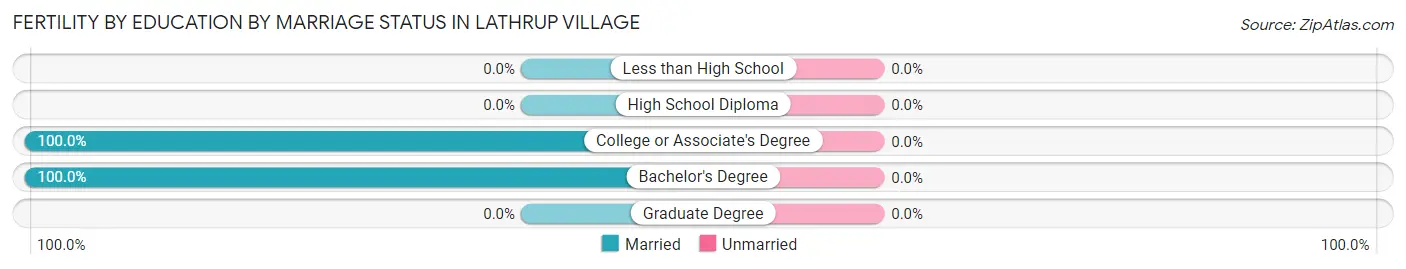
| Educational Attainment | Married | Unmarried |
| Less than High School | 0 (0.0%) | 0 (0.0%) |
| High School Diploma | 0 (0.0%) | 0 (0.0%) |
| College or Associate's Degree | 12 (100.0%) | 0 (0.0%) |
| Bachelor's Degree | 21 (100.0%) | 0 (0.0%) |
| Graduate Degree | 0 (0.0%) | 0 (0.0%) |
| Total | 33 (100.0%) | 0 (0.0%) |
Employment Characteristics in Lathrup Village
Employment by Class of Employer in Lathrup Village
Among the 1,988 employed individuals in Lathrup Village, private company employees (1,182 | 59.5%), not-for-profit organizations (256 | 12.9%), and local government employees (143 | 7.2%) make up the most common classes of employment.
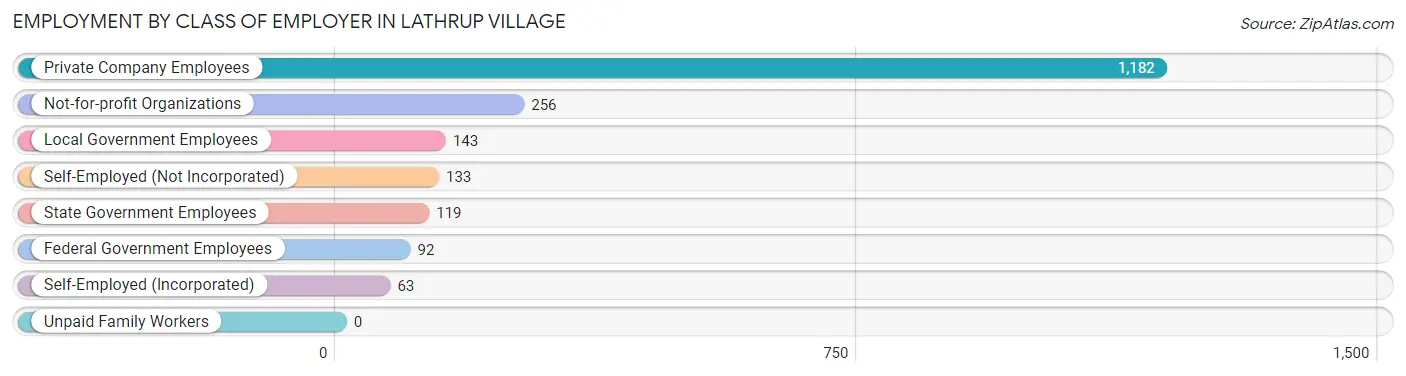
| Employer Class | # Employees | % Employees |
| Private Company Employees | 1,182 | 59.5% |
| Self-Employed (Incorporated) | 63 | 3.2% |
| Self-Employed (Not Incorporated) | 133 | 6.7% |
| Not-for-profit Organizations | 256 | 12.9% |
| Local Government Employees | 143 | 7.2% |
| State Government Employees | 119 | 6.0% |
| Federal Government Employees | 92 | 4.6% |
| Unpaid Family Workers | 0 | 0.0% |
| Total | 1,988 | 100.0% |
Employment Status by Age in Lathrup Village
According to the labor force statistics for Lathrup Village, out of the total population over 16 years of age (3,652), 61.0% or 2,228 individuals are in the labor force, with 7.5% or 167 of them unemployed. The age group with the highest labor force participation rate is 55 to 59 years, with 97.3% or 214 individuals in the labor force. Within the labor force, the 25 to 29 years age range has the highest percentage of unemployed individuals, with 49.0% or 95 of them being unemployed.
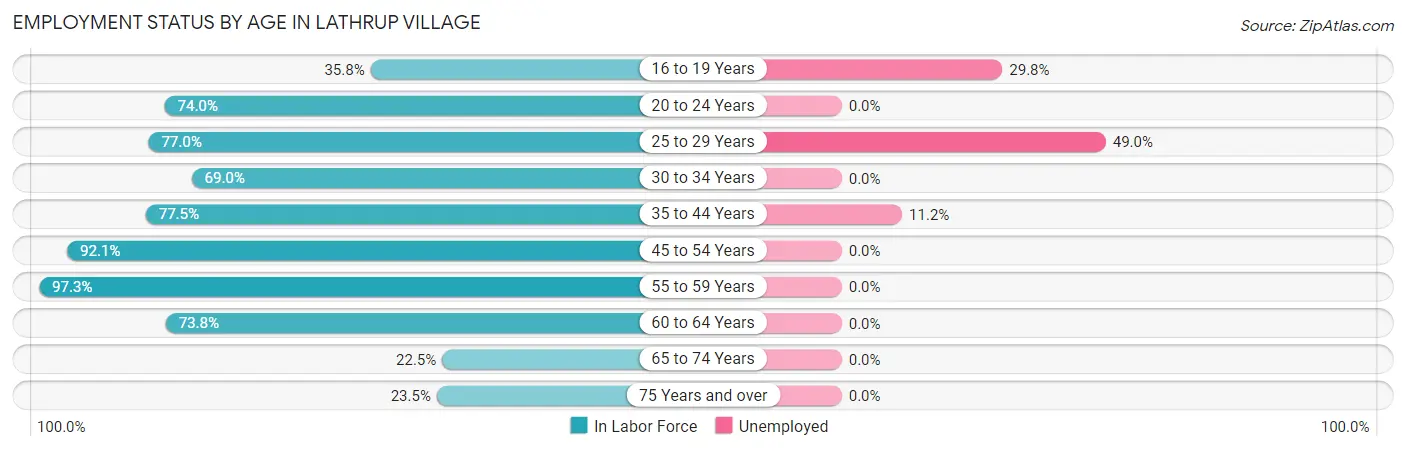
| Age Bracket | In Labor Force | Unemployed |
| 16 to 19 Years | 124 (35.8%) | 37 (29.8%) |
| 20 to 24 Years | 219 (74.0%) | 0 (0.0%) |
| 25 to 29 Years | 194 (77.0%) | 95 (49.0%) |
| 30 to 34 Years | 87 (69.0%) | 0 (0.0%) |
| 35 to 44 Years | 321 (77.5%) | 36 (11.2%) |
| 45 to 54 Years | 606 (92.1%) | 0 (0.0%) |
| 55 to 59 Years | 214 (97.3%) | 0 (0.0%) |
| 60 to 64 Years | 223 (73.8%) | 0 (0.0%) |
| 65 to 74 Years | 124 (22.5%) | 0 (0.0%) |
| 75 Years and over | 114 (23.5%) | 0 (0.0%) |
| Total | 2,228 (61.0%) | 167 (7.5%) |
Employment Status by Educational Attainment in Lathrup Village
According to labor force statistics for Lathrup Village, 83.4% of individuals (1,645) out of the total population between 25 and 64 years of age (1,972) are in the labor force, with 8.0% or 132 of them being unemployed. The group with the highest labor force participation rate are those with the educational attainment of college / associate degree, with 85.5% or 491 individuals in the labor force. Within the labor force, individuals with less than high school education have the highest percentage of unemployment, with 94.4% or 34 of them being unemployed.
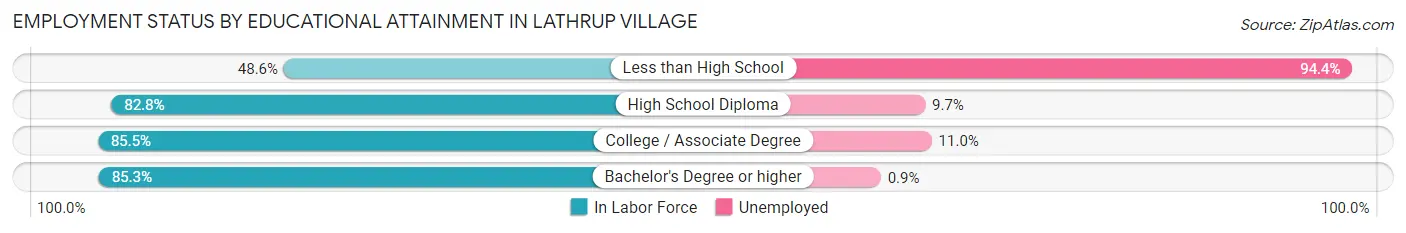
| Educational Attainment | In Labor Force | Unemployed |
| Less than High School | 36 (48.6%) | 70 (94.4%) |
| High School Diploma | 370 (82.8%) | 43 (9.7%) |
| College / Associate Degree | 491 (85.5%) | 63 (11.0%) |
| Bachelor's Degree or higher | 748 (85.3%) | 8 (0.9%) |
| Total | 1,645 (83.4%) | 158 (8.0%) |
Employment Occupations by Sex in Lathrup Village
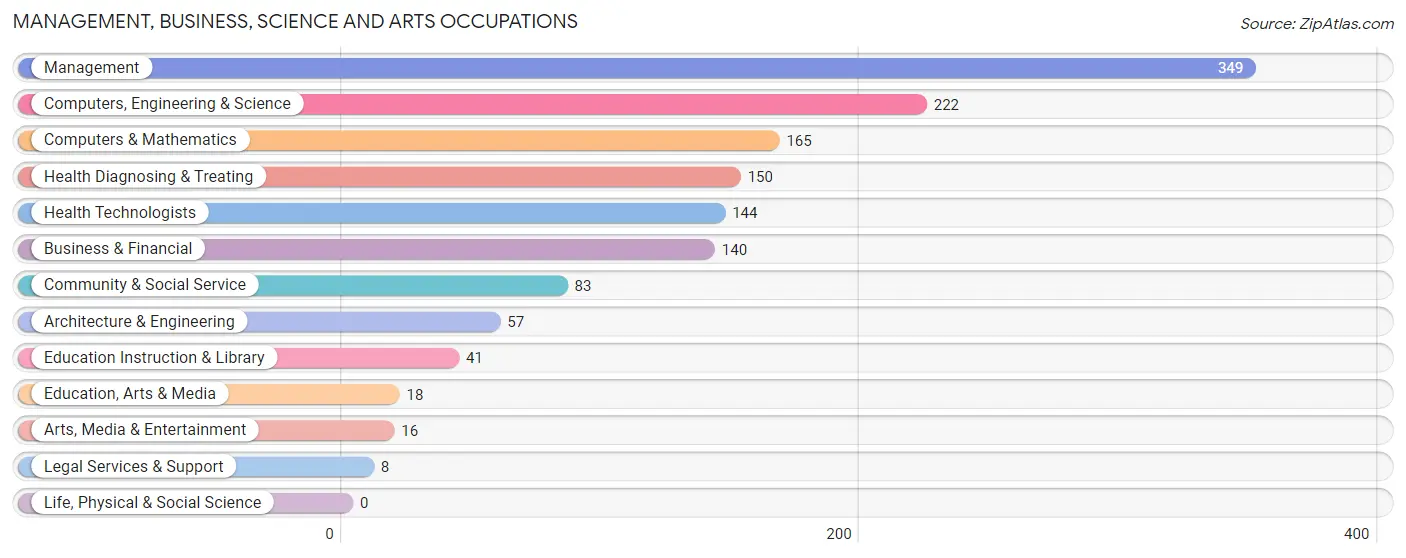
Management, Business, Science and Arts Occupations
The most common Management, Business, Science and Arts occupations in Lathrup Village are Management (349 | 17.0%), Computers, Engineering & Science (222 | 10.8%), Computers & Mathematics (165 | 8.0%), Health Diagnosing & Treating (150 | 7.3%), and Health Technologists (144 | 7.0%).
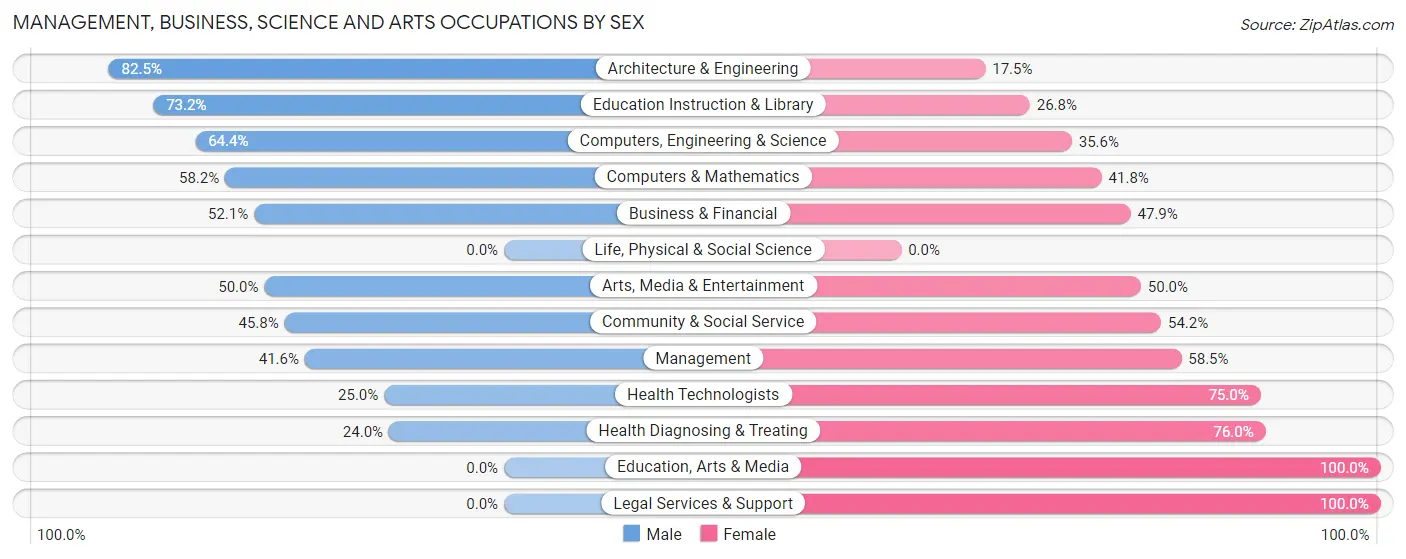
Management, Business, Science and Arts Occupations by Sex
Within the Management, Business, Science and Arts occupations in Lathrup Village, the most male-oriented occupations are Architecture & Engineering (82.5%), Education Instruction & Library (73.2%), and Computers, Engineering & Science (64.4%), while the most female-oriented occupations are Education, Arts & Media (100.0%), Legal Services & Support (100.0%), and Health Diagnosing & Treating (76.0%).
| Occupation | Male | Female |
| Management | 145 (41.5%) | 204 (58.5%) |
| Business & Financial | 73 (52.1%) | 67 (47.9%) |
| Computers, Engineering & Science | 143 (64.4%) | 79 (35.6%) |
| Computers & Mathematics | 96 (58.2%) | 69 (41.8%) |
| Architecture & Engineering | 47 (82.5%) | 10 (17.5%) |
| Life, Physical & Social Science | 0 (0.0%) | 0 (0.0%) |
| Community & Social Service | 38 (45.8%) | 45 (54.2%) |
| Education, Arts & Media | 0 (0.0%) | 18 (100.0%) |
| Legal Services & Support | 0 (0.0%) | 8 (100.0%) |
| Education Instruction & Library | 30 (73.2%) | 11 (26.8%) |
| Arts, Media & Entertainment | 8 (50.0%) | 8 (50.0%) |
| Health Diagnosing & Treating | 36 (24.0%) | 114 (76.0%) |
| Health Technologists | 36 (25.0%) | 108 (75.0%) |
| Total (Category) | 435 (46.1%) | 509 (53.9%) |
| Total (Overall) | 1,000 (48.6%) | 1,058 (51.4%) |
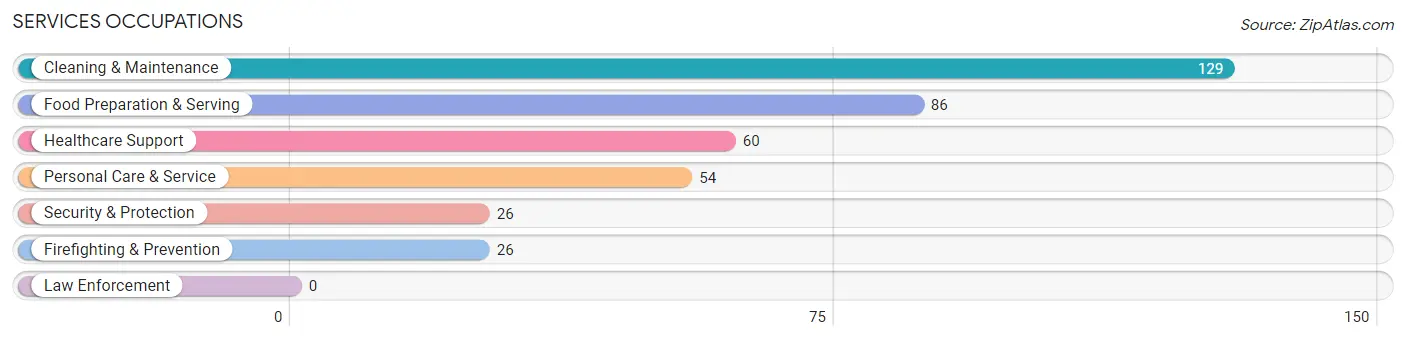
Services Occupations
The most common Services occupations in Lathrup Village are Cleaning & Maintenance (129 | 6.3%), Food Preparation & Serving (86 | 4.2%), Healthcare Support (60 | 2.9%), Personal Care & Service (54 | 2.6%), and Security & Protection (26 | 1.3%).
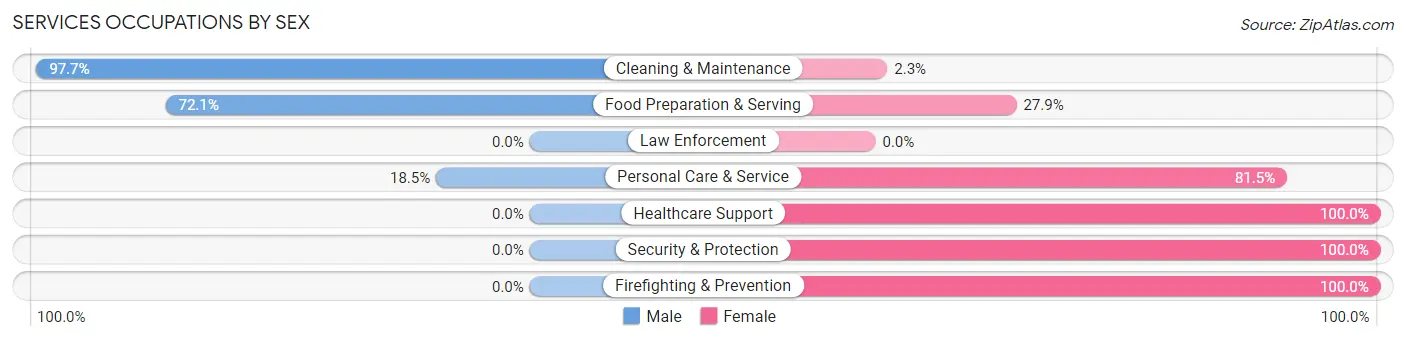
Services Occupations by Sex
Within the Services occupations in Lathrup Village, the most male-oriented occupations are Cleaning & Maintenance (97.7%), Food Preparation & Serving (72.1%), and Personal Care & Service (18.5%), while the most female-oriented occupations are Healthcare Support (100.0%), Security & Protection (100.0%), and Firefighting & Prevention (100.0%).
| Occupation | Male | Female |
| Healthcare Support | 0 (0.0%) | 60 (100.0%) |
| Security & Protection | 0 (0.0%) | 26 (100.0%) |
| Firefighting & Prevention | 0 (0.0%) | 26 (100.0%) |
| Law Enforcement | 0 (0.0%) | 0 (0.0%) |
| Food Preparation & Serving | 62 (72.1%) | 24 (27.9%) |
| Cleaning & Maintenance | 126 (97.7%) | 3 (2.3%) |
| Personal Care & Service | 10 (18.5%) | 44 (81.5%) |
| Total (Category) | 198 (55.8%) | 157 (44.2%) |
| Total (Overall) | 1,000 (48.6%) | 1,058 (51.4%) |
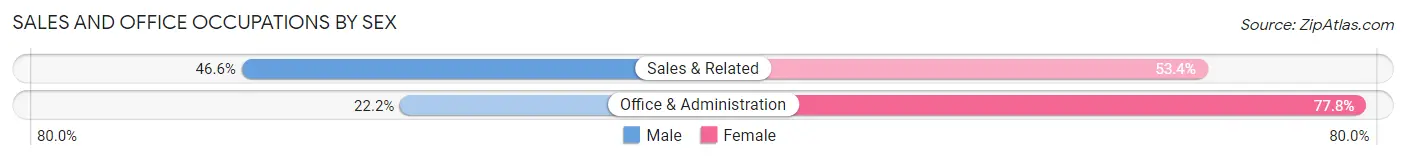
Sales and Office Occupations
The most common Sales and Office occupations in Lathrup Village are Sales & Related (251 | 12.2%), and Office & Administration (234 | 11.4%).

Sales and Office Occupations by Sex
| Occupation | Male | Female |
| Sales & Related | 117 (46.6%) | 134 (53.4%) |
| Office & Administration | 52 (22.2%) | 182 (77.8%) |
| Total (Category) | 169 (34.8%) | 316 (65.1%) |
| Total (Overall) | 1,000 (48.6%) | 1,058 (51.4%) |
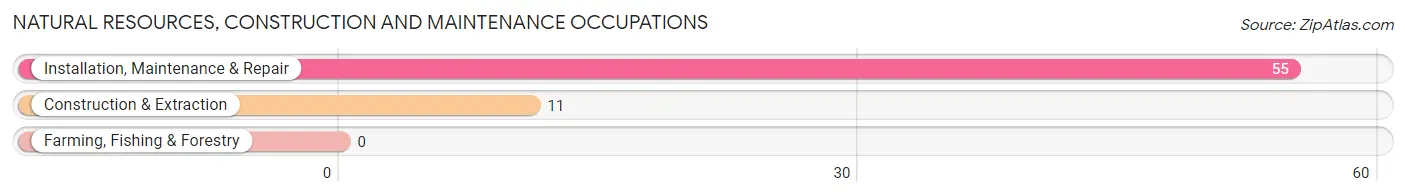
Natural Resources, Construction and Maintenance Occupations
The most common Natural Resources, Construction and Maintenance occupations in Lathrup Village are Installation, Maintenance & Repair (55 | 2.7%), and Construction & Extraction (11 | 0.5%).
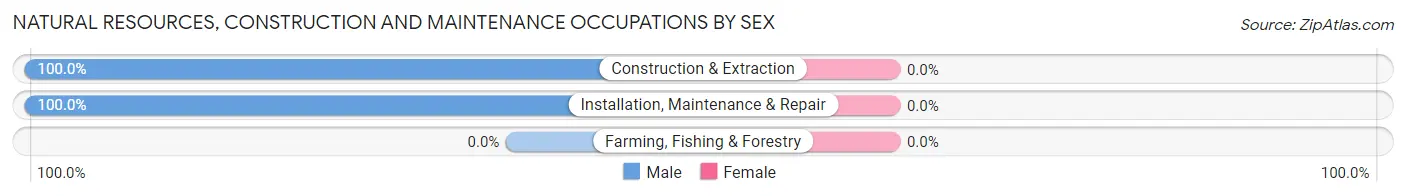
Natural Resources, Construction and Maintenance Occupations by Sex
| Occupation | Male | Female |
| Farming, Fishing & Forestry | 0 (0.0%) | 0 (0.0%) |
| Construction & Extraction | 11 (100.0%) | 0 (0.0%) |
| Installation, Maintenance & Repair | 55 (100.0%) | 0 (0.0%) |
| Total (Category) | 66 (100.0%) | 0 (0.0%) |
| Total (Overall) | 1,000 (48.6%) | 1,058 (51.4%) |
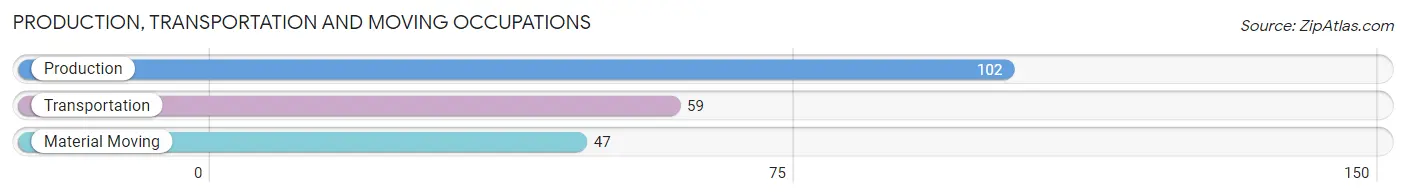
Production, Transportation and Moving Occupations
The most common Production, Transportation and Moving occupations in Lathrup Village are Production (102 | 5.0%), Transportation (59 | 2.9%), and Material Moving (47 | 2.3%).
Production, Transportation and Moving Occupations by Sex
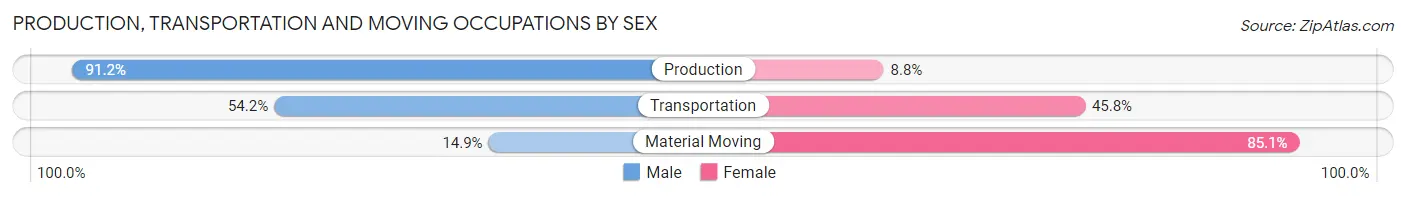
| Occupation | Male | Female |
| Production | 93 (91.2%) | 9 (8.8%) |
| Transportation | 32 (54.2%) | 27 (45.8%) |
| Material Moving | 7 (14.9%) | 40 (85.1%) |
| Total (Category) | 132 (63.5%) | 76 (36.5%) |
| Total (Overall) | 1,000 (48.6%) | 1,058 (51.4%) |
Employment Industries by Sex in Lathrup Village
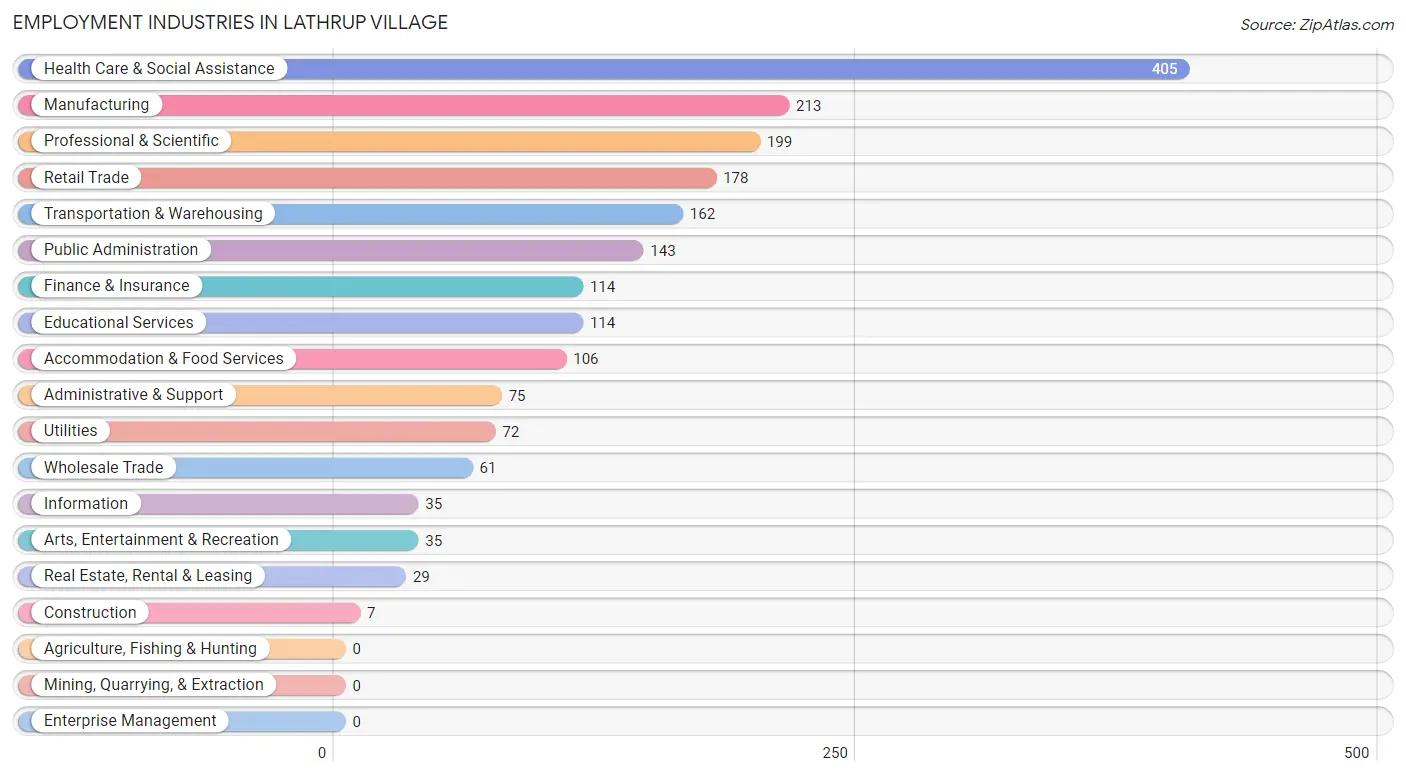
Employment Industries in Lathrup Village
The major employment industries in Lathrup Village include Health Care & Social Assistance (405 | 19.7%), Manufacturing (213 | 10.3%), Professional & Scientific (199 | 9.7%), Retail Trade (178 | 8.6%), and Transportation & Warehousing (162 | 7.9%).
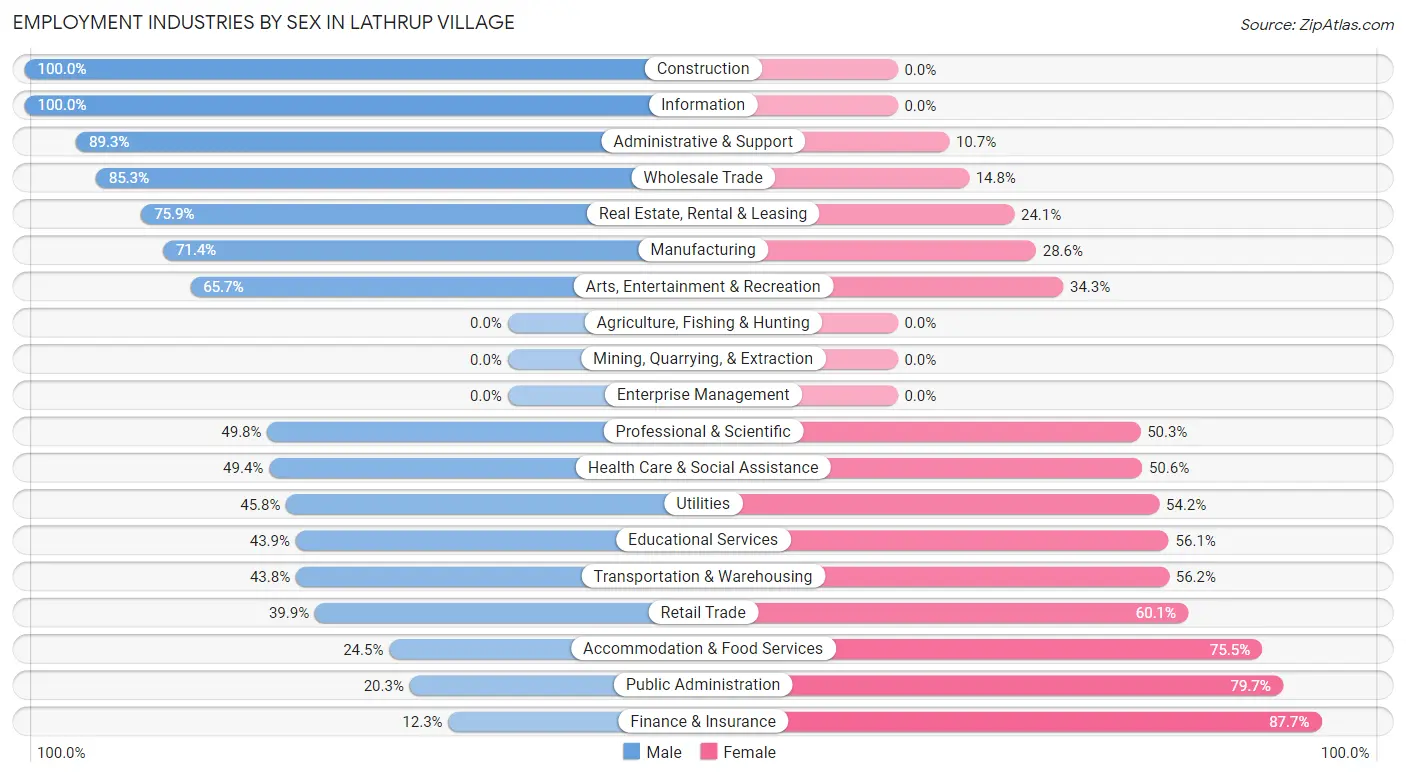
Employment Industries by Sex in Lathrup Village
The Lathrup Village industries that see more men than women are Construction (100.0%), Information (100.0%), and Administrative & Support (89.3%), whereas the industries that tend to have a higher number of women are Finance & Insurance (87.7%), Public Administration (79.7%), and Accommodation & Food Services (75.5%).
| Industry | Male | Female |
| Agriculture, Fishing & Hunting | 0 (0.0%) | 0 (0.0%) |
| Mining, Quarrying, & Extraction | 0 (0.0%) | 0 (0.0%) |
| Construction | 7 (100.0%) | 0 (0.0%) |
| Manufacturing | 152 (71.4%) | 61 (28.6%) |
| Wholesale Trade | 52 (85.3%) | 9 (14.7%) |
| Retail Trade | 71 (39.9%) | 107 (60.1%) |
| Transportation & Warehousing | 71 (43.8%) | 91 (56.2%) |
| Utilities | 33 (45.8%) | 39 (54.2%) |
| Information | 35 (100.0%) | 0 (0.0%) |
| Finance & Insurance | 14 (12.3%) | 100 (87.7%) |
| Real Estate, Rental & Leasing | 22 (75.9%) | 7 (24.1%) |
| Professional & Scientific | 99 (49.7%) | 100 (50.2%) |
| Enterprise Management | 0 (0.0%) | 0 (0.0%) |
| Administrative & Support | 67 (89.3%) | 8 (10.7%) |
| Educational Services | 50 (43.9%) | 64 (56.1%) |
| Health Care & Social Assistance | 200 (49.4%) | 205 (50.6%) |
| Arts, Entertainment & Recreation | 23 (65.7%) | 12 (34.3%) |
| Accommodation & Food Services | 26 (24.5%) | 80 (75.5%) |
| Public Administration | 29 (20.3%) | 114 (79.7%) |
| Total | 1,000 (48.6%) | 1,058 (51.4%) |
Education in Lathrup Village
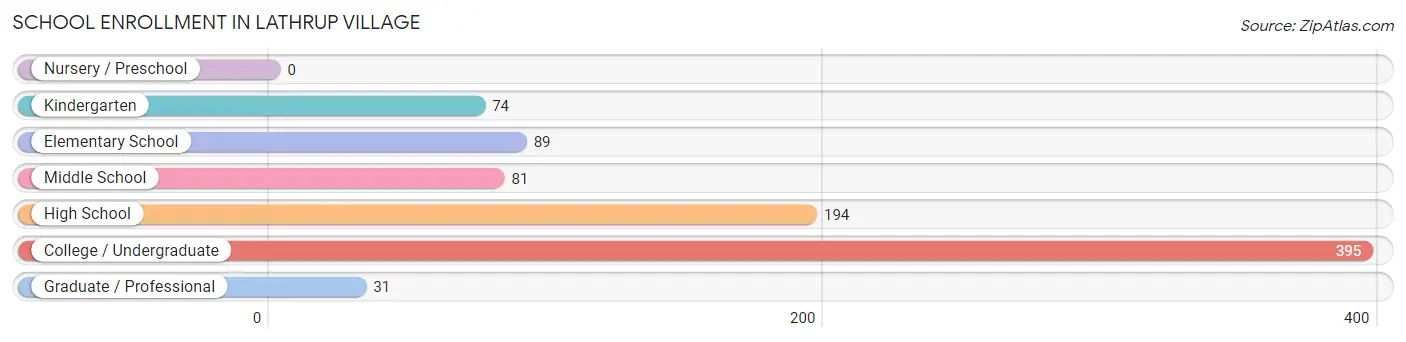
School Enrollment in Lathrup Village
The most common levels of schooling among the 864 students in Lathrup Village are college / undergraduate (395 | 45.7%), high school (194 | 22.5%), and elementary school (89 | 10.3%).
| School Level | # Students | % Students |
| Nursery / Preschool | 0 | 0.0% |
| Kindergarten | 74 | 8.6% |
| Elementary School | 89 | 10.3% |
| Middle School | 81 | 9.4% |
| High School | 194 | 22.5% |
| College / Undergraduate | 395 | 45.7% |
| Graduate / Professional | 31 | 3.6% |
| Total | 864 | 100.0% |
School Enrollment by Age by Funding Source in Lathrup Village
Out of a total of 864 students who are enrolled in schools in Lathrup Village, 183 (21.2%) attend a private institution, while the remaining 681 (78.8%) are enrolled in public schools. The age group of 35 years and over has the highest likelihood of being enrolled in private schools, with 24 (75.0% in the age bracket) enrolled. Conversely, the age group of 25 to 34 year olds has the lowest likelihood of being enrolled in a private school, with 65 (100.0% in the age bracket) attending a public institution.
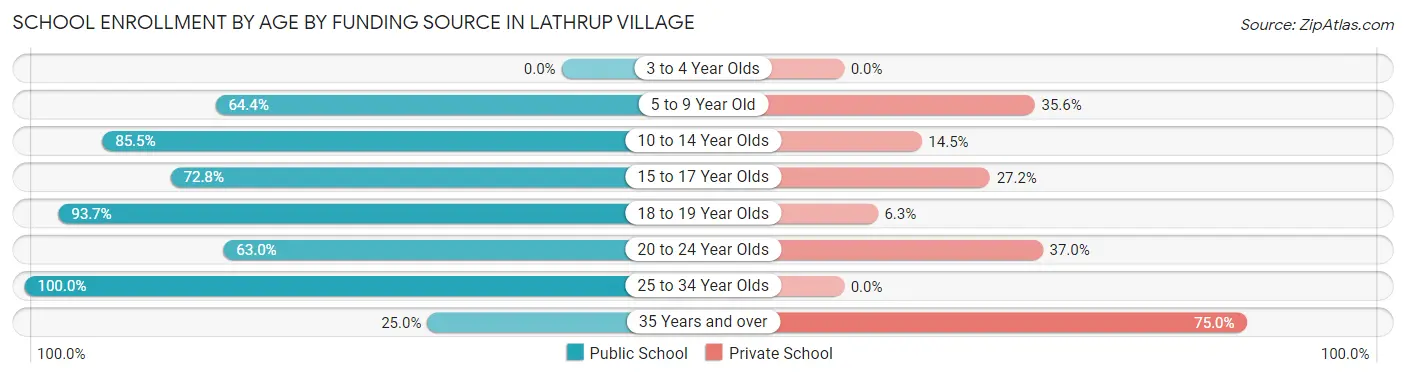
| Age Bracket | Public School | Private School |
| 3 to 4 Year Olds | 0 (0.0%) | 0 (0.0%) |
| 5 to 9 Year Old | 87 (64.4%) | 48 (35.6%) |
| 10 to 14 Year Olds | 124 (85.5%) | 21 (14.5%) |
| 15 to 17 Year Olds | 91 (72.8%) | 34 (27.2%) |
| 18 to 19 Year Olds | 238 (93.7%) | 16 (6.3%) |
| 20 to 24 Year Olds | 68 (63.0%) | 40 (37.0%) |
| 25 to 34 Year Olds | 65 (100.0%) | 0 (0.0%) |
| 35 Years and over | 8 (25.0%) | 24 (75.0%) |
| Total | 681 (78.8%) | 183 (21.2%) |
Educational Attainment by Field of Study in Lathrup Village
Business (230 | 14.0%), arts & humanities (204 | 12.4%), social sciences (196 | 11.9%), engineering (174 | 10.6%), and literature & languages (149 | 9.0%) are the most common fields of study among 1,646 individuals in Lathrup Village who have obtained a bachelor's degree or higher.
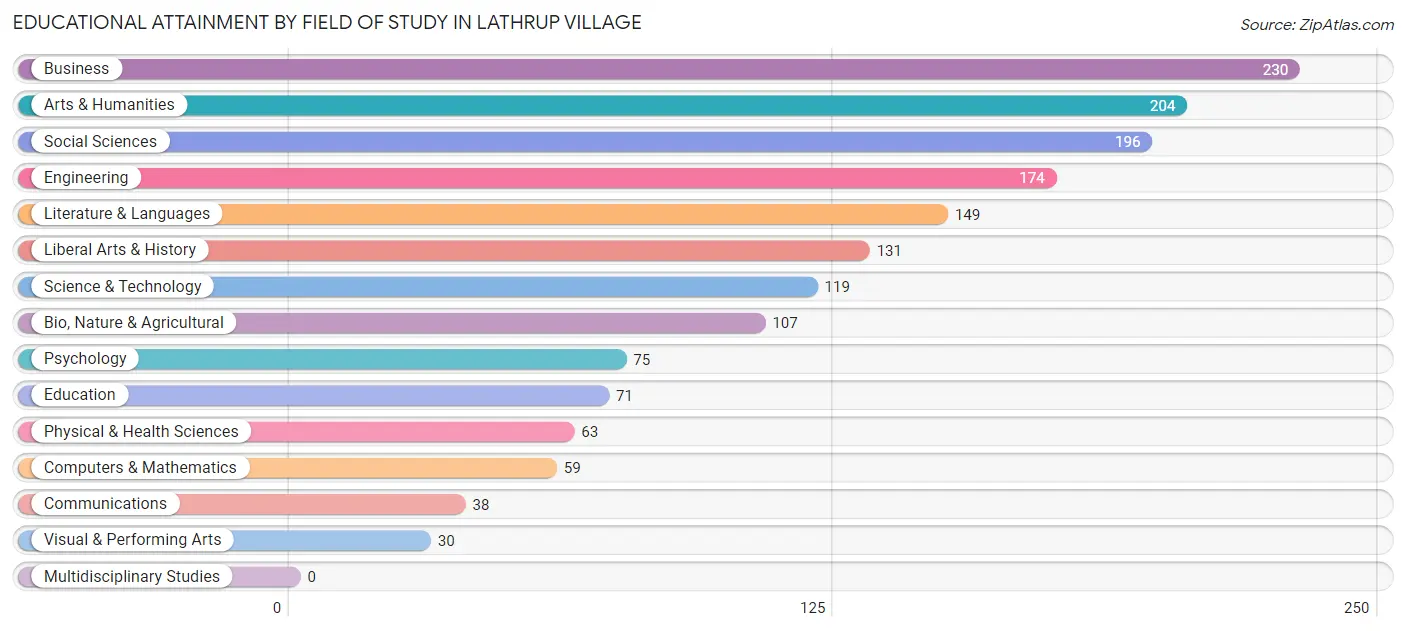
| Field of Study | # Graduates | % Graduates |
| Computers & Mathematics | 59 | 3.6% |
| Bio, Nature & Agricultural | 107 | 6.5% |
| Physical & Health Sciences | 63 | 3.8% |
| Psychology | 75 | 4.6% |
| Social Sciences | 196 | 11.9% |
| Engineering | 174 | 10.6% |
| Multidisciplinary Studies | 0 | 0.0% |
| Science & Technology | 119 | 7.2% |
| Business | 230 | 14.0% |
| Education | 71 | 4.3% |
| Literature & Languages | 149 | 9.0% |
| Liberal Arts & History | 131 | 8.0% |
| Visual & Performing Arts | 30 | 1.8% |
| Communications | 38 | 2.3% |
| Arts & Humanities | 204 | 12.4% |
| Total | 1,646 | 100.0% |
Transportation & Commute in Lathrup Village
Vehicle Availability by Sex in Lathrup Village
The most prevalent vehicle ownership categories in Lathrup Village are males with 2 vehicles (538, accounting for 56.2%) and females with 2 vehicles (379, making up 52.3%).
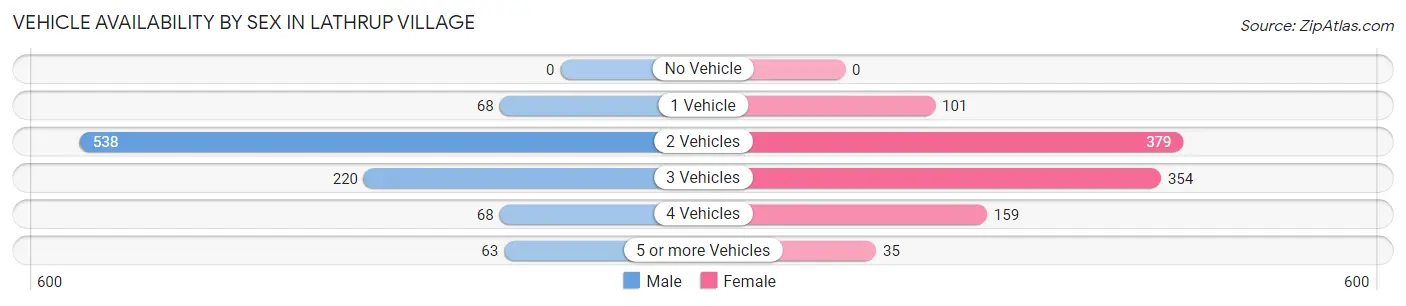
| Vehicles Available | Male | Female |
| No Vehicle | 0 (0.0%) | 0 (0.0%) |
| 1 Vehicle | 68 (7.1%) | 101 (9.8%) |
| 2 Vehicles | 538 (56.2%) | 379 (36.9%) |
| 3 Vehicles | 220 (23.0%) | 354 (34.4%) |
| 4 Vehicles | 68 (7.1%) | 159 (15.5%) |
| 5 or more Vehicles | 63 (6.6%) | 35 (3.4%) |
| Total | 957 (100.0%) | 1,028 (100.0%) |
Commute Time in Lathrup Village
The most frequently occuring commute durations in Lathrup Village are 20 to 24 minutes (581 commuters, 34.4%), 15 to 19 minutes (291 commuters, 17.2%), and 30 to 34 minutes (291 commuters, 17.2%).
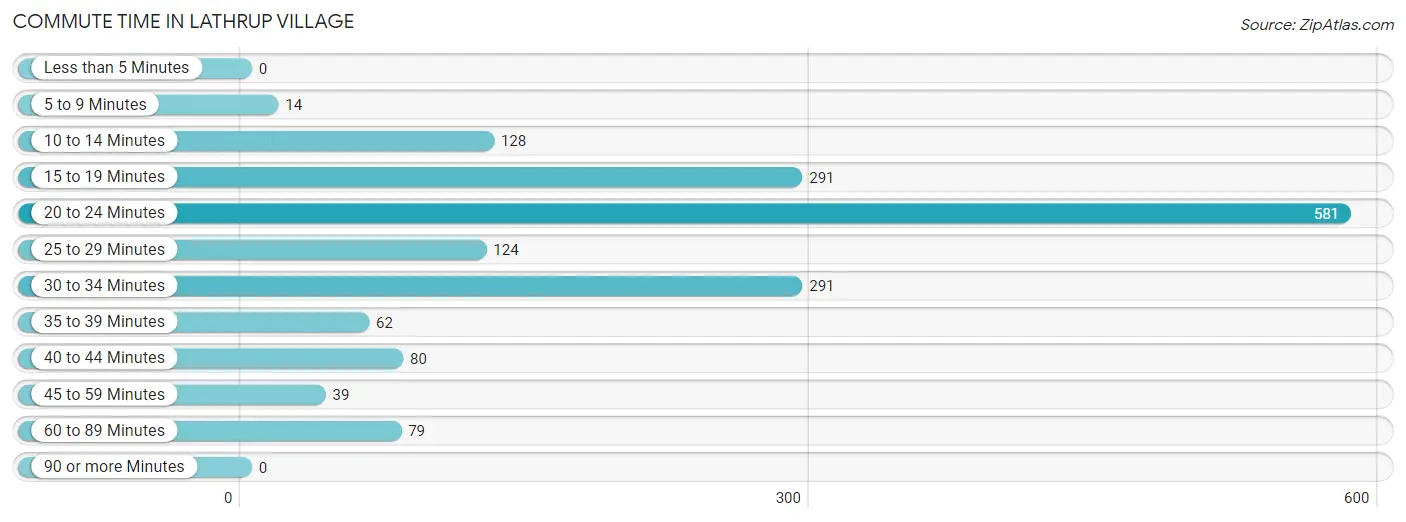
| Commute Time | # Commuters | % Commuters |
| Less than 5 Minutes | 0 | 0.0% |
| 5 to 9 Minutes | 14 | 0.8% |
| 10 to 14 Minutes | 128 | 7.6% |
| 15 to 19 Minutes | 291 | 17.2% |
| 20 to 24 Minutes | 581 | 34.4% |
| 25 to 29 Minutes | 124 | 7.3% |
| 30 to 34 Minutes | 291 | 17.2% |
| 35 to 39 Minutes | 62 | 3.7% |
| 40 to 44 Minutes | 80 | 4.7% |
| 45 to 59 Minutes | 39 | 2.3% |
| 60 to 89 Minutes | 79 | 4.7% |
| 90 or more Minutes | 0 | 0.0% |
Commute Time by Sex in Lathrup Village
The most common commute times in Lathrup Village are 15 to 19 minutes (235 commuters, 25.9%) for males and 20 to 24 minutes (366 commuters, 46.9%) for females.
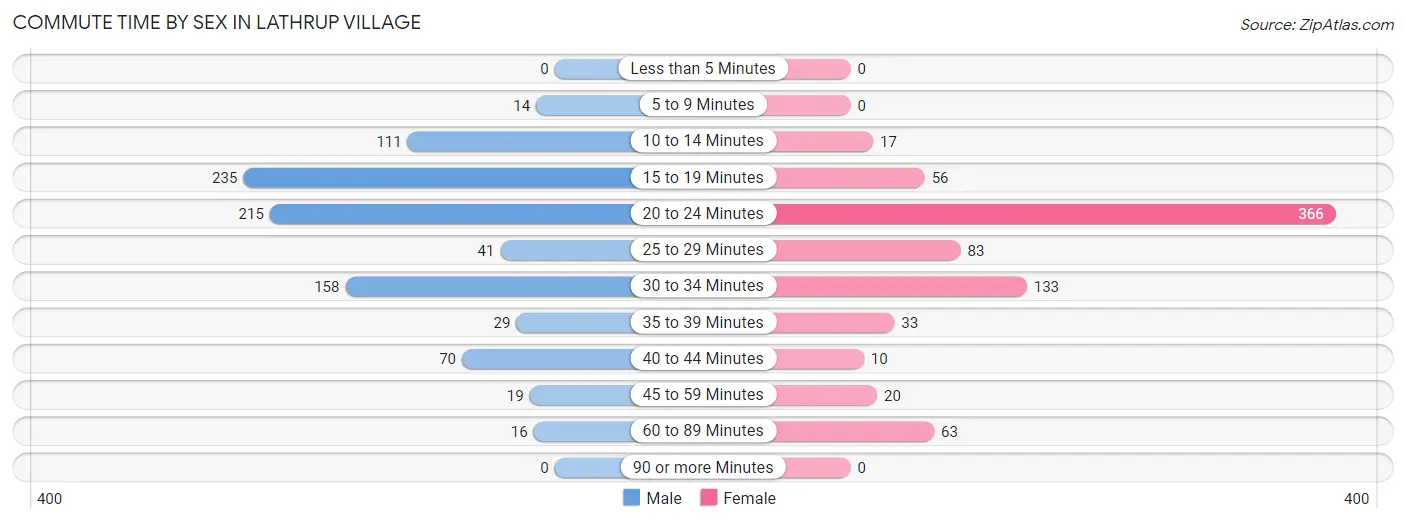
| Commute Time | Male | Female |
| Less than 5 Minutes | 0 (0.0%) | 0 (0.0%) |
| 5 to 9 Minutes | 14 (1.5%) | 0 (0.0%) |
| 10 to 14 Minutes | 111 (12.2%) | 17 (2.2%) |
| 15 to 19 Minutes | 235 (25.9%) | 56 (7.2%) |
| 20 to 24 Minutes | 215 (23.7%) | 366 (46.9%) |
| 25 to 29 Minutes | 41 (4.5%) | 83 (10.6%) |
| 30 to 34 Minutes | 158 (17.4%) | 133 (17.0%) |
| 35 to 39 Minutes | 29 (3.2%) | 33 (4.2%) |
| 40 to 44 Minutes | 70 (7.7%) | 10 (1.3%) |
| 45 to 59 Minutes | 19 (2.1%) | 20 (2.6%) |
| 60 to 89 Minutes | 16 (1.8%) | 63 (8.1%) |
| 90 or more Minutes | 0 (0.0%) | 0 (0.0%) |
Time of Departure to Work by Sex in Lathrup Village
The most frequent times of departure to work in Lathrup Village are 9:00 AM to 9:59 AM (177, 19.5%) for males and 7:00 AM to 7:29 AM (310, 39.7%) for females.
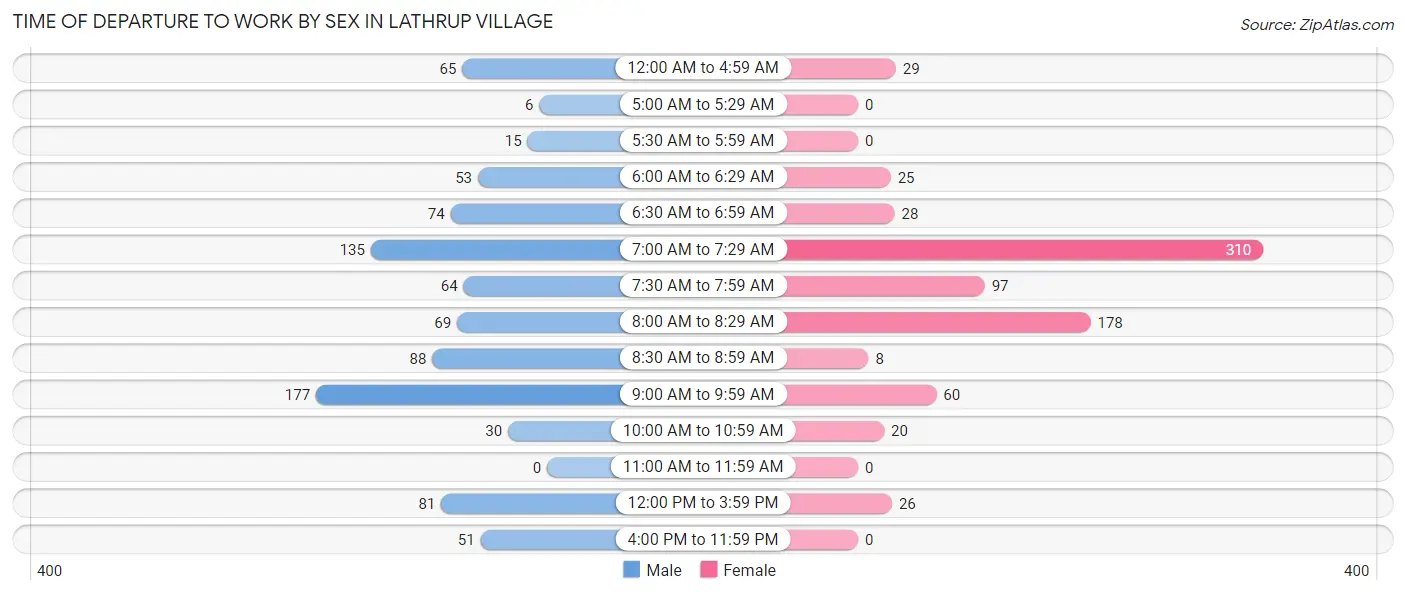
| Time of Departure | Male | Female |
| 12:00 AM to 4:59 AM | 65 (7.2%) | 29 (3.7%) |
| 5:00 AM to 5:29 AM | 6 (0.7%) | 0 (0.0%) |
| 5:30 AM to 5:59 AM | 15 (1.7%) | 0 (0.0%) |
| 6:00 AM to 6:29 AM | 53 (5.8%) | 25 (3.2%) |
| 6:30 AM to 6:59 AM | 74 (8.2%) | 28 (3.6%) |
| 7:00 AM to 7:29 AM | 135 (14.9%) | 310 (39.7%) |
| 7:30 AM to 7:59 AM | 64 (7.0%) | 97 (12.4%) |
| 8:00 AM to 8:29 AM | 69 (7.6%) | 178 (22.8%) |
| 8:30 AM to 8:59 AM | 88 (9.7%) | 8 (1.0%) |
| 9:00 AM to 9:59 AM | 177 (19.5%) | 60 (7.7%) |
| 10:00 AM to 10:59 AM | 30 (3.3%) | 20 (2.6%) |
| 11:00 AM to 11:59 AM | 0 (0.0%) | 0 (0.0%) |
| 12:00 PM to 3:59 PM | 81 (8.9%) | 26 (3.3%) |
| 4:00 PM to 11:59 PM | 51 (5.6%) | 0 (0.0%) |
| Total | 908 (100.0%) | 781 (100.0%) |
Housing Occupancy in Lathrup Village
Occupancy by Ownership in Lathrup Village
Of the total 1,574 dwellings in Lathrup Village, owner-occupied units account for 1,435 (91.2%), while renter-occupied units make up 139 (8.8%).
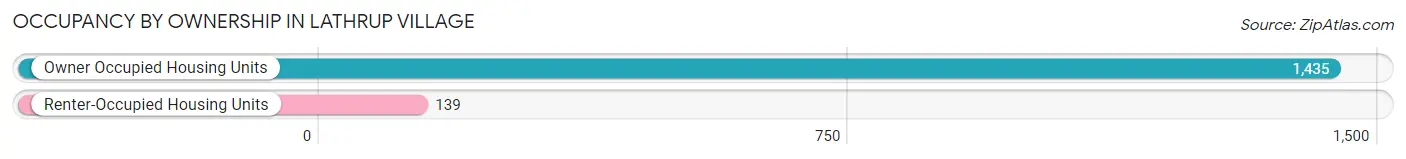
| Occupancy | # Housing Units | % Housing Units |
| Owner Occupied Housing Units | 1,435 | 91.2% |
| Renter-Occupied Housing Units | 139 | 8.8% |
| Total Occupied Housing Units | 1,574 | 100.0% |
Occupancy by Household Size in Lathrup Village
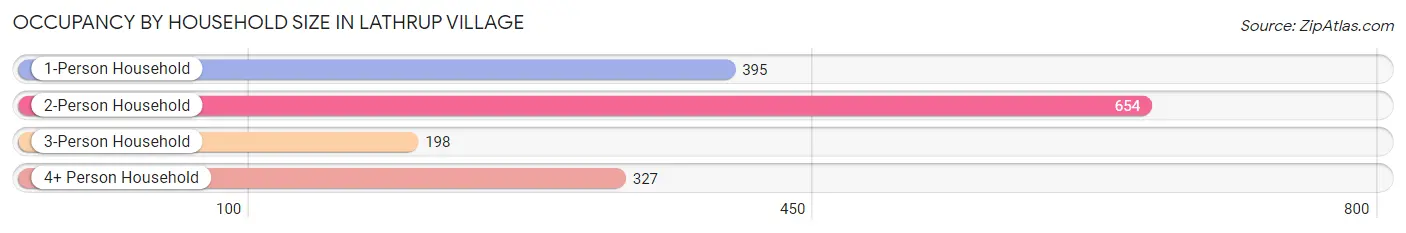
| Household Size | # Housing Units | % Housing Units |
| 1-Person Household | 395 | 25.1% |
| 2-Person Household | 654 | 41.5% |
| 3-Person Household | 198 | 12.6% |
| 4+ Person Household | 327 | 20.8% |
| Total Housing Units | 1,574 | 100.0% |
Occupancy by Ownership by Household Size in Lathrup Village
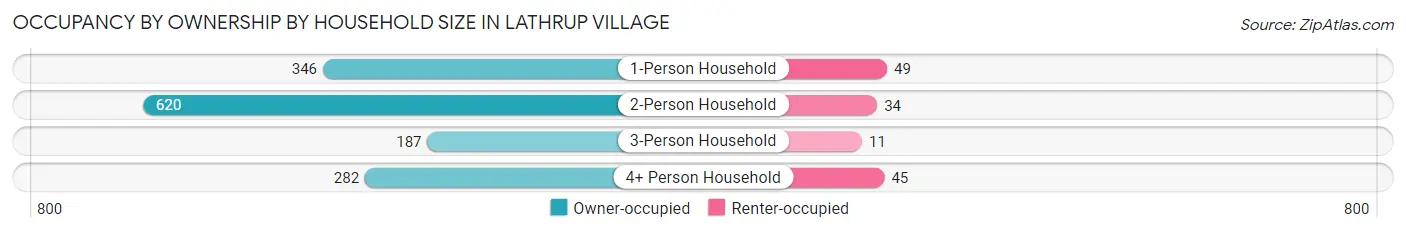
| Household Size | Owner-occupied | Renter-occupied |
| 1-Person Household | 346 (87.6%) | 49 (12.4%) |
| 2-Person Household | 620 (94.8%) | 34 (5.2%) |
| 3-Person Household | 187 (94.4%) | 11 (5.6%) |
| 4+ Person Household | 282 (86.2%) | 45 (13.8%) |
| Total Housing Units | 1,435 (91.2%) | 139 (8.8%) |
Occupancy by Educational Attainment in Lathrup Village
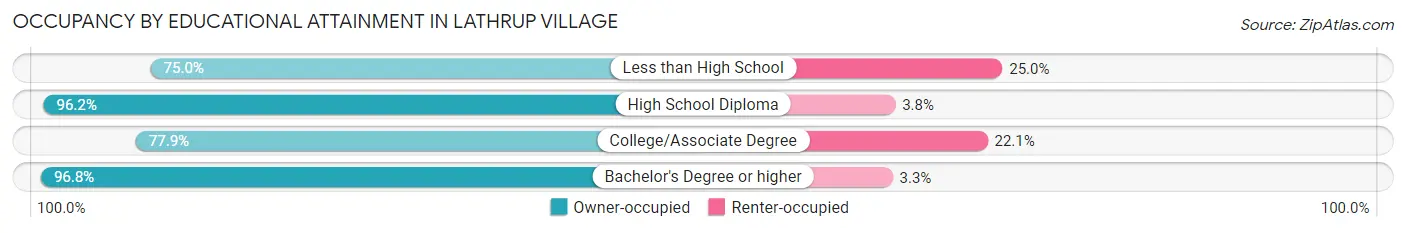
| Household Size | Owner-occupied | Renter-occupied |
| Less than High School | 36 (75.0%) | 12 (25.0%) |
| High School Diploma | 281 (96.2%) | 11 (3.8%) |
| College/Associate Degree | 314 (77.9%) | 89 (22.1%) |
| Bachelor's Degree or higher | 804 (96.8%) | 27 (3.3%) |
Occupancy by Age of Householder in Lathrup Village
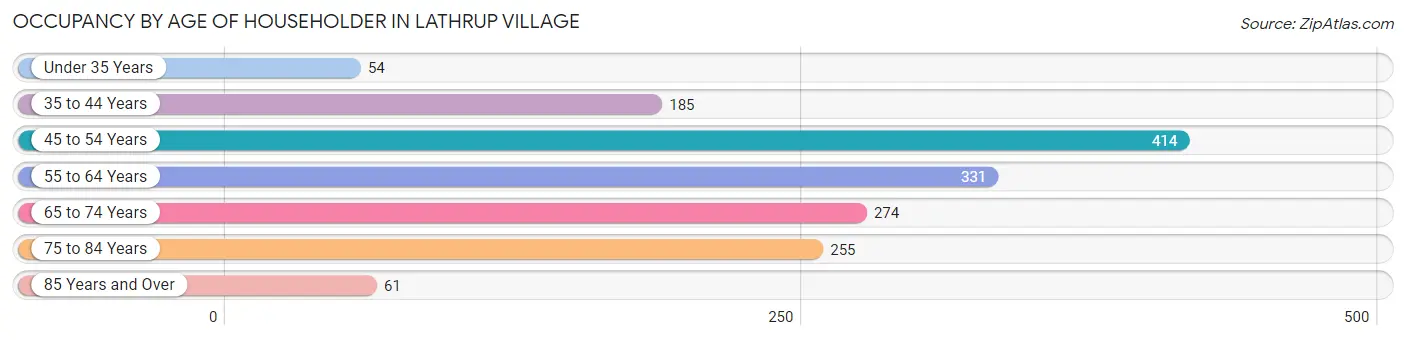
| Age Bracket | # Households | % Households |
| Under 35 Years | 54 | 3.4% |
| 35 to 44 Years | 185 | 11.7% |
| 45 to 54 Years | 414 | 26.3% |
| 55 to 64 Years | 331 | 21.0% |
| 65 to 74 Years | 274 | 17.4% |
| 75 to 84 Years | 255 | 16.2% |
| 85 Years and Over | 61 | 3.9% |
| Total | 1,574 | 100.0% |
Housing Finances in Lathrup Village
Median Income by Occupancy in Lathrup Village
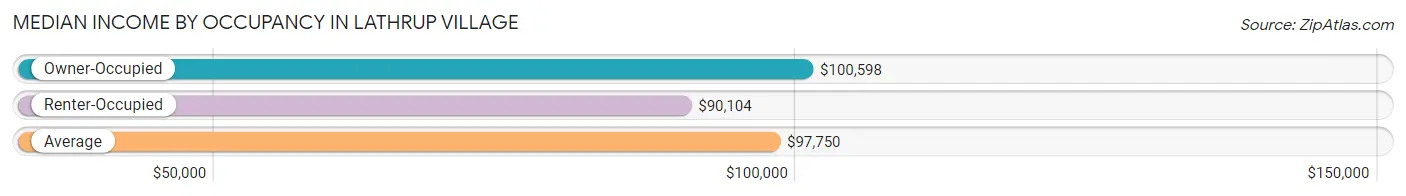
| Occupancy Type | # Households | Median Income |
| Owner-Occupied | 1,435 (91.2%) | $100,598 |
| Renter-Occupied | 139 (8.8%) | $90,104 |
| Average | 1,574 (100.0%) | $97,750 |
Occupancy by Householder Income Bracket in Lathrup Village
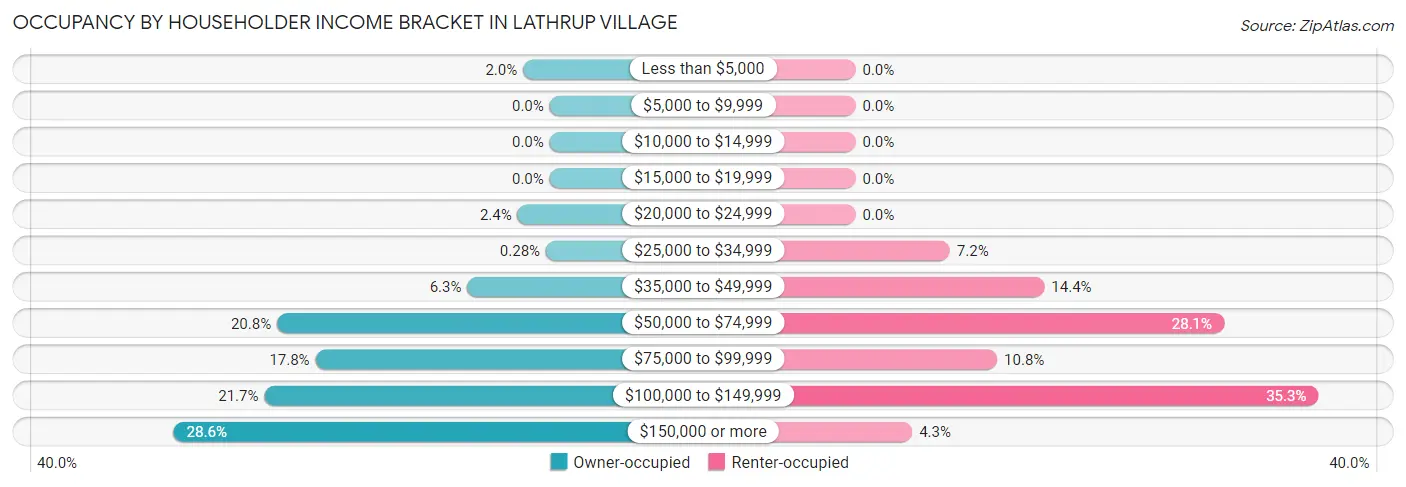
| Income Bracket | Owner-occupied | Renter-occupied |
| Less than $5,000 | 29 (2.0%) | 0 (0.0%) |
| $5,000 to $9,999 | 0 (0.0%) | 0 (0.0%) |
| $10,000 to $14,999 | 0 (0.0%) | 0 (0.0%) |
| $15,000 to $19,999 | 0 (0.0%) | 0 (0.0%) |
| $20,000 to $24,999 | 35 (2.4%) | 0 (0.0%) |
| $25,000 to $34,999 | 4 (0.3%) | 10 (7.2%) |
| $35,000 to $49,999 | 90 (6.3%) | 20 (14.4%) |
| $50,000 to $74,999 | 298 (20.8%) | 39 (28.1%) |
| $75,000 to $99,999 | 256 (17.8%) | 15 (10.8%) |
| $100,000 to $149,999 | 312 (21.7%) | 49 (35.2%) |
| $150,000 or more | 411 (28.6%) | 6 (4.3%) |
| Total | 1,435 (100.0%) | 139 (100.0%) |
Monthly Housing Cost Tiers in Lathrup Village
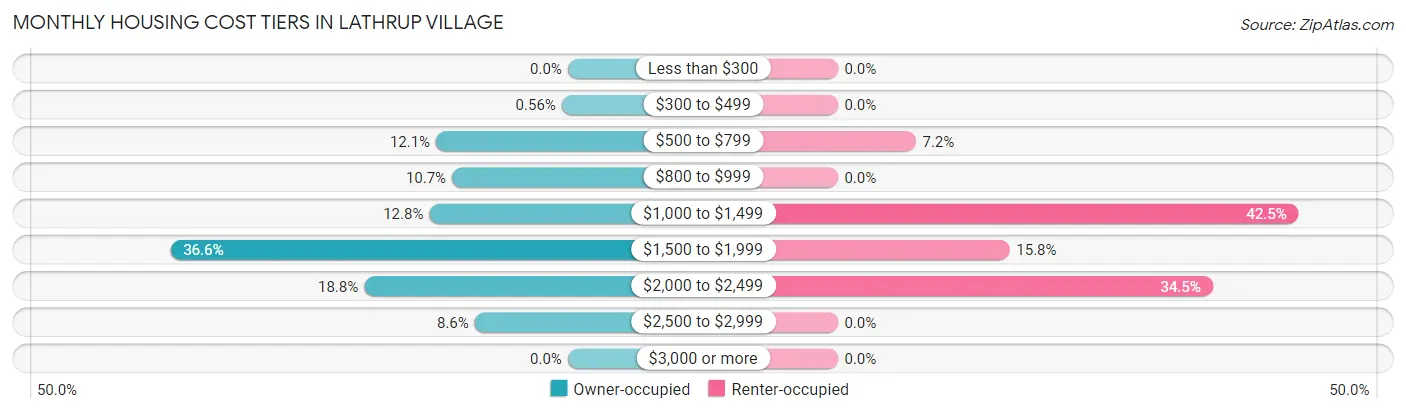
| Monthly Cost | Owner-occupied | Renter-occupied |
| Less than $300 | 0 (0.0%) | 0 (0.0%) |
| $300 to $499 | 8 (0.6%) | 0 (0.0%) |
| $500 to $799 | 174 (12.1%) | 10 (7.2%) |
| $800 to $999 | 153 (10.7%) | 0 (0.0%) |
| $1,000 to $1,499 | 183 (12.8%) | 59 (42.4%) |
| $1,500 to $1,999 | 525 (36.6%) | 22 (15.8%) |
| $2,000 to $2,499 | 269 (18.8%) | 48 (34.5%) |
| $2,500 to $2,999 | 123 (8.6%) | 0 (0.0%) |
| $3,000 or more | 0 (0.0%) | 0 (0.0%) |
| Total | 1,435 (100.0%) | 139 (100.0%) |
Physical Housing Characteristics in Lathrup Village
Housing Structures in Lathrup Village
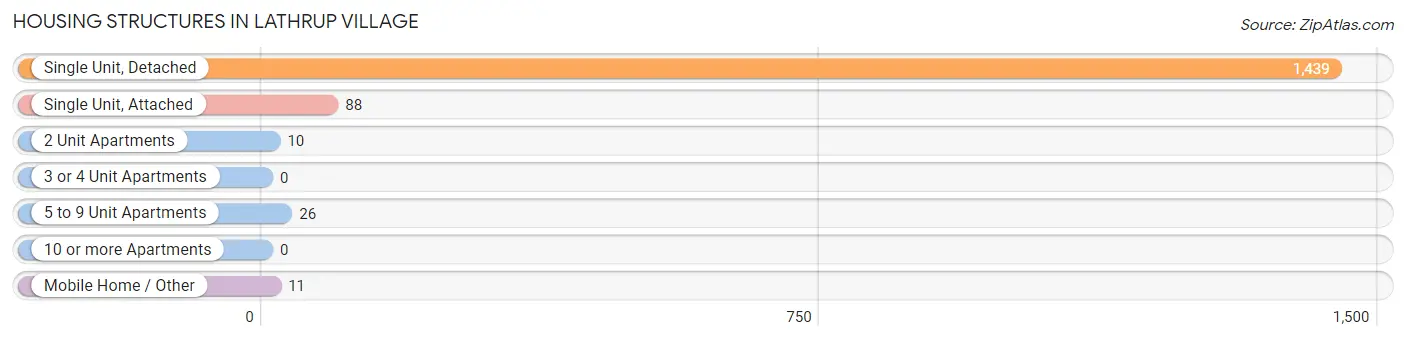
| Structure Type | # Housing Units | % Housing Units |
| Single Unit, Detached | 1,439 | 91.4% |
| Single Unit, Attached | 88 | 5.6% |
| 2 Unit Apartments | 10 | 0.6% |
| 3 or 4 Unit Apartments | 0 | 0.0% |
| 5 to 9 Unit Apartments | 26 | 1.7% |
| 10 or more Apartments | 0 | 0.0% |
| Mobile Home / Other | 11 | 0.7% |
| Total | 1,574 | 100.0% |
Housing Structures by Occupancy in Lathrup Village
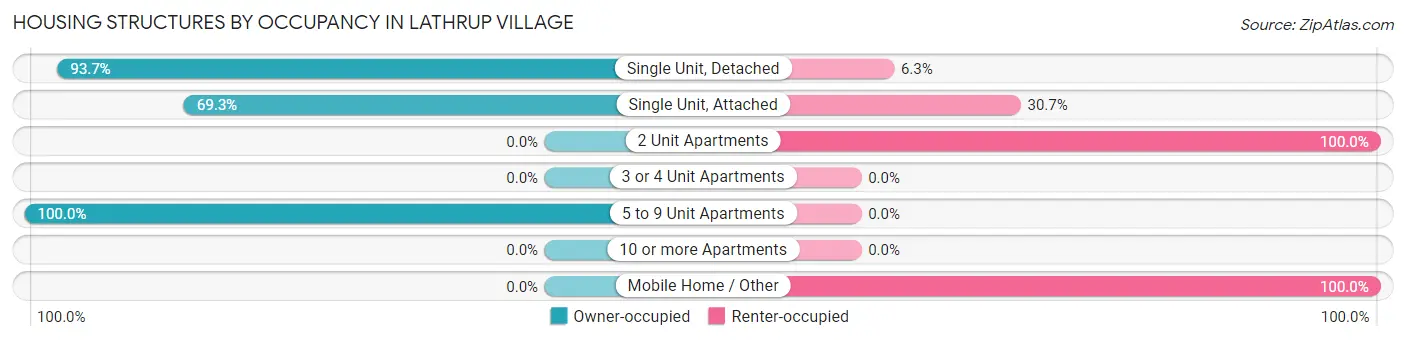
| Structure Type | Owner-occupied | Renter-occupied |
| Single Unit, Detached | 1,348 (93.7%) | 91 (6.3%) |
| Single Unit, Attached | 61 (69.3%) | 27 (30.7%) |
| 2 Unit Apartments | 0 (0.0%) | 10 (100.0%) |
| 3 or 4 Unit Apartments | 0 (0.0%) | 0 (0.0%) |
| 5 to 9 Unit Apartments | 26 (100.0%) | 0 (0.0%) |
| 10 or more Apartments | 0 (0.0%) | 0 (0.0%) |
| Mobile Home / Other | 0 (0.0%) | 11 (100.0%) |
| Total | 1,435 (91.2%) | 139 (8.8%) |
Housing Structures by Number of Rooms in Lathrup Village
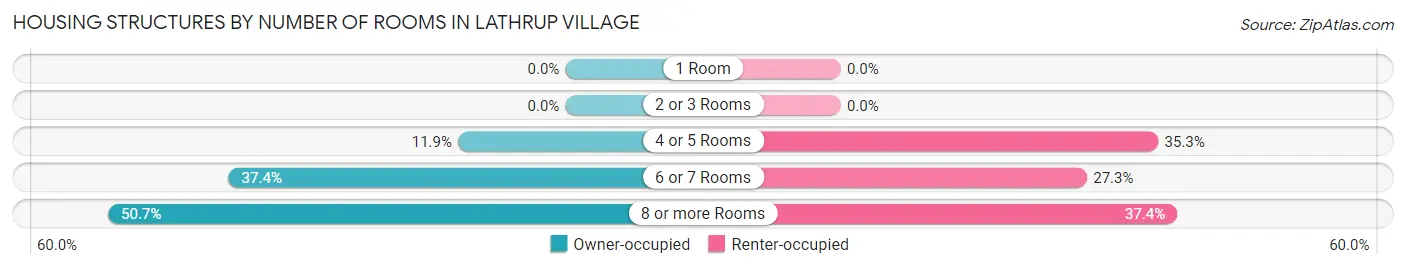
| Number of Rooms | Owner-occupied | Renter-occupied |
| 1 Room | 0 (0.0%) | 0 (0.0%) |
| 2 or 3 Rooms | 0 (0.0%) | 0 (0.0%) |
| 4 or 5 Rooms | 171 (11.9%) | 49 (35.2%) |
| 6 or 7 Rooms | 536 (37.3%) | 38 (27.3%) |
| 8 or more Rooms | 728 (50.7%) | 52 (37.4%) |
| Total | 1,435 (100.0%) | 139 (100.0%) |
Housing Structure by Heating Type in Lathrup Village
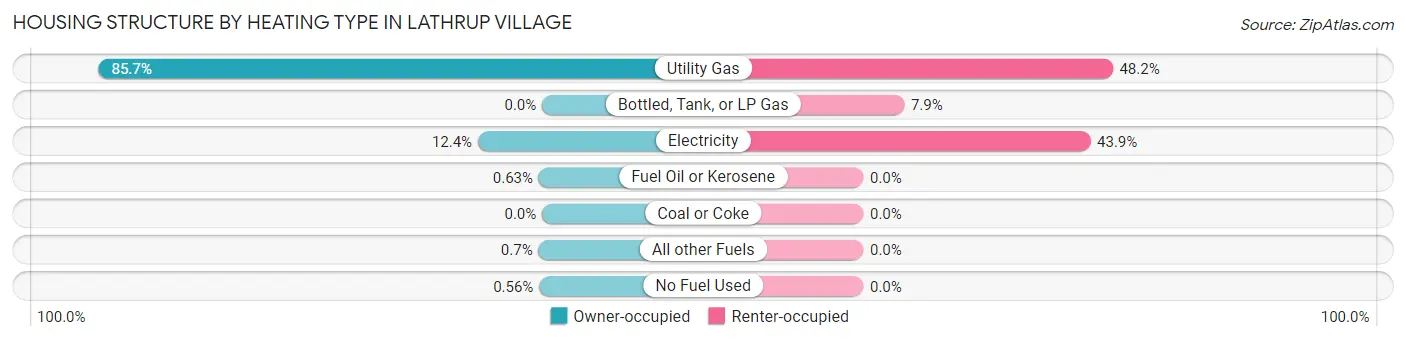
| Heating Type | Owner-occupied | Renter-occupied |
| Utility Gas | 1,230 (85.7%) | 67 (48.2%) |
| Bottled, Tank, or LP Gas | 0 (0.0%) | 11 (7.9%) |
| Electricity | 178 (12.4%) | 61 (43.9%) |
| Fuel Oil or Kerosene | 9 (0.6%) | 0 (0.0%) |
| Coal or Coke | 0 (0.0%) | 0 (0.0%) |
| All other Fuels | 10 (0.7%) | 0 (0.0%) |
| No Fuel Used | 8 (0.6%) | 0 (0.0%) |
| Total | 1,435 (100.0%) | 139 (100.0%) |
Household Vehicle Usage in Lathrup Village
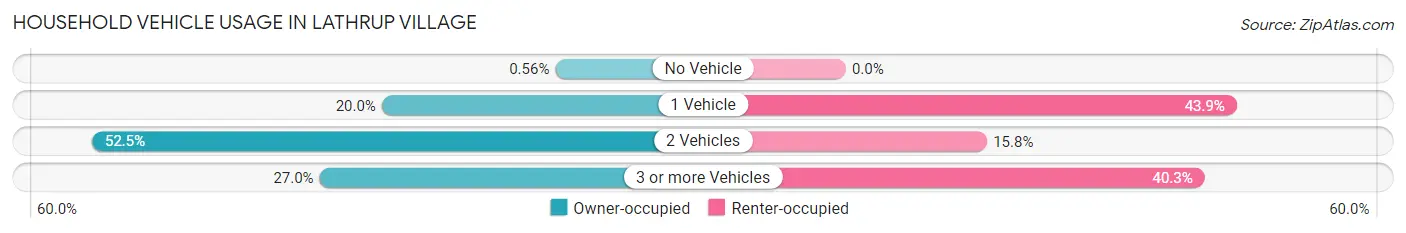
| Vehicles per Household | Owner-occupied | Renter-occupied |
| No Vehicle | 8 (0.6%) | 0 (0.0%) |
| 1 Vehicle | 287 (20.0%) | 61 (43.9%) |
| 2 Vehicles | 753 (52.5%) | 22 (15.8%) |
| 3 or more Vehicles | 387 (27.0%) | 56 (40.3%) |
| Total | 1,435 (100.0%) | 139 (100.0%) |
Real Estate & Mortgages in Lathrup Village
Real Estate and Mortgage Overview in Lathrup Village
| Characteristic | Without Mortgage | With Mortgage |
| Housing Units | 339 | 1,096 |
| Median Property Value | $250,500 | $263,800 |
| Median Household Income | $125,179 | $265 |
| Monthly Housing Costs | $826 | $0 |
| Real Estate Taxes | $4,013 | $0 |
Property Value by Mortgage Status in Lathrup Village
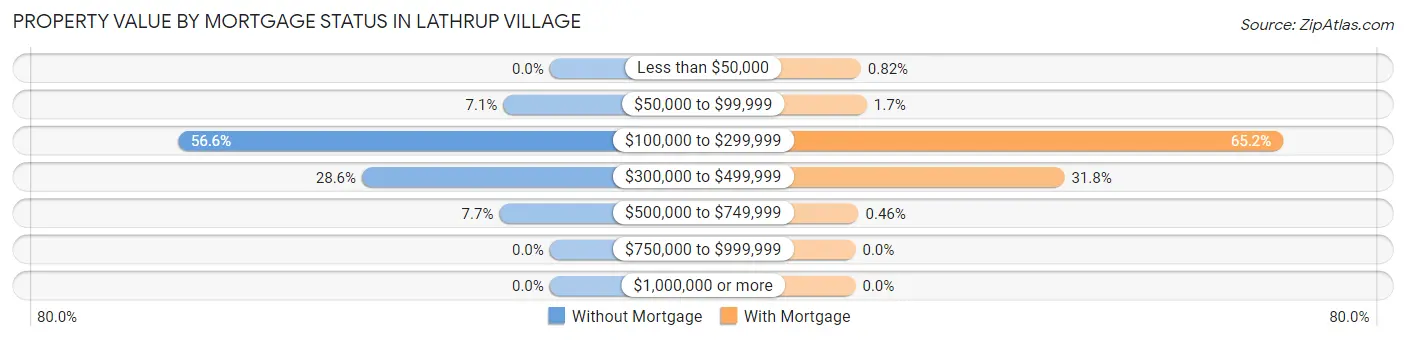
| Property Value | Without Mortgage | With Mortgage |
| Less than $50,000 | 0 (0.0%) | 9 (0.8%) |
| $50,000 to $99,999 | 24 (7.1%) | 19 (1.7%) |
| $100,000 to $299,999 | 192 (56.6%) | 714 (65.1%) |
| $300,000 to $499,999 | 97 (28.6%) | 349 (31.8%) |
| $500,000 to $749,999 | 26 (7.7%) | 5 (0.5%) |
| $750,000 to $999,999 | 0 (0.0%) | 0 (0.0%) |
| $1,000,000 or more | 0 (0.0%) | 0 (0.0%) |
| Total | 339 (100.0%) | 1,096 (100.0%) |
Household Income by Mortgage Status in Lathrup Village
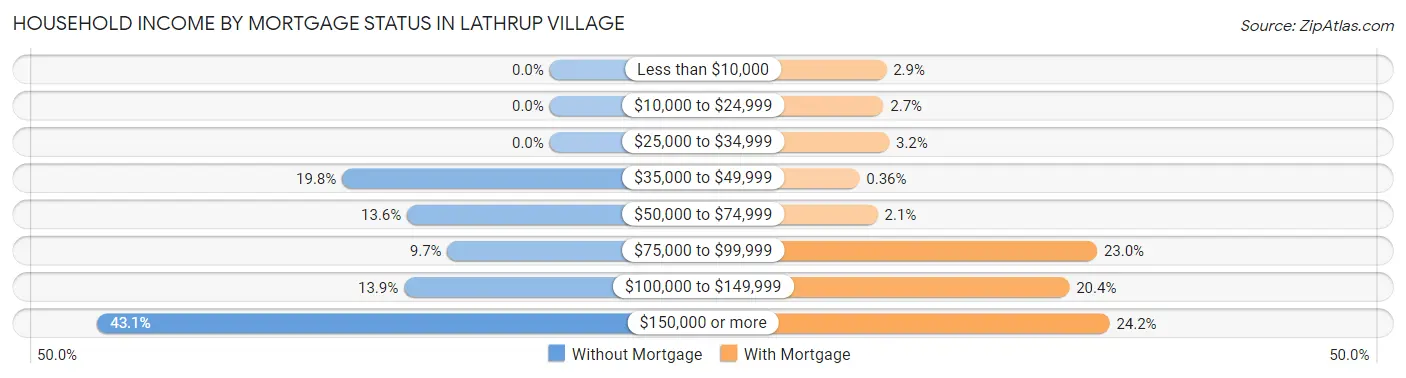
| Household Income | Without Mortgage | With Mortgage |
| Less than $10,000 | 0 (0.0%) | 32 (2.9%) |
| $10,000 to $24,999 | 0 (0.0%) | 29 (2.6%) |
| $25,000 to $34,999 | 0 (0.0%) | 35 (3.2%) |
| $35,000 to $49,999 | 67 (19.8%) | 4 (0.4%) |
| $50,000 to $74,999 | 46 (13.6%) | 23 (2.1%) |
| $75,000 to $99,999 | 33 (9.7%) | 252 (23.0%) |
| $100,000 to $149,999 | 47 (13.9%) | 223 (20.3%) |
| $150,000 or more | 146 (43.1%) | 265 (24.2%) |
| Total | 339 (100.0%) | 1,096 (100.0%) |
Property Value to Household Income Ratio in Lathrup Village
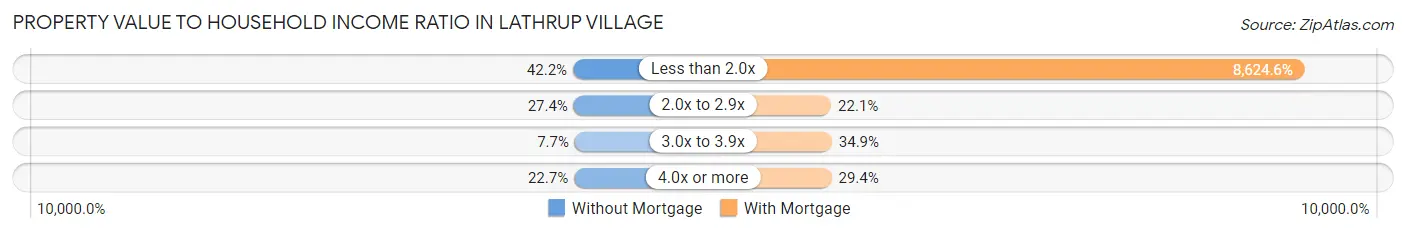
| Value-to-Income Ratio | Without Mortgage | With Mortgage |
| Less than 2.0x | 143 (42.2%) | 94,526 (8,624.6%) |
| 2.0x to 2.9x | 93 (27.4%) | 242 (22.1%) |
| 3.0x to 3.9x | 26 (7.7%) | 382 (34.8%) |
| 4.0x or more | 77 (22.7%) | 322 (29.4%) |
| Total | 339 (100.0%) | 1,096 (100.0%) |
Real Estate Taxes by Mortgage Status in Lathrup Village
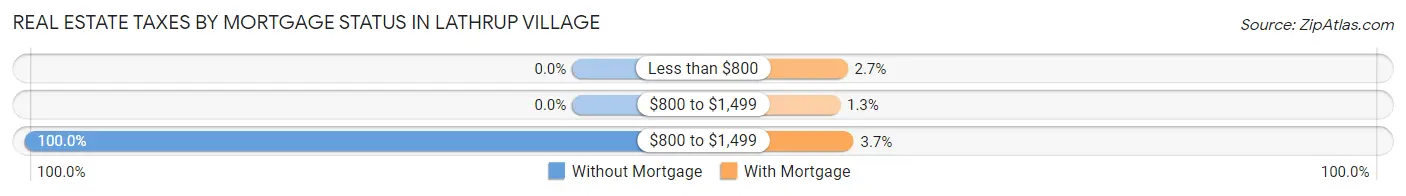
| Property Taxes | Without Mortgage | With Mortgage |
| Less than $800 | 0 (0.0%) | 29 (2.6%) |
| $800 to $1,499 | 0 (0.0%) | 14 (1.3%) |
| $800 to $1,499 | 339 (100.0%) | 41 (3.7%) |
| Total | 339 (100.0%) | 1,096 (100.0%) |
Health & Disability in Lathrup Village
Health Insurance Coverage by Age in Lathrup Village
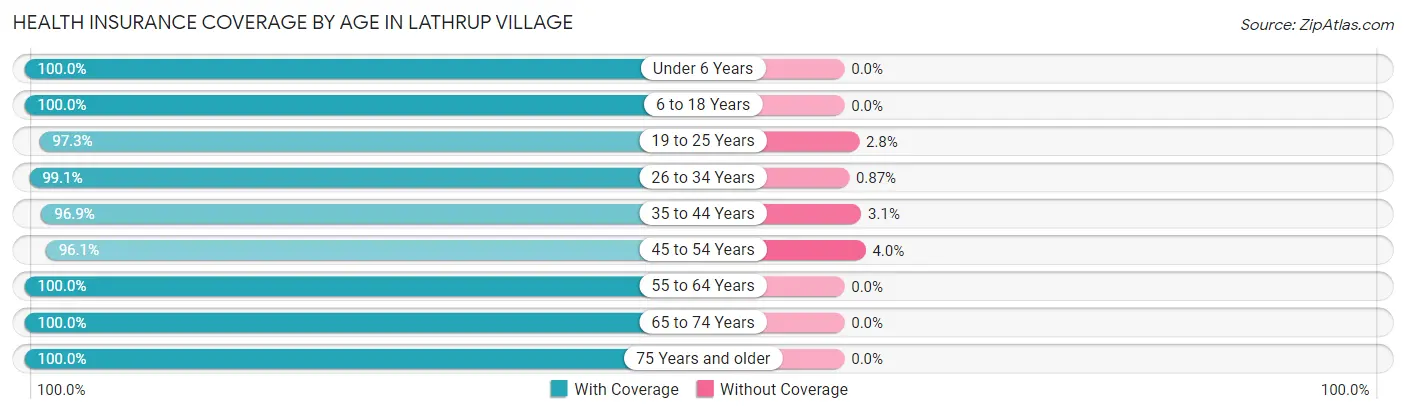
| Age Bracket | With Coverage | Without Coverage |
| Under 6 Years | 167 (100.0%) | 0 (0.0%) |
| 6 to 18 Years | 537 (100.0%) | 0 (0.0%) |
| 19 to 25 Years | 495 (97.3%) | 14 (2.8%) |
| 26 to 34 Years | 229 (99.1%) | 2 (0.9%) |
| 35 to 44 Years | 401 (96.9%) | 13 (3.1%) |
| 45 to 54 Years | 632 (96.1%) | 26 (4.0%) |
| 55 to 64 Years | 520 (100.0%) | 0 (0.0%) |
| 65 to 74 Years | 551 (100.0%) | 0 (0.0%) |
| 75 Years and older | 462 (100.0%) | 0 (0.0%) |
| Total | 3,994 (98.6%) | 55 (1.4%) |
Health Insurance Coverage by Citizenship Status in Lathrup Village
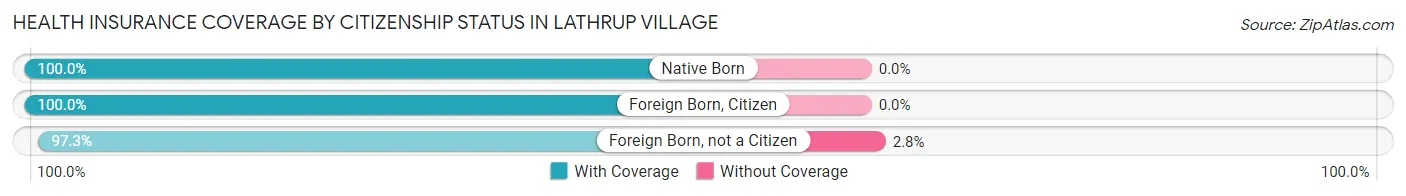
| Citizenship Status | With Coverage | Without Coverage |
| Native Born | 167 (100.0%) | 0 (0.0%) |
| Foreign Born, Citizen | 537 (100.0%) | 0 (0.0%) |
| Foreign Born, not a Citizen | 495 (97.3%) | 14 (2.8%) |
Health Insurance Coverage by Household Income in Lathrup Village
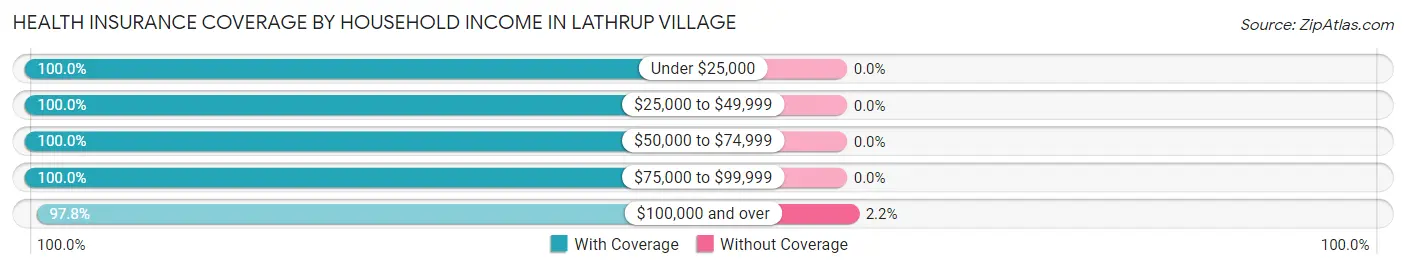
| Household Income | With Coverage | Without Coverage |
| Under $25,000 | 178 (100.0%) | 0 (0.0%) |
| $25,000 to $49,999 | 254 (100.0%) | 0 (0.0%) |
| $50,000 to $74,999 | 653 (100.0%) | 0 (0.0%) |
| $75,000 to $99,999 | 574 (100.0%) | 0 (0.0%) |
| $100,000 and over | 2,319 (97.8%) | 53 (2.2%) |
Public vs Private Health Insurance Coverage by Age in Lathrup Village
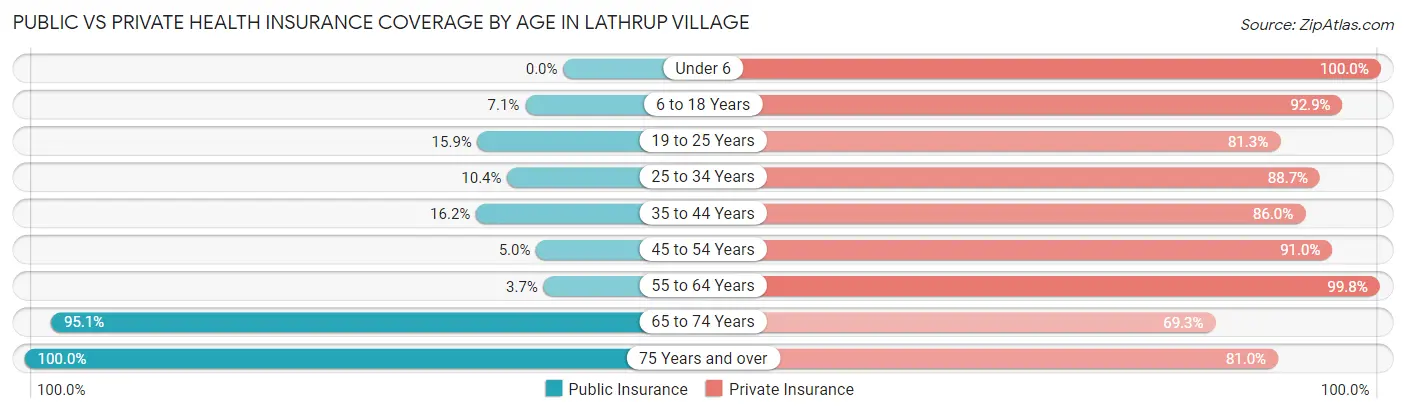
| Age Bracket | Public Insurance | Private Insurance |
| Under 6 | 0 (0.0%) | 167 (100.0%) |
| 6 to 18 Years | 38 (7.1%) | 499 (92.9%) |
| 19 to 25 Years | 81 (15.9%) | 414 (81.3%) |
| 25 to 34 Years | 24 (10.4%) | 205 (88.7%) |
| 35 to 44 Years | 67 (16.2%) | 356 (86.0%) |
| 45 to 54 Years | 33 (5.0%) | 599 (91.0%) |
| 55 to 64 Years | 19 (3.6%) | 519 (99.8%) |
| 65 to 74 Years | 524 (95.1%) | 382 (69.3%) |
| 75 Years and over | 462 (100.0%) | 374 (80.9%) |
| Total | 1,248 (30.8%) | 3,515 (86.8%) |
Disability Status by Sex by Age in Lathrup Village
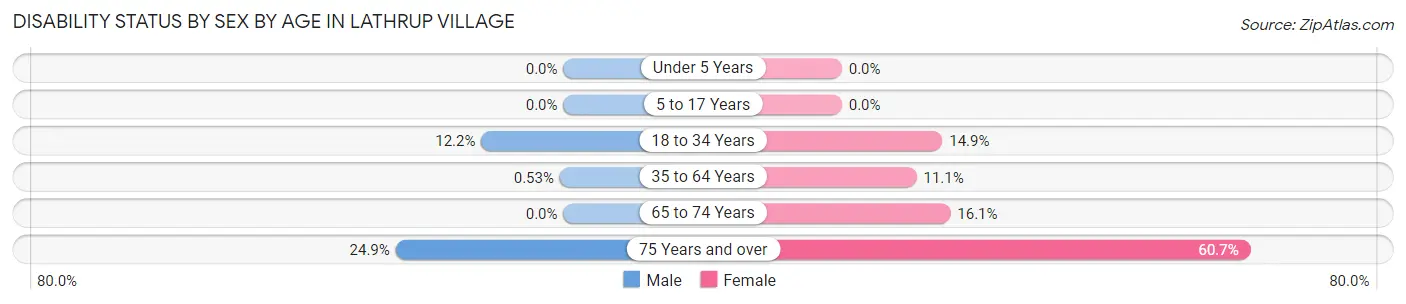
| Age Bracket | Male | Female |
| Under 5 Years | 0 (0.0%) | 0 (0.0%) |
| 5 to 17 Years | 0 (0.0%) | 0 (0.0%) |
| 18 to 34 Years | 67 (12.2%) | 57 (14.9%) |
| 35 to 64 Years | 4 (0.5%) | 93 (11.1%) |
| 65 to 74 Years | 0 (0.0%) | 59 (16.1%) |
| 75 Years and over | 72 (24.9%) | 105 (60.7%) |
Disability Class by Sex by Age in Lathrup Village
Disability Class: Hearing Difficulty
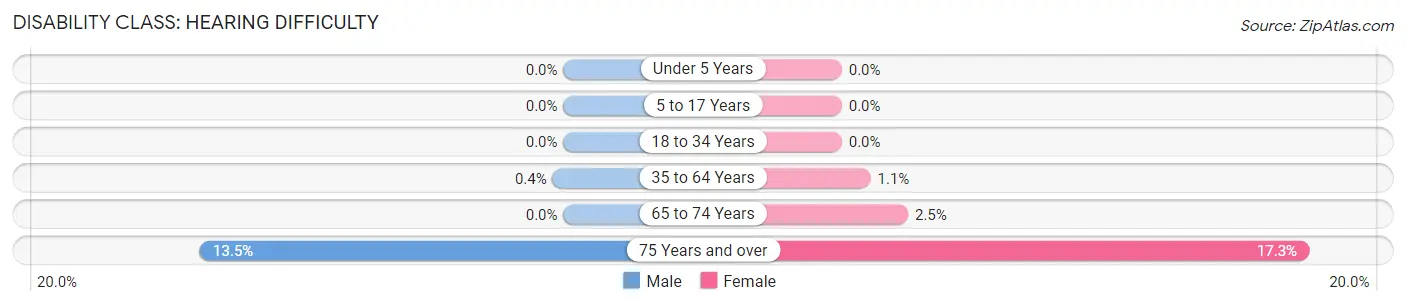
| Age Bracket | Male | Female |
| Under 5 Years | 0 (0.0%) | 0 (0.0%) |
| 5 to 17 Years | 0 (0.0%) | 0 (0.0%) |
| 18 to 34 Years | 0 (0.0%) | 0 (0.0%) |
| 35 to 64 Years | 3 (0.4%) | 9 (1.1%) |
| 65 to 74 Years | 0 (0.0%) | 9 (2.5%) |
| 75 Years and over | 39 (13.5%) | 30 (17.3%) |
Disability Class: Vision Difficulty
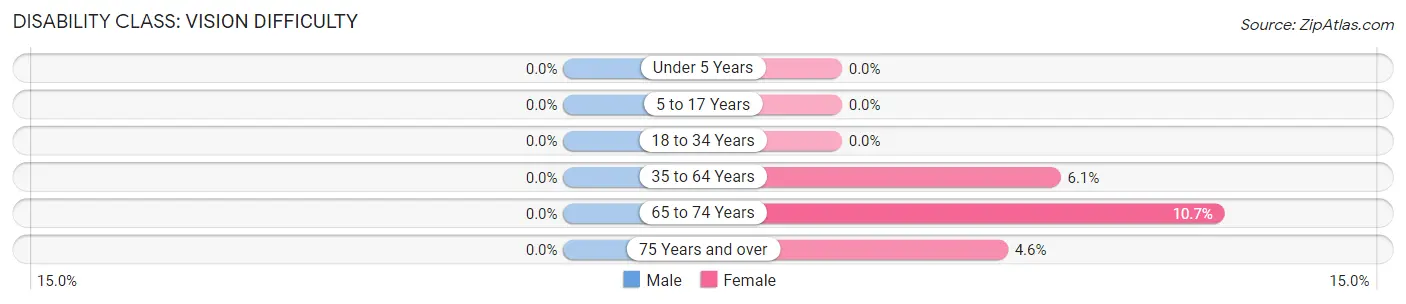
| Age Bracket | Male | Female |
| Under 5 Years | 0 (0.0%) | 0 (0.0%) |
| 5 to 17 Years | 0 (0.0%) | 0 (0.0%) |
| 18 to 34 Years | 0 (0.0%) | 0 (0.0%) |
| 35 to 64 Years | 0 (0.0%) | 51 (6.1%) |
| 65 to 74 Years | 0 (0.0%) | 39 (10.7%) |
| 75 Years and over | 0 (0.0%) | 8 (4.6%) |
Disability Class: Cognitive Difficulty
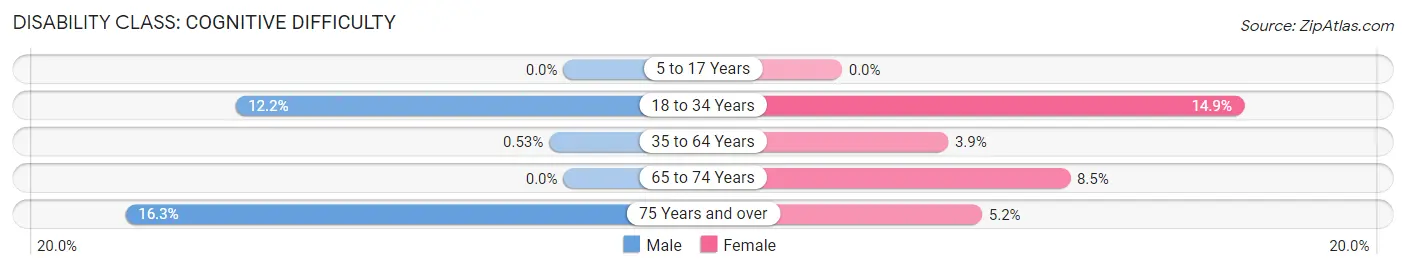
| Age Bracket | Male | Female |
| 5 to 17 Years | 0 (0.0%) | 0 (0.0%) |
| 18 to 34 Years | 67 (12.2%) | 57 (14.9%) |
| 35 to 64 Years | 4 (0.5%) | 33 (3.9%) |
| 65 to 74 Years | 0 (0.0%) | 31 (8.5%) |
| 75 Years and over | 47 (16.3%) | 9 (5.2%) |
Disability Class: Ambulatory Difficulty
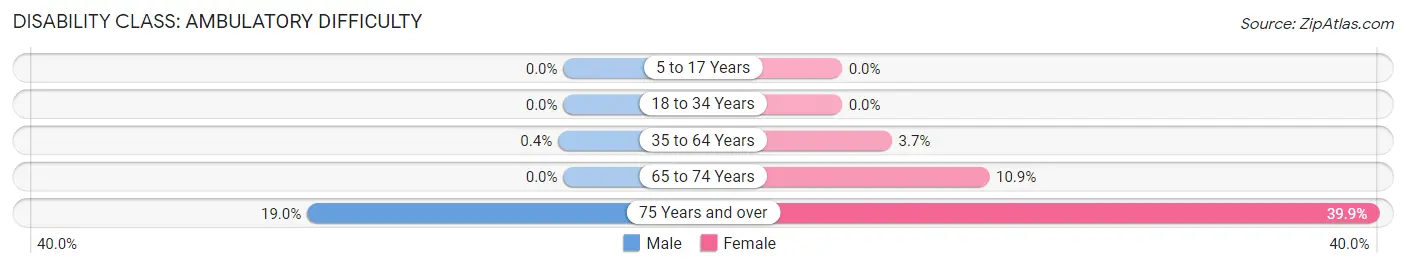
| Age Bracket | Male | Female |
| 5 to 17 Years | 0 (0.0%) | 0 (0.0%) |
| 18 to 34 Years | 0 (0.0%) | 0 (0.0%) |
| 35 to 64 Years | 3 (0.4%) | 31 (3.7%) |
| 65 to 74 Years | 0 (0.0%) | 40 (10.9%) |
| 75 Years and over | 55 (19.0%) | 69 (39.9%) |
Disability Class: Self-Care Difficulty
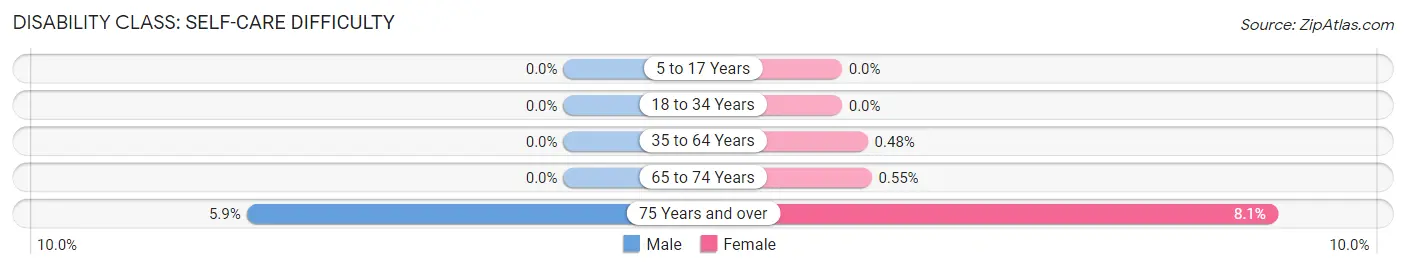
| Age Bracket | Male | Female |
| 5 to 17 Years | 0 (0.0%) | 0 (0.0%) |
| 18 to 34 Years | 0 (0.0%) | 0 (0.0%) |
| 35 to 64 Years | 0 (0.0%) | 4 (0.5%) |
| 65 to 74 Years | 0 (0.0%) | 2 (0.5%) |
| 75 Years and over | 17 (5.9%) | 14 (8.1%) |
Technology Access in Lathrup Village
Computing Device Access in Lathrup Village
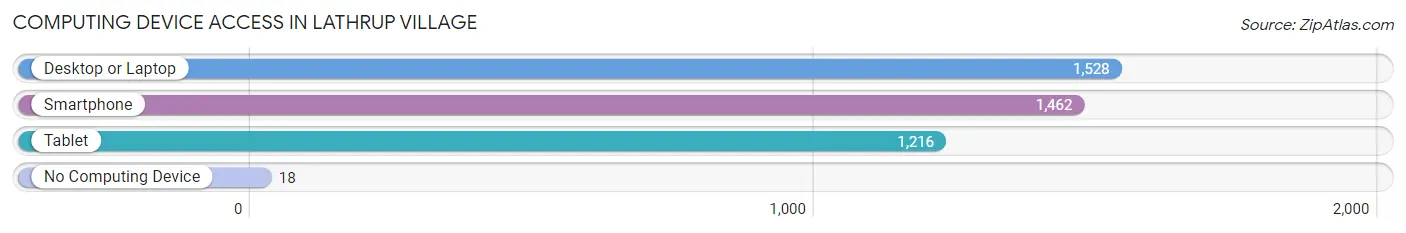
| Device Type | # Households | % Households |
| Desktop or Laptop | 1,528 | 97.1% |
| Smartphone | 1,462 | 92.9% |
| Tablet | 1,216 | 77.3% |
| No Computing Device | 18 | 1.1% |
| Total | 1,574 | 100.0% |
Internet Access in Lathrup Village
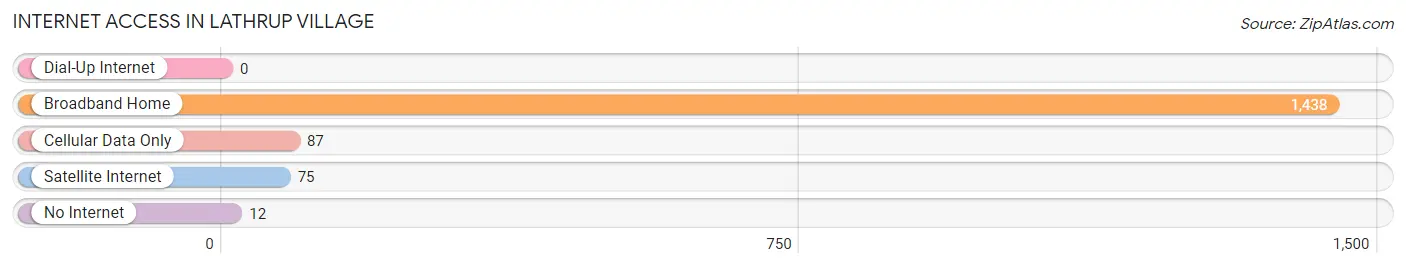
| Internet Type | # Households | % Households |
| Dial-Up Internet | 0 | 0.0% |
| Broadband Home | 1,438 | 91.4% |
| Cellular Data Only | 87 | 5.5% |
| Satellite Internet | 75 | 4.8% |
| No Internet | 12 | 0.8% |
| Total | 1,574 | 100.0% |
Lathrup Village Summary
Lathrup Village is a small city located in Oakland County, Michigan. It is a suburb of Detroit and is part of the Southfield-Lathrup Village Metropolitan Statistical Area. The city was incorporated in 1926 and has a population of approximately 4,000 people.
Geography
Lathrup Village is located in southeastern Oakland County, Michigan. It is bordered by Southfield to the north, Oak Park to the east, and Beverly Hills to the south. The city is situated on the Rouge River, which flows through the city and is a tributary of the Detroit River. The city has a total area of 1.2 square miles, all of which is land.
Economy
Lathrup Village is a primarily residential community, with most of its residents commuting to nearby cities for work. The city does have a few businesses, including a few restaurants, a grocery store, and a few small retail stores. The city also has a few industrial businesses, including a manufacturing plant and a printing company.
Demographics
As of the 2010 census, the population of Lathrup Village was 4,037. The racial makeup of the city was 79.3% White, 14.2% African American, 0.3% Native American, 2.2% Asian, 0.1% Pacific Islander, 1.2% from other races, and 2.9% from two or more races. Hispanic or Latino of any race were 3.3% of the population.
The median income for a household in the city was $50,972, and the median income for a family was $60,972. The per capita income for the city was $25,972. About 5.2% of families and 6.7% of the population were below the poverty line, including 8.2% of those under age 18 and 4.2% of those age 65 or over.
History
Lathrup Village was first settled in the early 1800s by a group of settlers from New York. The village was named after the Lathrup family, who were among the first settlers. The village was incorporated in 1926 and has remained a small, primarily residential community since then.
In the 1950s, the city began to experience rapid growth due to its proximity to Detroit. The city was annexed by Southfield in the 1970s, but was reincorporated as a separate city in the 1980s. Since then, the city has experienced slow but steady growth.
Conclusion
Lathrup Village is a small city located in Oakland County, Michigan. It is a suburb of Detroit and is part of the Southfield-Lathrup Village Metropolitan Statistical Area. The city was incorporated in 1926 and has a population of approximately 4,000 people. The city is primarily residential, with most of its residents commuting to nearby cities for work. The city has a few businesses, including a few restaurants, a grocery store, and a few small retail stores. The racial makeup of the city is 79.3% White, 14.2% African American, 0.3% Native American, 2.2% Asian, 0.1% Pacific Islander, 1.2% from other races, and 2.9% from two or more races. The median income for a household in the city was $50,972, and the median income for a family was $60,972. The city has experienced slow but steady growth since its incorporation in 1926.
Common Questions
What is Per Capita Income in Lathrup Village?
Per Capita income in Lathrup Village is $54,461.
What is the Median Family Income in Lathrup Village?
Median Family Income in Lathrup Village is $115,577.
What is the Median Household income in Lathrup Village?
Median Household Income in Lathrup Village is $97,750.
What is Income or Wage Gap in Lathrup Village?
Income or Wage Gap in Lathrup Village is 26.3%.
Women in Lathrup Village earn 73.7 cents for every dollar earned by a man.
What is Inequality or Gini Index in Lathrup Village?
Inequality or Gini Index in Lathrup Village is 0.43.
What is the Total Population of Lathrup Village?
Total Population of Lathrup Village is 4,076.
What is the Total Male Population of Lathrup Village?
Total Male Population of Lathrup Village is 2,076.
What is the Total Female Population of Lathrup Village?
Total Female Population of Lathrup Village is 2,000.
What is the Ratio of Males per 100 Females in Lathrup Village?
There are 103.80 Males per 100 Females in Lathrup Village.
What is the Ratio of Females per 100 Males in Lathrup Village?
There are 96.34 Females per 100 Males in Lathrup Village.
What is the Median Population Age in Lathrup Village?
Median Population Age in Lathrup Village is 48.2 Years.
What is the Average Family Size in Lathrup Village
Average Family Size in Lathrup Village is 3.1 People.
What is the Average Household Size in Lathrup Village
Average Household Size in Lathrup Village is 2.6 People.
How Large is the Labor Force in Lathrup Village?
There are 2,228 People in the Labor Forcein in Lathrup Village.
What is the Percentage of People in the Labor Force in Lathrup Village?
61.0% of People are in the Labor Force in Lathrup Village.
What is the Unemployment Rate in Lathrup Village?
Unemployment Rate in Lathrup Village is 7.5%.