Saugatuck, MI Map & Demographics
Saugatuck Map
Saugatuck Overview
$78,256
PER CAPITA INCOME
$149,432
AVG FAMILY INCOME
$113,309
AVG HOUSEHOLD INCOME
0.50
INEQUALITY / GINI INDEX
751
TOTAL POPULATION
395
MALE POPULATION
356
FEMALE POPULATION
110.96
MALES / 100 FEMALES
90.13
FEMALES / 100 MALES
58.0
MEDIAN AGE
2.4
AVG FAMILY SIZE
1.9
AVG HOUSEHOLD SIZE
347
LABOR FORCE [ PEOPLE ]
50.4%
PERCENT IN LABOR FORCE
2.3%
UNEMPLOYMENT RATE
Saugatuck Zip Codes
Saugatuck Area Codes
Income in Saugatuck
Income Overview in Saugatuck
Per Capita Income in Saugatuck is $78,256, while median incomes of families and households are $149,432 and $113,309 respectively.
| Characteristic | Number | Measure |
| Per Capita Income | 751 | $78,256 |
| Median Family Income | 215 | $149,432 |
| Mean Family Income | 215 | $185,575 |
| Median Household Income | 407 | $113,309 |
| Mean Household Income | 407 | $144,958 |
| Income Deficit | 215 | $0 |
| Wage / Income Gap (%) | 751 | 0.00% |
| Wage / Income Gap ($) | 751 | 100.00¢ per $1 |
| Gini / Inequality Index | 751 | 0.50 |
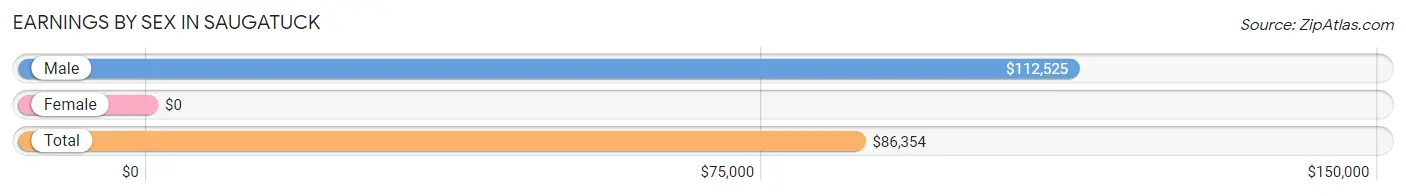
Earnings by Sex in Saugatuck
| Sex | Number | Average Earnings |
| Male | 231 (62.6%) | $112,525 |
| Female | 138 (37.4%) | $0 |
| Total | 369 (100.0%) | $86,354 |
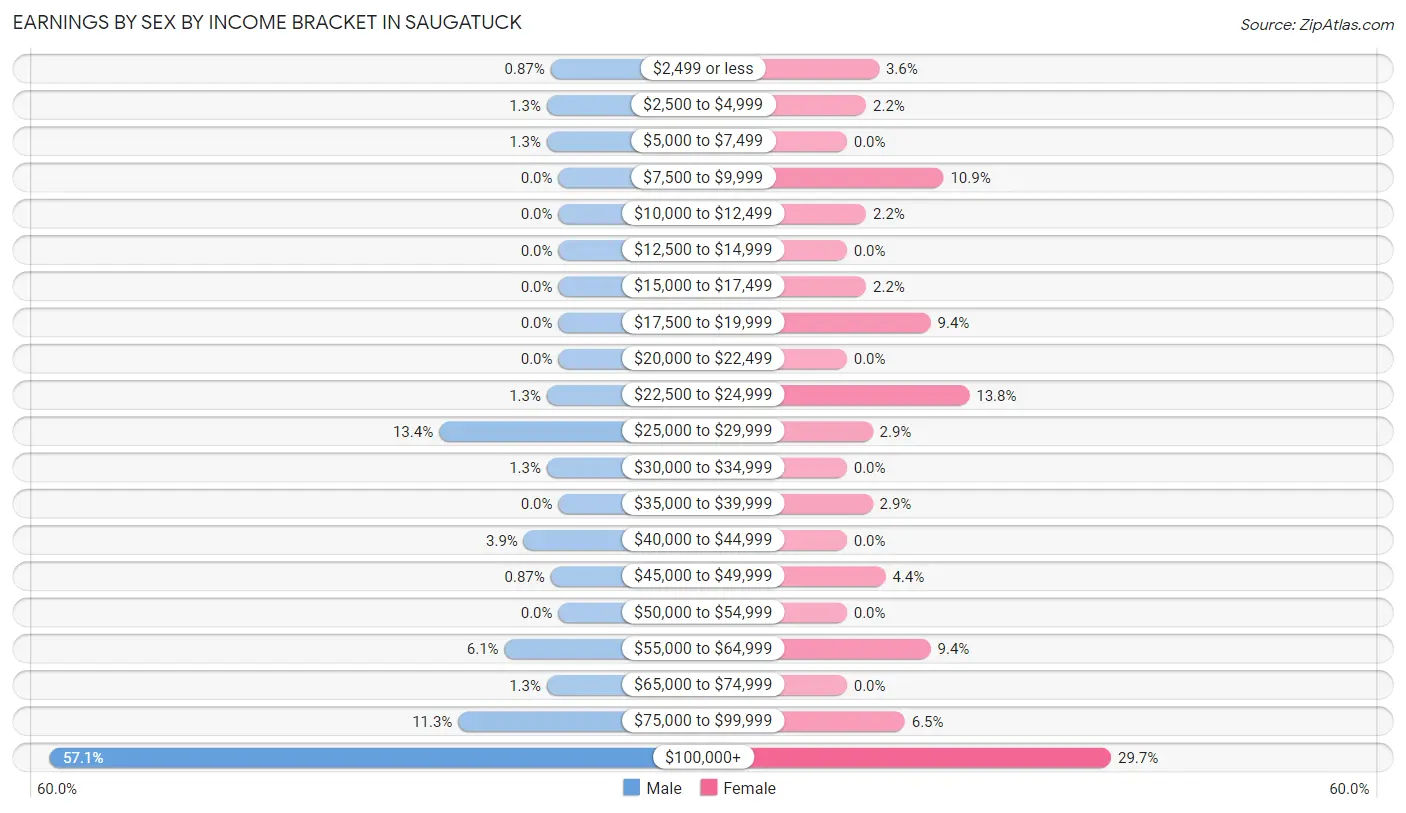
Earnings by Sex by Income Bracket in Saugatuck
The most common earnings brackets in Saugatuck are $100,000+ for men (132 | 57.1%) and $100,000+ for women (41 | 29.7%).
| Income | Male | Female |
| $2,499 or less | 2 (0.9%) | 5 (3.6%) |
| $2,500 to $4,999 | 3 (1.3%) | 3 (2.2%) |
| $5,000 to $7,499 | 3 (1.3%) | 0 (0.0%) |
| $7,500 to $9,999 | 0 (0.0%) | 15 (10.9%) |
| $10,000 to $12,499 | 0 (0.0%) | 3 (2.2%) |
| $12,500 to $14,999 | 0 (0.0%) | 0 (0.0%) |
| $15,000 to $17,499 | 0 (0.0%) | 3 (2.2%) |
| $17,500 to $19,999 | 0 (0.0%) | 13 (9.4%) |
| $20,000 to $22,499 | 0 (0.0%) | 0 (0.0%) |
| $22,500 to $24,999 | 3 (1.3%) | 19 (13.8%) |
| $25,000 to $29,999 | 31 (13.4%) | 4 (2.9%) |
| $30,000 to $34,999 | 3 (1.3%) | 0 (0.0%) |
| $35,000 to $39,999 | 0 (0.0%) | 4 (2.9%) |
| $40,000 to $44,999 | 9 (3.9%) | 0 (0.0%) |
| $45,000 to $49,999 | 2 (0.9%) | 6 (4.3%) |
| $50,000 to $54,999 | 0 (0.0%) | 0 (0.0%) |
| $55,000 to $64,999 | 14 (6.1%) | 13 (9.4%) |
| $65,000 to $74,999 | 3 (1.3%) | 0 (0.0%) |
| $75,000 to $99,999 | 26 (11.3%) | 9 (6.5%) |
| $100,000+ | 132 (57.1%) | 41 (29.7%) |
| Total | 231 (100.0%) | 138 (100.0%) |
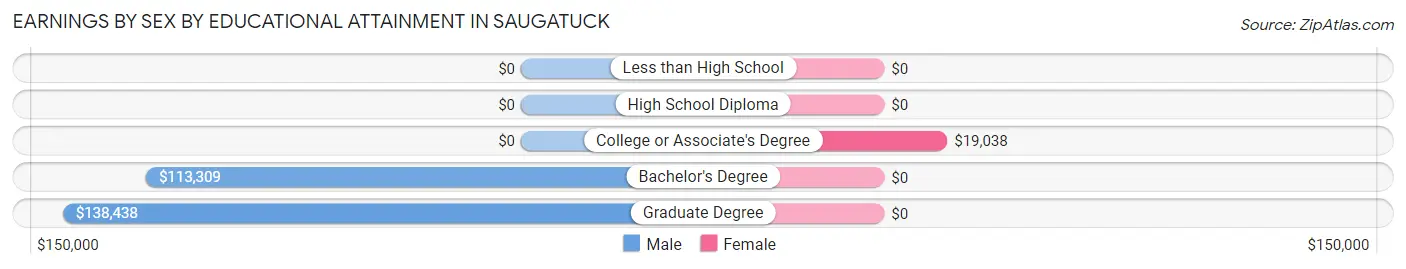
Earnings by Sex by Educational Attainment in Saugatuck
Average earnings in Saugatuck are $112,525 for men and $48,750 for women, a difference of 56.7%. Men with an educational attainment of graduate degree enjoy the highest average annual earnings of $138,438, while those with bachelor's degree education earn the least with $113,309. Women with an educational attainment of college or associate's degree earn the most with the average annual earnings of $19,038, while those with college or associate's degree education have the smallest earnings of $19,038.
| Educational Attainment | Male Income | Female Income |
| Less than High School | - | - |
| High School Diploma | - | - |
| College or Associate's Degree | - | - |
| Bachelor's Degree | $113,309 | $0 |
| Graduate Degree | $138,438 | $0 |
| Total | $112,525 | $48,750 |
Family Income in Saugatuck
Family Income Brackets in Saugatuck
According to the Saugatuck family income data, there are 61 families falling into the $200,000+ income range, which is the most common income bracket and makes up 28.4% of all families.
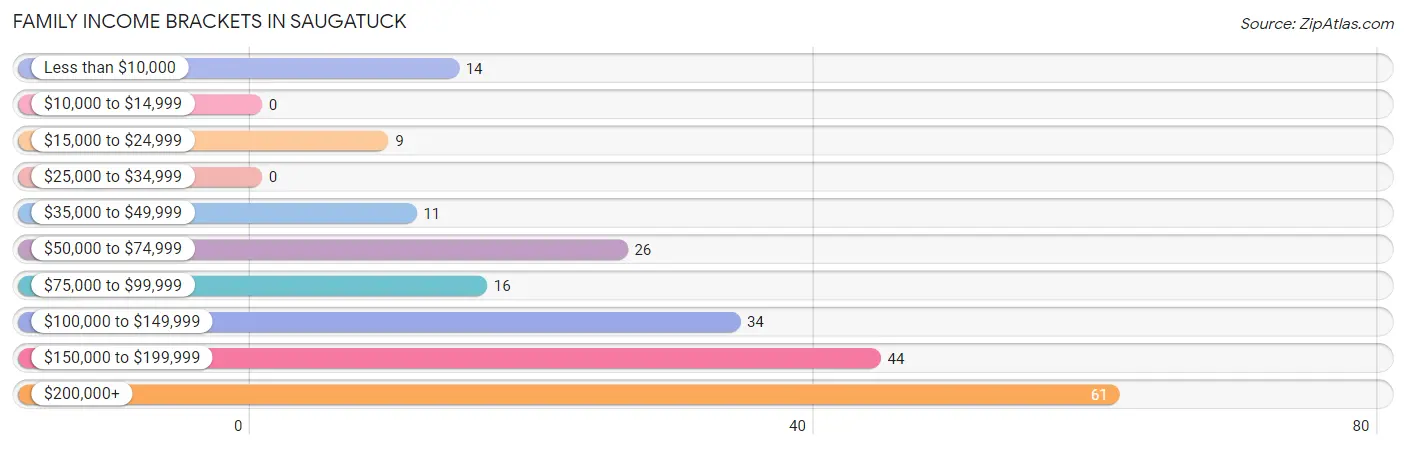
| Income Bracket | # Families | % Families |
| Less than $10,000 | 14 | 6.5% |
| $10,000 to $14,999 | 0 | 0.0% |
| $15,000 to $24,999 | 9 | 4.2% |
| $25,000 to $34,999 | 0 | 0.0% |
| $35,000 to $49,999 | 11 | 5.1% |
| $50,000 to $74,999 | 26 | 12.1% |
| $75,000 to $99,999 | 16 | 7.4% |
| $100,000 to $149,999 | 34 | 15.8% |
| $150,000 to $199,999 | 44 | 20.5% |
| $200,000+ | 61 | 28.4% |
Family Income by Famaliy Size in Saugatuck
4-person families (19 | 8.8%) account for the highest median family income in Saugatuck with $250,001 per family, while 3-person families (51 | 23.7%) have the highest median income of $69,861 per family member.
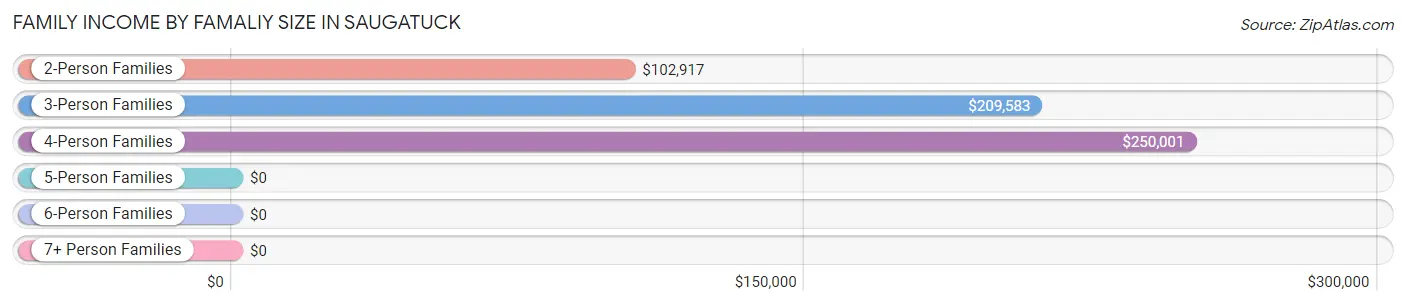
| Income Bracket | # Families | Median Income |
| 2-Person Families | 145 (67.4%) | $102,917 |
| 3-Person Families | 51 (23.7%) | $209,583 |
| 4-Person Families | 19 (8.8%) | $250,001 |
| 5-Person Families | 0 (0.0%) | $0 |
| 6-Person Families | 0 (0.0%) | $0 |
| 7+ Person Families | 0 (0.0%) | $0 |
| Total | 215 (100.0%) | $149,432 |
Family Income by Number of Earners in Saugatuck
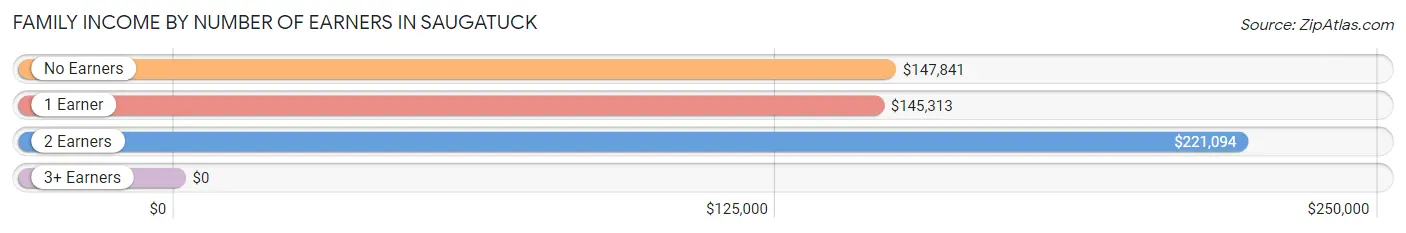
| Number of Earners | # Families | Median Income |
| No Earners | 63 (29.3%) | $147,841 |
| 1 Earner | 76 (35.3%) | $145,313 |
| 2 Earners | 76 (35.3%) | $221,094 |
| 3+ Earners | 0 (0.0%) | $0 |
| Total | 215 (100.0%) | $149,432 |
Household Income in Saugatuck
Household Income Brackets in Saugatuck
With 93 households falling in the category, the $100,000 to $149,999 income range is the most frequent in Saugatuck, accounting for 22.9% of all households. In contrast, only 7 households (1.7%) fall into the $10,000 to $14,999 income bracket, making it the least populous group.
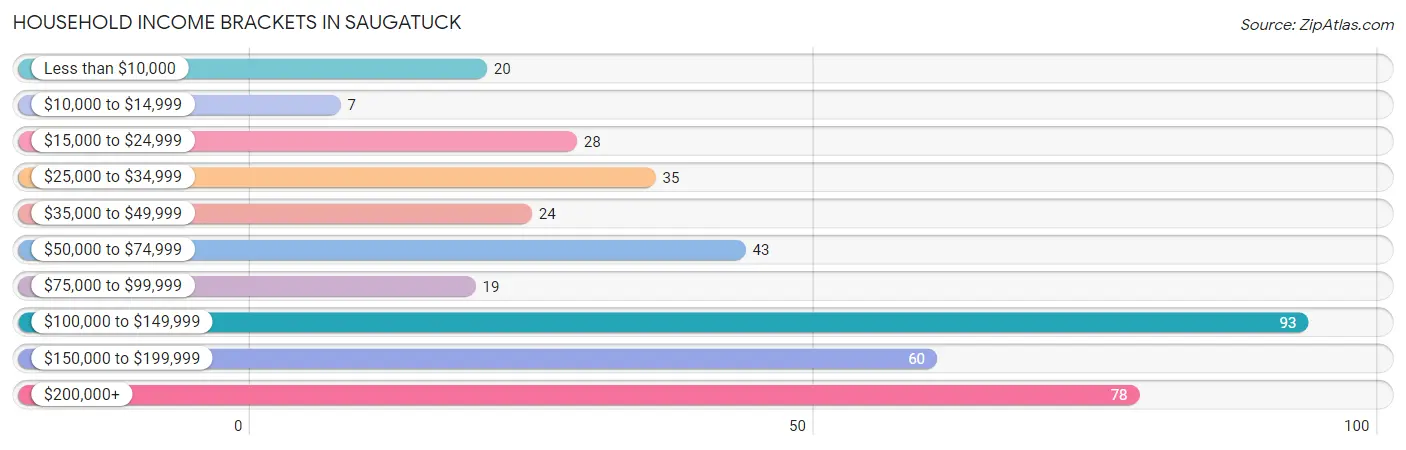
| Income Bracket | # Households | % Households |
| Less than $10,000 | 20 | 4.9% |
| $10,000 to $14,999 | 7 | 1.7% |
| $15,000 to $24,999 | 28 | 6.9% |
| $25,000 to $34,999 | 35 | 8.6% |
| $35,000 to $49,999 | 24 | 5.9% |
| $50,000 to $74,999 | 43 | 10.6% |
| $75,000 to $99,999 | 19 | 4.7% |
| $100,000 to $149,999 | 93 | 22.9% |
| $150,000 to $199,999 | 60 | 14.7% |
| $200,000+ | 78 | 19.2% |
Household Income by Householder Age in Saugatuck
The median household income in Saugatuck is $113,309, with the highest median household income of $113,995 found in the 45 to 64 years age bracket for the primary householder. A total of 207 households (50.9%) fall into this category. Meanwhile, the 15 to 24 years age bracket for the primary householder has the lowest median household income of $0, with 9 households (2.2%) in this group.
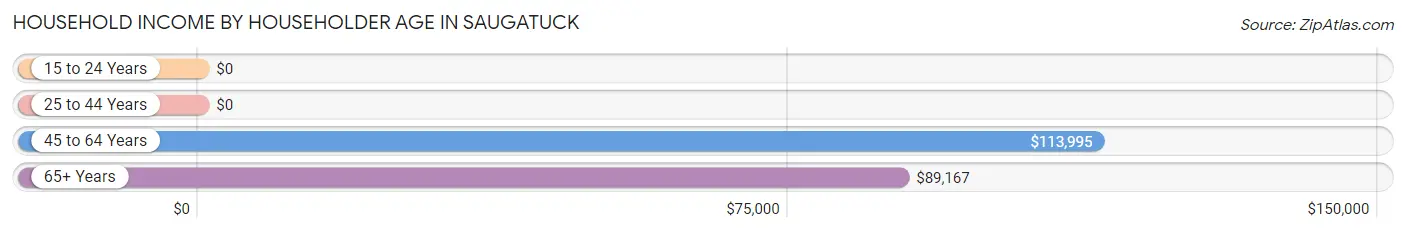
| Income Bracket | # Households | Median Income |
| 15 to 24 Years | 9 (2.2%) | $0 |
| 25 to 44 Years | 27 (6.6%) | $0 |
| 45 to 64 Years | 207 (50.9%) | $113,995 |
| 65+ Years | 164 (40.3%) | $89,167 |
| Total | 407 (100.0%) | $113,309 |
Poverty in Saugatuck
Income Below Poverty by Sex and Age in Saugatuck
With 6.1% poverty level for males and 11.5% for females among the residents of Saugatuck, 35 to 44 year old males and 12 to 14 year old females are the most vulnerable to poverty, with 3 males (16.7%) and 4 females (100.0%) in their respective age groups living below the poverty level.
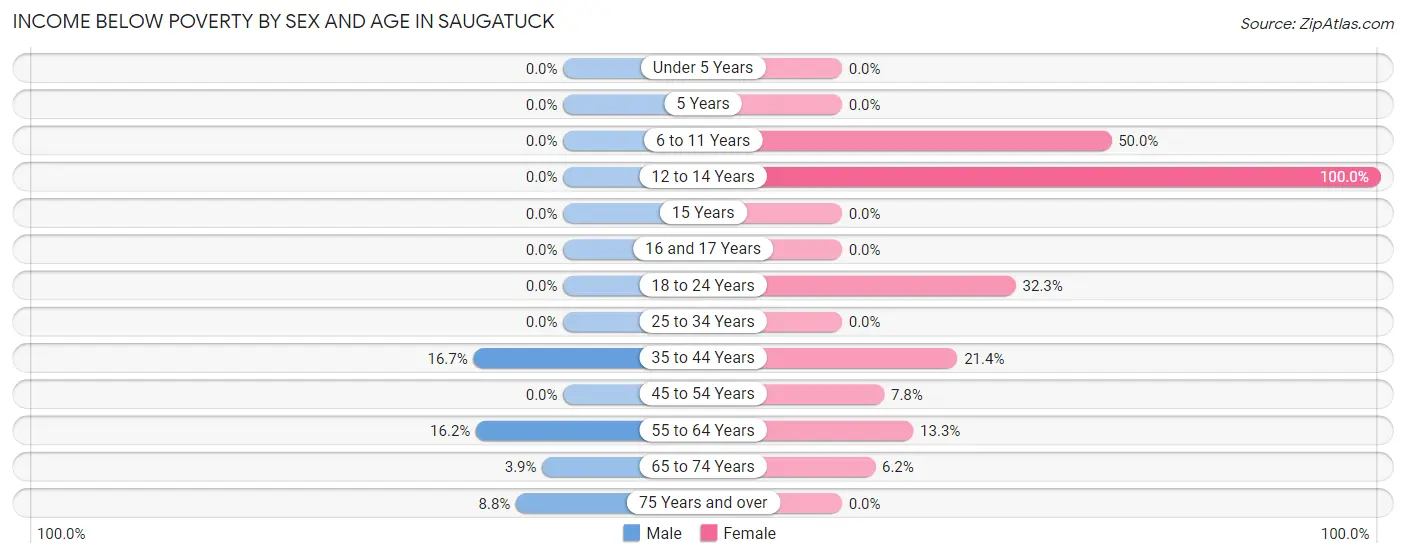
| Age Bracket | Male | Female |
| Under 5 Years | 0 (0.0%) | 0 (0.0%) |
| 5 Years | 0 (0.0%) | 0 (0.0%) |
| 6 to 11 Years | 0 (0.0%) | 4 (50.0%) |
| 12 to 14 Years | 0 (0.0%) | 4 (100.0%) |
| 15 Years | 0 (0.0%) | 0 (0.0%) |
| 16 and 17 Years | 0 (0.0%) | 0 (0.0%) |
| 18 to 24 Years | 0 (0.0%) | 10 (32.3%) |
| 25 to 34 Years | 0 (0.0%) | 0 (0.0%) |
| 35 to 44 Years | 3 (16.7%) | 3 (21.4%) |
| 45 to 54 Years | 0 (0.0%) | 4 (7.8%) |
| 55 to 64 Years | 11 (16.2%) | 11 (13.3%) |
| 65 to 74 Years | 3 (3.9%) | 5 (6.2%) |
| 75 Years and over | 7 (8.7%) | 0 (0.0%) |
| Total | 24 (6.1%) | 41 (11.5%) |
Income Above Poverty by Sex and Age in Saugatuck
According to the poverty statistics in Saugatuck, males aged under 5 years and females aged 15 years are the age groups that are most secure financially, with 100.0% of males and 100.0% of females in these age groups living above the poverty line.
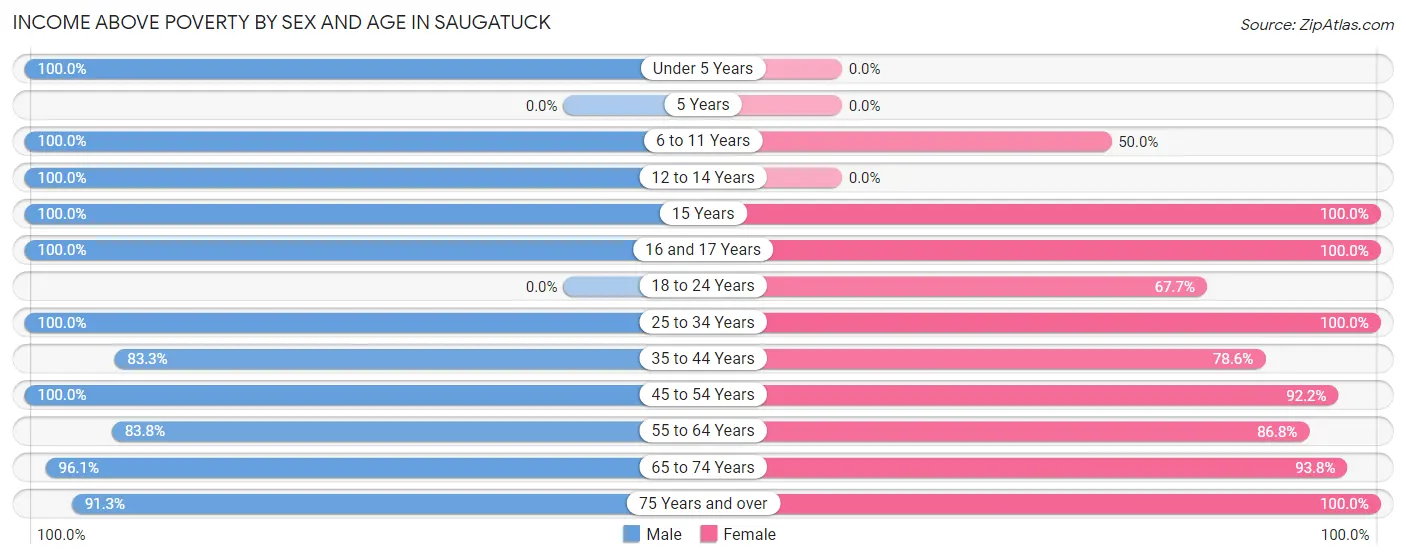
| Age Bracket | Male | Female |
| Under 5 Years | 15 (100.0%) | 0 (0.0%) |
| 5 Years | 0 (0.0%) | 0 (0.0%) |
| 6 to 11 Years | 6 (100.0%) | 4 (50.0%) |
| 12 to 14 Years | 12 (100.0%) | 0 (0.0%) |
| 15 Years | 3 (100.0%) | 14 (100.0%) |
| 16 and 17 Years | 3 (100.0%) | 12 (100.0%) |
| 18 to 24 Years | 0 (0.0%) | 21 (67.7%) |
| 25 to 34 Years | 5 (100.0%) | 14 (100.0%) |
| 35 to 44 Years | 15 (83.3%) | 11 (78.6%) |
| 45 to 54 Years | 108 (100.0%) | 47 (92.2%) |
| 55 to 64 Years | 57 (83.8%) | 72 (86.8%) |
| 65 to 74 Years | 74 (96.1%) | 76 (93.8%) |
| 75 Years and over | 73 (91.2%) | 44 (100.0%) |
| Total | 371 (93.9%) | 315 (88.5%) |
Income Below Poverty Among Married-Couple Families in Saugatuck
The poverty statistics for married-couple families in Saugatuck show that 5.5% or 10 of the total 183 families live below the poverty line. Families with no children have the highest poverty rate of 7.3%, comprising of 10 families. On the other hand, families with 1 or 2 children have the lowest poverty rate of 0.0%, which includes 0 families.
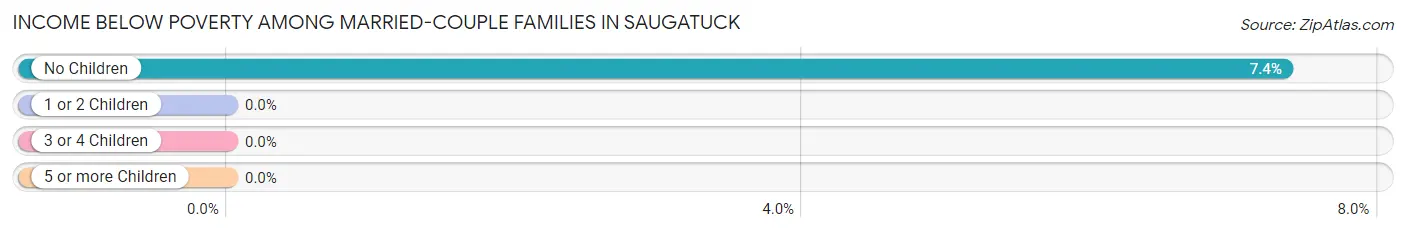
| Children | Above Poverty | Below Poverty |
| No Children | 126 (92.6%) | 10 (7.3%) |
| 1 or 2 Children | 47 (100.0%) | 0 (0.0%) |
| 3 or 4 Children | 0 (0.0%) | 0 (0.0%) |
| 5 or more Children | 0 (0.0%) | 0 (0.0%) |
| Total | 173 (94.5%) | 10 (5.5%) |
Income Below Poverty Among Single-Parent Households in Saugatuck
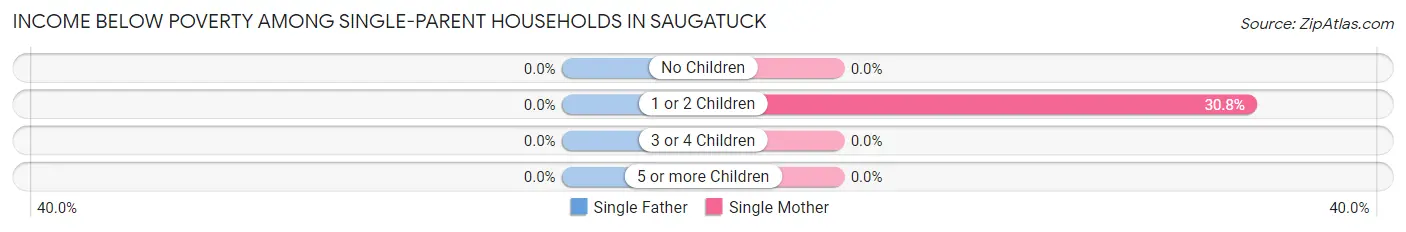
| Children | Single Father | Single Mother |
| No Children | 0 (0.0%) | 0 (0.0%) |
| 1 or 2 Children | 0 (0.0%) | 4 (30.8%) |
| 3 or 4 Children | 0 (0.0%) | 0 (0.0%) |
| 5 or more Children | 0 (0.0%) | 0 (0.0%) |
| Total | 0 (0.0%) | 4 (25.0%) |
Income Below Poverty Among Married-Couple vs Single-Parent Households in Saugatuck
The poverty data for Saugatuck shows that 10 of the married-couple family households (5.5%) and 4 of the single-parent households (12.5%) are living below the poverty level. Within the married-couple family households, those with no children have the highest poverty rate, with 10 households (7.3%) falling below the poverty line. Among the single-parent households, those with 1 or 2 children have the highest poverty rate, with 4 household (19.1%) living below poverty.
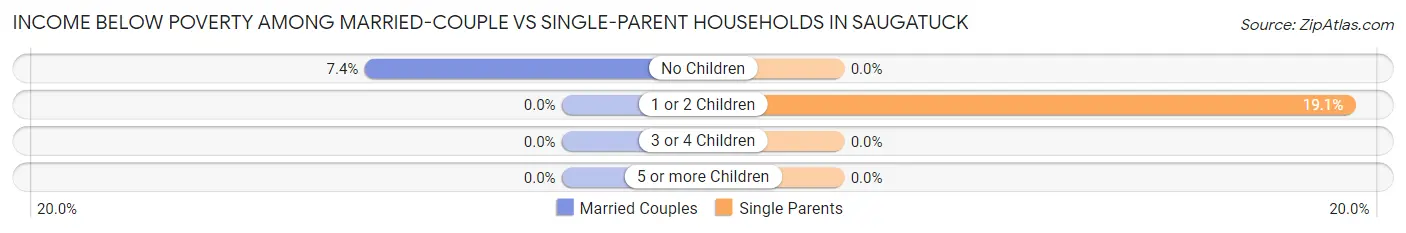
| Children | Married-Couple Families | Single-Parent Households |
| No Children | 10 (7.3%) | 0 (0.0%) |
| 1 or 2 Children | 0 (0.0%) | 4 (19.1%) |
| 3 or 4 Children | 0 (0.0%) | 0 (0.0%) |
| 5 or more Children | 0 (0.0%) | 0 (0.0%) |
| Total | 10 (5.5%) | 4 (12.5%) |
Race in Saugatuck
The most populous races in Saugatuck are White / Caucasian (730 | 97.2%), Two or more Races (19 | 2.5%), and Hispanic or Latino (6 | 0.8%).
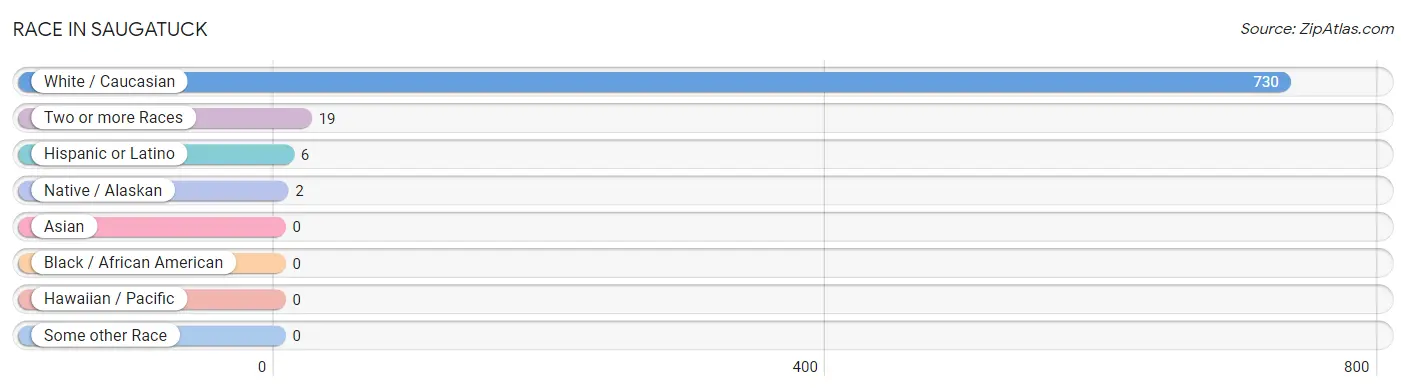
| Race | # Population | % Population |
| Asian | 0 | 0.0% |
| Black / African American | 0 | 0.0% |
| Hawaiian / Pacific | 0 | 0.0% |
| Hispanic or Latino | 6 | 0.8% |
| Native / Alaskan | 2 | 0.3% |
| White / Caucasian | 730 | 97.2% |
| Two or more Races | 19 | 2.5% |
| Some other Race | 0 | 0.0% |
| Total | 751 | 100.0% |
Ancestry in Saugatuck
The most populous ancestries reported in Saugatuck are Irish (146 | 19.4%), German (131 | 17.4%), European (85 | 11.3%), English (77 | 10.2%), and American (71 | 9.5%), together accounting for 67.9% of all Saugatuck residents.
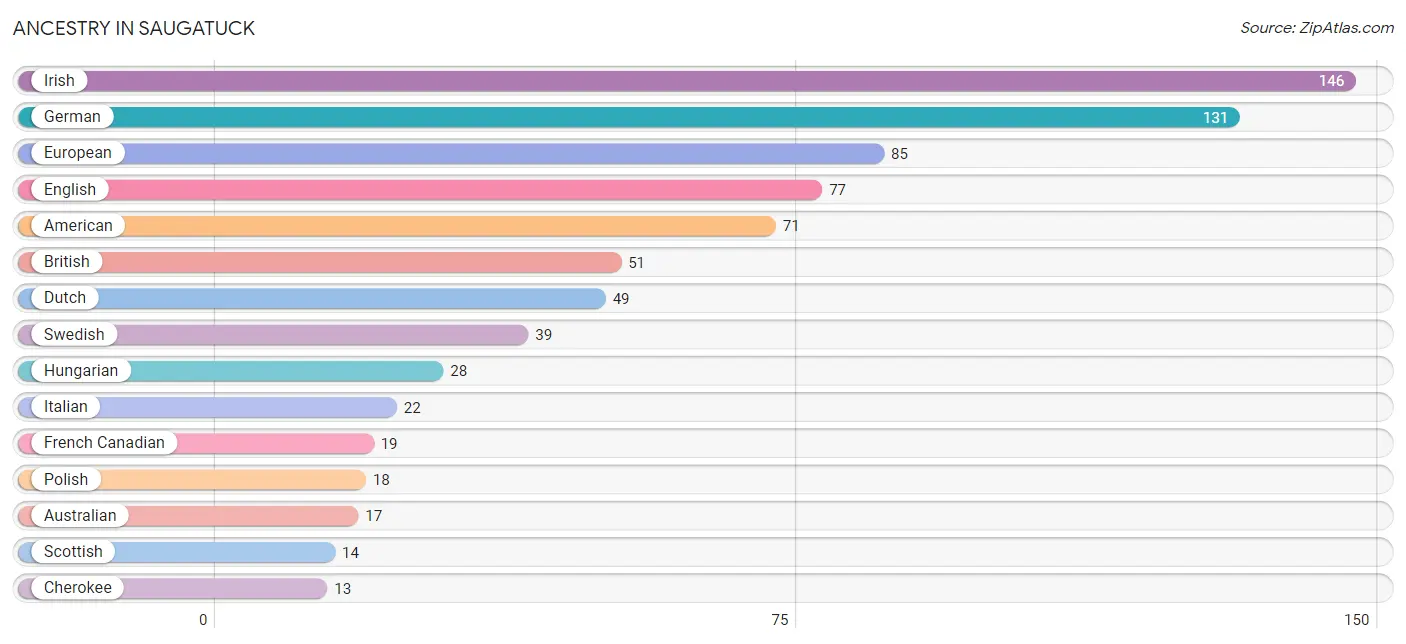
| Ancestry | # Population | % Population |
| American | 71 | 9.5% |
| Australian | 17 | 2.3% |
| Austrian | 3 | 0.4% |
| British | 51 | 6.8% |
| Cherokee | 13 | 1.7% |
| Chippewa | 2 | 0.3% |
| Croatian | 3 | 0.4% |
| Cuban | 3 | 0.4% |
| Czech | 3 | 0.4% |
| Danish | 4 | 0.5% |
| Dutch | 49 | 6.5% |
| English | 77 | 10.2% |
| European | 85 | 11.3% |
| Finnish | 2 | 0.3% |
| French | 3 | 0.4% |
| French Canadian | 19 | 2.5% |
| German | 131 | 17.4% |
| Greek | 1 | 0.1% |
| Hungarian | 28 | 3.7% |
| Irish | 146 | 19.4% |
| Italian | 22 | 2.9% |
| Lithuanian | 6 | 0.8% |
| Mexican | 3 | 0.4% |
| Norwegian | 10 | 1.3% |
| Polish | 18 | 2.4% |
| Russian | 2 | 0.3% |
| Scandinavian | 2 | 0.3% |
| Scotch-Irish | 7 | 0.9% |
| Scottish | 14 | 1.9% |
| Serbian | 3 | 0.4% |
| Slovak | 10 | 1.3% |
| Swedish | 39 | 5.2% |
| Swiss | 3 | 0.4% |
| Welsh | 3 | 0.4% | View All 34 Rows |
Immigrants in Saugatuck
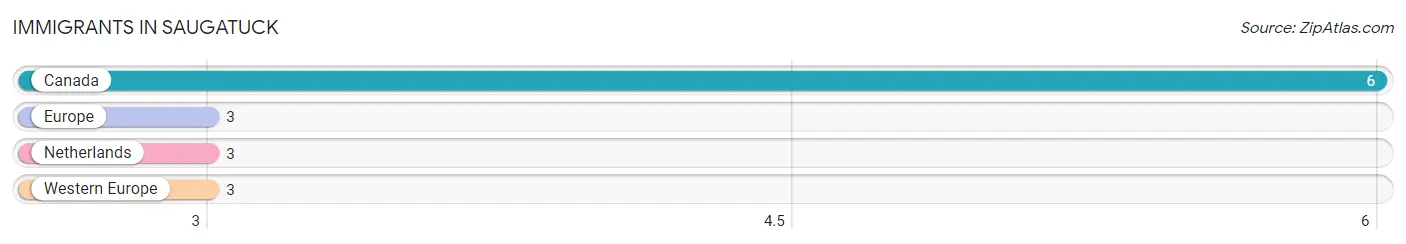
The most numerous immigrant groups reported in Saugatuck came from Canada (6 | 0.8%), Europe (3 | 0.4%), Netherlands (3 | 0.4%), and Western Europe (3 | 0.4%), together accounting for 2.0% of all Saugatuck residents.
| Immigration Origin | # Population | % Population |
| Canada | 6 | 0.8% |
| Europe | 3 | 0.4% |
| Netherlands | 3 | 0.4% |
| Western Europe | 3 | 0.4% | View All 4 Rows |
Sex and Age in Saugatuck
Sex and Age in Saugatuck
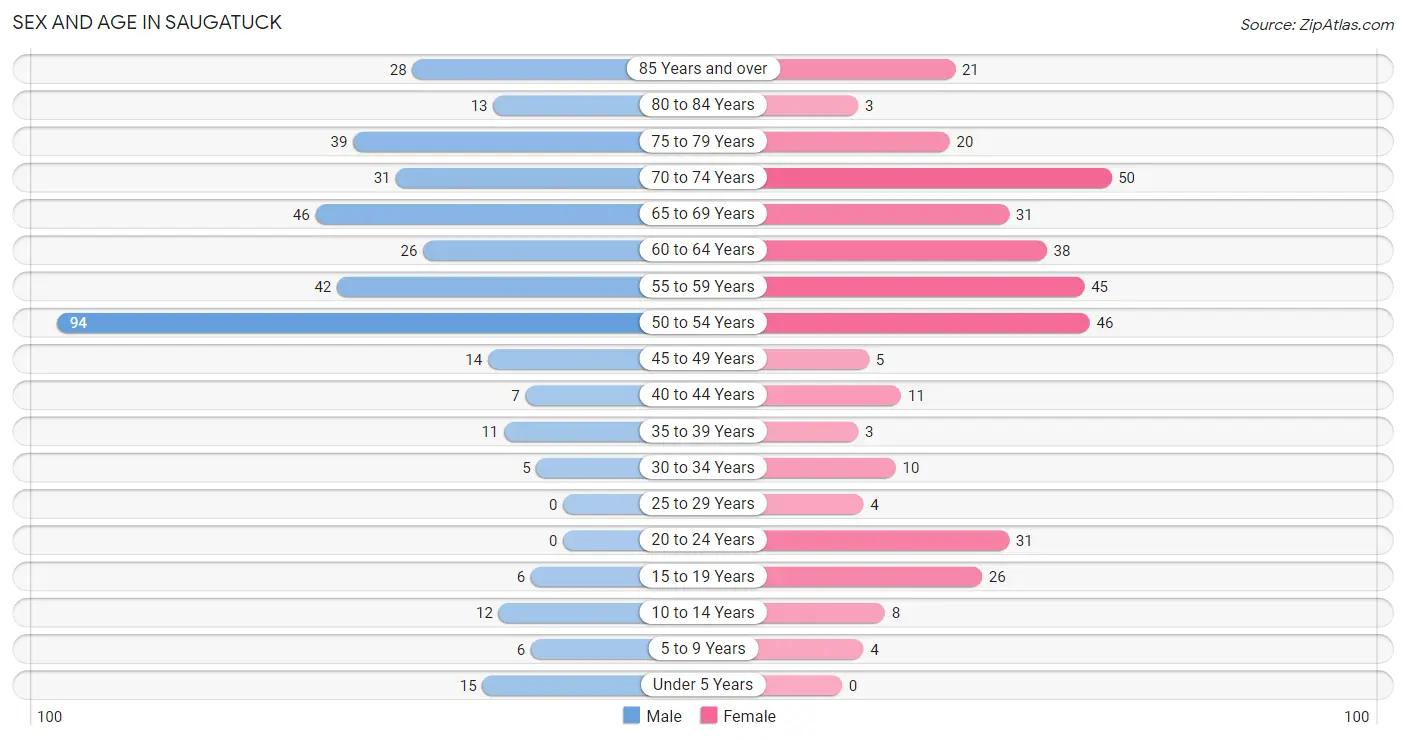
The most populous age groups in Saugatuck are 50 to 54 Years (94 | 23.8%) for men and 70 to 74 Years (50 | 14.0%) for women.
| Age Bracket | Male | Female |
| Under 5 Years | 15 (3.8%) | 0 (0.0%) |
| 5 to 9 Years | 6 (1.5%) | 4 (1.1%) |
| 10 to 14 Years | 12 (3.0%) | 8 (2.2%) |
| 15 to 19 Years | 6 (1.5%) | 26 (7.3%) |
| 20 to 24 Years | 0 (0.0%) | 31 (8.7%) |
| 25 to 29 Years | 0 (0.0%) | 4 (1.1%) |
| 30 to 34 Years | 5 (1.3%) | 10 (2.8%) |
| 35 to 39 Years | 11 (2.8%) | 3 (0.8%) |
| 40 to 44 Years | 7 (1.8%) | 11 (3.1%) |
| 45 to 49 Years | 14 (3.5%) | 5 (1.4%) |
| 50 to 54 Years | 94 (23.8%) | 46 (12.9%) |
| 55 to 59 Years | 42 (10.6%) | 45 (12.6%) |
| 60 to 64 Years | 26 (6.6%) | 38 (10.7%) |
| 65 to 69 Years | 46 (11.7%) | 31 (8.7%) |
| 70 to 74 Years | 31 (7.9%) | 50 (14.0%) |
| 75 to 79 Years | 39 (9.9%) | 20 (5.6%) |
| 80 to 84 Years | 13 (3.3%) | 3 (0.8%) |
| 85 Years and over | 28 (7.1%) | 21 (5.9%) |
| Total | 395 (100.0%) | 356 (100.0%) |
Families and Households in Saugatuck
Median Family Size in Saugatuck
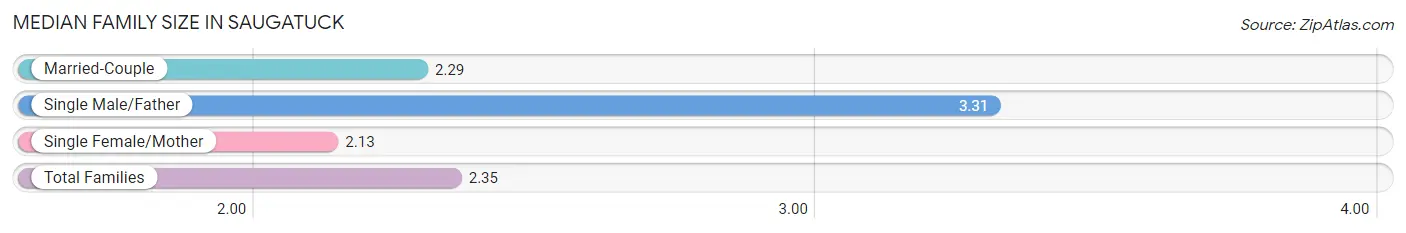
The median family size in Saugatuck is 2.35 persons per family, with single male/father families (16 | 7.4%) accounting for the largest median family size of 3.31 persons per family. On the other hand, single female/mother families (16 | 7.4%) represent the smallest median family size with 2.13 persons per family.
| Family Type | # Families | Family Size |
| Married-Couple | 183 (85.1%) | 2.29 |
| Single Male/Father | 16 (7.4%) | 3.31 |
| Single Female/Mother | 16 (7.4%) | 2.13 |
| Total Families | 215 (100.0%) | 2.35 |
Median Household Size in Saugatuck
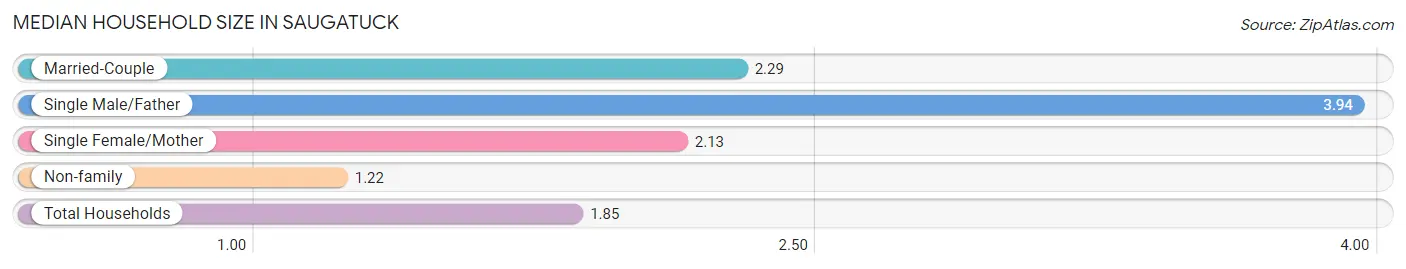
The median household size in Saugatuck is 1.85 persons per household, with single male/father households (16 | 3.9%) accounting for the largest median household size of 3.94 persons per household. non-family households (192 | 47.2%) represent the smallest median household size with 1.22 persons per household.
| Household Type | # Households | Household Size |
| Married-Couple | 183 (45.0%) | 2.29 |
| Single Male/Father | 16 (3.9%) | 3.94 |
| Single Female/Mother | 16 (3.9%) | 2.13 |
| Non-family | 192 (47.2%) | 1.22 |
| Total Households | 407 (100.0%) | 1.85 |
Household Size by Marriage Status in Saugatuck
Out of a total of 407 households in Saugatuck, 215 (52.8%) are family households, while 192 (47.2%) are nonfamily households. The most numerous type of family households are 2-person households, comprising 145, and the most common type of nonfamily households are 1-person households, comprising 150.
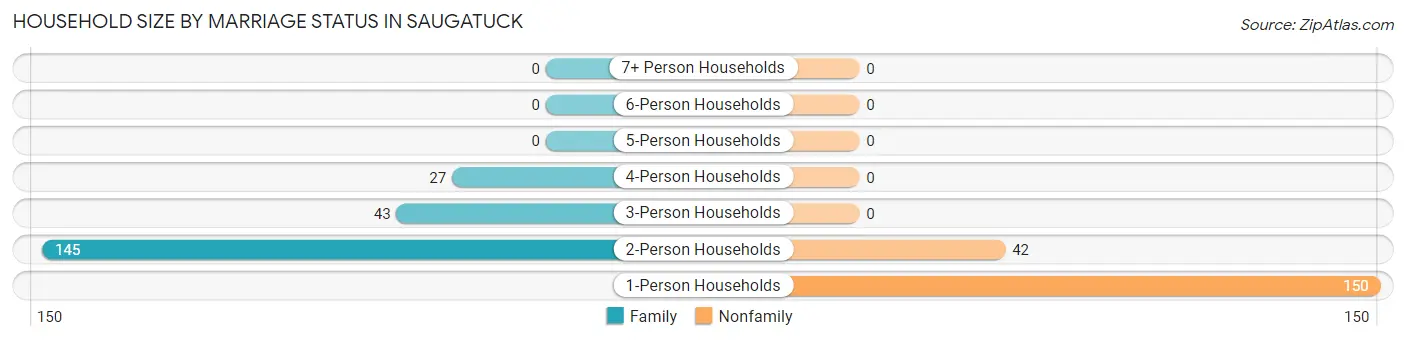
| Household Size | Family Households | Nonfamily Households |
| 1-Person Households | - | 150 (36.9%) |
| 2-Person Households | 145 (35.6%) | 42 (10.3%) |
| 3-Person Households | 43 (10.6%) | 0 (0.0%) |
| 4-Person Households | 27 (6.6%) | 0 (0.0%) |
| 5-Person Households | 0 (0.0%) | 0 (0.0%) |
| 6-Person Households | 0 (0.0%) | 0 (0.0%) |
| 7+ Person Households | 0 (0.0%) | 0 (0.0%) |
| Total | 215 (52.8%) | 192 (47.2%) |
Female Fertility in Saugatuck
Fertility by Age in Saugatuck
Average fertility rate in Saugatuck is 95.0 births per 1,000 women. Women in the age bracket of 20 to 34 years have the highest fertility rate with 200.0 births per 1,000 women. Women in the age bracket of 20 to 34 years acount for 100.0% of all women with births.
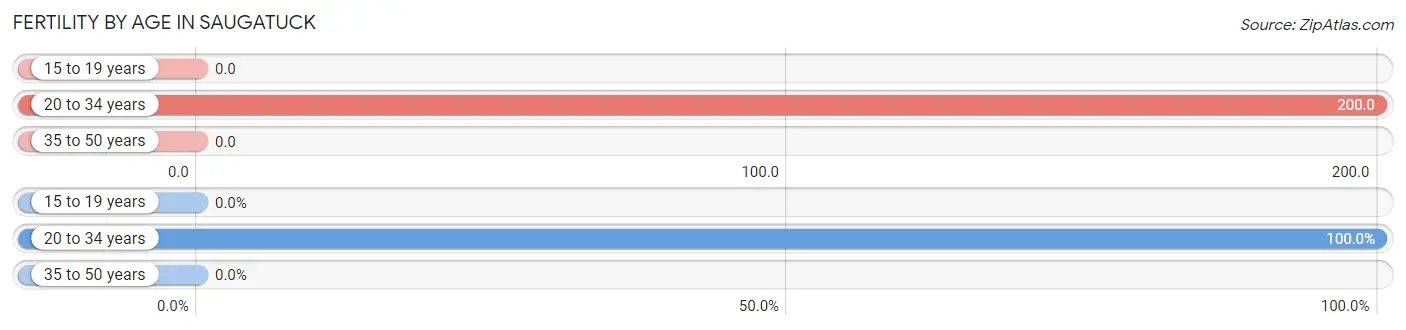
| Age Bracket | Women with Births | Births / 1,000 Women |
| 15 to 19 years | 0 (0.0%) | 0.0 |
| 20 to 34 years | 9 (100.0%) | 200.0 |
| 35 to 50 years | 0 (0.0%) | 0.0 |
| Total | 9 (100.0%) | 95.0 |
Fertility by Age by Marriage Status in Saugatuck
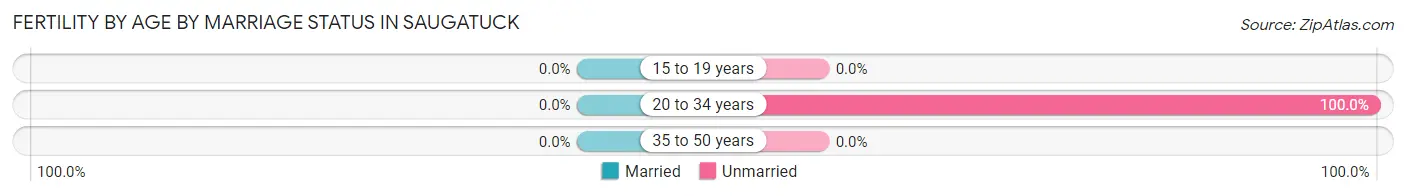
| Age Bracket | Married | Unmarried |
| 15 to 19 years | 0 (0.0%) | 0 (0.0%) |
| 20 to 34 years | 0 (0.0%) | 9 (100.0%) |
| 35 to 50 years | 0 (0.0%) | 0 (0.0%) |
| Total | 0 (0.0%) | 9 (100.0%) |
Fertility by Education in Saugatuck
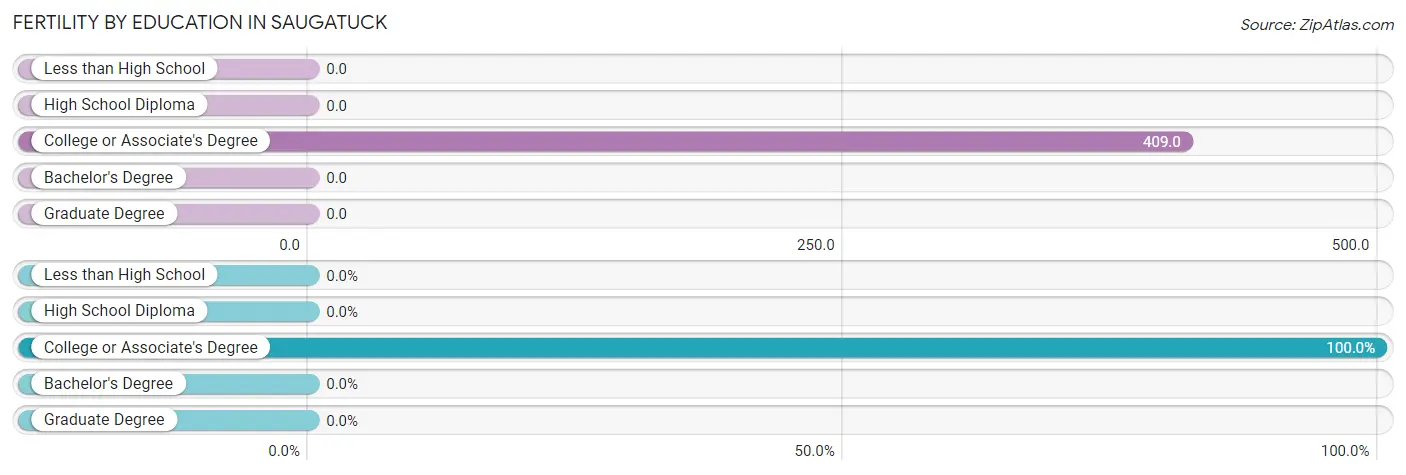
| Educational Attainment | Women with Births | Births / 1,000 Women |
| Less than High School | 0 (0.0%) | 0.0 |
| High School Diploma | 0 (0.0%) | 0.0 |
| College or Associate's Degree | 9 (100.0%) | 409.0 |
| Bachelor's Degree | 0 (0.0%) | 0.0 |
| Graduate Degree | 0 (0.0%) | 0.0 |
| Total | 9 (100.0%) | 95.0 |
Fertility by Education by Marriage Status in Saugatuck
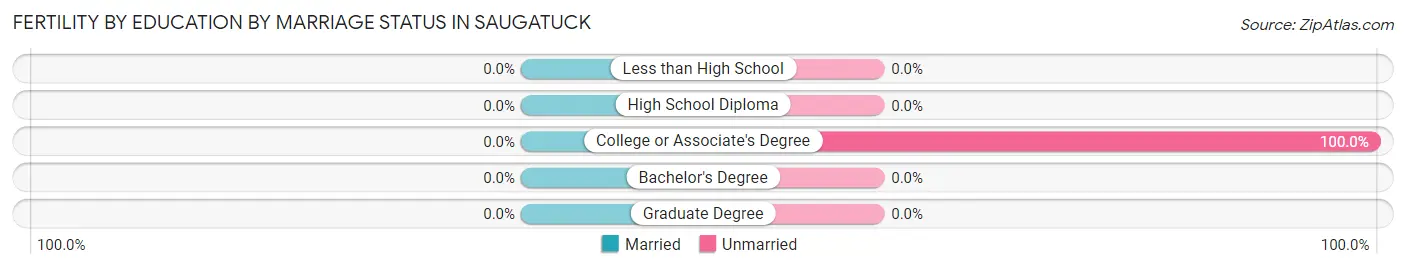
| Educational Attainment | Married | Unmarried |
| Less than High School | 0 (0.0%) | 0 (0.0%) |
| High School Diploma | 0 (0.0%) | 0 (0.0%) |
| College or Associate's Degree | 0 (0.0%) | 9 (100.0%) |
| Bachelor's Degree | 0 (0.0%) | 0 (0.0%) |
| Graduate Degree | 0 (0.0%) | 0 (0.0%) |
| Total | 0 (0.0%) | 9 (100.0%) |
Employment Characteristics in Saugatuck
Employment by Class of Employer in Saugatuck
Among the 339 employed individuals in Saugatuck, private company employees (209 | 61.7%), self-employed (incorporated) (59 | 17.4%), and self-employed (not incorporated) (32 | 9.4%) make up the most common classes of employment.
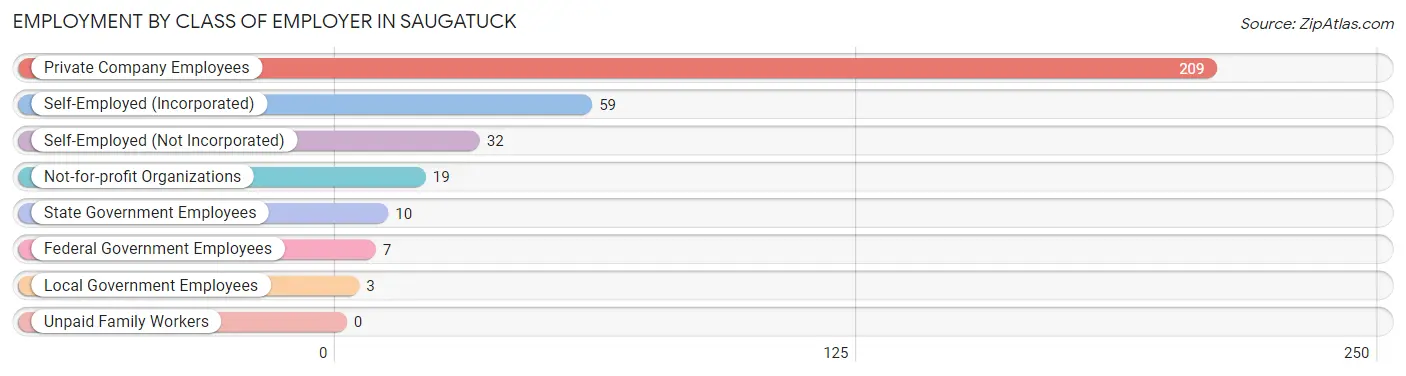
| Employer Class | # Employees | % Employees |
| Private Company Employees | 209 | 61.7% |
| Self-Employed (Incorporated) | 59 | 17.4% |
| Self-Employed (Not Incorporated) | 32 | 9.4% |
| Not-for-profit Organizations | 19 | 5.6% |
| Local Government Employees | 3 | 0.9% |
| State Government Employees | 10 | 2.9% |
| Federal Government Employees | 7 | 2.1% |
| Unpaid Family Workers | 0 | 0.0% |
| Total | 339 | 100.0% |
Employment Status by Age in Saugatuck
According to the labor force statistics for Saugatuck, out of the total population over 16 years of age (689), 50.4% or 347 individuals are in the labor force, with 2.3% or 8 of them unemployed. The age group with the highest labor force participation rate is 25 to 29 years, with 100.0% or 4 individuals in the labor force. Within the labor force, the 65 to 74 years age range has the highest percentage of unemployed individuals, with 6.5% or 3 of them being unemployed.
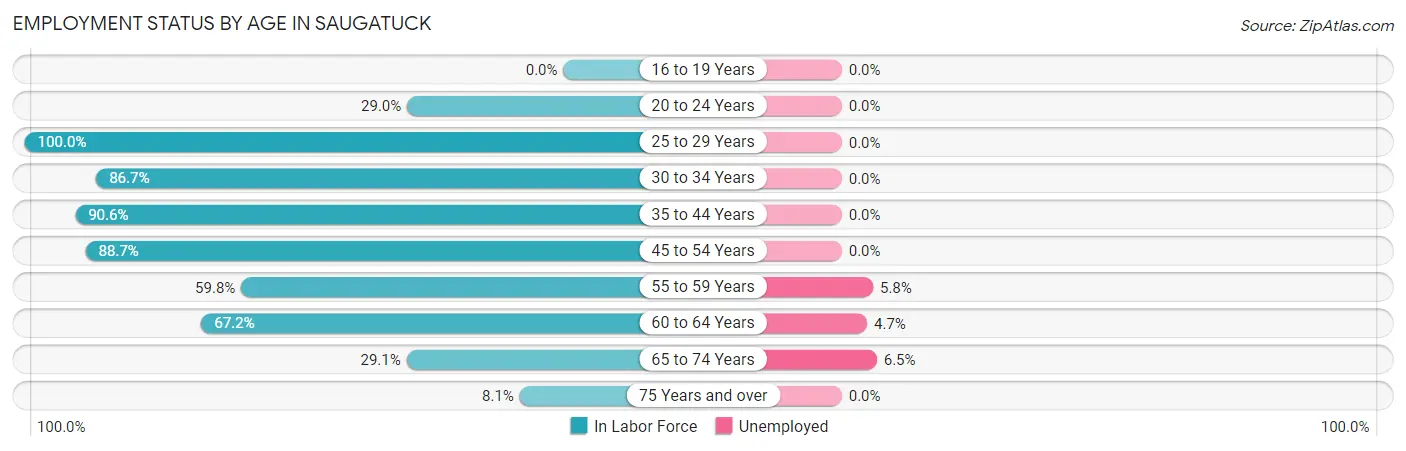
| Age Bracket | In Labor Force | Unemployed |
| 16 to 19 Years | 0 (0.0%) | 0 (0.0%) |
| 20 to 24 Years | 9 (29.0%) | 0 (0.0%) |
| 25 to 29 Years | 4 (100.0%) | 0 (0.0%) |
| 30 to 34 Years | 13 (86.7%) | 0 (0.0%) |
| 35 to 44 Years | 29 (90.6%) | 0 (0.0%) |
| 45 to 54 Years | 141 (88.7%) | 0 (0.0%) |
| 55 to 59 Years | 52 (59.8%) | 3 (5.8%) |
| 60 to 64 Years | 43 (67.2%) | 2 (4.7%) |
| 65 to 74 Years | 46 (29.1%) | 3 (6.5%) |
| 75 Years and over | 10 (8.1%) | 0 (0.0%) |
| Total | 347 (50.4%) | 8 (2.3%) |
Employment Status by Educational Attainment in Saugatuck
According to labor force statistics for Saugatuck, 78.1% of individuals (282) out of the total population between 25 and 64 years of age (361) are in the labor force, with 1.8% or 5 of them being unemployed. The group with the highest labor force participation rate are those with the educational attainment of bachelor's degree or higher, with 82.8% or 217 individuals in the labor force. Within the labor force, individuals with bachelor's degree or higher education have the highest percentage of unemployment, with 2.3% or 5 of them being unemployed.
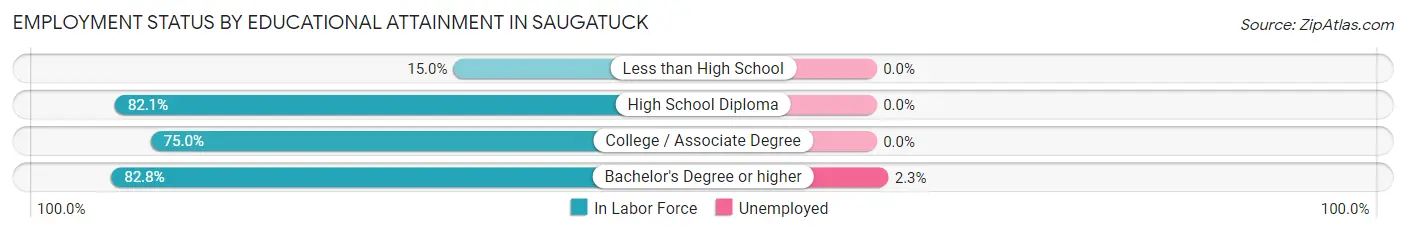
| Educational Attainment | In Labor Force | Unemployed |
| Less than High School | 3 (15.0%) | 0 (0.0%) |
| High School Diploma | 32 (82.1%) | 0 (0.0%) |
| College / Associate Degree | 30 (75.0%) | 0 (0.0%) |
| Bachelor's Degree or higher | 217 (82.8%) | 6 (2.3%) |
| Total | 282 (78.1%) | 6 (1.8%) |
Employment Occupations by Sex in Saugatuck
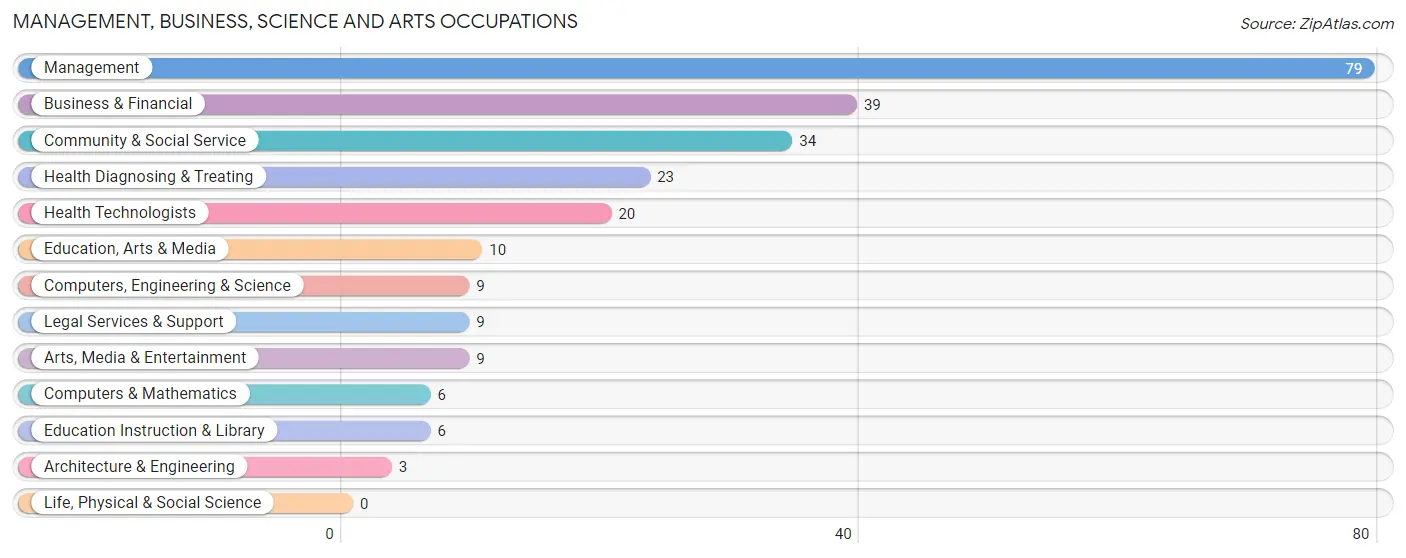
Management, Business, Science and Arts Occupations
The most common Management, Business, Science and Arts occupations in Saugatuck are Management (79 | 23.3%), Business & Financial (39 | 11.5%), Community & Social Service (34 | 10.0%), Health Diagnosing & Treating (23 | 6.8%), and Health Technologists (20 | 5.9%).
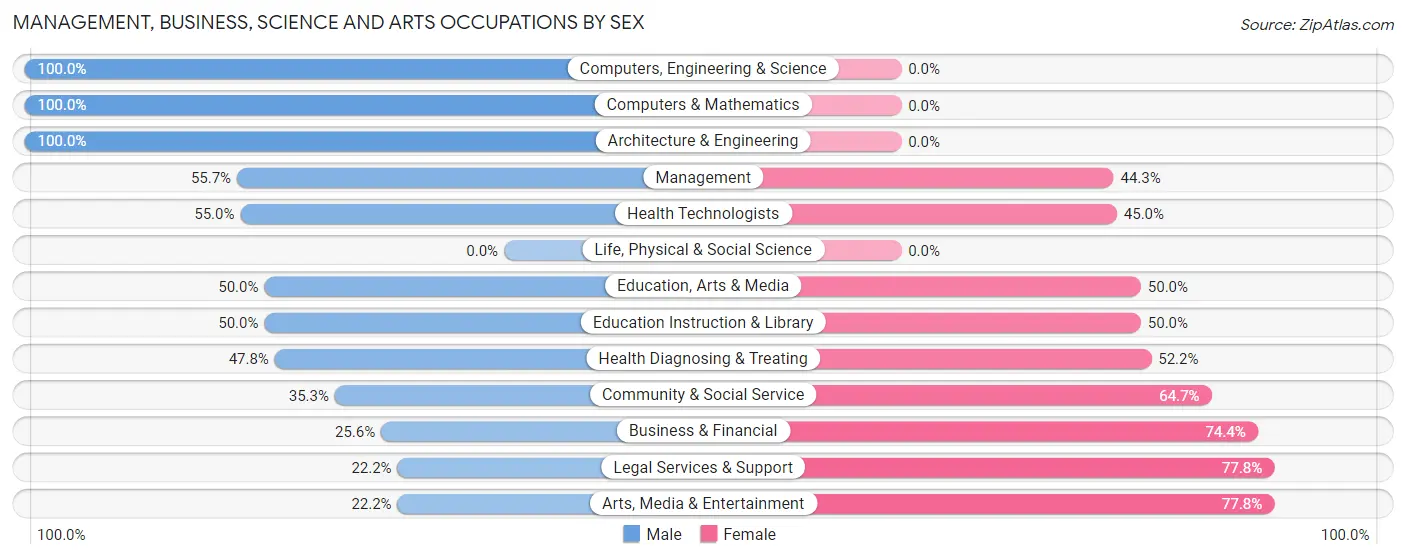
Management, Business, Science and Arts Occupations by Sex
Within the Management, Business, Science and Arts occupations in Saugatuck, the most male-oriented occupations are Computers, Engineering & Science (100.0%), Computers & Mathematics (100.0%), and Architecture & Engineering (100.0%), while the most female-oriented occupations are Legal Services & Support (77.8%), Arts, Media & Entertainment (77.8%), and Business & Financial (74.4%).
| Occupation | Male | Female |
| Management | 44 (55.7%) | 35 (44.3%) |
| Business & Financial | 10 (25.6%) | 29 (74.4%) |
| Computers, Engineering & Science | 9 (100.0%) | 0 (0.0%) |
| Computers & Mathematics | 6 (100.0%) | 0 (0.0%) |
| Architecture & Engineering | 3 (100.0%) | 0 (0.0%) |
| Life, Physical & Social Science | 0 (0.0%) | 0 (0.0%) |
| Community & Social Service | 12 (35.3%) | 22 (64.7%) |
| Education, Arts & Media | 5 (50.0%) | 5 (50.0%) |
| Legal Services & Support | 2 (22.2%) | 7 (77.8%) |
| Education Instruction & Library | 3 (50.0%) | 3 (50.0%) |
| Arts, Media & Entertainment | 2 (22.2%) | 7 (77.8%) |
| Health Diagnosing & Treating | 11 (47.8%) | 12 (52.2%) |
| Health Technologists | 11 (55.0%) | 9 (45.0%) |
| Total (Category) | 86 (46.7%) | 98 (53.3%) |
| Total (Overall) | 207 (61.1%) | 132 (38.9%) |
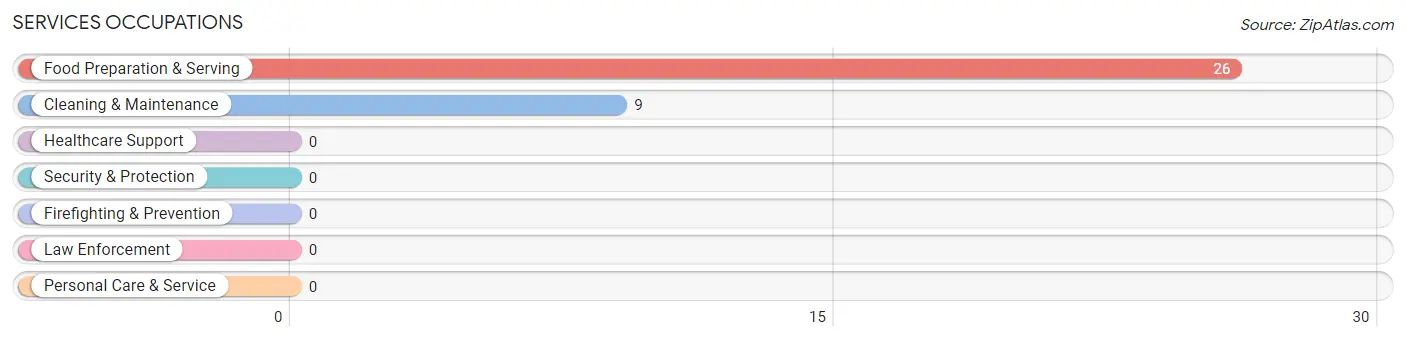
Services Occupations
The most common Services occupations in Saugatuck are Food Preparation & Serving (26 | 7.7%), and Cleaning & Maintenance (9 | 2.6%).
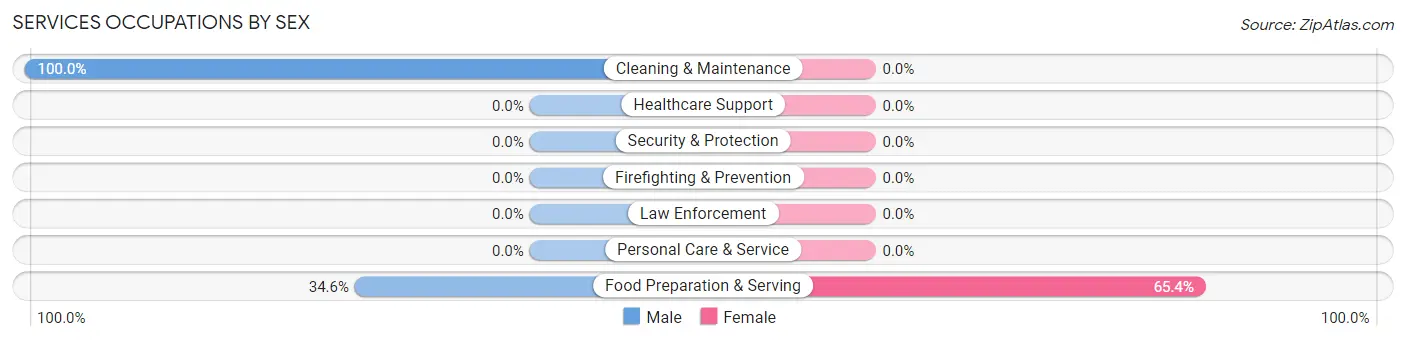
Services Occupations by Sex
| Occupation | Male | Female |
| Healthcare Support | 0 (0.0%) | 0 (0.0%) |
| Security & Protection | 0 (0.0%) | 0 (0.0%) |
| Firefighting & Prevention | 0 (0.0%) | 0 (0.0%) |
| Law Enforcement | 0 (0.0%) | 0 (0.0%) |
| Food Preparation & Serving | 9 (34.6%) | 17 (65.4%) |
| Cleaning & Maintenance | 9 (100.0%) | 0 (0.0%) |
| Personal Care & Service | 0 (0.0%) | 0 (0.0%) |
| Total (Category) | 18 (51.4%) | 17 (48.6%) |
| Total (Overall) | 207 (61.1%) | 132 (38.9%) |
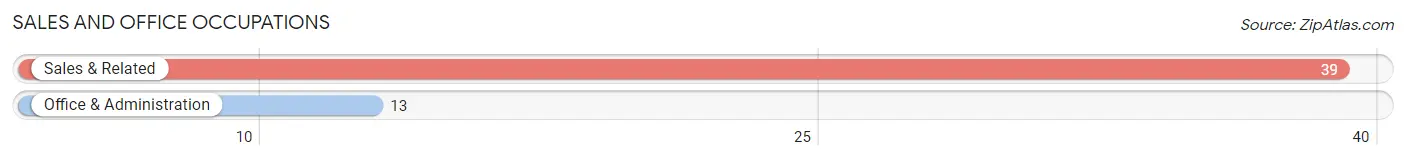
Sales and Office Occupations
The most common Sales and Office occupations in Saugatuck are Sales & Related (39 | 11.5%), and Office & Administration (13 | 3.8%).
Sales and Office Occupations by Sex
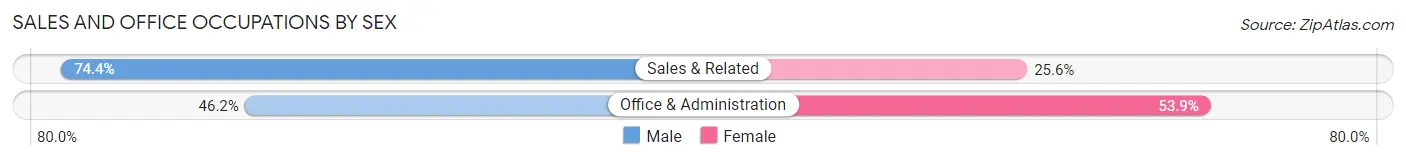
| Occupation | Male | Female |
| Sales & Related | 29 (74.4%) | 10 (25.6%) |
| Office & Administration | 6 (46.2%) | 7 (53.8%) |
| Total (Category) | 35 (67.3%) | 17 (32.7%) |
| Total (Overall) | 207 (61.1%) | 132 (38.9%) |
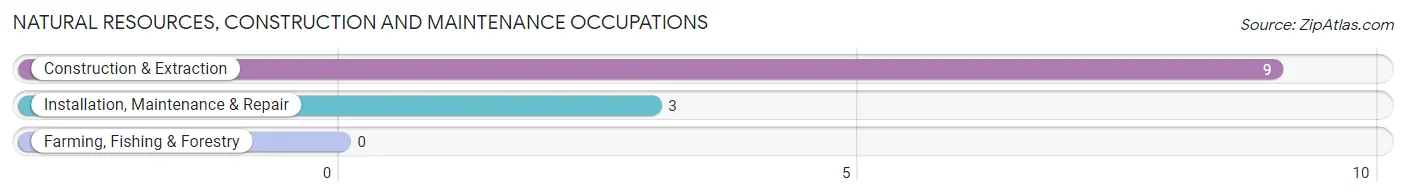
Natural Resources, Construction and Maintenance Occupations
The most common Natural Resources, Construction and Maintenance occupations in Saugatuck are Construction & Extraction (9 | 2.6%), and Installation, Maintenance & Repair (3 | 0.9%).
Natural Resources, Construction and Maintenance Occupations by Sex
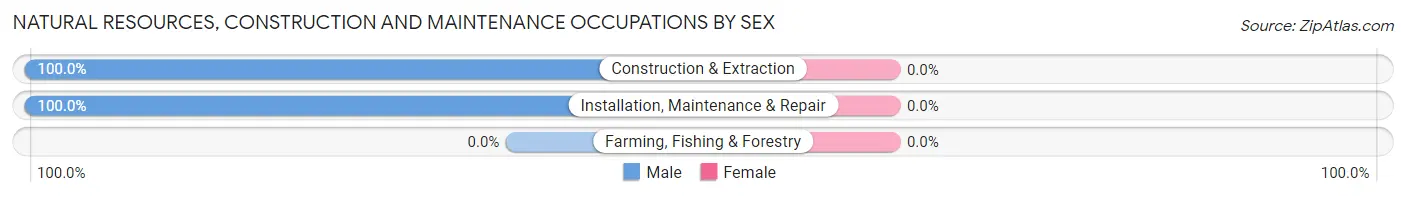
| Occupation | Male | Female |
| Farming, Fishing & Forestry | 0 (0.0%) | 0 (0.0%) |
| Construction & Extraction | 9 (100.0%) | 0 (0.0%) |
| Installation, Maintenance & Repair | 3 (100.0%) | 0 (0.0%) |
| Total (Category) | 12 (100.0%) | 0 (0.0%) |
| Total (Overall) | 207 (61.1%) | 132 (38.9%) |
Production, Transportation and Moving Occupations
The most common Production, Transportation and Moving occupations in Saugatuck are Transportation (51 | 15.0%), and Production (5 | 1.5%).
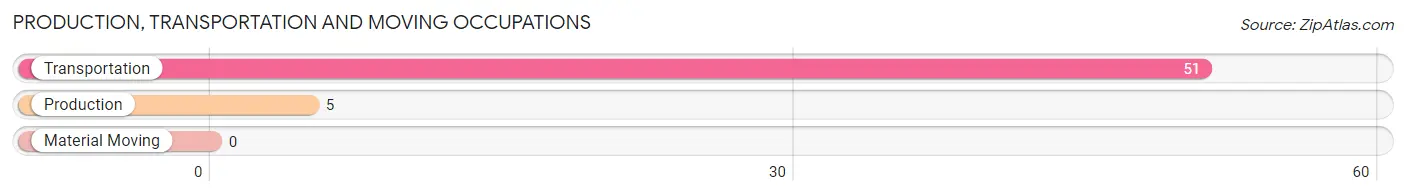
Production, Transportation and Moving Occupations by Sex
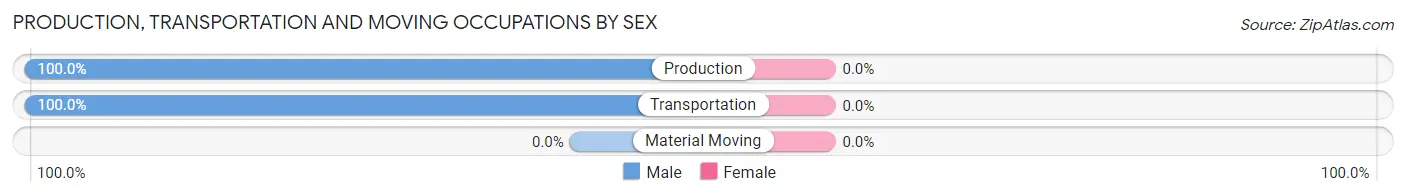
| Occupation | Male | Female |
| Production | 5 (100.0%) | 0 (0.0%) |
| Transportation | 51 (100.0%) | 0 (0.0%) |
| Material Moving | 0 (0.0%) | 0 (0.0%) |
| Total (Category) | 56 (100.0%) | 0 (0.0%) |
| Total (Overall) | 207 (61.1%) | 132 (38.9%) |
Employment Industries by Sex in Saugatuck
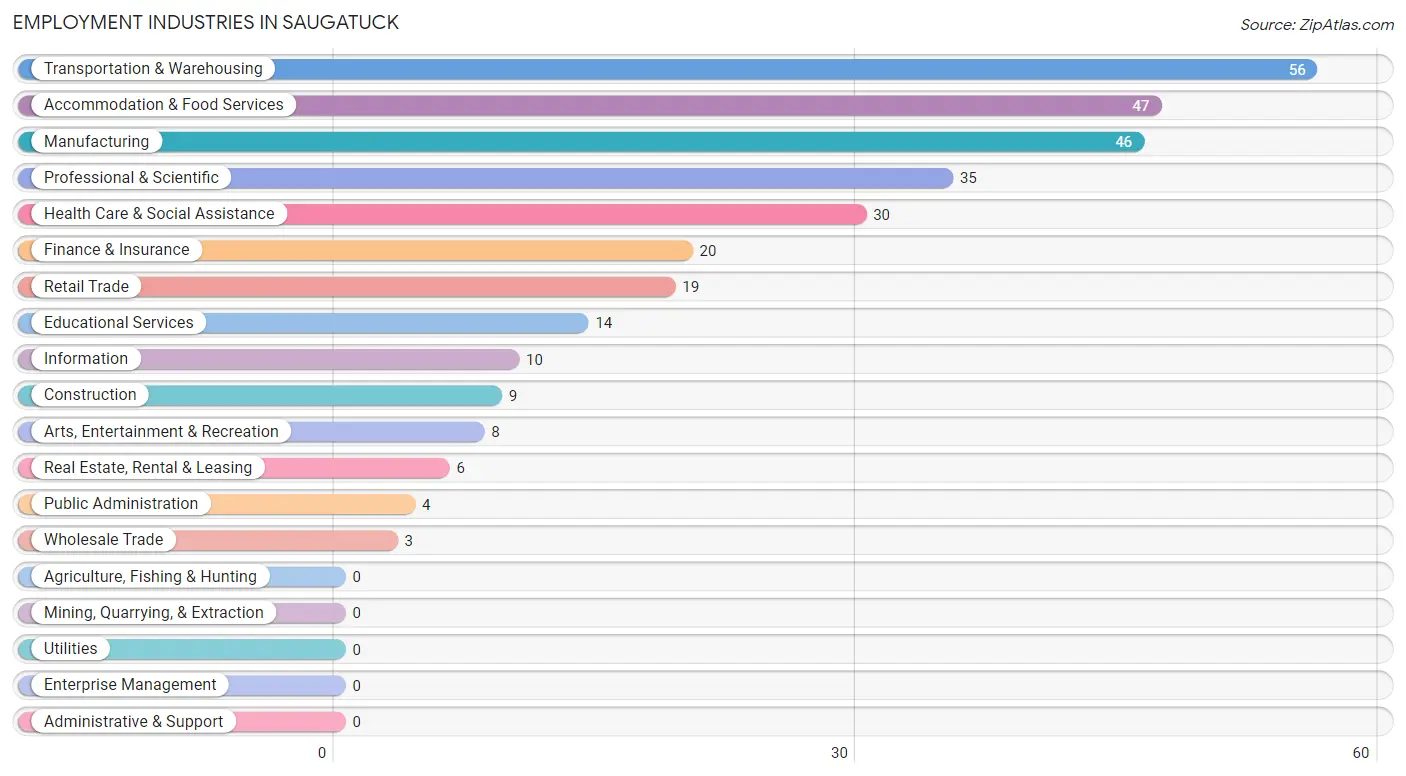
Employment Industries in Saugatuck
The major employment industries in Saugatuck include Transportation & Warehousing (56 | 16.5%), Accommodation & Food Services (47 | 13.9%), Manufacturing (46 | 13.6%), Professional & Scientific (35 | 10.3%), and Health Care & Social Assistance (30 | 8.8%).
Employment Industries by Sex in Saugatuck
The Saugatuck industries that see more men than women are Construction (100.0%), Wholesale Trade (100.0%), and Information (100.0%), whereas the industries that tend to have a higher number of women are Public Administration (100.0%), Educational Services (78.6%), and Health Care & Social Assistance (63.3%).
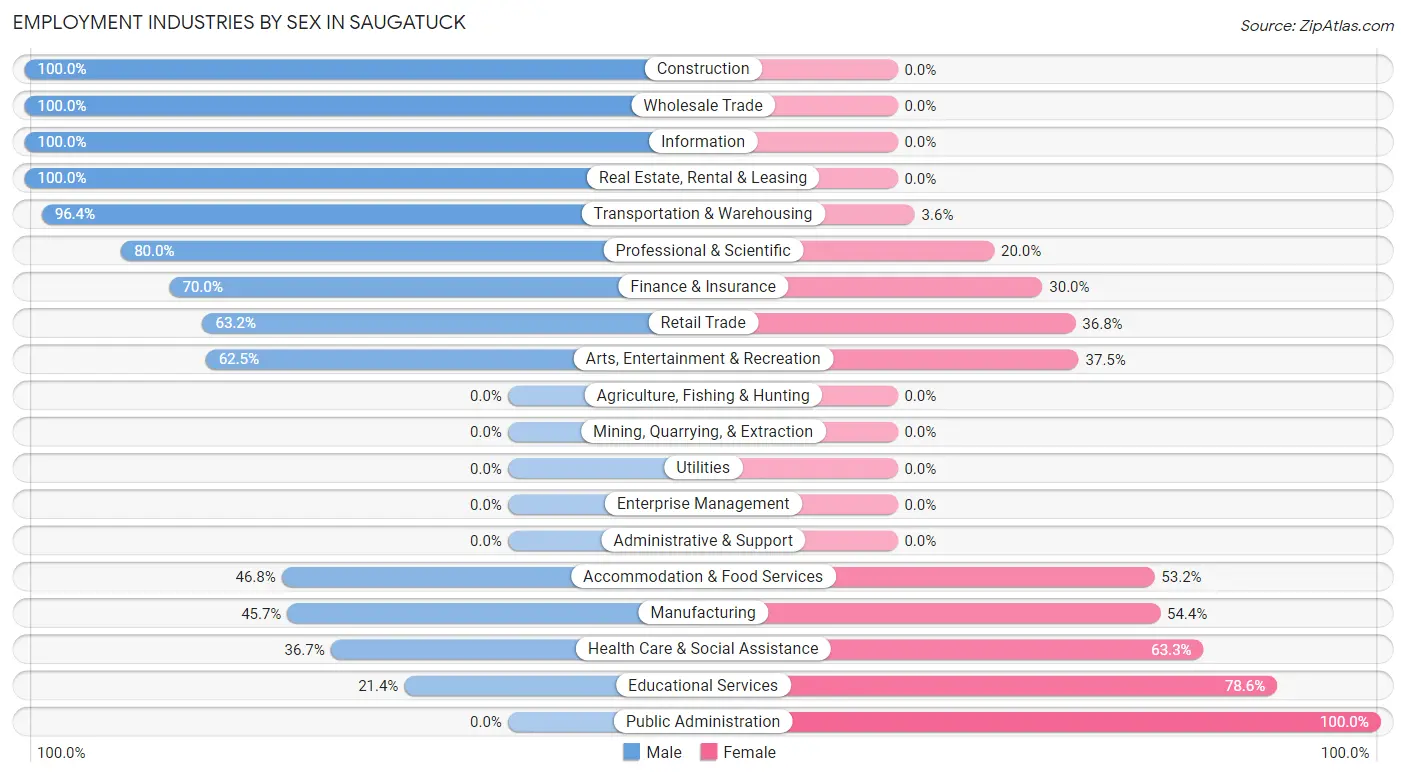
| Industry | Male | Female |
| Agriculture, Fishing & Hunting | 0 (0.0%) | 0 (0.0%) |
| Mining, Quarrying, & Extraction | 0 (0.0%) | 0 (0.0%) |
| Construction | 9 (100.0%) | 0 (0.0%) |
| Manufacturing | 21 (45.7%) | 25 (54.3%) |
| Wholesale Trade | 3 (100.0%) | 0 (0.0%) |
| Retail Trade | 12 (63.2%) | 7 (36.8%) |
| Transportation & Warehousing | 54 (96.4%) | 2 (3.6%) |
| Utilities | 0 (0.0%) | 0 (0.0%) |
| Information | 10 (100.0%) | 0 (0.0%) |
| Finance & Insurance | 14 (70.0%) | 6 (30.0%) |
| Real Estate, Rental & Leasing | 6 (100.0%) | 0 (0.0%) |
| Professional & Scientific | 28 (80.0%) | 7 (20.0%) |
| Enterprise Management | 0 (0.0%) | 0 (0.0%) |
| Administrative & Support | 0 (0.0%) | 0 (0.0%) |
| Educational Services | 3 (21.4%) | 11 (78.6%) |
| Health Care & Social Assistance | 11 (36.7%) | 19 (63.3%) |
| Arts, Entertainment & Recreation | 5 (62.5%) | 3 (37.5%) |
| Accommodation & Food Services | 22 (46.8%) | 25 (53.2%) |
| Public Administration | 0 (0.0%) | 4 (100.0%) |
| Total | 207 (61.1%) | 132 (38.9%) |
Education in Saugatuck
School Enrollment in Saugatuck
The most common levels of schooling among the 91 students in Saugatuck are high school (32 | 35.2%), graduate / professional (21 | 23.1%), and middle school (20 | 22.0%).
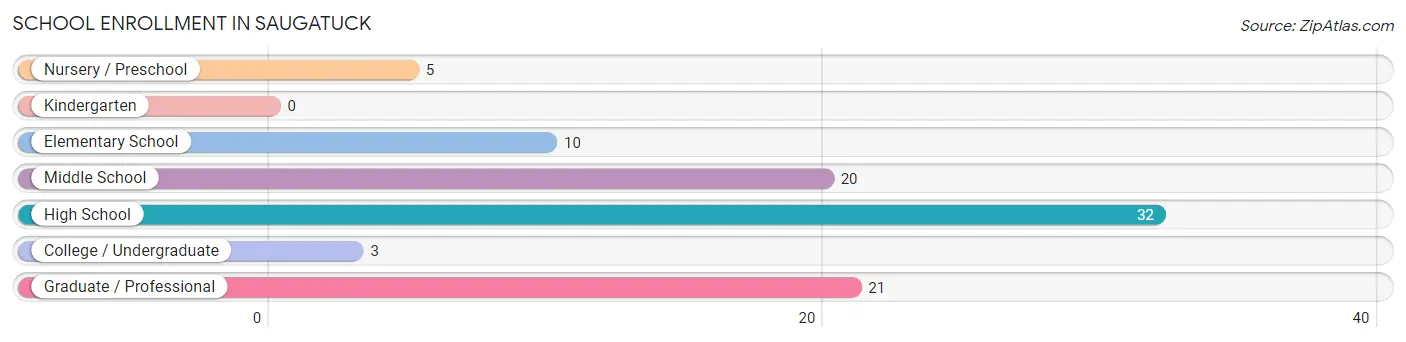
| School Level | # Students | % Students |
| Nursery / Preschool | 5 | 5.5% |
| Kindergarten | 0 | 0.0% |
| Elementary School | 10 | 11.0% |
| Middle School | 20 | 22.0% |
| High School | 32 | 35.2% |
| College / Undergraduate | 3 | 3.3% |
| Graduate / Professional | 21 | 23.1% |
| Total | 91 | 100.0% |
School Enrollment by Age by Funding Source in Saugatuck
Out of a total of 91 students who are enrolled in schools in Saugatuck, 38 (41.8%) attend a private institution, while the remaining 53 (58.2%) are enrolled in public schools. The age group of 3 to 4 year olds has the highest likelihood of being enrolled in private schools, with 5 (100.0% in the age bracket) enrolled. Conversely, the age group of 10 to 14 year olds has the lowest likelihood of being enrolled in a private school, with 20 (100.0% in the age bracket) attending a public institution.
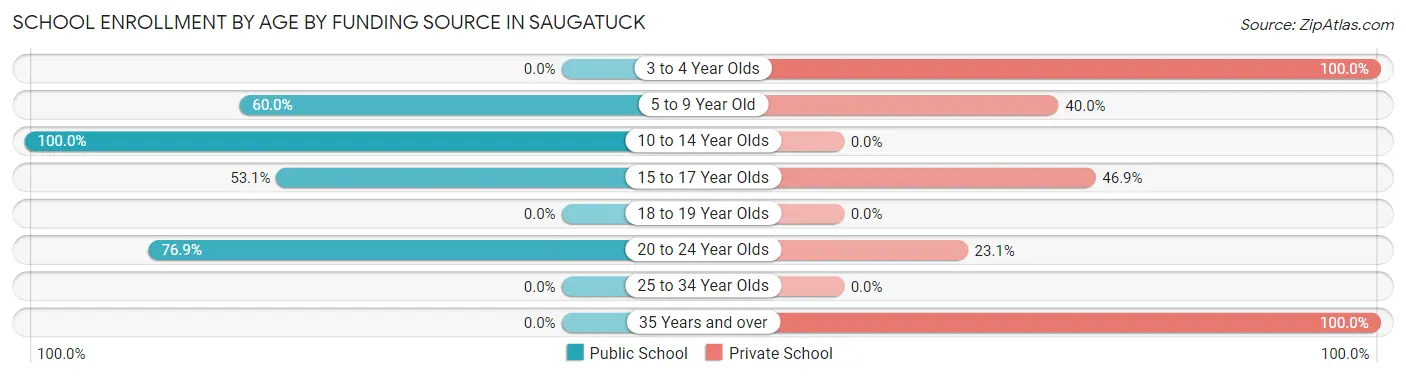
| Age Bracket | Public School | Private School |
| 3 to 4 Year Olds | 0 (0.0%) | 5 (100.0%) |
| 5 to 9 Year Old | 6 (60.0%) | 4 (40.0%) |
| 10 to 14 Year Olds | 20 (100.0%) | 0 (0.0%) |
| 15 to 17 Year Olds | 17 (53.1%) | 15 (46.9%) |
| 18 to 19 Year Olds | 0 (0.0%) | 0 (0.0%) |
| 20 to 24 Year Olds | 10 (76.9%) | 3 (23.1%) |
| 25 to 34 Year Olds | 0 (0.0%) | 0 (0.0%) |
| 35 Years and over | 0 (0.0%) | 11 (100.0%) |
| Total | 53 (58.2%) | 38 (41.8%) |
Educational Attainment by Field of Study in Saugatuck
Business (105 | 19.3%), education (85 | 15.6%), arts & humanities (77 | 14.1%), science & technology (55 | 10.1%), and social sciences (48 | 8.8%) are the most common fields of study among 545 individuals in Saugatuck who have obtained a bachelor's degree or higher.
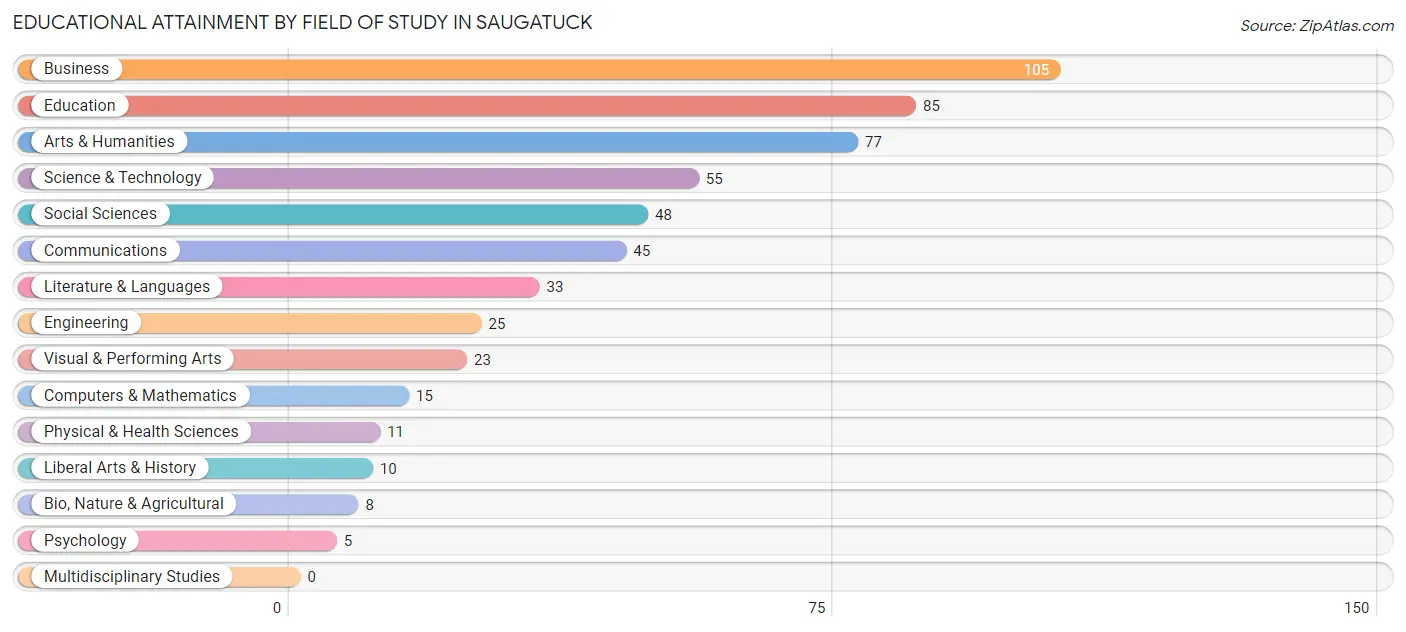
| Field of Study | # Graduates | % Graduates |
| Computers & Mathematics | 15 | 2.8% |
| Bio, Nature & Agricultural | 8 | 1.5% |
| Physical & Health Sciences | 11 | 2.0% |
| Psychology | 5 | 0.9% |
| Social Sciences | 48 | 8.8% |
| Engineering | 25 | 4.6% |
| Multidisciplinary Studies | 0 | 0.0% |
| Science & Technology | 55 | 10.1% |
| Business | 105 | 19.3% |
| Education | 85 | 15.6% |
| Literature & Languages | 33 | 6.1% |
| Liberal Arts & History | 10 | 1.8% |
| Visual & Performing Arts | 23 | 4.2% |
| Communications | 45 | 8.3% |
| Arts & Humanities | 77 | 14.1% |
| Total | 545 | 100.0% |
Transportation & Commute in Saugatuck
Vehicle Availability by Sex in Saugatuck
The most prevalent vehicle ownership categories in Saugatuck are males with 1 vehicle (80, accounting for 38.7%) and females with 1 vehicle (43, making up 60.6%).
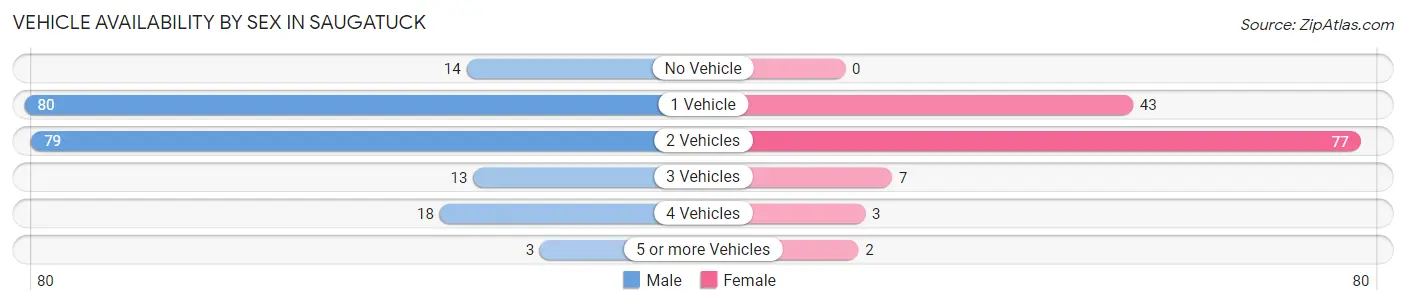
| Vehicles Available | Male | Female |
| No Vehicle | 14 (6.8%) | 0 (0.0%) |
| 1 Vehicle | 80 (38.7%) | 43 (32.6%) |
| 2 Vehicles | 79 (38.2%) | 77 (58.3%) |
| 3 Vehicles | 13 (6.3%) | 7 (5.3%) |
| 4 Vehicles | 18 (8.7%) | 3 (2.3%) |
| 5 or more Vehicles | 3 (1.5%) | 2 (1.5%) |
| Total | 207 (100.0%) | 132 (100.0%) |
Commute Time in Saugatuck
The most frequently occuring commute durations in Saugatuck are 90 or more minutes (77 commuters, 28.9%), 20 to 24 minutes (47 commuters, 17.7%), and less than 5 minutes (27 commuters, 10.2%).
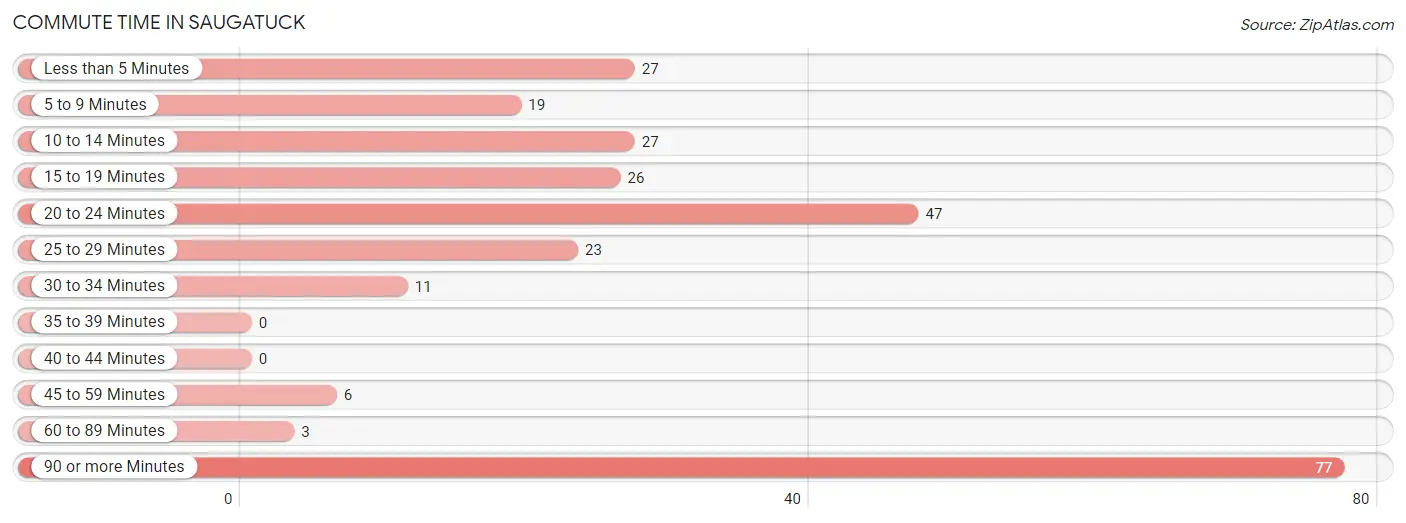
| Commute Time | # Commuters | % Commuters |
| Less than 5 Minutes | 27 | 10.2% |
| 5 to 9 Minutes | 19 | 7.1% |
| 10 to 14 Minutes | 27 | 10.2% |
| 15 to 19 Minutes | 26 | 9.8% |
| 20 to 24 Minutes | 47 | 17.7% |
| 25 to 29 Minutes | 23 | 8.6% |
| 30 to 34 Minutes | 11 | 4.1% |
| 35 to 39 Minutes | 0 | 0.0% |
| 40 to 44 Minutes | 0 | 0.0% |
| 45 to 59 Minutes | 6 | 2.3% |
| 60 to 89 Minutes | 3 | 1.1% |
| 90 or more Minutes | 77 | 28.9% |
Commute Time by Sex in Saugatuck
The most common commute times in Saugatuck are 90 or more minutes (74 commuters, 43.5%) for males and 15 to 19 minutes (23 commuters, 24.0%) for females.
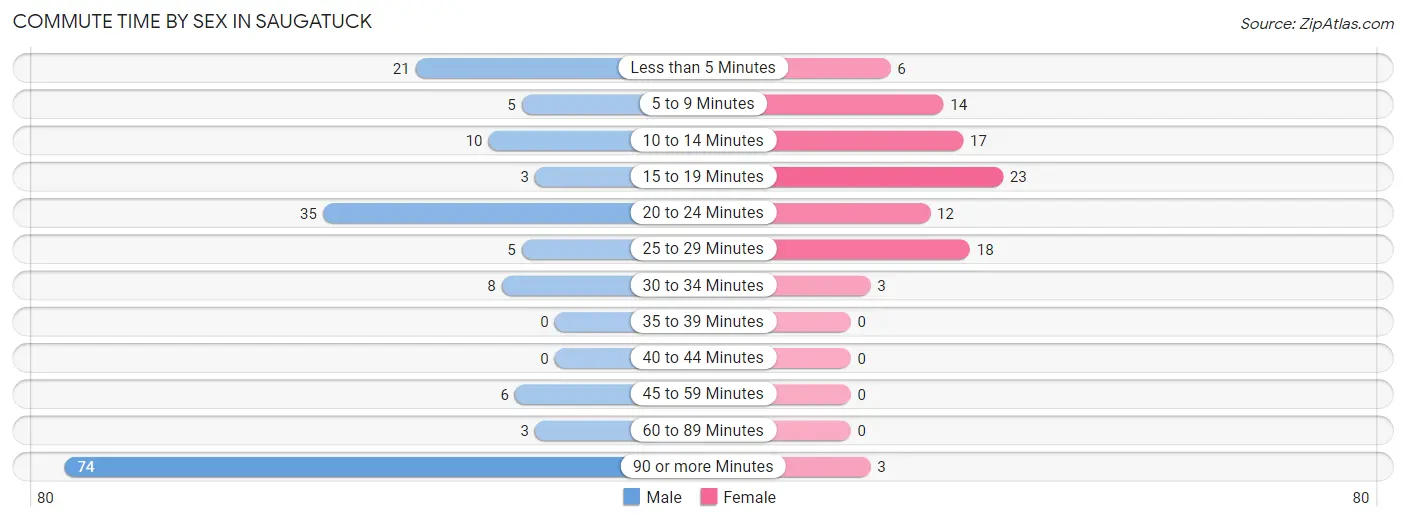
| Commute Time | Male | Female |
| Less than 5 Minutes | 21 (12.3%) | 6 (6.2%) |
| 5 to 9 Minutes | 5 (2.9%) | 14 (14.6%) |
| 10 to 14 Minutes | 10 (5.9%) | 17 (17.7%) |
| 15 to 19 Minutes | 3 (1.8%) | 23 (24.0%) |
| 20 to 24 Minutes | 35 (20.6%) | 12 (12.5%) |
| 25 to 29 Minutes | 5 (2.9%) | 18 (18.8%) |
| 30 to 34 Minutes | 8 (4.7%) | 3 (3.1%) |
| 35 to 39 Minutes | 0 (0.0%) | 0 (0.0%) |
| 40 to 44 Minutes | 0 (0.0%) | 0 (0.0%) |
| 45 to 59 Minutes | 6 (3.5%) | 0 (0.0%) |
| 60 to 89 Minutes | 3 (1.8%) | 0 (0.0%) |
| 90 or more Minutes | 74 (43.5%) | 3 (3.1%) |
Time of Departure to Work by Sex in Saugatuck
The most frequent times of departure to work in Saugatuck are 6:30 AM to 6:59 AM (65, 38.2%) for males and 7:30 AM to 7:59 AM (28, 29.2%) for females.
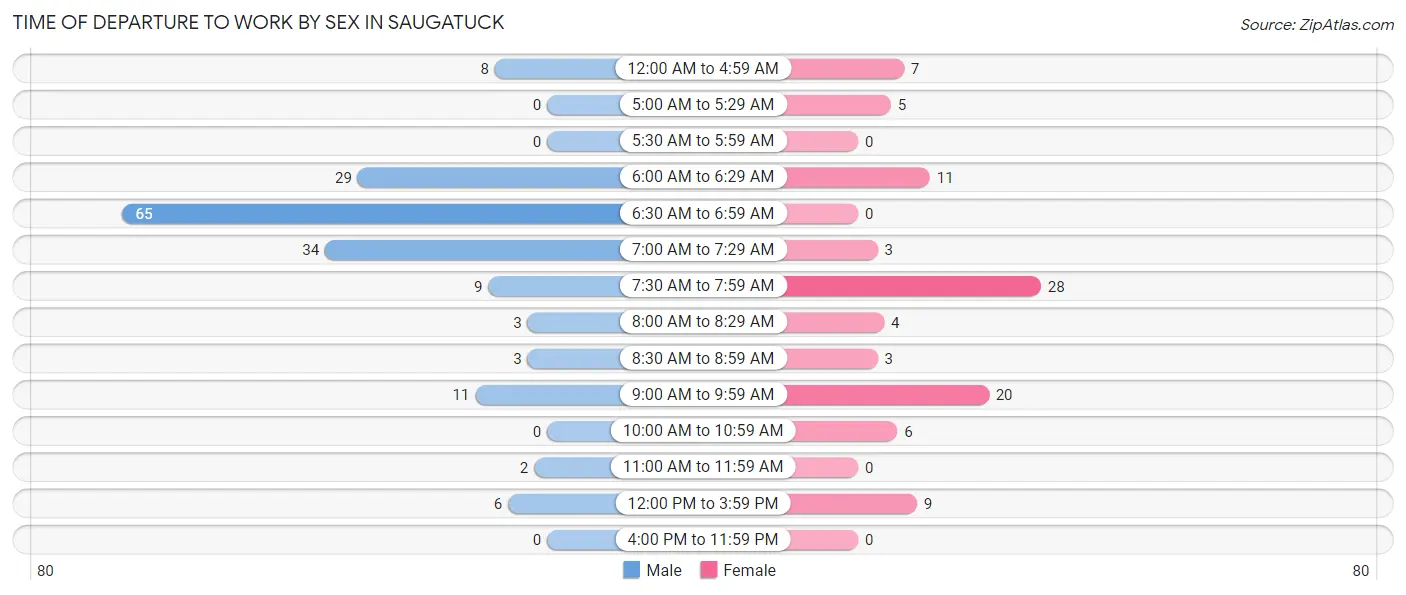
| Time of Departure | Male | Female |
| 12:00 AM to 4:59 AM | 8 (4.7%) | 7 (7.3%) |
| 5:00 AM to 5:29 AM | 0 (0.0%) | 5 (5.2%) |
| 5:30 AM to 5:59 AM | 0 (0.0%) | 0 (0.0%) |
| 6:00 AM to 6:29 AM | 29 (17.1%) | 11 (11.5%) |
| 6:30 AM to 6:59 AM | 65 (38.2%) | 0 (0.0%) |
| 7:00 AM to 7:29 AM | 34 (20.0%) | 3 (3.1%) |
| 7:30 AM to 7:59 AM | 9 (5.3%) | 28 (29.2%) |
| 8:00 AM to 8:29 AM | 3 (1.8%) | 4 (4.2%) |
| 8:30 AM to 8:59 AM | 3 (1.8%) | 3 (3.1%) |
| 9:00 AM to 9:59 AM | 11 (6.5%) | 20 (20.8%) |
| 10:00 AM to 10:59 AM | 0 (0.0%) | 6 (6.2%) |
| 11:00 AM to 11:59 AM | 2 (1.2%) | 0 (0.0%) |
| 12:00 PM to 3:59 PM | 6 (3.5%) | 9 (9.4%) |
| 4:00 PM to 11:59 PM | 0 (0.0%) | 0 (0.0%) |
| Total | 170 (100.0%) | 96 (100.0%) |
Housing Occupancy in Saugatuck
Occupancy by Ownership in Saugatuck
Of the total 407 dwellings in Saugatuck, owner-occupied units account for 326 (80.1%), while renter-occupied units make up 81 (19.9%).
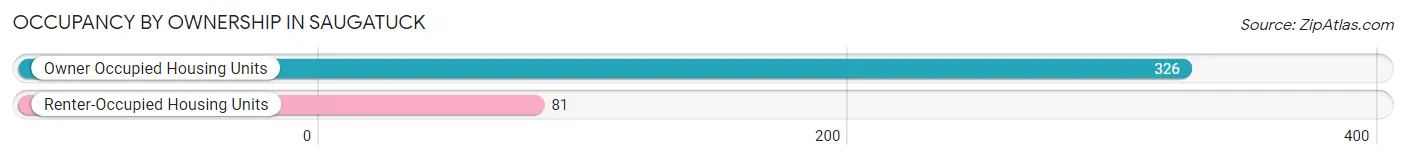
| Occupancy | # Housing Units | % Housing Units |
| Owner Occupied Housing Units | 326 | 80.1% |
| Renter-Occupied Housing Units | 81 | 19.9% |
| Total Occupied Housing Units | 407 | 100.0% |
Occupancy by Household Size in Saugatuck
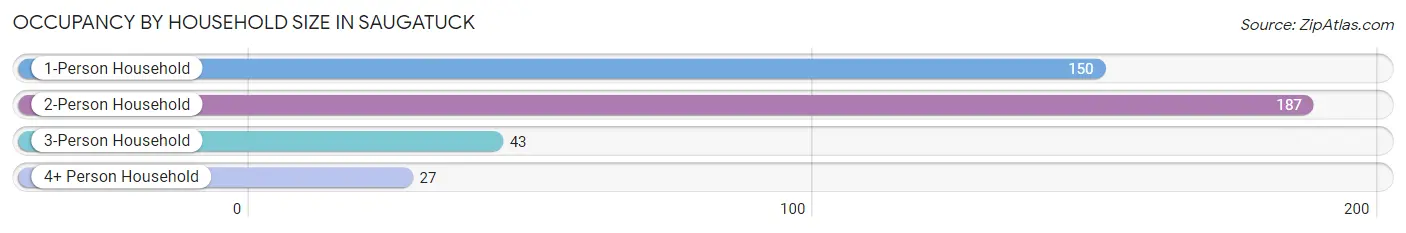
| Household Size | # Housing Units | % Housing Units |
| 1-Person Household | 150 | 36.9% |
| 2-Person Household | 187 | 46.0% |
| 3-Person Household | 43 | 10.6% |
| 4+ Person Household | 27 | 6.6% |
| Total Housing Units | 407 | 100.0% |
Occupancy by Ownership by Household Size in Saugatuck
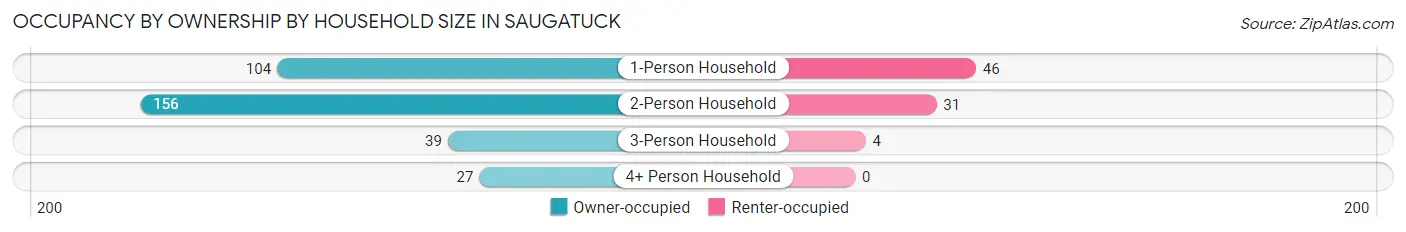
| Household Size | Owner-occupied | Renter-occupied |
| 1-Person Household | 104 (69.3%) | 46 (30.7%) |
| 2-Person Household | 156 (83.4%) | 31 (16.6%) |
| 3-Person Household | 39 (90.7%) | 4 (9.3%) |
| 4+ Person Household | 27 (100.0%) | 0 (0.0%) |
| Total Housing Units | 326 (80.1%) | 81 (19.9%) |
Occupancy by Educational Attainment in Saugatuck
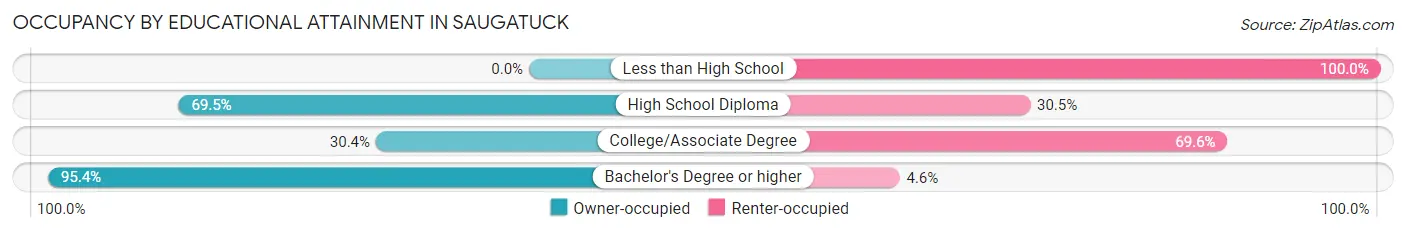
| Household Size | Owner-occupied | Renter-occupied |
| Less than High School | 0 (0.0%) | 11 (100.0%) |
| High School Diploma | 41 (69.5%) | 18 (30.5%) |
| College/Associate Degree | 17 (30.4%) | 39 (69.6%) |
| Bachelor's Degree or higher | 268 (95.4%) | 13 (4.6%) |
Occupancy by Age of Householder in Saugatuck
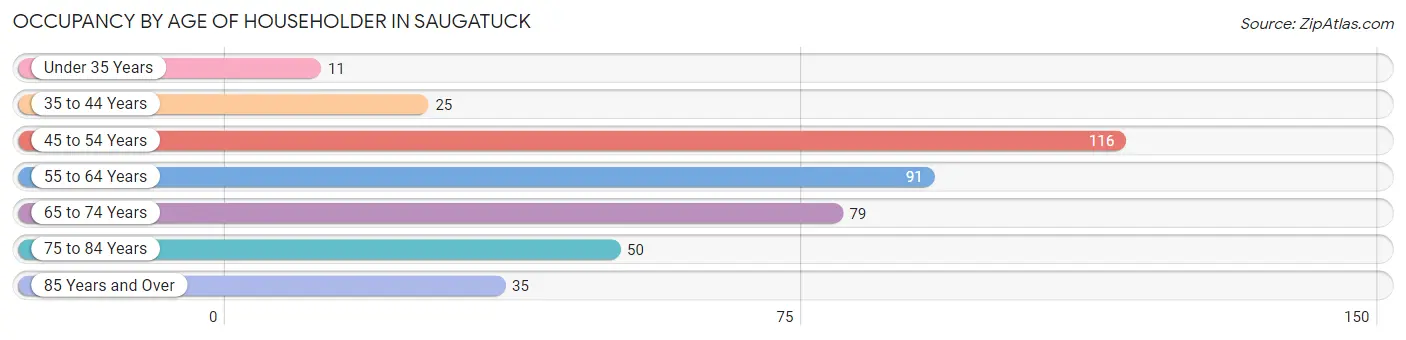
| Age Bracket | # Households | % Households |
| Under 35 Years | 11 | 2.7% |
| 35 to 44 Years | 25 | 6.1% |
| 45 to 54 Years | 116 | 28.5% |
| 55 to 64 Years | 91 | 22.4% |
| 65 to 74 Years | 79 | 19.4% |
| 75 to 84 Years | 50 | 12.3% |
| 85 Years and Over | 35 | 8.6% |
| Total | 407 | 100.0% |
Housing Finances in Saugatuck
Median Income by Occupancy in Saugatuck
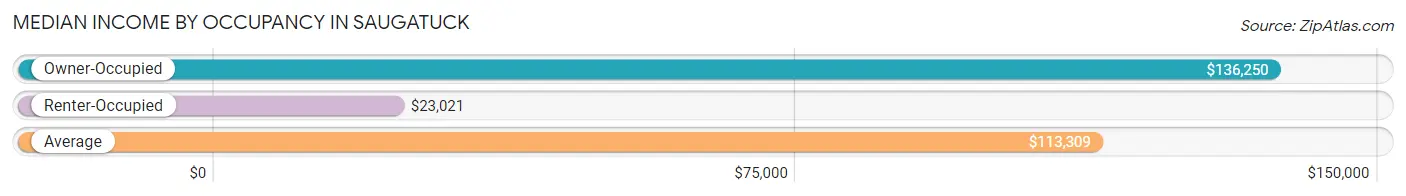
| Occupancy Type | # Households | Median Income |
| Owner-Occupied | 326 (80.1%) | $136,250 |
| Renter-Occupied | 81 (19.9%) | $23,021 |
| Average | 407 (100.0%) | $113,309 |
Occupancy by Householder Income Bracket in Saugatuck
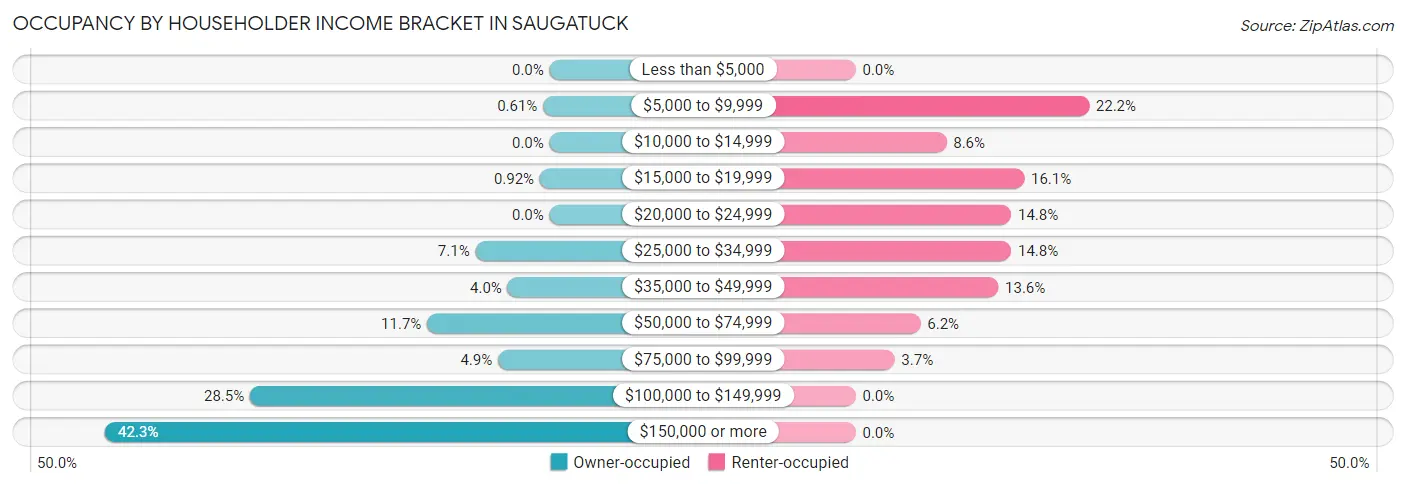
| Income Bracket | Owner-occupied | Renter-occupied |
| Less than $5,000 | 0 (0.0%) | 0 (0.0%) |
| $5,000 to $9,999 | 2 (0.6%) | 18 (22.2%) |
| $10,000 to $14,999 | 0 (0.0%) | 7 (8.6%) |
| $15,000 to $19,999 | 3 (0.9%) | 13 (16.1%) |
| $20,000 to $24,999 | 0 (0.0%) | 12 (14.8%) |
| $25,000 to $34,999 | 23 (7.1%) | 12 (14.8%) |
| $35,000 to $49,999 | 13 (4.0%) | 11 (13.6%) |
| $50,000 to $74,999 | 38 (11.7%) | 5 (6.2%) |
| $75,000 to $99,999 | 16 (4.9%) | 3 (3.7%) |
| $100,000 to $149,999 | 93 (28.5%) | 0 (0.0%) |
| $150,000 or more | 138 (42.3%) | 0 (0.0%) |
| Total | 326 (100.0%) | 81 (100.0%) |
Monthly Housing Cost Tiers in Saugatuck
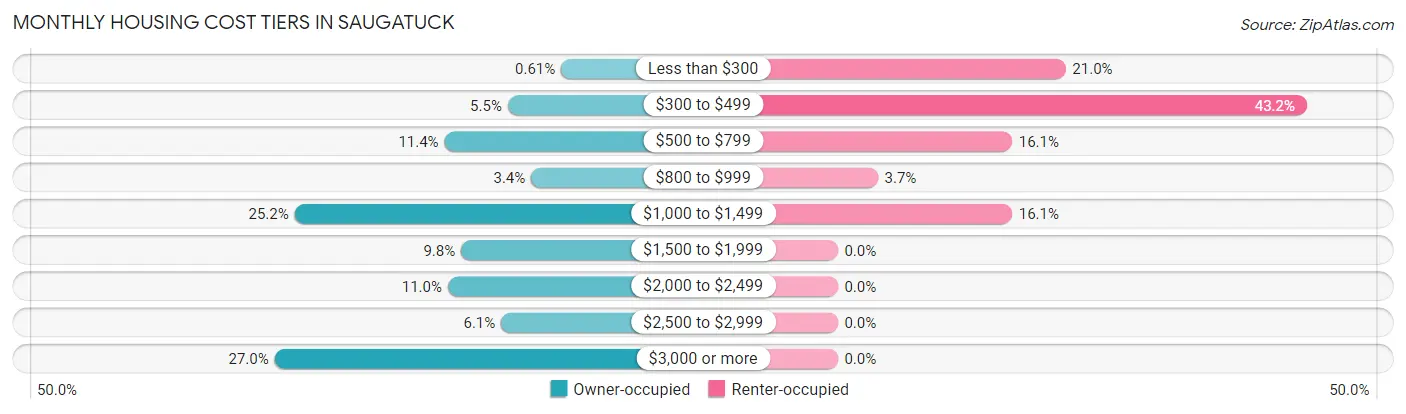
| Monthly Cost | Owner-occupied | Renter-occupied |
| Less than $300 | 2 (0.6%) | 17 (21.0%) |
| $300 to $499 | 18 (5.5%) | 35 (43.2%) |
| $500 to $799 | 37 (11.4%) | 13 (16.1%) |
| $800 to $999 | 11 (3.4%) | 3 (3.7%) |
| $1,000 to $1,499 | 82 (25.2%) | 13 (16.1%) |
| $1,500 to $1,999 | 32 (9.8%) | 0 (0.0%) |
| $2,000 to $2,499 | 36 (11.0%) | 0 (0.0%) |
| $2,500 to $2,999 | 20 (6.1%) | 0 (0.0%) |
| $3,000 or more | 88 (27.0%) | 0 (0.0%) |
| Total | 326 (100.0%) | 81 (100.0%) |
Physical Housing Characteristics in Saugatuck
Housing Structures in Saugatuck
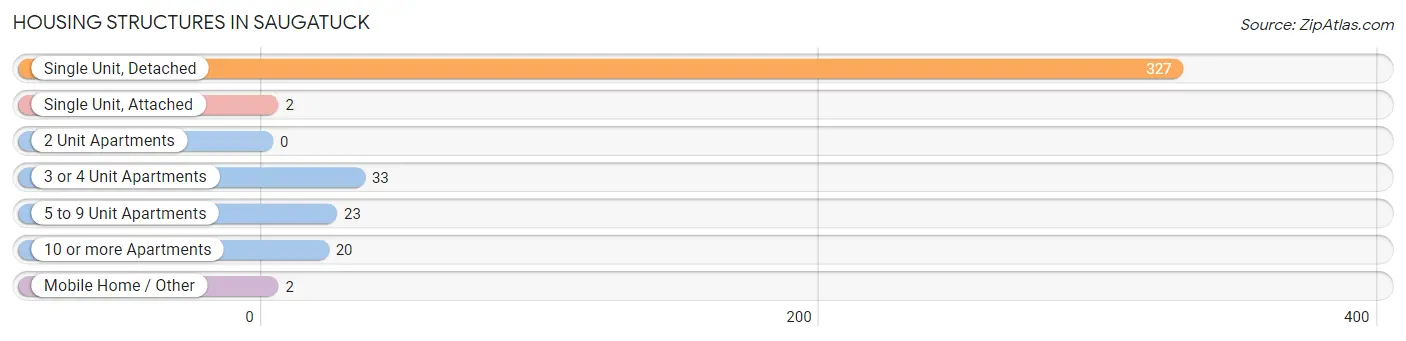
| Structure Type | # Housing Units | % Housing Units |
| Single Unit, Detached | 327 | 80.3% |
| Single Unit, Attached | 2 | 0.5% |
| 2 Unit Apartments | 0 | 0.0% |
| 3 or 4 Unit Apartments | 33 | 8.1% |
| 5 to 9 Unit Apartments | 23 | 5.7% |
| 10 or more Apartments | 20 | 4.9% |
| Mobile Home / Other | 2 | 0.5% |
| Total | 407 | 100.0% |
Housing Structures by Occupancy in Saugatuck
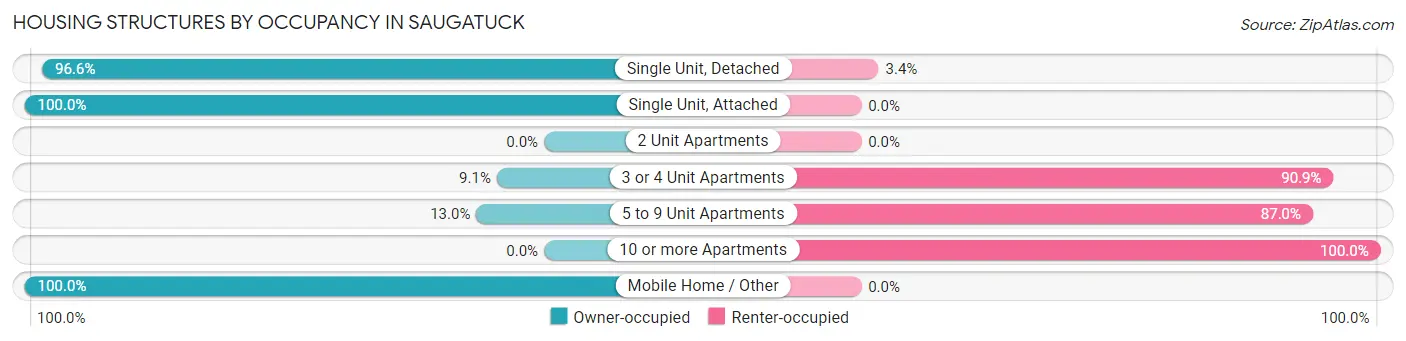
| Structure Type | Owner-occupied | Renter-occupied |
| Single Unit, Detached | 316 (96.6%) | 11 (3.4%) |
| Single Unit, Attached | 2 (100.0%) | 0 (0.0%) |
| 2 Unit Apartments | 0 (0.0%) | 0 (0.0%) |
| 3 or 4 Unit Apartments | 3 (9.1%) | 30 (90.9%) |
| 5 to 9 Unit Apartments | 3 (13.0%) | 20 (87.0%) |
| 10 or more Apartments | 0 (0.0%) | 20 (100.0%) |
| Mobile Home / Other | 2 (100.0%) | 0 (0.0%) |
| Total | 326 (80.1%) | 81 (19.9%) |
Housing Structures by Number of Rooms in Saugatuck
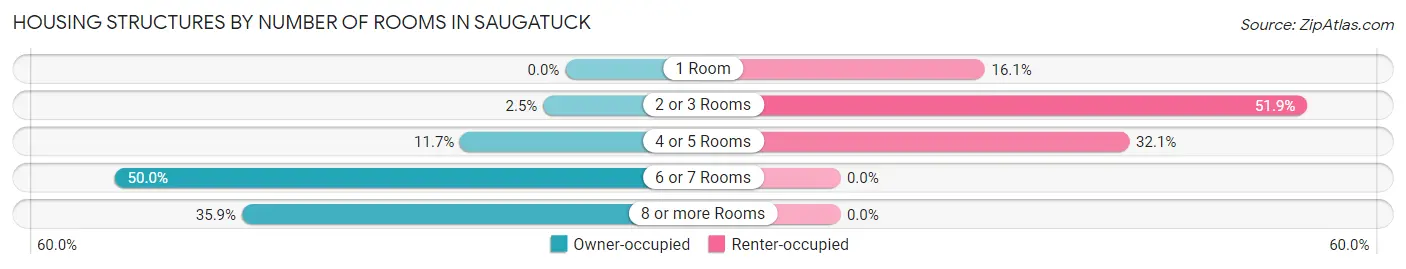
| Number of Rooms | Owner-occupied | Renter-occupied |
| 1 Room | 0 (0.0%) | 13 (16.1%) |
| 2 or 3 Rooms | 8 (2.5%) | 42 (51.8%) |
| 4 or 5 Rooms | 38 (11.7%) | 26 (32.1%) |
| 6 or 7 Rooms | 163 (50.0%) | 0 (0.0%) |
| 8 or more Rooms | 117 (35.9%) | 0 (0.0%) |
| Total | 326 (100.0%) | 81 (100.0%) |
Housing Structure by Heating Type in Saugatuck
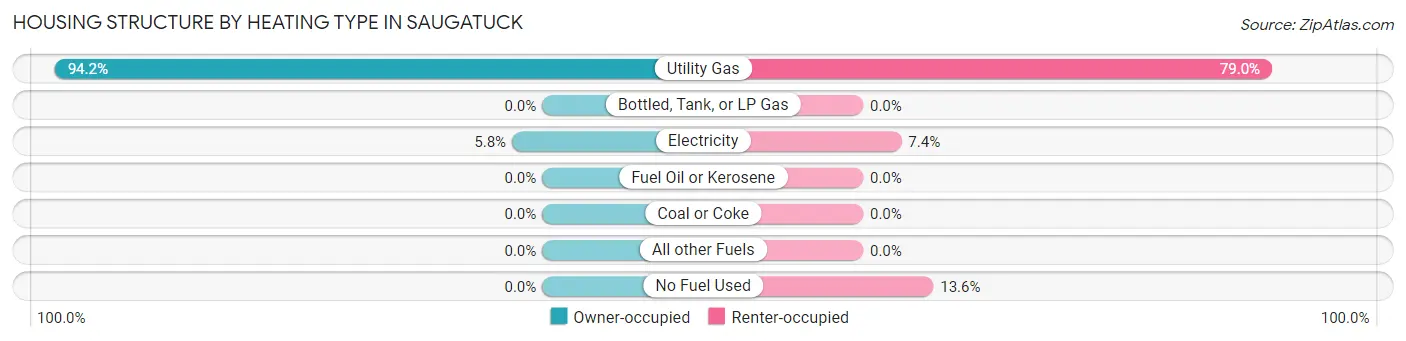
| Heating Type | Owner-occupied | Renter-occupied |
| Utility Gas | 307 (94.2%) | 64 (79.0%) |
| Bottled, Tank, or LP Gas | 0 (0.0%) | 0 (0.0%) |
| Electricity | 19 (5.8%) | 6 (7.4%) |
| Fuel Oil or Kerosene | 0 (0.0%) | 0 (0.0%) |
| Coal or Coke | 0 (0.0%) | 0 (0.0%) |
| All other Fuels | 0 (0.0%) | 0 (0.0%) |
| No Fuel Used | 0 (0.0%) | 11 (13.6%) |
| Total | 326 (100.0%) | 81 (100.0%) |
Household Vehicle Usage in Saugatuck
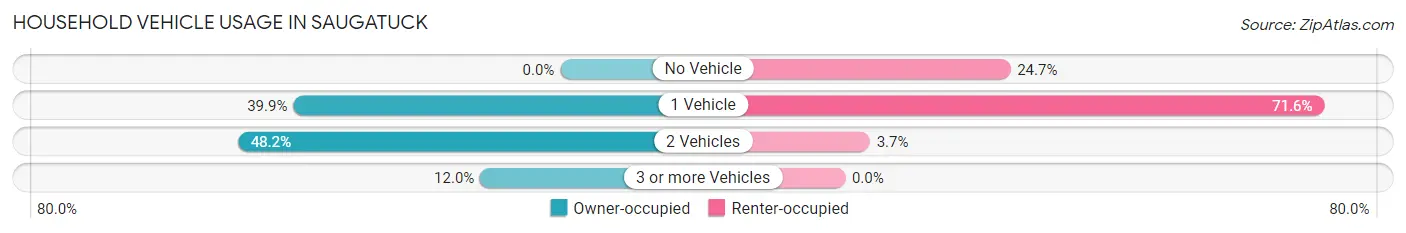
| Vehicles per Household | Owner-occupied | Renter-occupied |
| No Vehicle | 0 (0.0%) | 20 (24.7%) |
| 1 Vehicle | 130 (39.9%) | 58 (71.6%) |
| 2 Vehicles | 157 (48.2%) | 3 (3.7%) |
| 3 or more Vehicles | 39 (12.0%) | 0 (0.0%) |
| Total | 326 (100.0%) | 81 (100.0%) |
Real Estate & Mortgages in Saugatuck
Real Estate and Mortgage Overview in Saugatuck
| Characteristic | Without Mortgage | With Mortgage |
| Housing Units | 170 | 156 |
| Median Property Value | $413,300 | $633,300 |
| Median Household Income | $113,824 | $83 |
| Monthly Housing Costs | $1,137 | $75 |
| Real Estate Taxes | $6,360 | $0 |
Property Value by Mortgage Status in Saugatuck
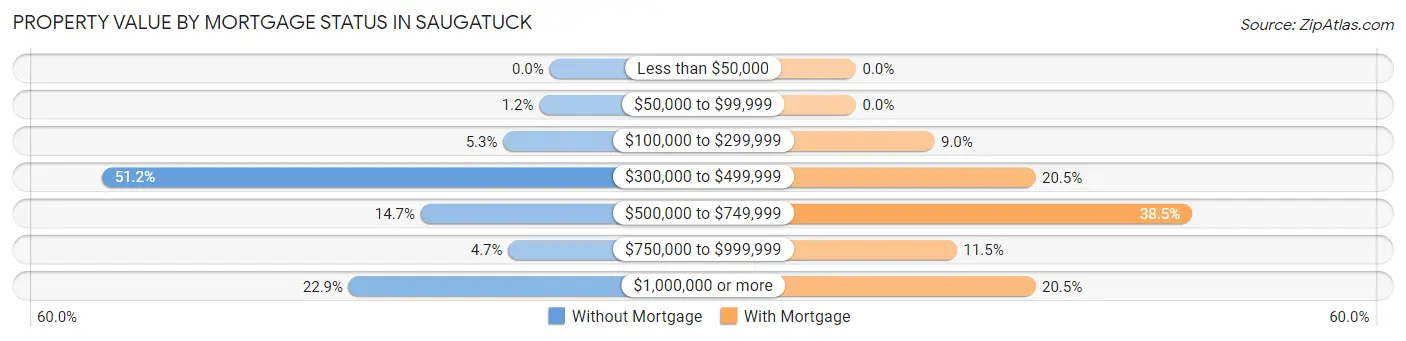
| Property Value | Without Mortgage | With Mortgage |
| Less than $50,000 | 0 (0.0%) | 0 (0.0%) |
| $50,000 to $99,999 | 2 (1.2%) | 0 (0.0%) |
| $100,000 to $299,999 | 9 (5.3%) | 14 (9.0%) |
| $300,000 to $499,999 | 87 (51.2%) | 32 (20.5%) |
| $500,000 to $749,999 | 25 (14.7%) | 60 (38.5%) |
| $750,000 to $999,999 | 8 (4.7%) | 18 (11.5%) |
| $1,000,000 or more | 39 (22.9%) | 32 (20.5%) |
| Total | 170 (100.0%) | 156 (100.0%) |
Household Income by Mortgage Status in Saugatuck
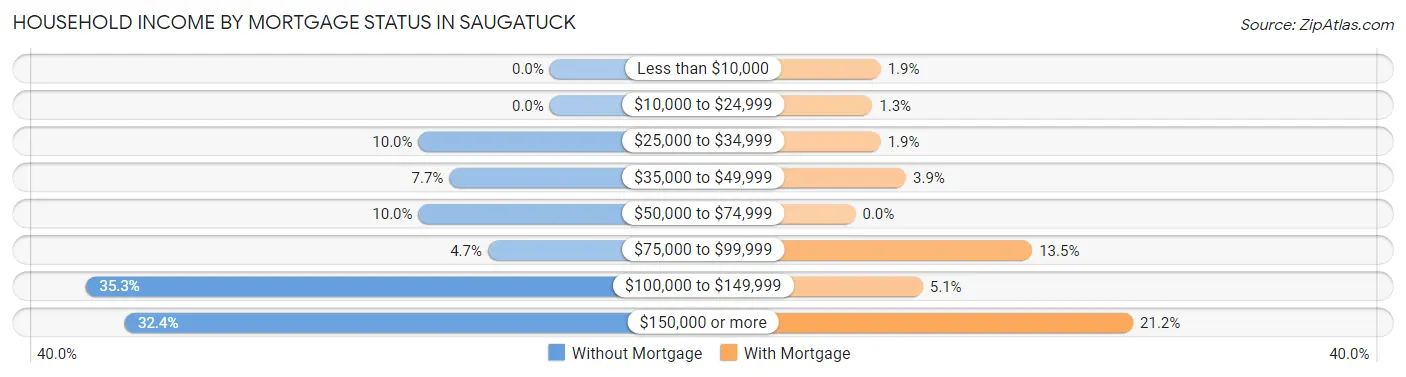
| Household Income | Without Mortgage | With Mortgage |
| Less than $10,000 | 0 (0.0%) | 3 (1.9%) |
| $10,000 to $24,999 | 0 (0.0%) | 2 (1.3%) |
| $25,000 to $34,999 | 17 (10.0%) | 3 (1.9%) |
| $35,000 to $49,999 | 13 (7.6%) | 6 (3.8%) |
| $50,000 to $74,999 | 17 (10.0%) | 0 (0.0%) |
| $75,000 to $99,999 | 8 (4.7%) | 21 (13.5%) |
| $100,000 to $149,999 | 60 (35.3%) | 8 (5.1%) |
| $150,000 or more | 55 (32.4%) | 33 (21.1%) |
| Total | 170 (100.0%) | 156 (100.0%) |
Property Value to Household Income Ratio in Saugatuck
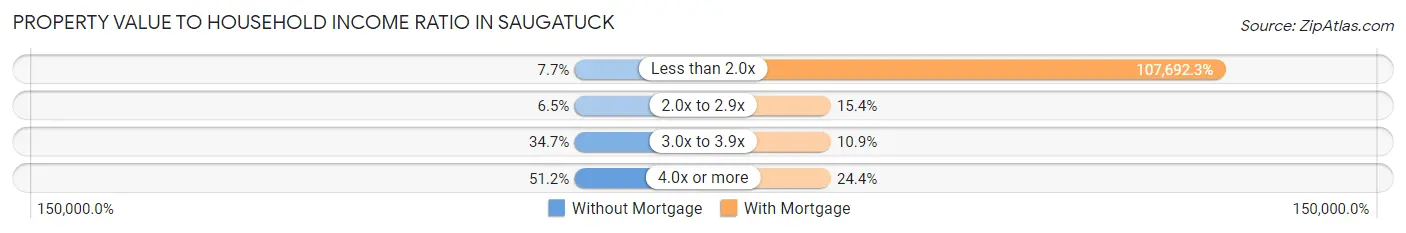
| Value-to-Income Ratio | Without Mortgage | With Mortgage |
| Less than 2.0x | 13 (7.6%) | 168,000 (107,692.3%) |
| 2.0x to 2.9x | 11 (6.5%) | 24 (15.4%) |
| 3.0x to 3.9x | 59 (34.7%) | 17 (10.9%) |
| 4.0x or more | 87 (51.2%) | 38 (24.4%) |
| Total | 170 (100.0%) | 156 (100.0%) |
Real Estate Taxes by Mortgage Status in Saugatuck
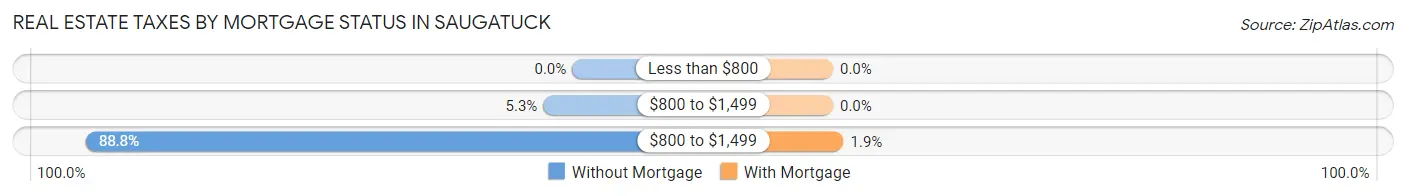
| Property Taxes | Without Mortgage | With Mortgage |
| Less than $800 | 0 (0.0%) | 0 (0.0%) |
| $800 to $1,499 | 9 (5.3%) | 0 (0.0%) |
| $800 to $1,499 | 151 (88.8%) | 3 (1.9%) |
| Total | 170 (100.0%) | 156 (100.0%) |
Health & Disability in Saugatuck
Health Insurance Coverage by Age in Saugatuck
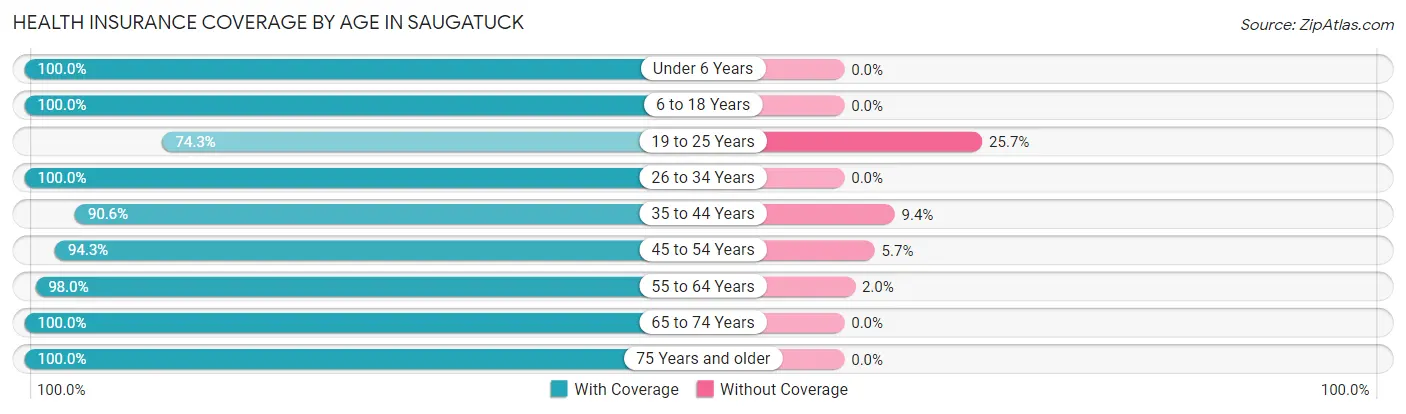
| Age Bracket | With Coverage | Without Coverage |
| Under 6 Years | 15 (100.0%) | 0 (0.0%) |
| 6 to 18 Years | 62 (100.0%) | 0 (0.0%) |
| 19 to 25 Years | 26 (74.3%) | 9 (25.7%) |
| 26 to 34 Years | 15 (100.0%) | 0 (0.0%) |
| 35 to 44 Years | 29 (90.6%) | 3 (9.4%) |
| 45 to 54 Years | 150 (94.3%) | 9 (5.7%) |
| 55 to 64 Years | 148 (98.0%) | 3 (2.0%) |
| 65 to 74 Years | 158 (100.0%) | 0 (0.0%) |
| 75 Years and older | 124 (100.0%) | 0 (0.0%) |
| Total | 727 (96.8%) | 24 (3.2%) |
Health Insurance Coverage by Citizenship Status in Saugatuck
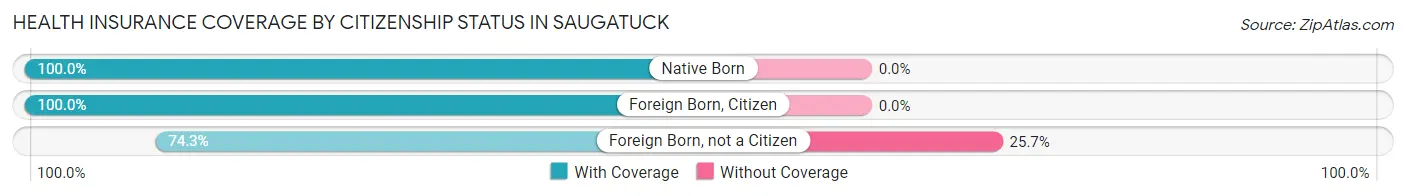
| Citizenship Status | With Coverage | Without Coverage |
| Native Born | 15 (100.0%) | 0 (0.0%) |
| Foreign Born, Citizen | 62 (100.0%) | 0 (0.0%) |
| Foreign Born, not a Citizen | 26 (74.3%) | 9 (25.7%) |
Health Insurance Coverage by Household Income in Saugatuck
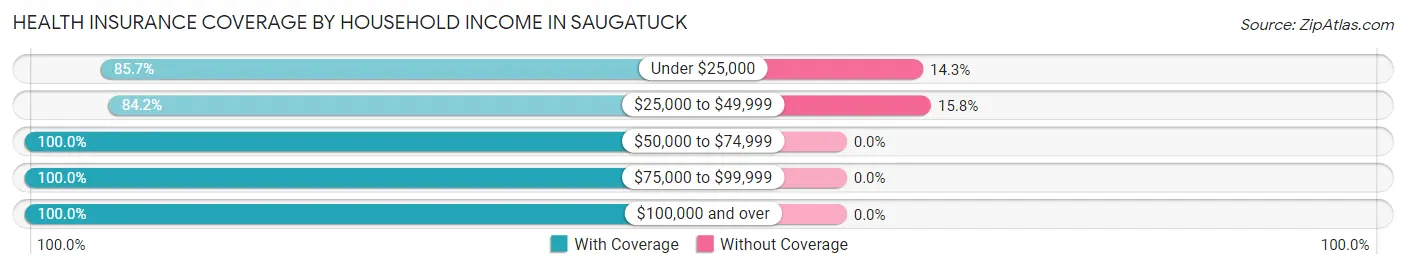
| Household Income | With Coverage | Without Coverage |
| Under $25,000 | 72 (85.7%) | 12 (14.3%) |
| $25,000 to $49,999 | 64 (84.2%) | 12 (15.8%) |
| $50,000 to $74,999 | 72 (100.0%) | 0 (0.0%) |
| $75,000 to $99,999 | 39 (100.0%) | 0 (0.0%) |
| $100,000 and over | 480 (100.0%) | 0 (0.0%) |
Public vs Private Health Insurance Coverage by Age in Saugatuck
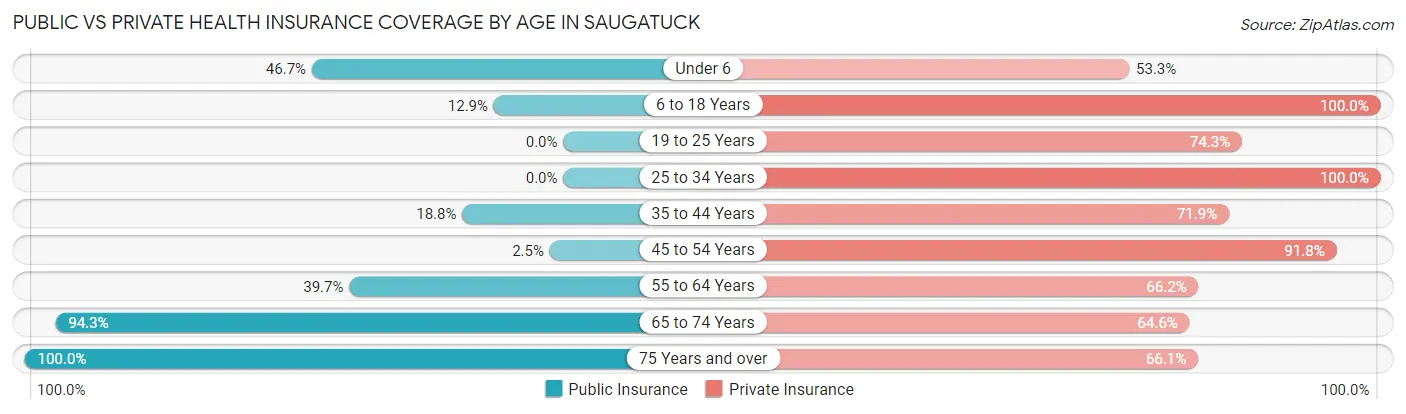
| Age Bracket | Public Insurance | Private Insurance |
| Under 6 | 7 (46.7%) | 8 (53.3%) |
| 6 to 18 Years | 8 (12.9%) | 62 (100.0%) |
| 19 to 25 Years | 0 (0.0%) | 26 (74.3%) |
| 25 to 34 Years | 0 (0.0%) | 15 (100.0%) |
| 35 to 44 Years | 6 (18.8%) | 23 (71.9%) |
| 45 to 54 Years | 4 (2.5%) | 146 (91.8%) |
| 55 to 64 Years | 60 (39.7%) | 100 (66.2%) |
| 65 to 74 Years | 149 (94.3%) | 102 (64.6%) |
| 75 Years and over | 124 (100.0%) | 82 (66.1%) |
| Total | 358 (47.7%) | 564 (75.1%) |
Disability Status by Sex by Age in Saugatuck
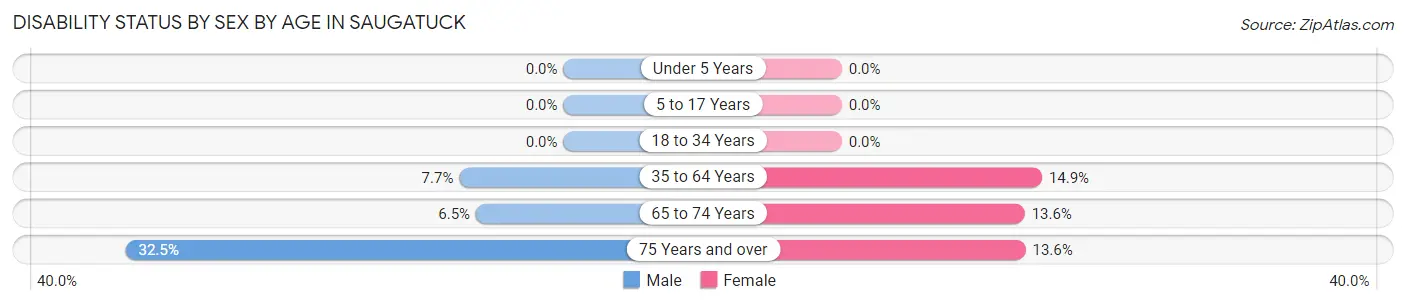
| Age Bracket | Male | Female |
| Under 5 Years | 0 (0.0%) | 0 (0.0%) |
| 5 to 17 Years | 0 (0.0%) | 0 (0.0%) |
| 18 to 34 Years | 0 (0.0%) | 0 (0.0%) |
| 35 to 64 Years | 15 (7.7%) | 22 (14.9%) |
| 65 to 74 Years | 5 (6.5%) | 11 (13.6%) |
| 75 Years and over | 26 (32.5%) | 6 (13.6%) |
Disability Class by Sex by Age in Saugatuck
Disability Class: Hearing Difficulty
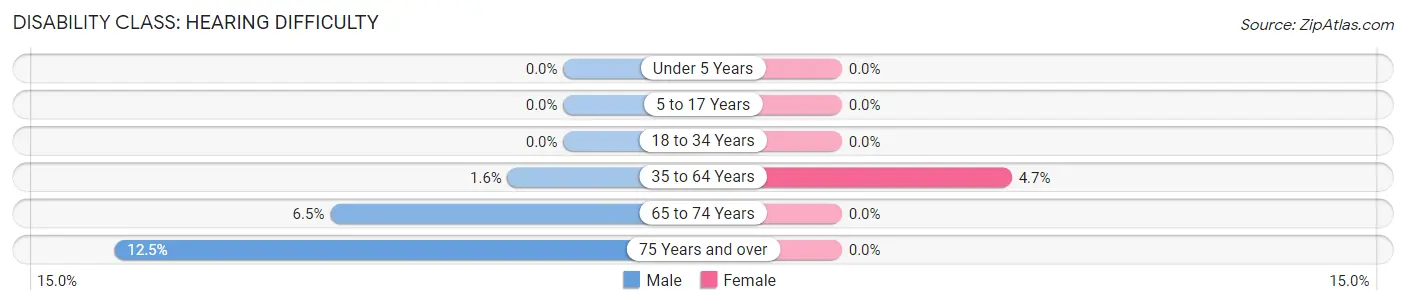
| Age Bracket | Male | Female |
| Under 5 Years | 0 (0.0%) | 0 (0.0%) |
| 5 to 17 Years | 0 (0.0%) | 0 (0.0%) |
| 18 to 34 Years | 0 (0.0%) | 0 (0.0%) |
| 35 to 64 Years | 3 (1.5%) | 7 (4.7%) |
| 65 to 74 Years | 5 (6.5%) | 0 (0.0%) |
| 75 Years and over | 10 (12.5%) | 0 (0.0%) |
Disability Class: Vision Difficulty
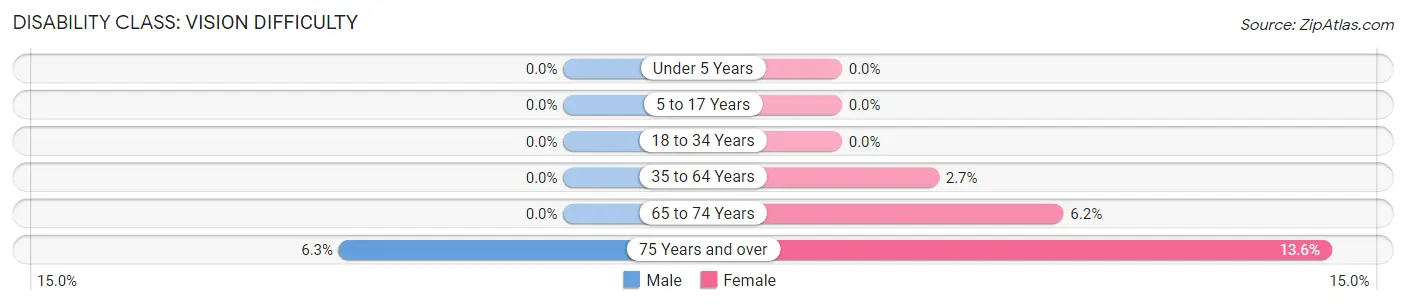
| Age Bracket | Male | Female |
| Under 5 Years | 0 (0.0%) | 0 (0.0%) |
| 5 to 17 Years | 0 (0.0%) | 0 (0.0%) |
| 18 to 34 Years | 0 (0.0%) | 0 (0.0%) |
| 35 to 64 Years | 0 (0.0%) | 4 (2.7%) |
| 65 to 74 Years | 0 (0.0%) | 5 (6.2%) |
| 75 Years and over | 5 (6.2%) | 6 (13.6%) |
Disability Class: Cognitive Difficulty
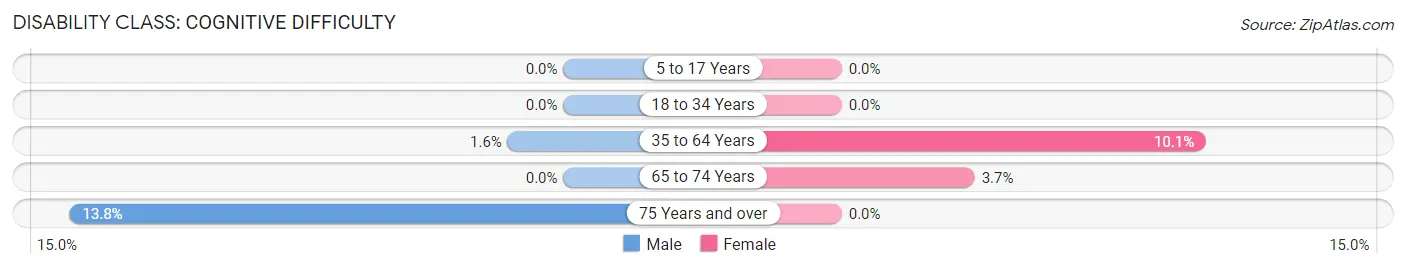
| Age Bracket | Male | Female |
| 5 to 17 Years | 0 (0.0%) | 0 (0.0%) |
| 18 to 34 Years | 0 (0.0%) | 0 (0.0%) |
| 35 to 64 Years | 3 (1.5%) | 15 (10.1%) |
| 65 to 74 Years | 0 (0.0%) | 3 (3.7%) |
| 75 Years and over | 11 (13.8%) | 0 (0.0%) |
Disability Class: Ambulatory Difficulty
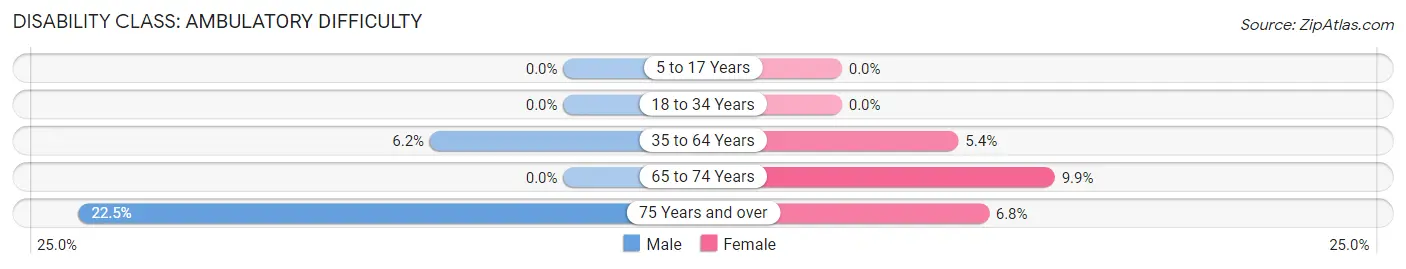
| Age Bracket | Male | Female |
| 5 to 17 Years | 0 (0.0%) | 0 (0.0%) |
| 18 to 34 Years | 0 (0.0%) | 0 (0.0%) |
| 35 to 64 Years | 12 (6.2%) | 8 (5.4%) |
| 65 to 74 Years | 0 (0.0%) | 8 (9.9%) |
| 75 Years and over | 18 (22.5%) | 3 (6.8%) |
Disability Class: Self-Care Difficulty
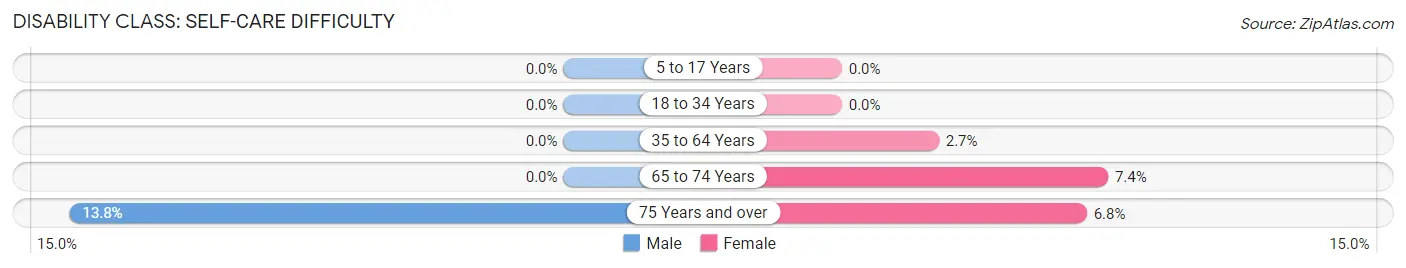
| Age Bracket | Male | Female |
| 5 to 17 Years | 0 (0.0%) | 0 (0.0%) |
| 18 to 34 Years | 0 (0.0%) | 0 (0.0%) |
| 35 to 64 Years | 0 (0.0%) | 4 (2.7%) |
| 65 to 74 Years | 0 (0.0%) | 6 (7.4%) |
| 75 Years and over | 11 (13.8%) | 3 (6.8%) |
Technology Access in Saugatuck
Computing Device Access in Saugatuck
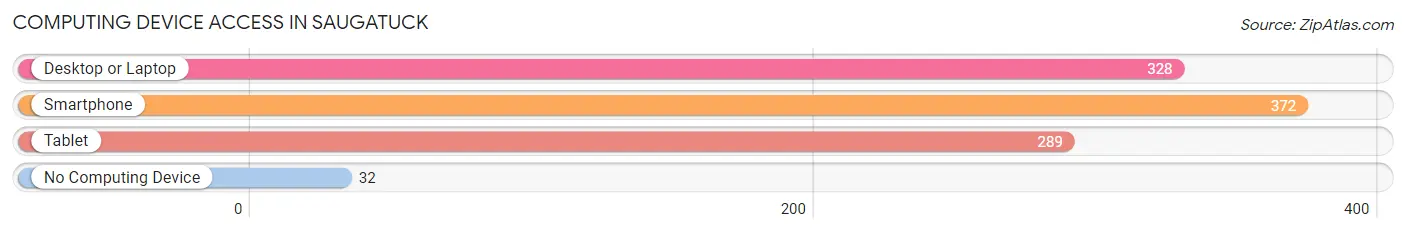
| Device Type | # Households | % Households |
| Desktop or Laptop | 328 | 80.6% |
| Smartphone | 372 | 91.4% |
| Tablet | 289 | 71.0% |
| No Computing Device | 32 | 7.9% |
| Total | 407 | 100.0% |
Internet Access in Saugatuck
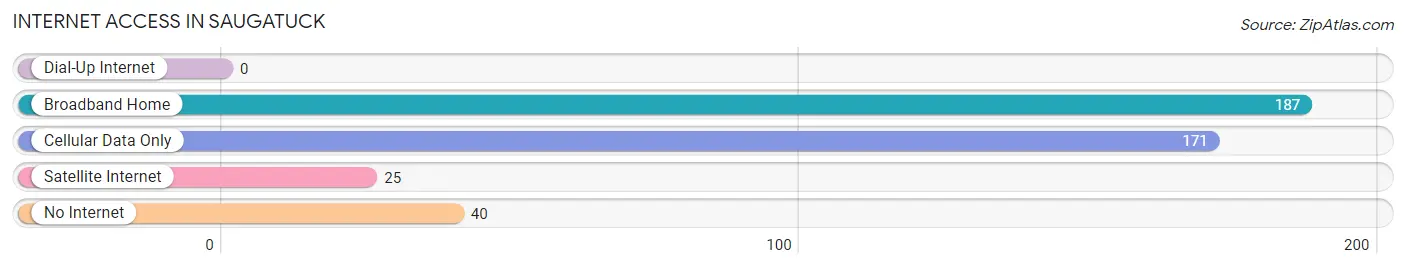
| Internet Type | # Households | % Households |
| Dial-Up Internet | 0 | 0.0% |
| Broadband Home | 187 | 46.0% |
| Cellular Data Only | 171 | 42.0% |
| Satellite Internet | 25 | 6.1% |
| No Internet | 40 | 9.8% |
| Total | 407 | 100.0% |
Saugatuck Summary
Saugatuck, Michigan is a small town located in Allegan County, Michigan, United States. It is situated on the eastern shore of Lake Michigan, about 50 miles southwest of Grand Rapids. The town is known for its picturesque harbor, sandy beaches, and quaint downtown. It is a popular tourist destination, especially during the summer months.
History
The area that is now Saugatuck was first inhabited by the Potawatomi Indians. The first white settlers arrived in the area in the early 1800s. The town was originally known as Singapore, and was later renamed Saugatuck. The name is derived from the Potawatomi word for “place of the big mouth”, referring to the mouth of the Kalamazoo River.
The town was officially incorporated in 1867. In the late 1800s, Saugatuck became a popular summer resort destination for wealthy Chicagoans. The town was known for its beautiful beaches, and was home to several grand hotels.
In the early 1900s, the town began to decline in popularity as a resort destination. However, in the 1950s, the town experienced a resurgence in popularity as a tourist destination. The town has since become a popular destination for art galleries, antique shops, and restaurants.
Geography
Saugatuck is located in Allegan County, Michigan, on the eastern shore of Lake Michigan. The town is situated on the Kalamazoo River, which flows into Lake Michigan. The town is surrounded by the Saugatuck Dunes State Park, which is a popular destination for hiking, camping, and other outdoor activities.
The town has a total area of 2.2 square miles, all of which is land. The town has a humid continental climate, with warm summers and cold winters.
Economy
The economy of Saugatuck is largely based on tourism. The town is home to several art galleries, antique shops, and restaurants. The town is also home to several marinas, which provide boat rentals and other services.
The town is also home to several manufacturing companies, including a furniture manufacturer and a boat manufacturer. The town is also home to several wineries and breweries.
Demographics
As of the 2010 census, the population of Saugatuck was 925. The racial makeup of the town was 94.3% White, 0.7% African American, 0.7% Native American, 0.7% Asian, 0.1% Pacific Islander, and 3.3% from other races. The median household income was $50,000, and the median family income was $60,000.
Conclusion
Saugatuck, Michigan is a small town located in Allegan County, Michigan, United States. It is situated on the eastern shore of Lake Michigan, about 50 miles southwest of Grand Rapids. The town is known for its picturesque harbor, sandy beaches, and quaint downtown. It is a popular tourist destination, especially during the summer months. The town has a humid continental climate, with warm summers and cold winters. The economy of Saugatuck is largely based on tourism, and the town is home to several art galleries, antique shops, and restaurants. As of the 2010 census, the population of Saugatuck was 925. The racial makeup of the town was 94.3% White, 0.7% African American, 0.7% Native American, 0.7% Asian, 0.1% Pacific Islander, and 3.3% from other races. The median household income was $50,000, and the median family income was $60,000.
Common Questions
What is Per Capita Income in Saugatuck?
Per Capita income in Saugatuck is $78,256.
What is the Median Family Income in Saugatuck?
Median Family Income in Saugatuck is $149,432.
What is the Median Household income in Saugatuck?
Median Household Income in Saugatuck is $113,309.
What is Inequality or Gini Index in Saugatuck?
Inequality or Gini Index in Saugatuck is 0.50.
What is the Total Population of Saugatuck?
Total Population of Saugatuck is 751.
What is the Total Male Population of Saugatuck?
Total Male Population of Saugatuck is 395.
What is the Total Female Population of Saugatuck?
Total Female Population of Saugatuck is 356.
What is the Ratio of Males per 100 Females in Saugatuck?
There are 110.96 Males per 100 Females in Saugatuck.
What is the Ratio of Females per 100 Males in Saugatuck?
There are 90.13 Females per 100 Males in Saugatuck.
What is the Median Population Age in Saugatuck?
Median Population Age in Saugatuck is 58.0 Years.
What is the Average Family Size in Saugatuck
Average Family Size in Saugatuck is 2.4 People.
What is the Average Household Size in Saugatuck
Average Household Size in Saugatuck is 1.9 People.
How Large is the Labor Force in Saugatuck?
There are 347 People in the Labor Forcein in Saugatuck.
What is the Percentage of People in the Labor Force in Saugatuck?
50.4% of People are in the Labor Force in Saugatuck.
What is the Unemployment Rate in Saugatuck?
Unemployment Rate in Saugatuck is 2.3%.