North Muskegon, MI Map & Demographics
North Muskegon Map
North Muskegon Overview
$50,859
PER CAPITA INCOME
$123,563
AVG FAMILY INCOME
$99,924
AVG HOUSEHOLD INCOME
31.6%
WAGE / INCOME GAP [ % ]
68.4¢/ $1
WAGE / INCOME GAP [ $ ]
0.45
INEQUALITY / GINI INDEX
4,076
TOTAL POPULATION
2,017
MALE POPULATION
2,059
FEMALE POPULATION
97.96
MALES / 100 FEMALES
102.08
FEMALES / 100 MALES
43.2
MEDIAN AGE
3.0
AVG FAMILY SIZE
2.5
AVG HOUSEHOLD SIZE
2,099
LABOR FORCE [ PEOPLE ]
65.6%
PERCENT IN LABOR FORCE
1.4%
UNEMPLOYMENT RATE
North Muskegon Area Codes
Income in North Muskegon
Income Overview in North Muskegon
Per Capita Income in North Muskegon is $50,859, while median incomes of families and households are $123,563 and $99,924 respectively.
| Characteristic | Number | Measure |
| Per Capita Income | 4,076 | $50,859 |
| Median Family Income | 1,079 | $123,563 |
| Mean Family Income | 1,079 | $145,562 |
| Median Household Income | 1,580 | $99,924 |
| Mean Household Income | 1,580 | $126,092 |
| Income Deficit | 1,079 | $0 |
| Wage / Income Gap (%) | 4,076 | 31.60% |
| Wage / Income Gap ($) | 4,076 | 68.40¢ per $1 |
| Gini / Inequality Index | 4,076 | 0.45 |
Earnings by Sex in North Muskegon
Average Earnings in North Muskegon are $56,554, $67,827 for men and $46,397 for women, a difference of 31.6%.
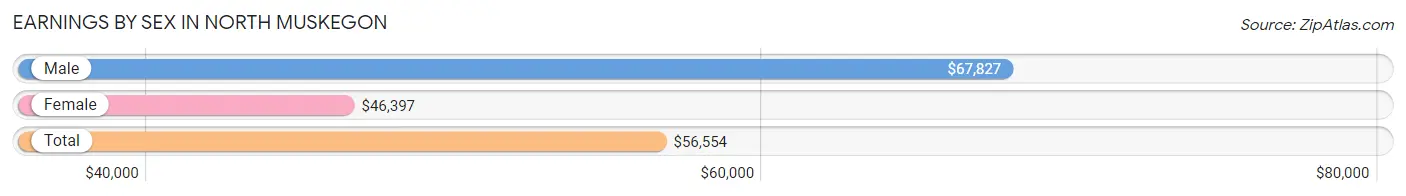
| Sex | Number | Average Earnings |
| Male | 1,155 (53.7%) | $67,827 |
| Female | 995 (46.3%) | $46,397 |
| Total | 2,150 (100.0%) | $56,554 |
Earnings by Sex by Income Bracket in North Muskegon
The most common earnings brackets in North Muskegon are $100,000+ for men (317 | 27.5%) and $100,000+ for women (191 | 19.2%).
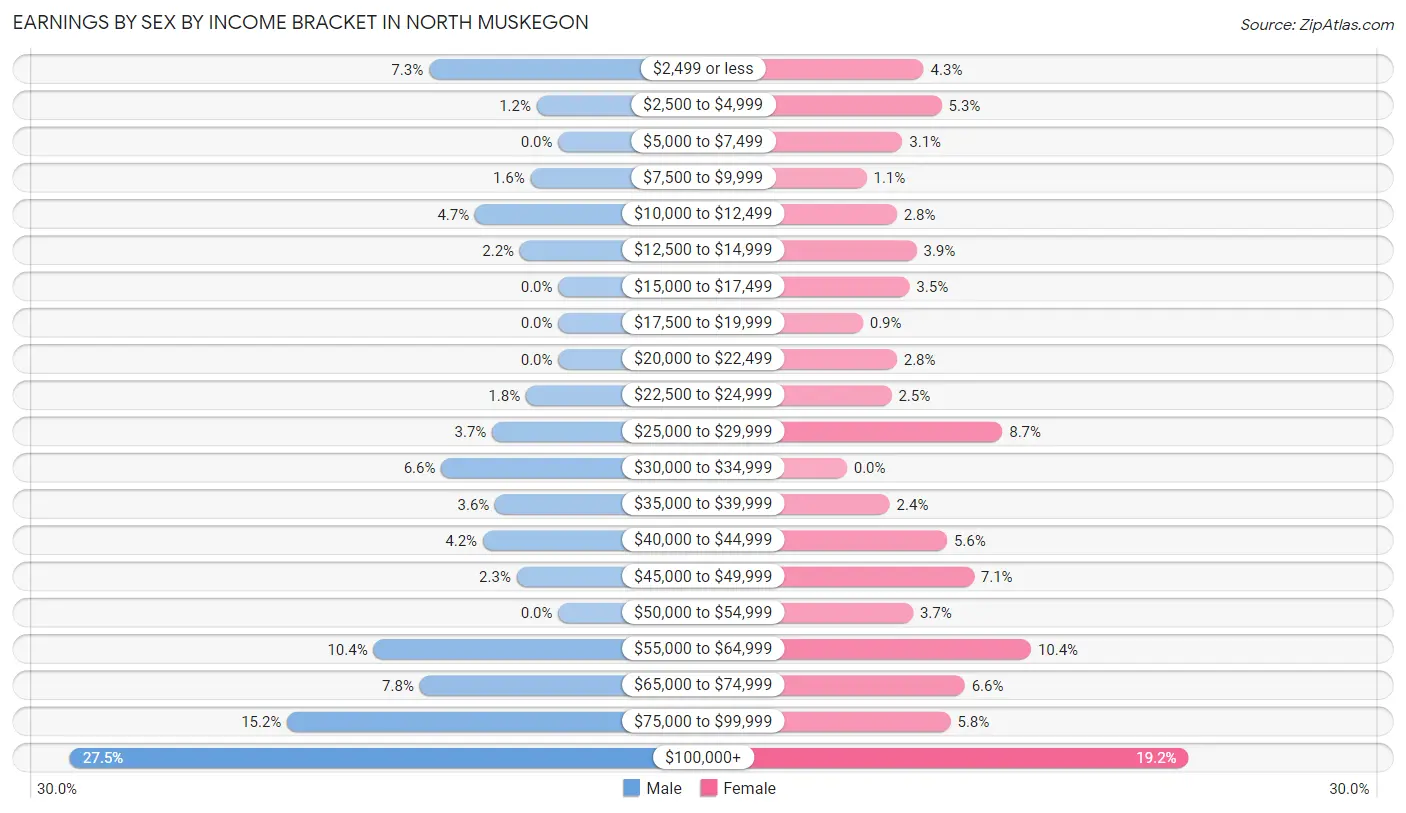
| Income | Male | Female |
| $2,499 or less | 84 (7.3%) | 43 (4.3%) |
| $2,500 to $4,999 | 14 (1.2%) | 53 (5.3%) |
| $5,000 to $7,499 | 0 (0.0%) | 31 (3.1%) |
| $7,500 to $9,999 | 18 (1.6%) | 11 (1.1%) |
| $10,000 to $12,499 | 54 (4.7%) | 28 (2.8%) |
| $12,500 to $14,999 | 25 (2.2%) | 39 (3.9%) |
| $15,000 to $17,499 | 0 (0.0%) | 35 (3.5%) |
| $17,500 to $19,999 | 0 (0.0%) | 9 (0.9%) |
| $20,000 to $22,499 | 0 (0.0%) | 28 (2.8%) |
| $22,500 to $24,999 | 21 (1.8%) | 25 (2.5%) |
| $25,000 to $29,999 | 43 (3.7%) | 87 (8.7%) |
| $30,000 to $34,999 | 76 (6.6%) | 0 (0.0%) |
| $35,000 to $39,999 | 41 (3.5%) | 24 (2.4%) |
| $40,000 to $44,999 | 49 (4.2%) | 56 (5.6%) |
| $45,000 to $49,999 | 27 (2.3%) | 71 (7.1%) |
| $50,000 to $54,999 | 0 (0.0%) | 37 (3.7%) |
| $55,000 to $64,999 | 120 (10.4%) | 103 (10.3%) |
| $65,000 to $74,999 | 90 (7.8%) | 66 (6.6%) |
| $75,000 to $99,999 | 176 (15.2%) | 58 (5.8%) |
| $100,000+ | 317 (27.5%) | 191 (19.2%) |
| Total | 1,155 (100.0%) | 995 (100.0%) |
Earnings by Sex by Educational Attainment in North Muskegon
Average earnings in North Muskegon are $73,651 for men and $53,480 for women, a difference of 27.4%. Men with an educational attainment of bachelor's degree enjoy the highest average annual earnings of $130,000, while those with college or associate's degree education earn the least with $48,676. Women with an educational attainment of graduate degree earn the most with the average annual earnings of $108,125, while those with college or associate's degree education have the smallest earnings of $40,045.
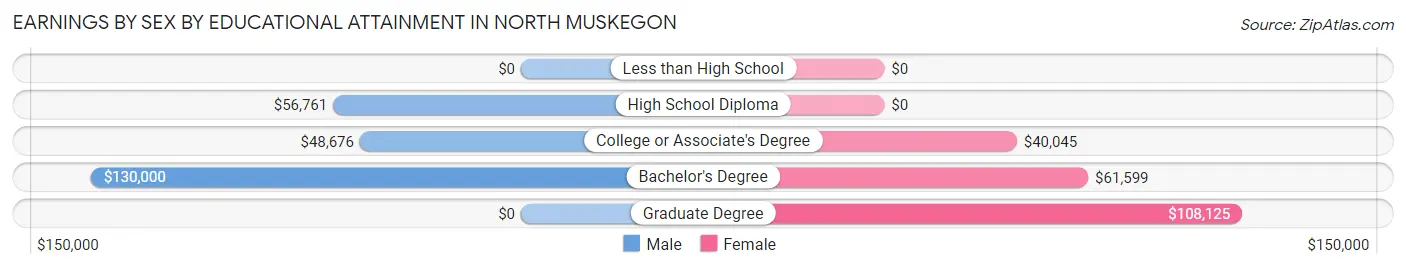
| Educational Attainment | Male Income | Female Income |
| Less than High School | - | - |
| High School Diploma | $56,761 | $0 |
| College or Associate's Degree | $48,676 | $40,045 |
| Bachelor's Degree | $130,000 | $61,599 |
| Graduate Degree | - | - |
| Total | $73,651 | $53,480 |
Family Income in North Muskegon
Family Income Brackets in North Muskegon
According to the North Muskegon family income data, there are 352 families falling into the $100,000 to $149,999 income range, which is the most common income bracket and makes up 32.6% of all families.
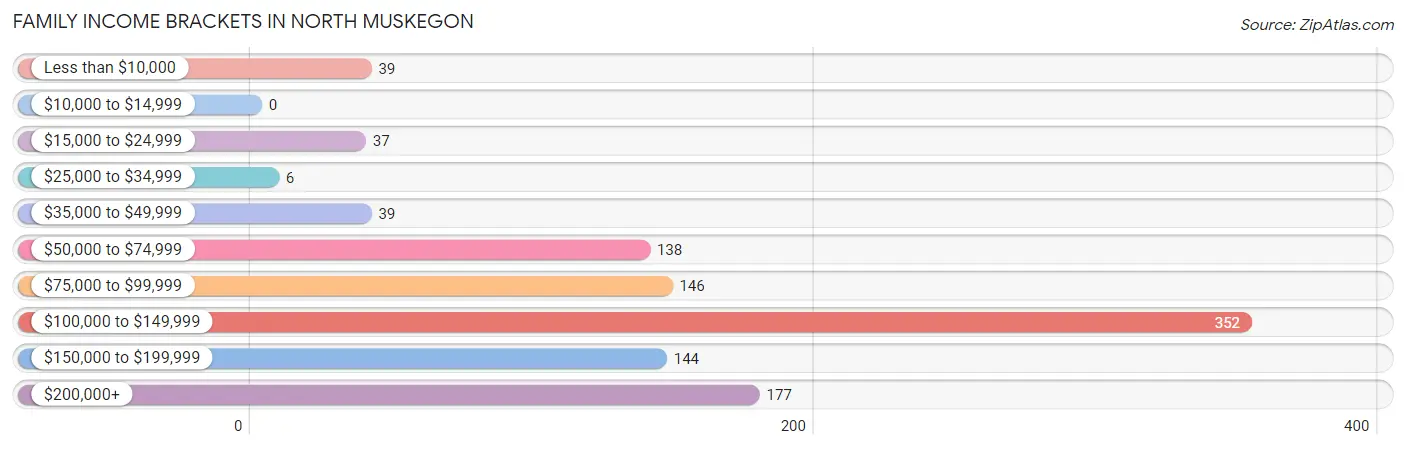
| Income Bracket | # Families | % Families |
| Less than $10,000 | 39 | 3.6% |
| $10,000 to $14,999 | 0 | 0.0% |
| $15,000 to $24,999 | 37 | 3.4% |
| $25,000 to $34,999 | 6 | 0.6% |
| $35,000 to $49,999 | 39 | 3.6% |
| $50,000 to $74,999 | 138 | 12.8% |
| $75,000 to $99,999 | 146 | 13.5% |
| $100,000 to $149,999 | 352 | 32.6% |
| $150,000 to $199,999 | 144 | 13.3% |
| $200,000+ | 177 | 16.4% |
Family Income by Famaliy Size in North Muskegon
4-person families (234 | 21.7%) account for the highest median family income in North Muskegon with $134,583 per family, while 2-person families (628 | 58.2%) have the highest median income of $62,125 per family member.
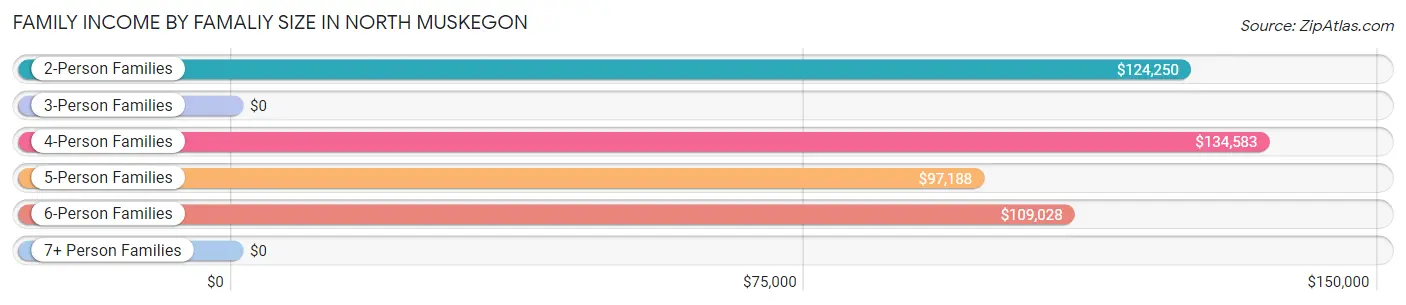
| Income Bracket | # Families | Median Income |
| 2-Person Families | 628 (58.2%) | $124,250 |
| 3-Person Families | 127 (11.8%) | $0 |
| 4-Person Families | 234 (21.7%) | $134,583 |
| 5-Person Families | 61 (5.7%) | $97,188 |
| 6-Person Families | 22 (2.0%) | $109,028 |
| 7+ Person Families | 7 (0.6%) | $0 |
| Total | 1,079 (100.0%) | $123,563 |
Family Income by Number of Earners in North Muskegon
The median family income in North Muskegon is $123,563, with families comprising 3+ earners (113) having the highest median family income of $155,956, while families with no earners (152) have the lowest median family income of $86,071, accounting for 10.5% and 14.1% of families, respectively.
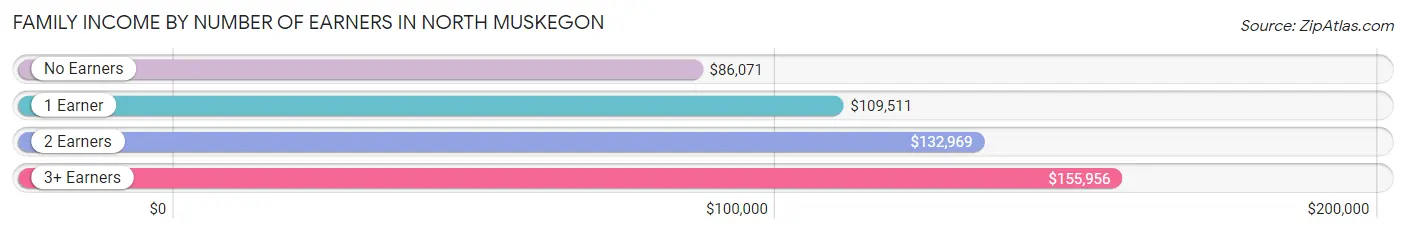
| Number of Earners | # Families | Median Income |
| No Earners | 152 (14.1%) | $86,071 |
| 1 Earner | 395 (36.6%) | $109,511 |
| 2 Earners | 419 (38.8%) | $132,969 |
| 3+ Earners | 113 (10.5%) | $155,956 |
| Total | 1,079 (100.0%) | $123,563 |
Household Income in North Muskegon
Household Income Brackets in North Muskegon
With 431 households falling in the category, the $100,000 to $149,999 income range is the most frequent in North Muskegon, accounting for 27.3% of all households. In contrast, only 58 households (3.7%) fall into the less than $10,000 income bracket, making it the least populous group.
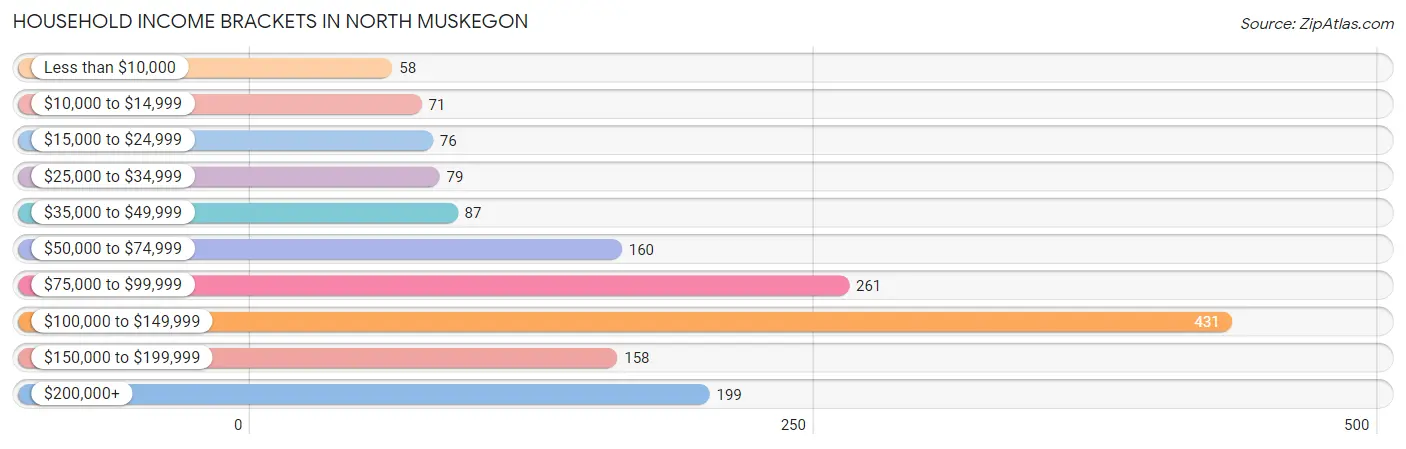
| Income Bracket | # Households | % Households |
| Less than $10,000 | 58 | 3.7% |
| $10,000 to $14,999 | 71 | 4.5% |
| $15,000 to $24,999 | 76 | 4.8% |
| $25,000 to $34,999 | 79 | 5.0% |
| $35,000 to $49,999 | 87 | 5.5% |
| $50,000 to $74,999 | 160 | 10.1% |
| $75,000 to $99,999 | 261 | 16.5% |
| $100,000 to $149,999 | 431 | 27.3% |
| $150,000 to $199,999 | 158 | 10.0% |
| $200,000+ | 199 | 12.6% |
Household Income by Householder Age in North Muskegon
The median household income in North Muskegon is $99,924, with the highest median household income of $134,688 found in the 45 to 64 years age bracket for the primary householder. A total of 614 households (38.9%) fall into this category. Meanwhile, the 15 to 24 years age bracket for the primary householder has the lowest median household income of $0, with 13 households (0.8%) in this group.
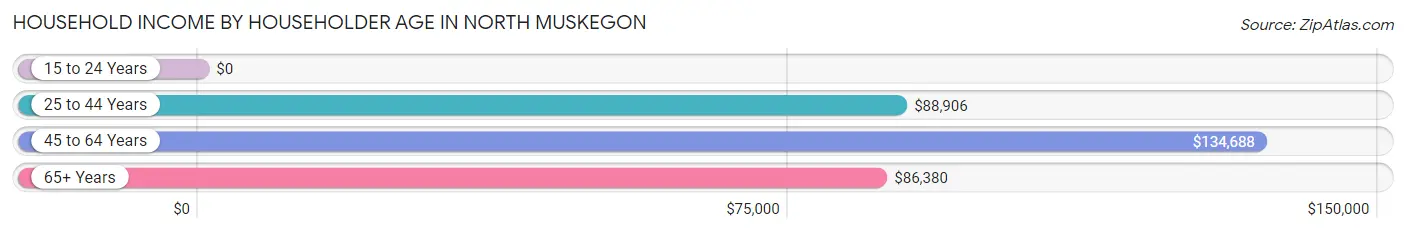
| Income Bracket | # Households | Median Income |
| 15 to 24 Years | 13 (0.8%) | $0 |
| 25 to 44 Years | 478 (30.2%) | $88,906 |
| 45 to 64 Years | 614 (38.9%) | $134,688 |
| 65+ Years | 475 (30.1%) | $86,380 |
| Total | 1,580 (100.0%) | $99,924 |
Poverty in North Muskegon
Income Below Poverty by Sex and Age in North Muskegon
With 5.7% poverty level for males and 7.1% for females among the residents of North Muskegon, 5 year old males and 75 year old and over females are the most vulnerable to poverty, with 10 males (66.7%) and 24 females (14.3%) in their respective age groups living below the poverty level.
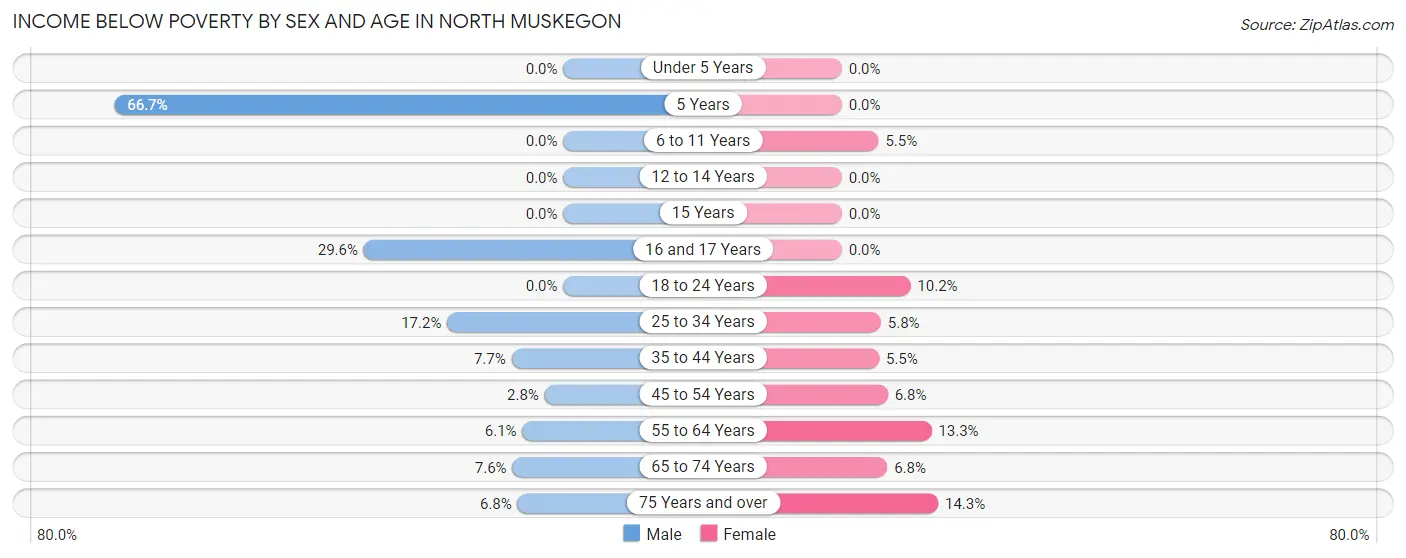
| Age Bracket | Male | Female |
| Under 5 Years | 0 (0.0%) | 0 (0.0%) |
| 5 Years | 10 (66.7%) | 0 (0.0%) |
| 6 to 11 Years | 0 (0.0%) | 9 (5.4%) |
| 12 to 14 Years | 0 (0.0%) | 0 (0.0%) |
| 15 Years | 0 (0.0%) | 0 (0.0%) |
| 16 and 17 Years | 8 (29.6%) | 0 (0.0%) |
| 18 to 24 Years | 0 (0.0%) | 11 (10.2%) |
| 25 to 34 Years | 30 (17.2%) | 13 (5.8%) |
| 35 to 44 Years | 16 (7.7%) | 13 (5.5%) |
| 45 to 54 Years | 12 (2.8%) | 15 (6.8%) |
| 55 to 64 Years | 11 (6.1%) | 41 (13.3%) |
| 65 to 74 Years | 17 (7.6%) | 17 (6.8%) |
| 75 Years and over | 10 (6.8%) | 24 (14.3%) |
| Total | 114 (5.7%) | 143 (7.1%) |
Income Above Poverty by Sex and Age in North Muskegon
According to the poverty statistics in North Muskegon, males aged under 5 years and females aged under 5 years are the age groups that are most secure financially, with 100.0% of males and 100.0% of females in these age groups living above the poverty line.
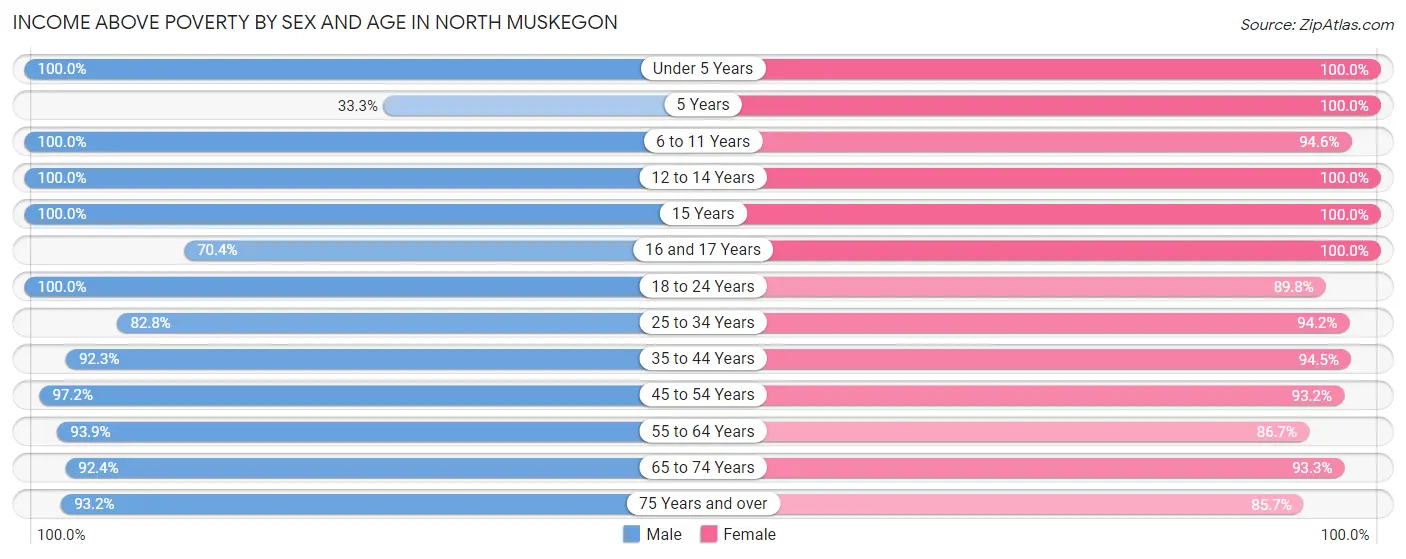
| Age Bracket | Male | Female |
| Under 5 Years | 30 (100.0%) | 111 (100.0%) |
| 5 Years | 5 (33.3%) | 46 (100.0%) |
| 6 to 11 Years | 160 (100.0%) | 156 (94.6%) |
| 12 to 14 Years | 72 (100.0%) | 78 (100.0%) |
| 15 Years | 183 (100.0%) | 10 (100.0%) |
| 16 and 17 Years | 19 (70.4%) | 96 (100.0%) |
| 18 to 24 Years | 155 (100.0%) | 97 (89.8%) |
| 25 to 34 Years | 144 (82.8%) | 211 (94.2%) |
| 35 to 44 Years | 192 (92.3%) | 222 (94.5%) |
| 45 to 54 Years | 421 (97.2%) | 205 (93.2%) |
| 55 to 64 Years | 170 (93.9%) | 267 (86.7%) |
| 65 to 74 Years | 208 (92.4%) | 235 (93.2%) |
| 75 Years and over | 137 (93.2%) | 144 (85.7%) |
| Total | 1,896 (94.3%) | 1,878 (92.9%) |
Income Below Poverty Among Married-Couple Families in North Muskegon
The poverty statistics for married-couple families in North Muskegon show that 2.4% or 19 of the total 797 families live below the poverty line. Families with no children have the highest poverty rate of 3.9%, comprising of 19 families. On the other hand, families with 1 or 2 children have the lowest poverty rate of 0.0%, which includes 0 families.
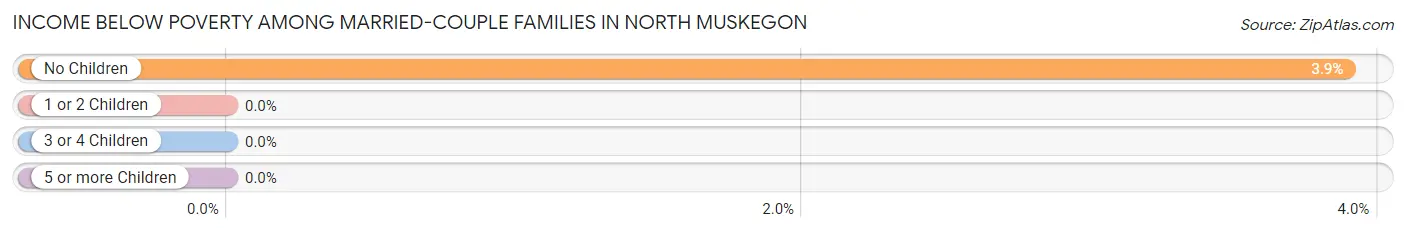
| Children | Above Poverty | Below Poverty |
| No Children | 470 (96.1%) | 19 (3.9%) |
| 1 or 2 Children | 271 (100.0%) | 0 (0.0%) |
| 3 or 4 Children | 30 (100.0%) | 0 (0.0%) |
| 5 or more Children | 7 (100.0%) | 0 (0.0%) |
| Total | 778 (97.6%) | 19 (2.4%) |
Income Below Poverty Among Single-Parent Households in North Muskegon
According to the poverty data in North Muskegon, 8.3% or 12 single-father households and 19.0% or 26 single-mother households are living below the poverty line. Among single-father households, those with no children have the highest poverty rate, with 12 households (63.2%) experiencing poverty. Likewise, among single-mother households, those with no children have the highest poverty rate, with 18 households (64.3%) falling below the poverty line.
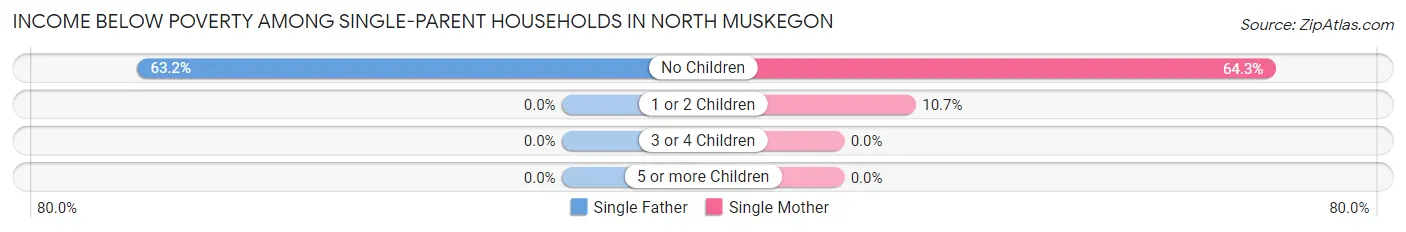
| Children | Single Father | Single Mother |
| No Children | 12 (63.2%) | 18 (64.3%) |
| 1 or 2 Children | 0 (0.0%) | 8 (10.7%) |
| 3 or 4 Children | 0 (0.0%) | 0 (0.0%) |
| 5 or more Children | 0 (0.0%) | 0 (0.0%) |
| Total | 12 (8.3%) | 26 (19.0%) |
Income Below Poverty Among Married-Couple vs Single-Parent Households in North Muskegon
The poverty data for North Muskegon shows that 19 of the married-couple family households (2.4%) and 38 of the single-parent households (13.5%) are living below the poverty level. Within the married-couple family households, those with no children have the highest poverty rate, with 19 households (3.9%) falling below the poverty line. Among the single-parent households, those with no children have the highest poverty rate, with 30 household (63.8%) living below poverty.
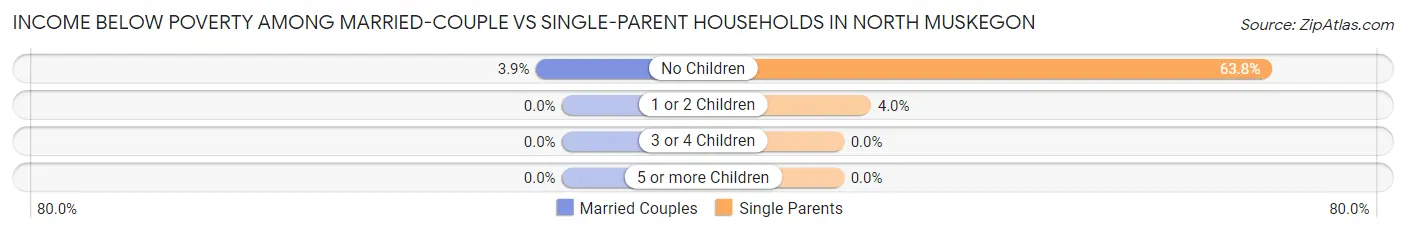
| Children | Married-Couple Families | Single-Parent Households |
| No Children | 19 (3.9%) | 30 (63.8%) |
| 1 or 2 Children | 0 (0.0%) | 8 (4.0%) |
| 3 or 4 Children | 0 (0.0%) | 0 (0.0%) |
| 5 or more Children | 0 (0.0%) | 0 (0.0%) |
| Total | 19 (2.4%) | 38 (13.5%) |
Race in North Muskegon
The most populous races in North Muskegon are White / Caucasian (3,505 | 86.0%), Two or more Races (459 | 11.3%), and Hispanic or Latino (395 | 9.7%).
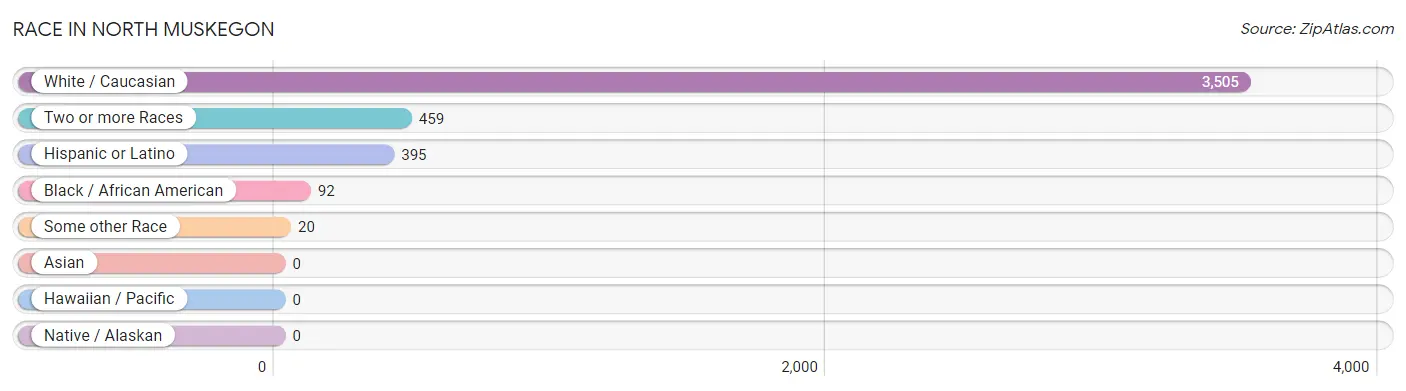
| Race | # Population | % Population |
| Asian | 0 | 0.0% |
| Black / African American | 92 | 2.3% |
| Hawaiian / Pacific | 0 | 0.0% |
| Hispanic or Latino | 395 | 9.7% |
| Native / Alaskan | 0 | 0.0% |
| White / Caucasian | 3,505 | 86.0% |
| Two or more Races | 459 | 11.3% |
| Some other Race | 20 | 0.5% |
| Total | 4,076 | 100.0% |
Ancestry in North Muskegon
The most populous ancestries reported in North Muskegon are German (742 | 18.2%), English (533 | 13.1%), Irish (497 | 12.2%), Dutch (373 | 9.1%), and Polish (303 | 7.4%), together accounting for 60.1% of all North Muskegon residents.
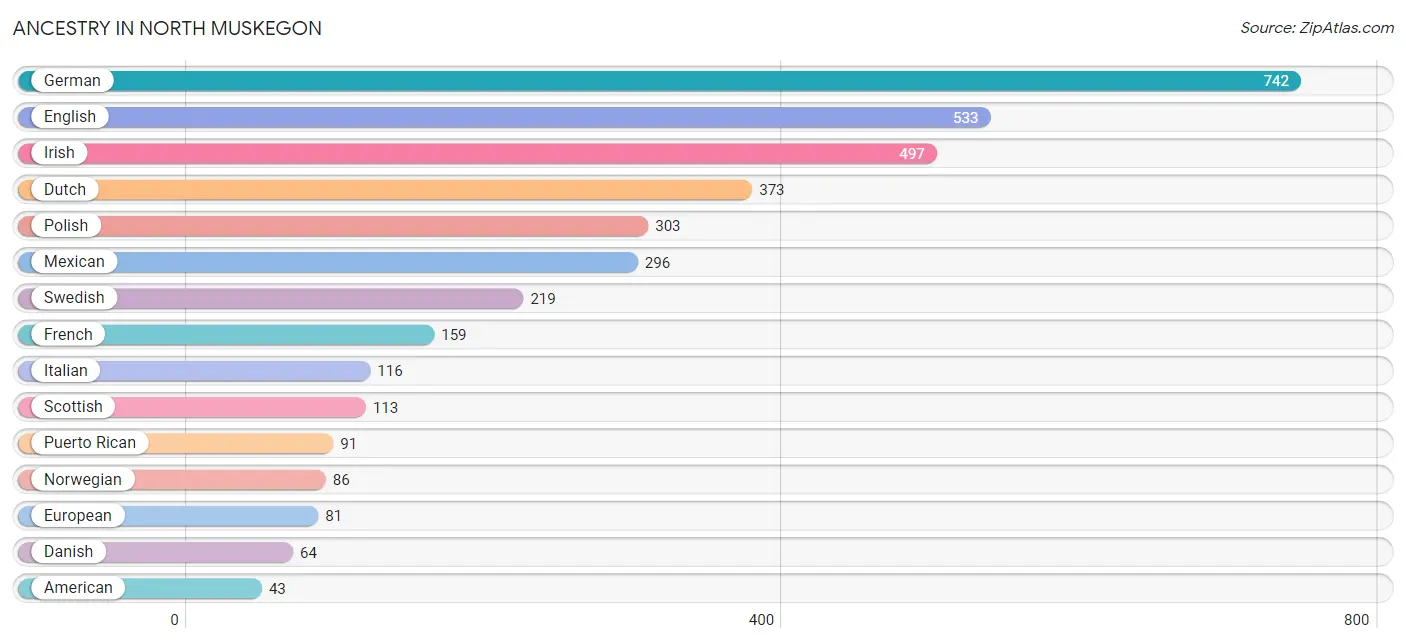
| Ancestry | # Population | % Population |
| American | 43 | 1.1% |
| Bhutanese | 10 | 0.3% |
| Brazilian | 10 | 0.3% |
| Bulgarian | 6 | 0.2% |
| Cherokee | 1 | 0.0% |
| Danish | 64 | 1.6% |
| Dutch | 373 | 9.1% |
| Eastern European | 20 | 0.5% |
| English | 533 | 13.1% |
| European | 81 | 2.0% |
| Finnish | 25 | 0.6% |
| French | 159 | 3.9% |
| French Canadian | 26 | 0.6% |
| German | 742 | 18.2% |
| Hungarian | 5 | 0.1% |
| Irish | 497 | 12.2% |
| Italian | 116 | 2.9% |
| Latvian | 10 | 0.3% |
| Mexican | 296 | 7.3% |
| Northern European | 13 | 0.3% |
| Norwegian | 86 | 2.1% |
| Ottawa | 16 | 0.4% |
| Peruvian | 8 | 0.2% |
| Polish | 303 | 7.4% |
| Puerto Rican | 91 | 2.2% |
| Romanian | 10 | 0.3% |
| Russian | 6 | 0.2% |
| Scandinavian | 10 | 0.3% |
| Scotch-Irish | 30 | 0.7% |
| Scottish | 113 | 2.8% |
| Slovak | 7 | 0.2% |
| South American | 8 | 0.2% |
| South American Indian | 8 | 0.2% |
| Swedish | 219 | 5.4% |
| Swiss | 10 | 0.3% |
| Ukrainian | 8 | 0.2% | View All 36 Rows |
Immigrants in North Muskegon
The most numerous immigrant groups reported in North Muskegon came from Europe (38 | 0.9%), Northern Europe (28 | 0.7%), Scotland (14 | 0.3%), Latin America (13 | 0.3%), and South America (12 | 0.3%), together accounting for 2.6% of all North Muskegon residents.
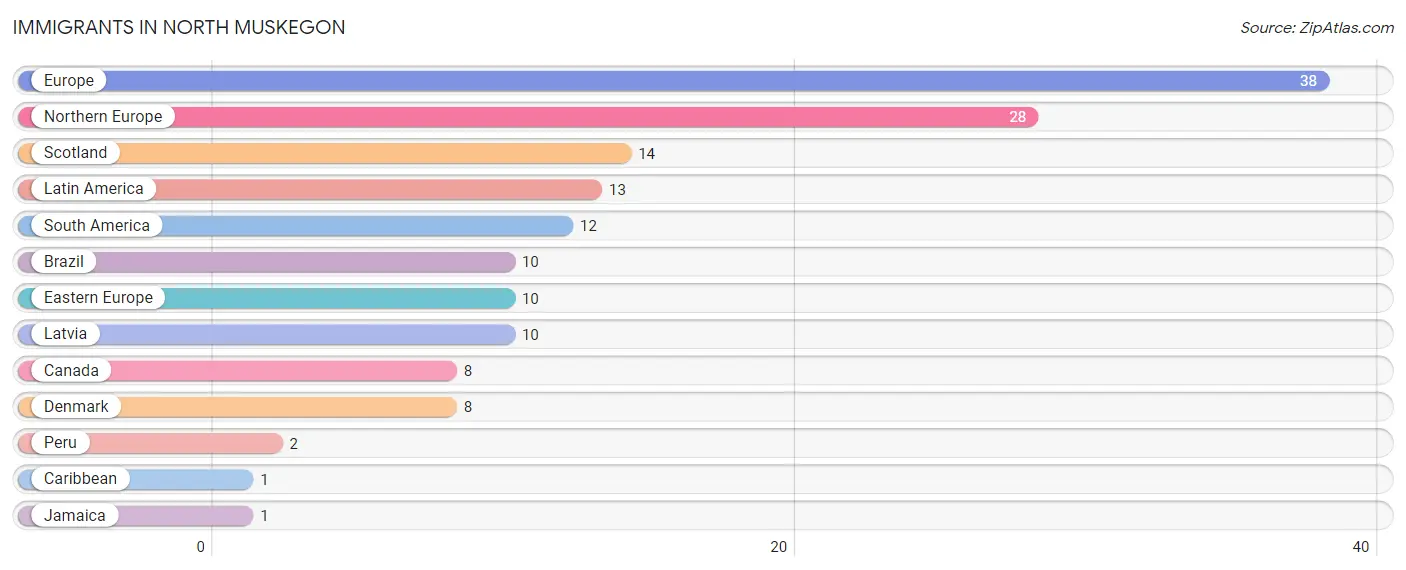
| Immigration Origin | # Population | % Population |
| Brazil | 10 | 0.3% |
| Canada | 8 | 0.2% |
| Caribbean | 1 | 0.0% |
| Denmark | 8 | 0.2% |
| Eastern Europe | 10 | 0.3% |
| Europe | 38 | 0.9% |
| Jamaica | 1 | 0.0% |
| Latin America | 13 | 0.3% |
| Latvia | 10 | 0.3% |
| Northern Europe | 28 | 0.7% |
| Peru | 2 | 0.1% |
| Scotland | 14 | 0.3% |
| South America | 12 | 0.3% | View All 13 Rows |
Sex and Age in North Muskegon
Sex and Age in North Muskegon
The most populous age groups in North Muskegon are 15 to 19 Years (302 | 15.0%) for men and 60 to 64 Years (172 | 8.4%) for women.
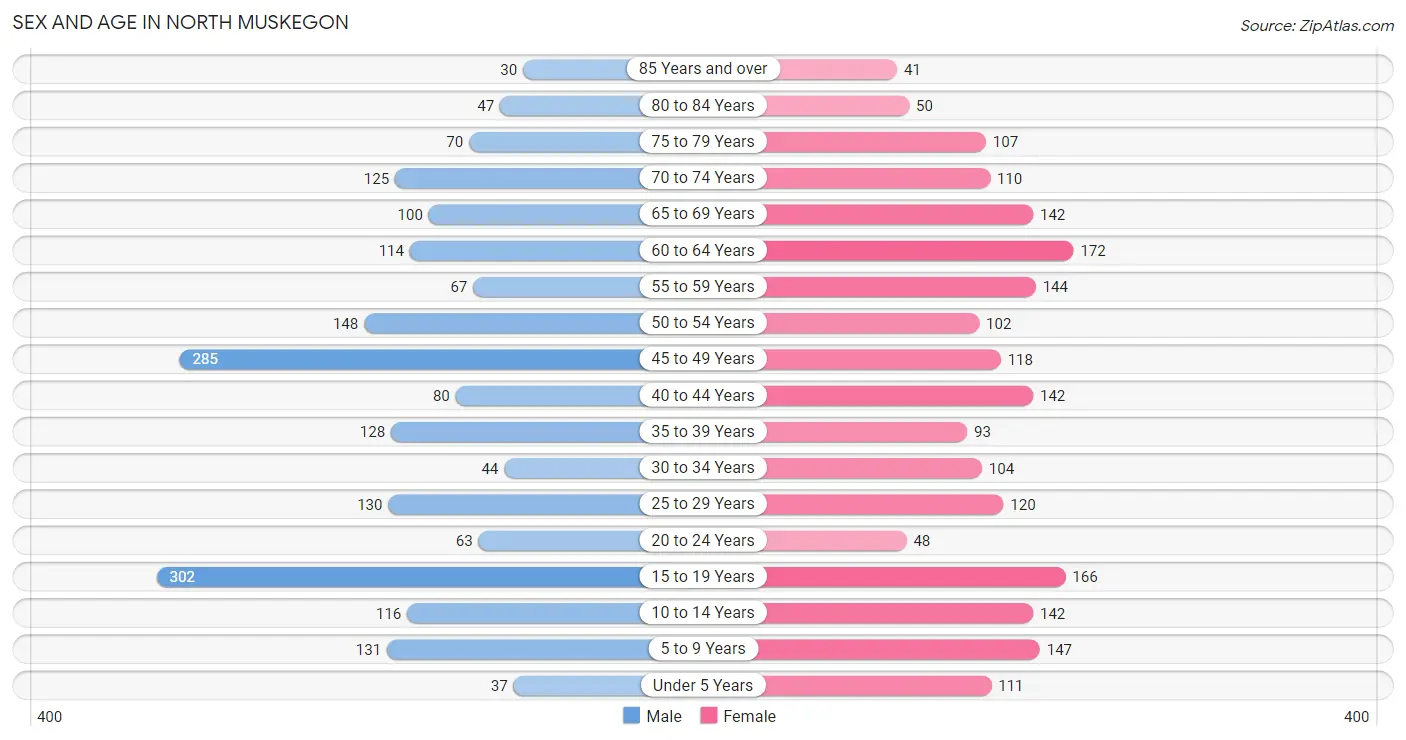
| Age Bracket | Male | Female |
| Under 5 Years | 37 (1.8%) | 111 (5.4%) |
| 5 to 9 Years | 131 (6.5%) | 147 (7.1%) |
| 10 to 14 Years | 116 (5.8%) | 142 (6.9%) |
| 15 to 19 Years | 302 (15.0%) | 166 (8.1%) |
| 20 to 24 Years | 63 (3.1%) | 48 (2.3%) |
| 25 to 29 Years | 130 (6.5%) | 120 (5.8%) |
| 30 to 34 Years | 44 (2.2%) | 104 (5.1%) |
| 35 to 39 Years | 128 (6.4%) | 93 (4.5%) |
| 40 to 44 Years | 80 (4.0%) | 142 (6.9%) |
| 45 to 49 Years | 285 (14.1%) | 118 (5.7%) |
| 50 to 54 Years | 148 (7.3%) | 102 (5.0%) |
| 55 to 59 Years | 67 (3.3%) | 144 (7.0%) |
| 60 to 64 Years | 114 (5.7%) | 172 (8.4%) |
| 65 to 69 Years | 100 (5.0%) | 142 (6.9%) |
| 70 to 74 Years | 125 (6.2%) | 110 (5.3%) |
| 75 to 79 Years | 70 (3.5%) | 107 (5.2%) |
| 80 to 84 Years | 47 (2.3%) | 50 (2.4%) |
| 85 Years and over | 30 (1.5%) | 41 (2.0%) |
| Total | 2,017 (100.0%) | 2,059 (100.0%) |
Families and Households in North Muskegon
Median Family Size in North Muskegon
The median family size in North Muskegon is 3.03 persons per family, with single female/mother families (137 | 12.7%) accounting for the largest median family size of 3.18 persons per family. On the other hand, single male/father families (145 | 13.4%) represent the smallest median family size with 2.30 persons per family.
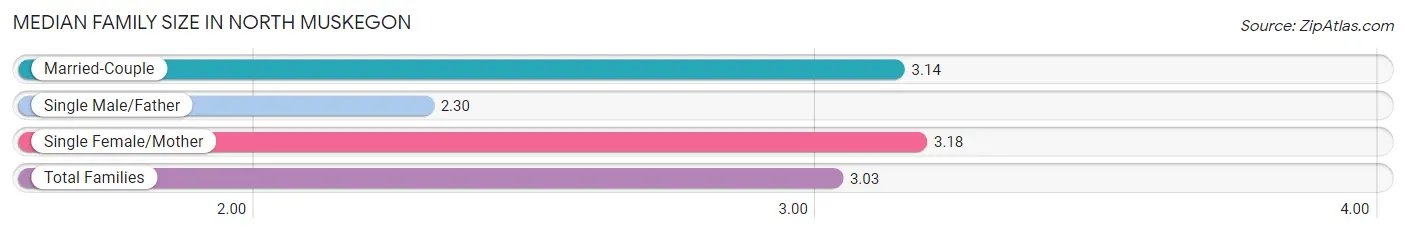
| Family Type | # Families | Family Size |
| Married-Couple | 797 (73.9%) | 3.14 |
| Single Male/Father | 145 (13.4%) | 2.30 |
| Single Female/Mother | 137 (12.7%) | 3.18 |
| Total Families | 1,079 (100.0%) | 3.03 |
Median Household Size in North Muskegon
The median household size in North Muskegon is 2.54 persons per household, with single female/mother households (137 | 8.7%) accounting for the largest median household size of 3.53 persons per household. non-family households (501 | 31.7%) represent the smallest median household size with 1.33 persons per household.
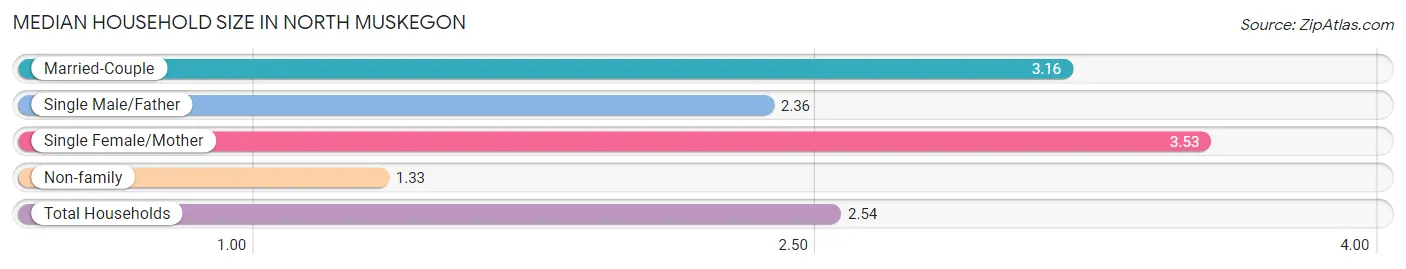
| Household Type | # Households | Household Size |
| Married-Couple | 797 (50.4%) | 3.16 |
| Single Male/Father | 145 (9.2%) | 2.36 |
| Single Female/Mother | 137 (8.7%) | 3.53 |
| Non-family | 501 (31.7%) | 1.33 |
| Total Households | 1,580 (100.0%) | 2.54 |
Household Size by Marriage Status in North Muskegon
Out of a total of 1,580 households in North Muskegon, 1,079 (68.3%) are family households, while 501 (31.7%) are nonfamily households. The most numerous type of family households are 2-person households, comprising 588, and the most common type of nonfamily households are 1-person households, comprising 386.
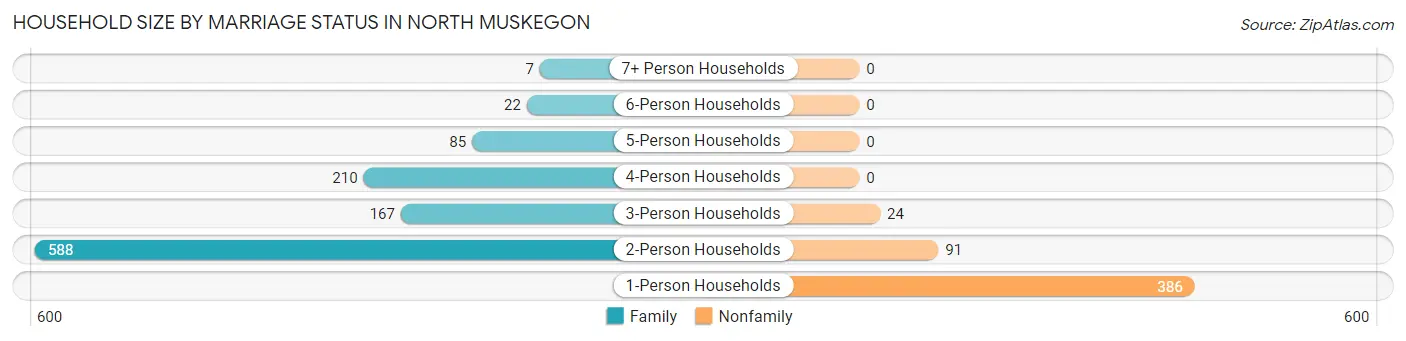
| Household Size | Family Households | Nonfamily Households |
| 1-Person Households | - | 386 (24.4%) |
| 2-Person Households | 588 (37.2%) | 91 (5.8%) |
| 3-Person Households | 167 (10.6%) | 24 (1.5%) |
| 4-Person Households | 210 (13.3%) | 0 (0.0%) |
| 5-Person Households | 85 (5.4%) | 0 (0.0%) |
| 6-Person Households | 22 (1.4%) | 0 (0.0%) |
| 7+ Person Households | 7 (0.4%) | 0 (0.0%) |
| Total | 1,079 (68.3%) | 501 (31.7%) |
Female Fertility in North Muskegon
Fertility by Age in North Muskegon
Average fertility rate in North Muskegon is 7.0 births per 1,000 women. Women in the age bracket of 20 to 34 years have the highest fertility rate with 22.0 births per 1,000 women. Women in the age bracket of 20 to 34 years acount for 100.0% of all women with births.
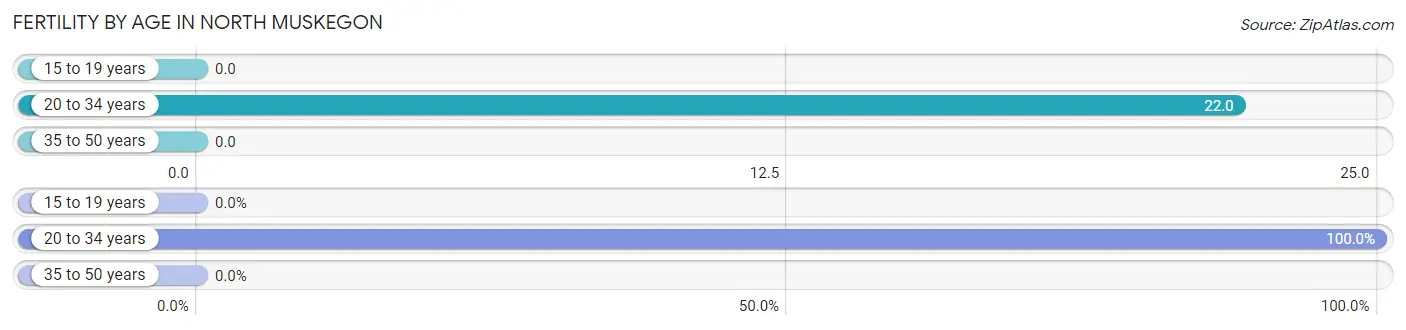
| Age Bracket | Women with Births | Births / 1,000 Women |
| 15 to 19 years | 0 (0.0%) | 0.0 |
| 20 to 34 years | 6 (100.0%) | 22.0 |
| 35 to 50 years | 0 (0.0%) | 0.0 |
| Total | 6 (100.0%) | 7.0 |
Fertility by Age by Marriage Status in North Muskegon
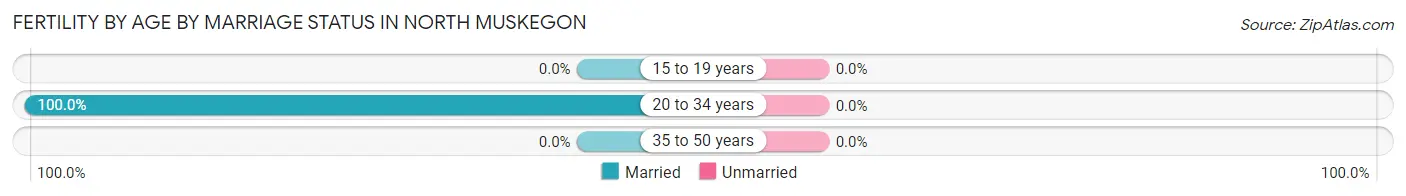
| Age Bracket | Married | Unmarried |
| 15 to 19 years | 0 (0.0%) | 0 (0.0%) |
| 20 to 34 years | 6 (100.0%) | 0 (0.0%) |
| 35 to 50 years | 0 (0.0%) | 0 (0.0%) |
| Total | 6 (100.0%) | 0 (0.0%) |
Fertility by Education in North Muskegon
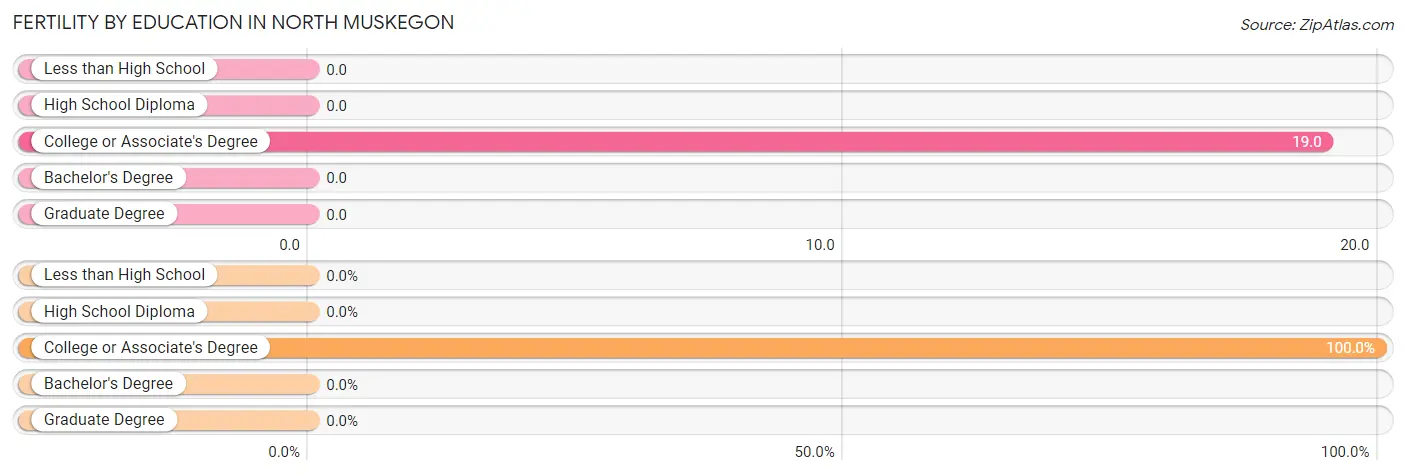
| Educational Attainment | Women with Births | Births / 1,000 Women |
| Less than High School | 0 (0.0%) | 0.0 |
| High School Diploma | 0 (0.0%) | 0.0 |
| College or Associate's Degree | 6 (100.0%) | 19.0 |
| Bachelor's Degree | 0 (0.0%) | 0.0 |
| Graduate Degree | 0 (0.0%) | 0.0 |
| Total | 6 (100.0%) | 7.0 |
Fertility by Education by Marriage Status in North Muskegon
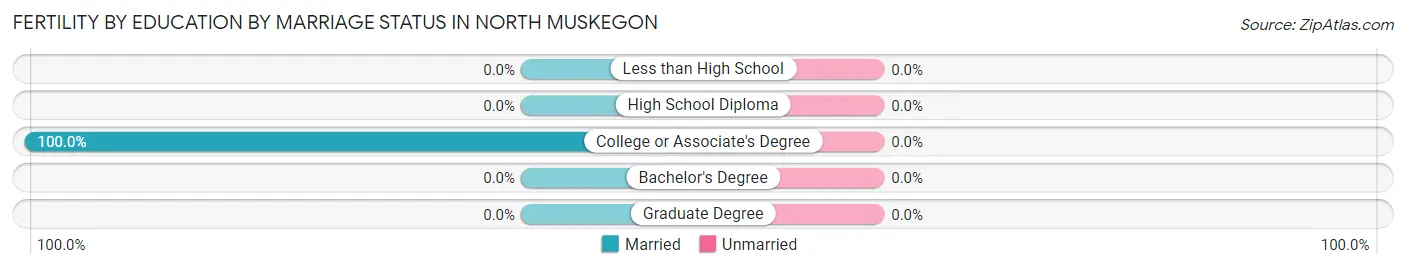
| Educational Attainment | Married | Unmarried |
| Less than High School | 0 (0.0%) | 0 (0.0%) |
| High School Diploma | 0 (0.0%) | 0 (0.0%) |
| College or Associate's Degree | 6 (100.0%) | 0 (0.0%) |
| Bachelor's Degree | 0 (0.0%) | 0 (0.0%) |
| Graduate Degree | 0 (0.0%) | 0 (0.0%) |
| Total | 6 (100.0%) | 0 (0.0%) |
Employment Characteristics in North Muskegon
Employment by Class of Employer in North Muskegon
Among the 1,978 employed individuals in North Muskegon, private company employees (1,439 | 72.8%), not-for-profit organizations (209 | 10.6%), and state government employees (95 | 4.8%) make up the most common classes of employment.
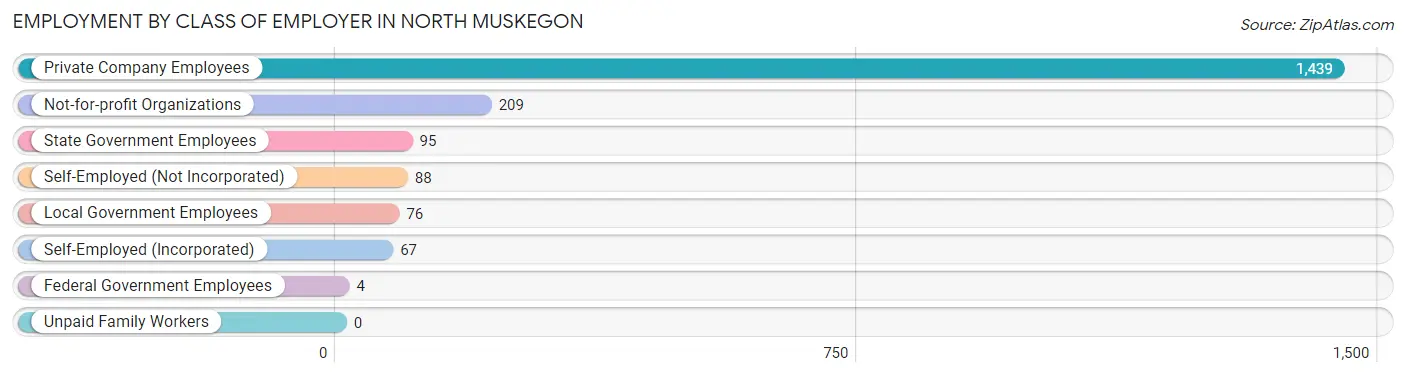
| Employer Class | # Employees | % Employees |
| Private Company Employees | 1,439 | 72.8% |
| Self-Employed (Incorporated) | 67 | 3.4% |
| Self-Employed (Not Incorporated) | 88 | 4.4% |
| Not-for-profit Organizations | 209 | 10.6% |
| Local Government Employees | 76 | 3.8% |
| State Government Employees | 95 | 4.8% |
| Federal Government Employees | 4 | 0.2% |
| Unpaid Family Workers | 0 | 0.0% |
| Total | 1,978 | 100.0% |
Employment Status by Age in North Muskegon
According to the labor force statistics for North Muskegon, out of the total population over 16 years of age (3,199), 65.6% or 2,099 individuals are in the labor force, with 1.4% or 29 of them unemployed. The age group with the highest labor force participation rate is 30 to 34 years, with 93.2% or 138 individuals in the labor force. Within the labor force, the 30 to 34 years age range has the highest percentage of unemployed individuals, with 8.0% or 11 of them being unemployed.
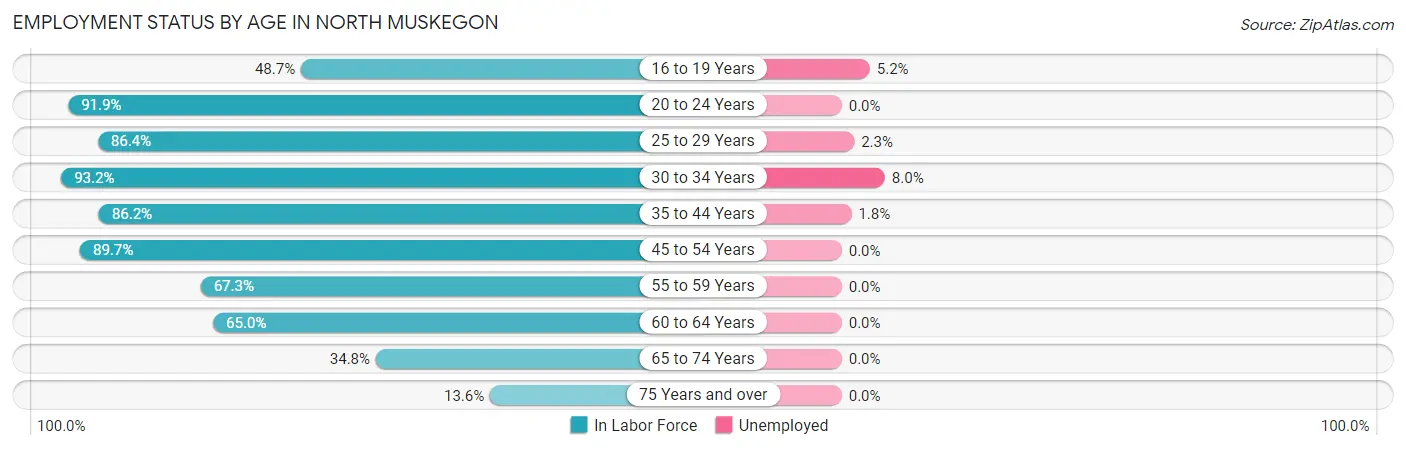
| Age Bracket | In Labor Force | Unemployed |
| 16 to 19 Years | 134 (48.7%) | 7 (5.2%) |
| 20 to 24 Years | 102 (91.9%) | 0 (0.0%) |
| 25 to 29 Years | 216 (86.4%) | 5 (2.3%) |
| 30 to 34 Years | 138 (93.2%) | 11 (8.0%) |
| 35 to 44 Years | 382 (86.2%) | 7 (1.8%) |
| 45 to 54 Years | 586 (89.7%) | 0 (0.0%) |
| 55 to 59 Years | 142 (67.3%) | 0 (0.0%) |
| 60 to 64 Years | 186 (65.0%) | 0 (0.0%) |
| 65 to 74 Years | 166 (34.8%) | 0 (0.0%) |
| 75 Years and over | 47 (13.6%) | 0 (0.0%) |
| Total | 2,099 (65.6%) | 29 (1.4%) |
Employment Status by Educational Attainment in North Muskegon
According to labor force statistics for North Muskegon, 82.9% of individuals (1,651) out of the total population between 25 and 64 years of age (1,991) are in the labor force, with 1.4% or 23 of them being unemployed. The group with the highest labor force participation rate are those with the educational attainment of college / associate degree, with 90.3% or 653 individuals in the labor force. Within the labor force, individuals with high school diploma education have the highest percentage of unemployment, with 2.1% or 5 of them being unemployed.
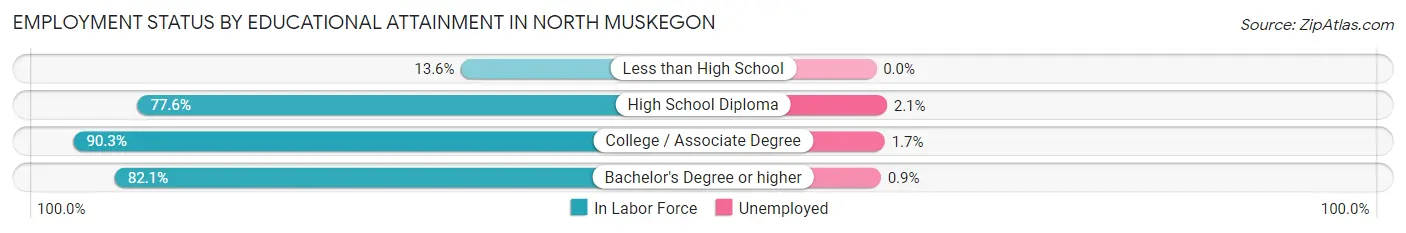
| Educational Attainment | In Labor Force | Unemployed |
| Less than High School | 6 (13.6%) | 0 (0.0%) |
| High School Diploma | 236 (77.6%) | 6 (2.1%) |
| College / Associate Degree | 653 (90.3%) | 12 (1.7%) |
| Bachelor's Degree or higher | 755 (82.1%) | 8 (0.9%) |
| Total | 1,651 (82.9%) | 28 (1.4%) |
Employment Occupations by Sex in North Muskegon
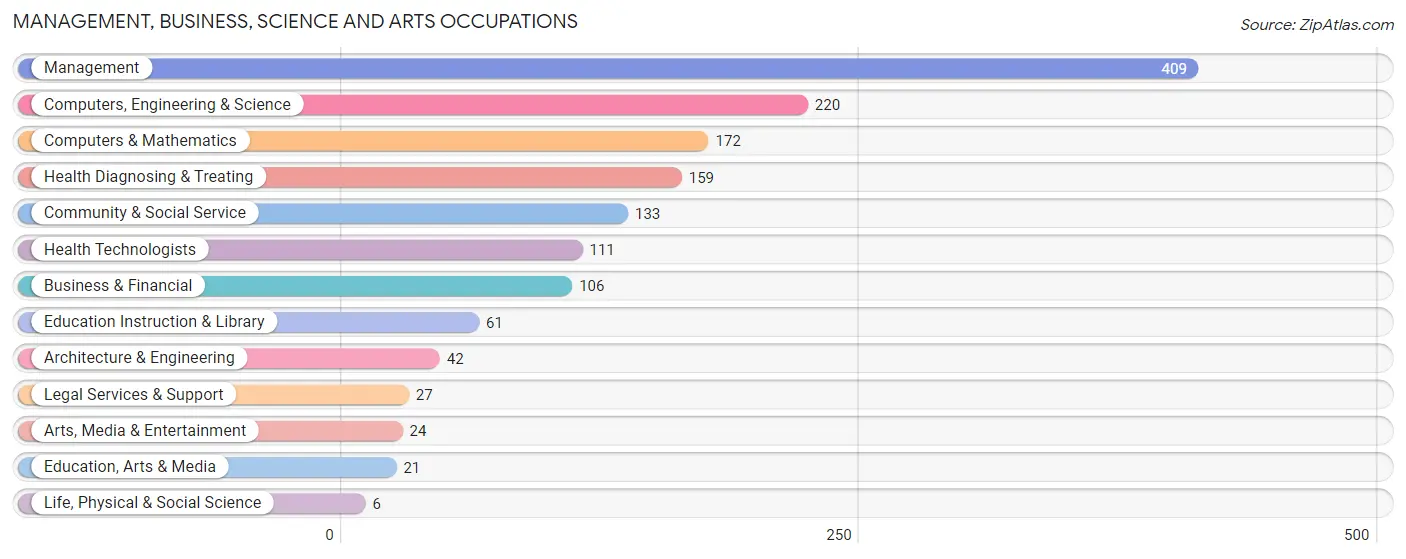
Management, Business, Science and Arts Occupations
The most common Management, Business, Science and Arts occupations in North Muskegon are Management (409 | 19.8%), Computers, Engineering & Science (220 | 10.6%), Computers & Mathematics (172 | 8.3%), Health Diagnosing & Treating (159 | 7.7%), and Community & Social Service (133 | 6.4%).
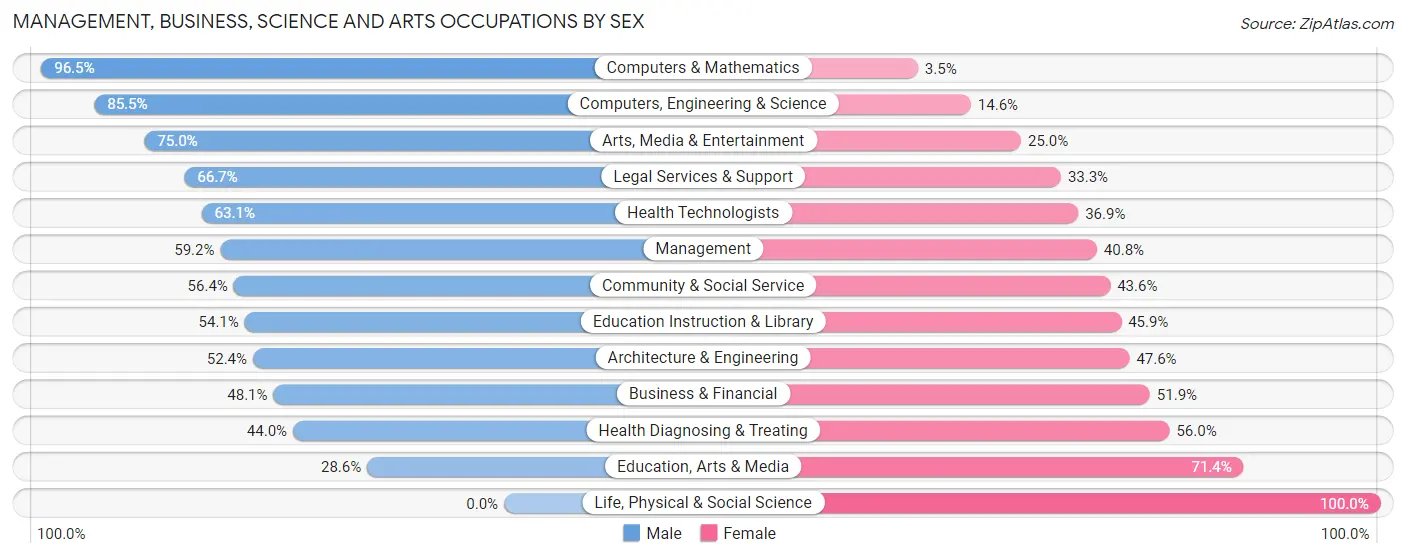
Management, Business, Science and Arts Occupations by Sex
Within the Management, Business, Science and Arts occupations in North Muskegon, the most male-oriented occupations are Computers & Mathematics (96.5%), Computers, Engineering & Science (85.5%), and Arts, Media & Entertainment (75.0%), while the most female-oriented occupations are Life, Physical & Social Science (100.0%), Education, Arts & Media (71.4%), and Health Diagnosing & Treating (56.0%).
| Occupation | Male | Female |
| Management | 242 (59.2%) | 167 (40.8%) |
| Business & Financial | 51 (48.1%) | 55 (51.9%) |
| Computers, Engineering & Science | 188 (85.5%) | 32 (14.5%) |
| Computers & Mathematics | 166 (96.5%) | 6 (3.5%) |
| Architecture & Engineering | 22 (52.4%) | 20 (47.6%) |
| Life, Physical & Social Science | 0 (0.0%) | 6 (100.0%) |
| Community & Social Service | 75 (56.4%) | 58 (43.6%) |
| Education, Arts & Media | 6 (28.6%) | 15 (71.4%) |
| Legal Services & Support | 18 (66.7%) | 9 (33.3%) |
| Education Instruction & Library | 33 (54.1%) | 28 (45.9%) |
| Arts, Media & Entertainment | 18 (75.0%) | 6 (25.0%) |
| Health Diagnosing & Treating | 70 (44.0%) | 89 (56.0%) |
| Health Technologists | 70 (63.1%) | 41 (36.9%) |
| Total (Category) | 626 (61.0%) | 401 (39.1%) |
| Total (Overall) | 1,123 (54.3%) | 946 (45.7%) |
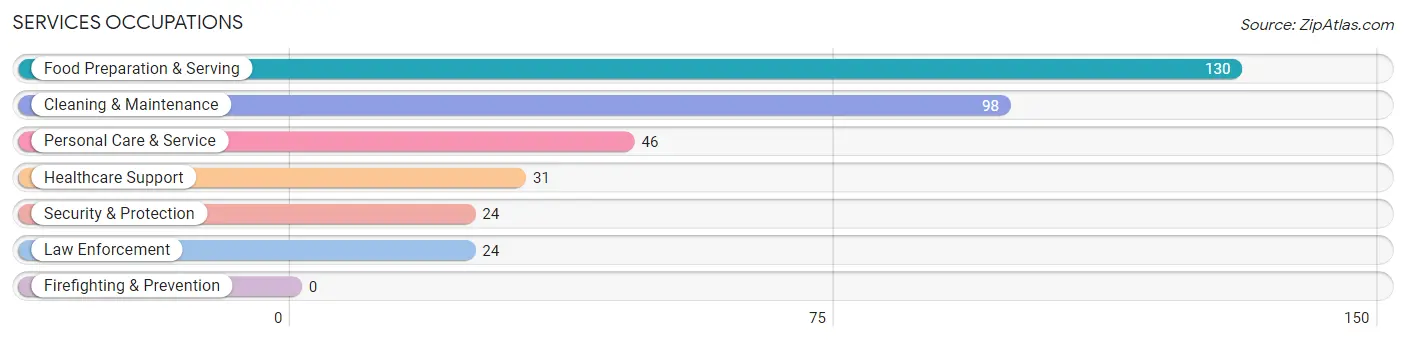
Services Occupations
The most common Services occupations in North Muskegon are Food Preparation & Serving (130 | 6.3%), Cleaning & Maintenance (98 | 4.7%), Personal Care & Service (46 | 2.2%), Healthcare Support (31 | 1.5%), and Security & Protection (24 | 1.2%).
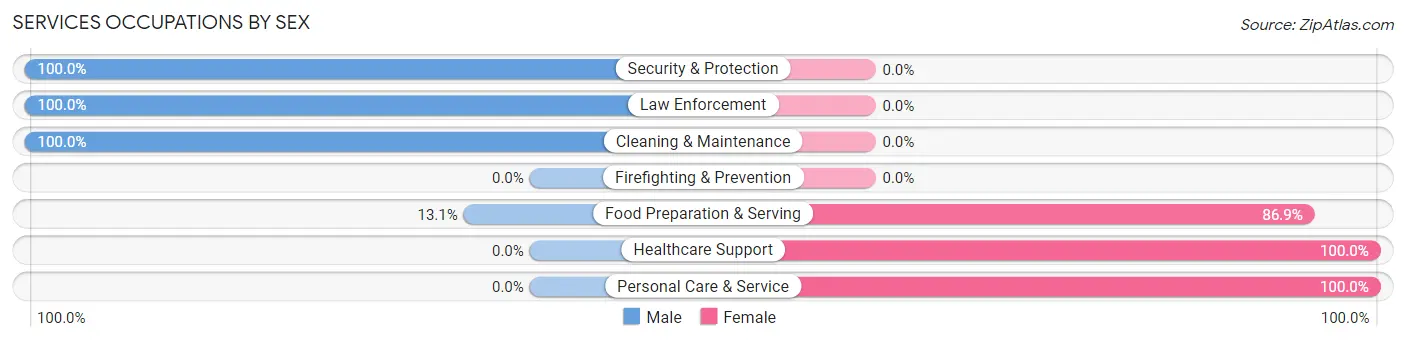
Services Occupations by Sex
Within the Services occupations in North Muskegon, the most male-oriented occupations are Security & Protection (100.0%), Law Enforcement (100.0%), and Cleaning & Maintenance (100.0%), while the most female-oriented occupations are Healthcare Support (100.0%), Personal Care & Service (100.0%), and Food Preparation & Serving (86.9%).
| Occupation | Male | Female |
| Healthcare Support | 0 (0.0%) | 31 (100.0%) |
| Security & Protection | 24 (100.0%) | 0 (0.0%) |
| Firefighting & Prevention | 0 (0.0%) | 0 (0.0%) |
| Law Enforcement | 24 (100.0%) | 0 (0.0%) |
| Food Preparation & Serving | 17 (13.1%) | 113 (86.9%) |
| Cleaning & Maintenance | 98 (100.0%) | 0 (0.0%) |
| Personal Care & Service | 0 (0.0%) | 46 (100.0%) |
| Total (Category) | 139 (42.2%) | 190 (57.8%) |
| Total (Overall) | 1,123 (54.3%) | 946 (45.7%) |
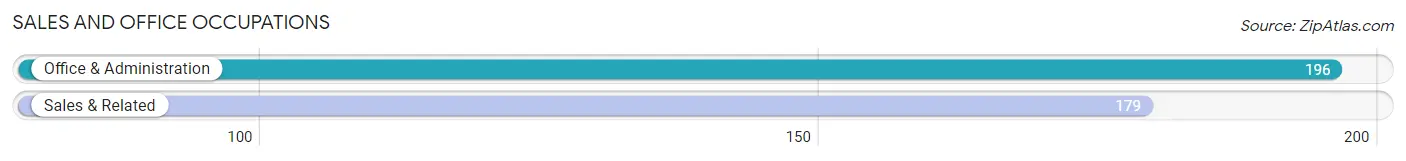
Sales and Office Occupations
The most common Sales and Office occupations in North Muskegon are Office & Administration (196 | 9.5%), and Sales & Related (179 | 8.6%).
Sales and Office Occupations by Sex
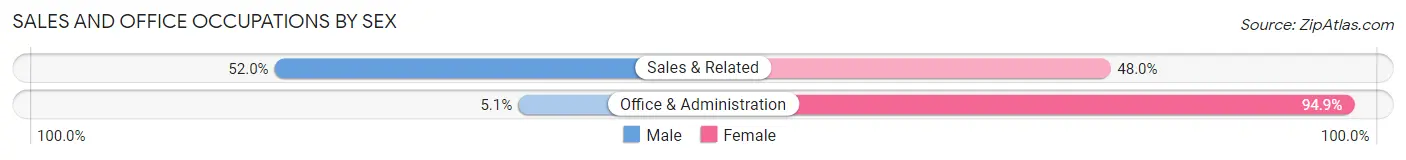
| Occupation | Male | Female |
| Sales & Related | 93 (52.0%) | 86 (48.0%) |
| Office & Administration | 10 (5.1%) | 186 (94.9%) |
| Total (Category) | 103 (27.5%) | 272 (72.5%) |
| Total (Overall) | 1,123 (54.3%) | 946 (45.7%) |
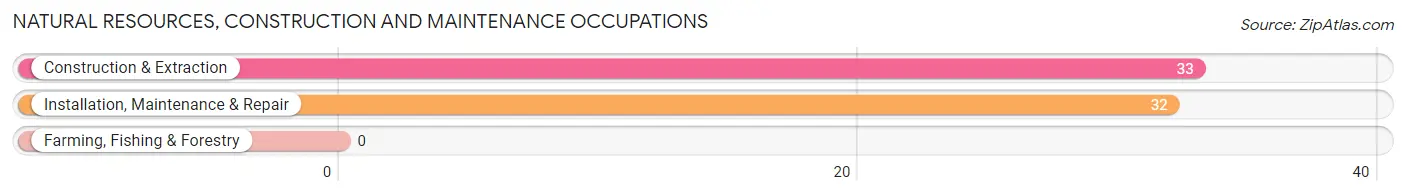
Natural Resources, Construction and Maintenance Occupations
The most common Natural Resources, Construction and Maintenance occupations in North Muskegon are Construction & Extraction (33 | 1.6%), and Installation, Maintenance & Repair (32 | 1.5%).
Natural Resources, Construction and Maintenance Occupations by Sex
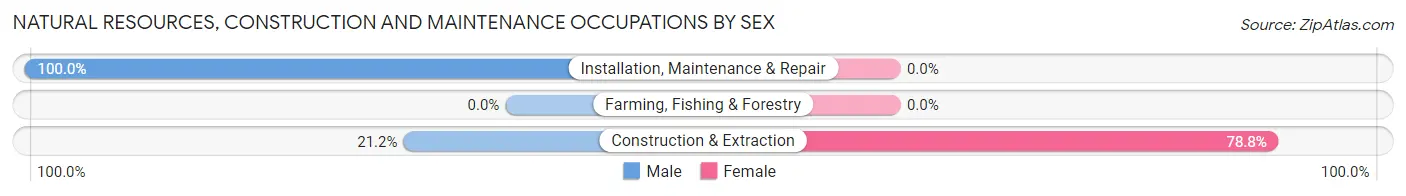
| Occupation | Male | Female |
| Farming, Fishing & Forestry | 0 (0.0%) | 0 (0.0%) |
| Construction & Extraction | 7 (21.2%) | 26 (78.8%) |
| Installation, Maintenance & Repair | 32 (100.0%) | 0 (0.0%) |
| Total (Category) | 39 (60.0%) | 26 (40.0%) |
| Total (Overall) | 1,123 (54.3%) | 946 (45.7%) |
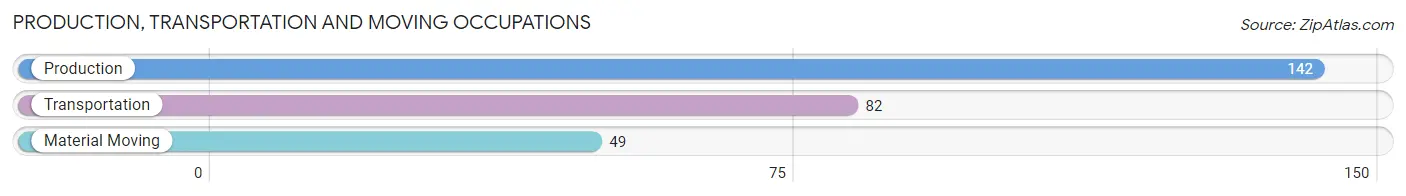
Production, Transportation and Moving Occupations
The most common Production, Transportation and Moving occupations in North Muskegon are Production (142 | 6.9%), Transportation (82 | 4.0%), and Material Moving (49 | 2.4%).
Production, Transportation and Moving Occupations by Sex
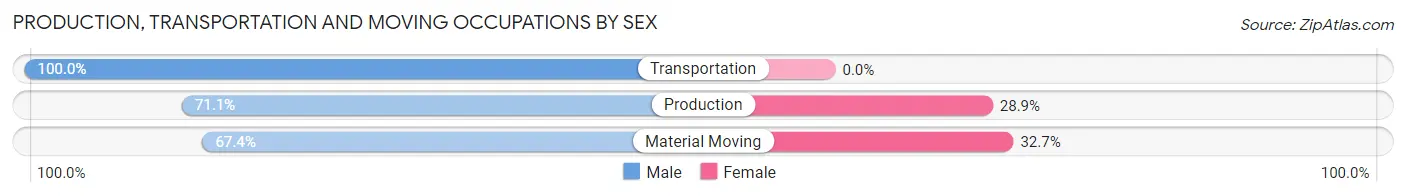
| Occupation | Male | Female |
| Production | 101 (71.1%) | 41 (28.9%) |
| Transportation | 82 (100.0%) | 0 (0.0%) |
| Material Moving | 33 (67.3%) | 16 (32.7%) |
| Total (Category) | 216 (79.1%) | 57 (20.9%) |
| Total (Overall) | 1,123 (54.3%) | 946 (45.7%) |
Employment Industries by Sex in North Muskegon
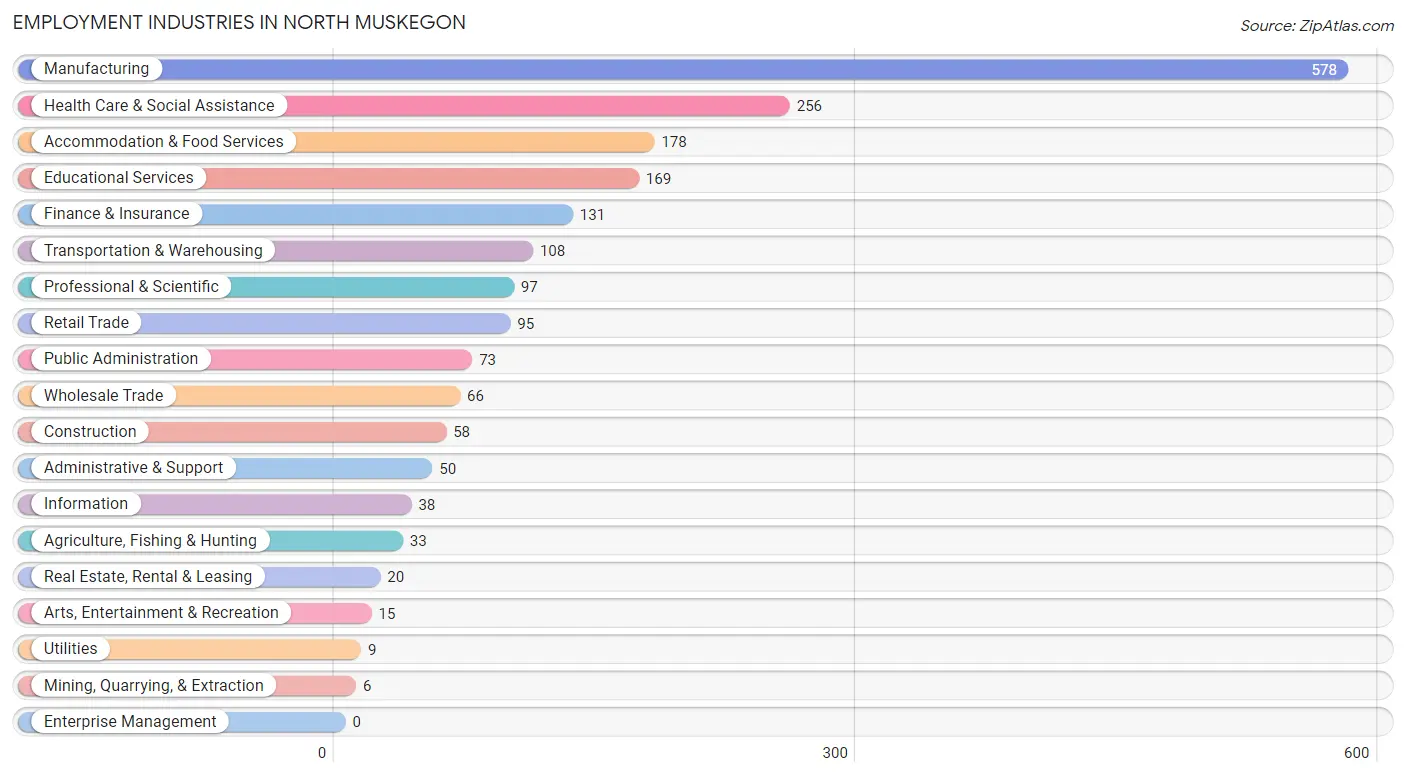
Employment Industries in North Muskegon
The major employment industries in North Muskegon include Manufacturing (578 | 27.9%), Health Care & Social Assistance (256 | 12.4%), Accommodation & Food Services (178 | 8.6%), Educational Services (169 | 8.2%), and Finance & Insurance (131 | 6.3%).
Employment Industries by Sex in North Muskegon
The North Muskegon industries that see more men than women are Mining, Quarrying, & Extraction (100.0%), Wholesale Trade (100.0%), and Administrative & Support (86.0%), whereas the industries that tend to have a higher number of women are Utilities (100.0%), Real Estate, Rental & Leasing (100.0%), and Health Care & Social Assistance (71.1%).
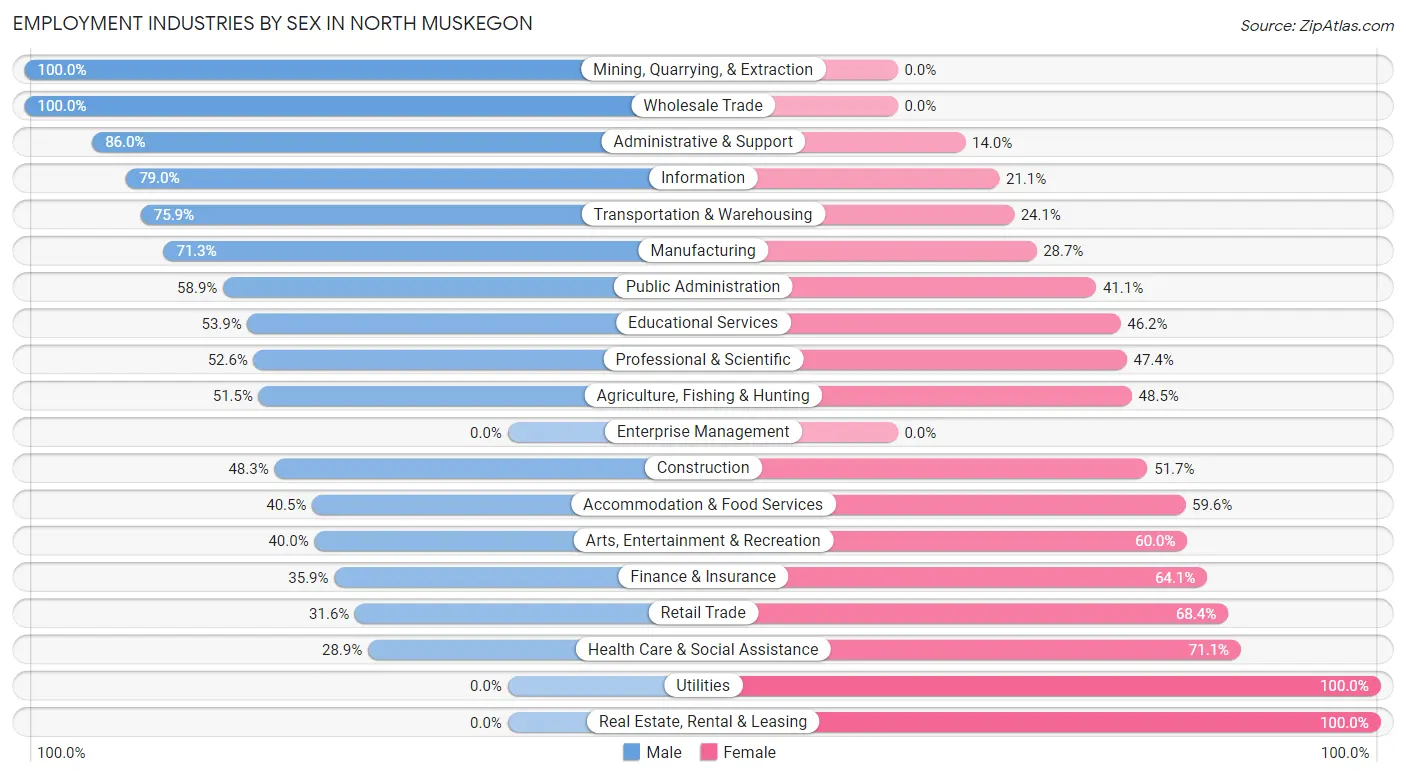
| Industry | Male | Female |
| Agriculture, Fishing & Hunting | 17 (51.5%) | 16 (48.5%) |
| Mining, Quarrying, & Extraction | 6 (100.0%) | 0 (0.0%) |
| Construction | 28 (48.3%) | 30 (51.7%) |
| Manufacturing | 412 (71.3%) | 166 (28.7%) |
| Wholesale Trade | 66 (100.0%) | 0 (0.0%) |
| Retail Trade | 30 (31.6%) | 65 (68.4%) |
| Transportation & Warehousing | 82 (75.9%) | 26 (24.1%) |
| Utilities | 0 (0.0%) | 9 (100.0%) |
| Information | 30 (78.9%) | 8 (21.0%) |
| Finance & Insurance | 47 (35.9%) | 84 (64.1%) |
| Real Estate, Rental & Leasing | 0 (0.0%) | 20 (100.0%) |
| Professional & Scientific | 51 (52.6%) | 46 (47.4%) |
| Enterprise Management | 0 (0.0%) | 0 (0.0%) |
| Administrative & Support | 43 (86.0%) | 7 (14.0%) |
| Educational Services | 91 (53.8%) | 78 (46.2%) |
| Health Care & Social Assistance | 74 (28.9%) | 182 (71.1%) |
| Arts, Entertainment & Recreation | 6 (40.0%) | 9 (60.0%) |
| Accommodation & Food Services | 72 (40.5%) | 106 (59.6%) |
| Public Administration | 43 (58.9%) | 30 (41.1%) |
| Total | 1,123 (54.3%) | 946 (45.7%) |
Education in North Muskegon
School Enrollment in North Muskegon
The most common levels of schooling among the 1,223 students in North Muskegon are high school (462 | 37.8%), elementary school (259 | 21.2%), and college / undergraduate (219 | 17.9%).
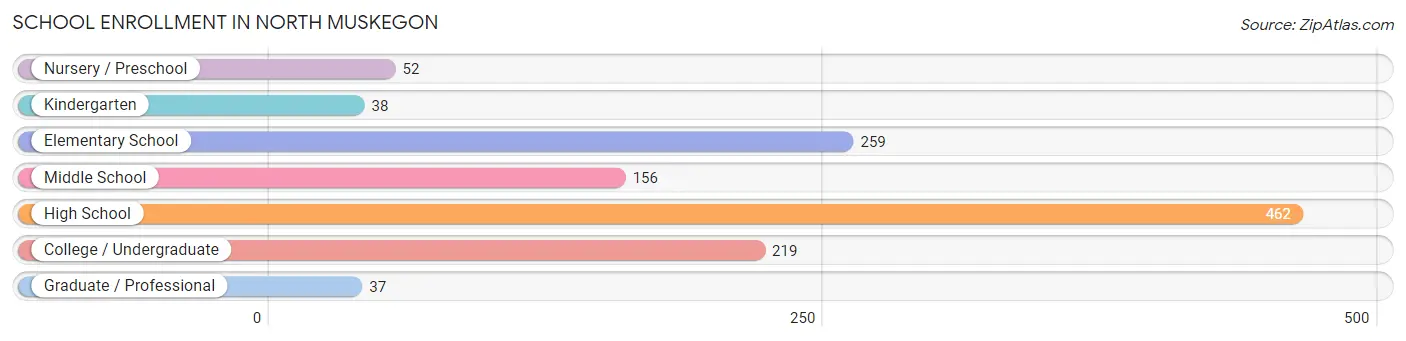
| School Level | # Students | % Students |
| Nursery / Preschool | 52 | 4.3% |
| Kindergarten | 38 | 3.1% |
| Elementary School | 259 | 21.2% |
| Middle School | 156 | 12.8% |
| High School | 462 | 37.8% |
| College / Undergraduate | 219 | 17.9% |
| Graduate / Professional | 37 | 3.0% |
| Total | 1,223 | 100.0% |
School Enrollment by Age by Funding Source in North Muskegon
Out of a total of 1,223 students who are enrolled in schools in North Muskegon, 78 (6.4%) attend a private institution, while the remaining 1,145 (93.6%) are enrolled in public schools. The age group of 35 years and over has the highest likelihood of being enrolled in private schools, with 15 (22.7% in the age bracket) enrolled. Conversely, the age group of 15 to 17 year olds has the lowest likelihood of being enrolled in a private school, with 316 (100.0% in the age bracket) attending a public institution.
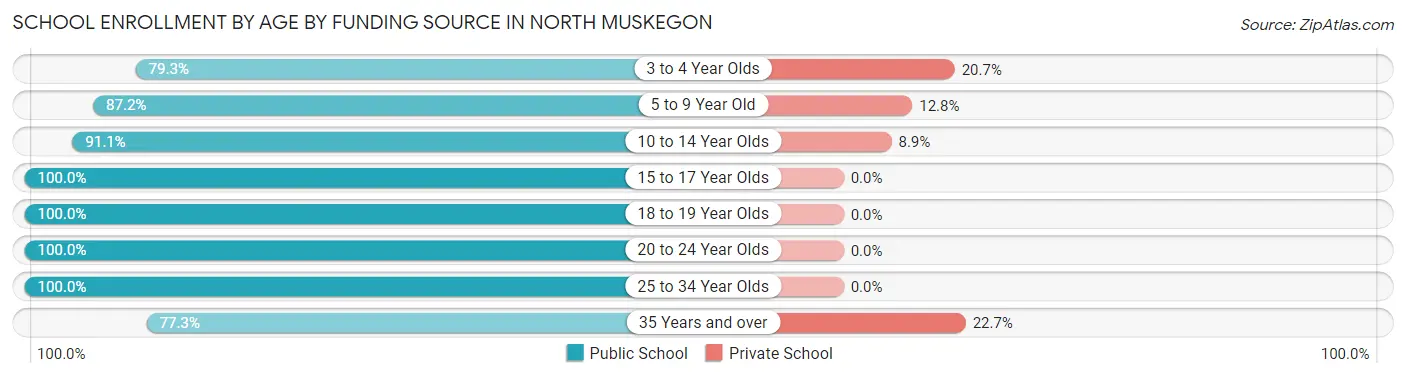
| Age Bracket | Public School | Private School |
| 3 to 4 Year Olds | 23 (79.3%) | 6 (20.7%) |
| 5 to 9 Year Old | 232 (87.2%) | 34 (12.8%) |
| 10 to 14 Year Olds | 235 (91.1%) | 23 (8.9%) |
| 15 to 17 Year Olds | 316 (100.0%) | 0 (0.0%) |
| 18 to 19 Year Olds | 152 (100.0%) | 0 (0.0%) |
| 20 to 24 Year Olds | 88 (100.0%) | 0 (0.0%) |
| 25 to 34 Year Olds | 48 (100.0%) | 0 (0.0%) |
| 35 Years and over | 51 (77.3%) | 15 (22.7%) |
| Total | 1,145 (93.6%) | 78 (6.4%) |
Educational Attainment by Field of Study in North Muskegon
Business (330 | 23.1%), education (219 | 15.4%), engineering (202 | 14.2%), arts & humanities (181 | 12.7%), and bio, nature & agricultural (125 | 8.8%) are the most common fields of study among 1,426 individuals in North Muskegon who have obtained a bachelor's degree or higher.
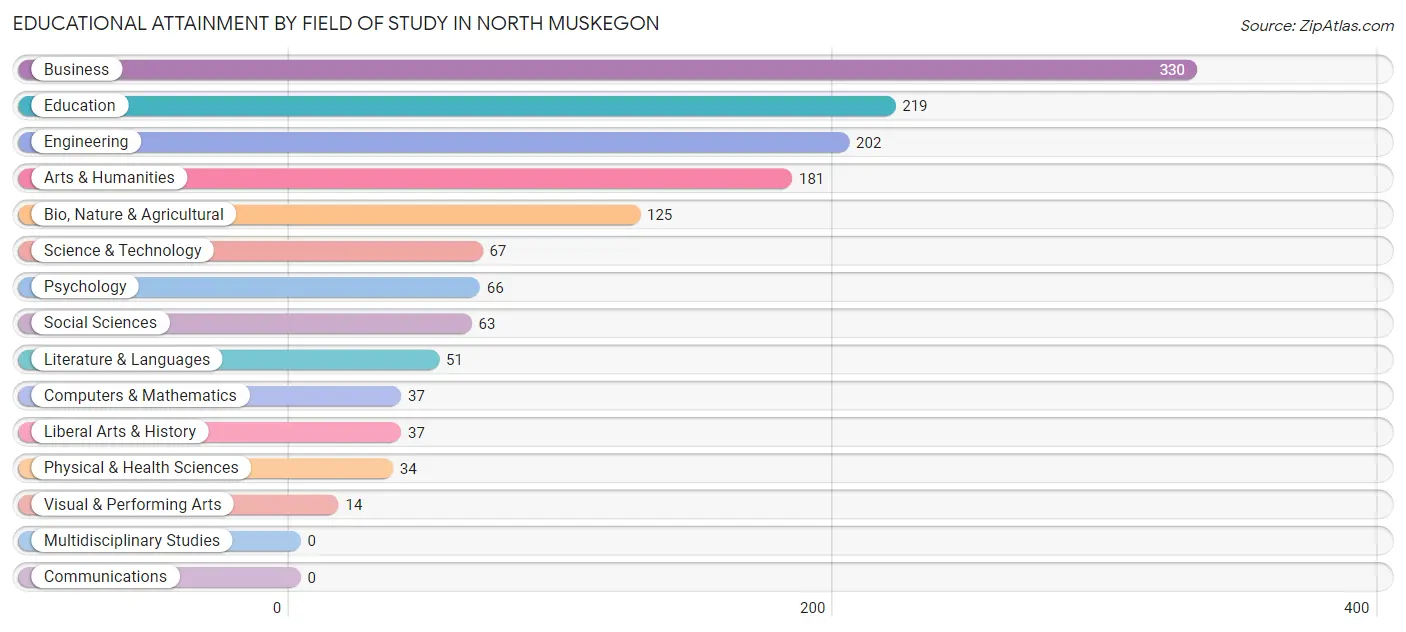
| Field of Study | # Graduates | % Graduates |
| Computers & Mathematics | 37 | 2.6% |
| Bio, Nature & Agricultural | 125 | 8.8% |
| Physical & Health Sciences | 34 | 2.4% |
| Psychology | 66 | 4.6% |
| Social Sciences | 63 | 4.4% |
| Engineering | 202 | 14.2% |
| Multidisciplinary Studies | 0 | 0.0% |
| Science & Technology | 67 | 4.7% |
| Business | 330 | 23.1% |
| Education | 219 | 15.4% |
| Literature & Languages | 51 | 3.6% |
| Liberal Arts & History | 37 | 2.6% |
| Visual & Performing Arts | 14 | 1.0% |
| Communications | 0 | 0.0% |
| Arts & Humanities | 181 | 12.7% |
| Total | 1,426 | 100.0% |
Transportation & Commute in North Muskegon
Vehicle Availability by Sex in North Muskegon
The most prevalent vehicle ownership categories in North Muskegon are males with 2 vehicles (420, accounting for 39.9%) and females with 2 vehicles (373, making up 45.5%).
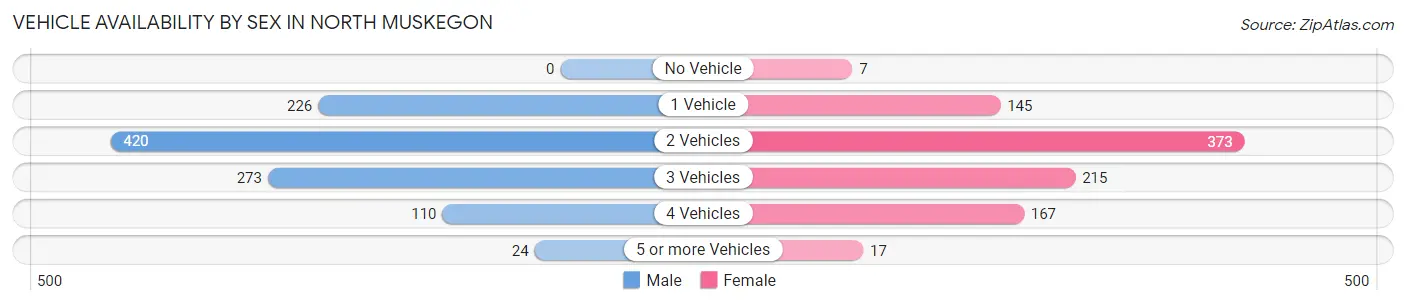
| Vehicles Available | Male | Female |
| No Vehicle | 0 (0.0%) | 7 (0.8%) |
| 1 Vehicle | 226 (21.5%) | 145 (15.7%) |
| 2 Vehicles | 420 (39.9%) | 373 (40.4%) |
| 3 Vehicles | 273 (25.9%) | 215 (23.3%) |
| 4 Vehicles | 110 (10.4%) | 167 (18.1%) |
| 5 or more Vehicles | 24 (2.3%) | 17 (1.8%) |
| Total | 1,053 (100.0%) | 924 (100.0%) |
Commute Time in North Muskegon
The most frequently occuring commute durations in North Muskegon are 15 to 19 minutes (482 commuters, 26.6%), 5 to 9 minutes (361 commuters, 19.9%), and 20 to 24 minutes (236 commuters, 13.0%).
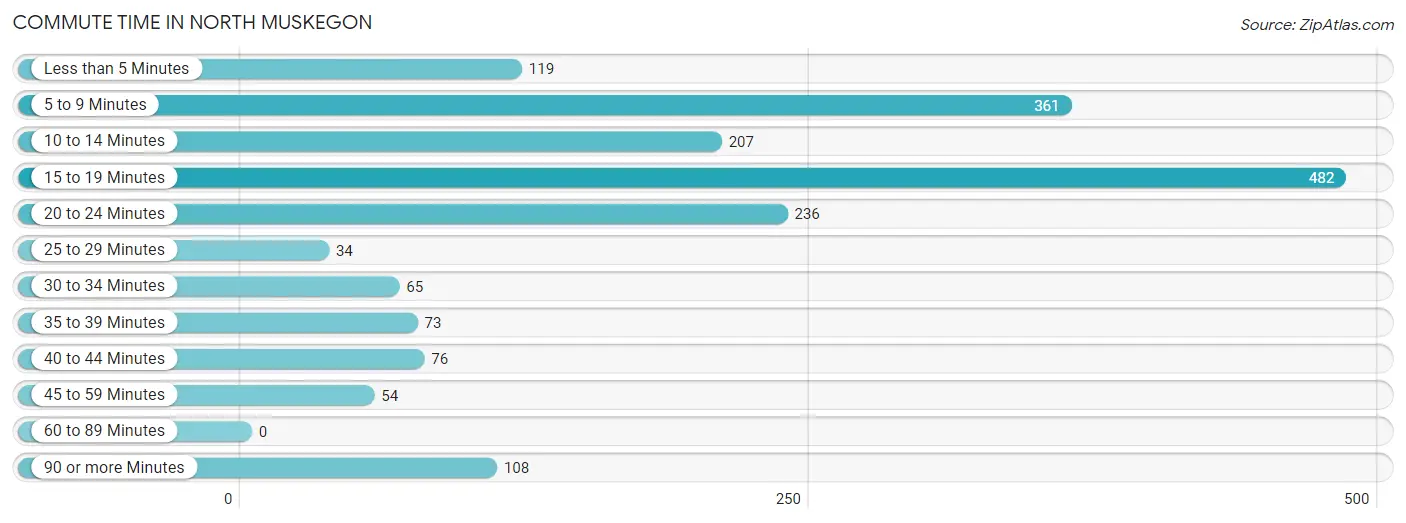
| Commute Time | # Commuters | % Commuters |
| Less than 5 Minutes | 119 | 6.6% |
| 5 to 9 Minutes | 361 | 19.9% |
| 10 to 14 Minutes | 207 | 11.4% |
| 15 to 19 Minutes | 482 | 26.6% |
| 20 to 24 Minutes | 236 | 13.0% |
| 25 to 29 Minutes | 34 | 1.9% |
| 30 to 34 Minutes | 65 | 3.6% |
| 35 to 39 Minutes | 73 | 4.0% |
| 40 to 44 Minutes | 76 | 4.2% |
| 45 to 59 Minutes | 54 | 3.0% |
| 60 to 89 Minutes | 0 | 0.0% |
| 90 or more Minutes | 108 | 5.9% |
Commute Time by Sex in North Muskegon
The most common commute times in North Muskegon are 15 to 19 minutes (264 commuters, 26.6%) for males and 15 to 19 minutes (218 commuters, 26.5%) for females.
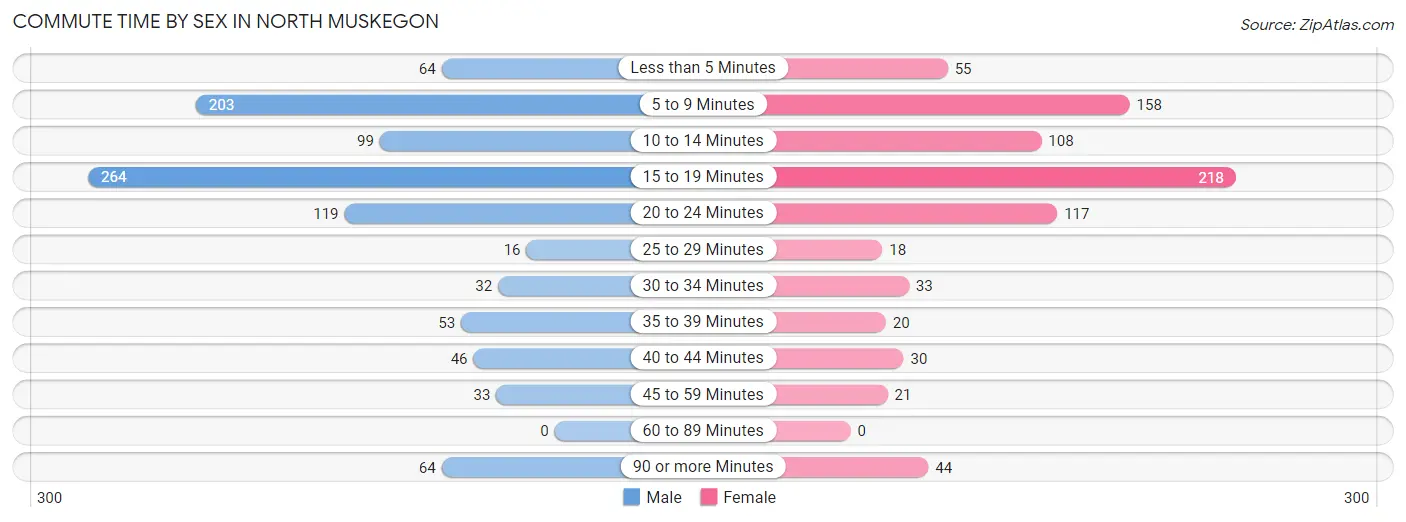
| Commute Time | Male | Female |
| Less than 5 Minutes | 64 (6.5%) | 55 (6.7%) |
| 5 to 9 Minutes | 203 (20.4%) | 158 (19.2%) |
| 10 to 14 Minutes | 99 (10.0%) | 108 (13.1%) |
| 15 to 19 Minutes | 264 (26.6%) | 218 (26.5%) |
| 20 to 24 Minutes | 119 (12.0%) | 117 (14.2%) |
| 25 to 29 Minutes | 16 (1.6%) | 18 (2.2%) |
| 30 to 34 Minutes | 32 (3.2%) | 33 (4.0%) |
| 35 to 39 Minutes | 53 (5.3%) | 20 (2.4%) |
| 40 to 44 Minutes | 46 (4.6%) | 30 (3.6%) |
| 45 to 59 Minutes | 33 (3.3%) | 21 (2.5%) |
| 60 to 89 Minutes | 0 (0.0%) | 0 (0.0%) |
| 90 or more Minutes | 64 (6.5%) | 44 (5.3%) |
Time of Departure to Work by Sex in North Muskegon
The most frequent times of departure to work in North Muskegon are 8:30 AM to 8:59 AM (184, 18.5%) for males and 6:30 AM to 6:59 AM (129, 15.7%) for females.
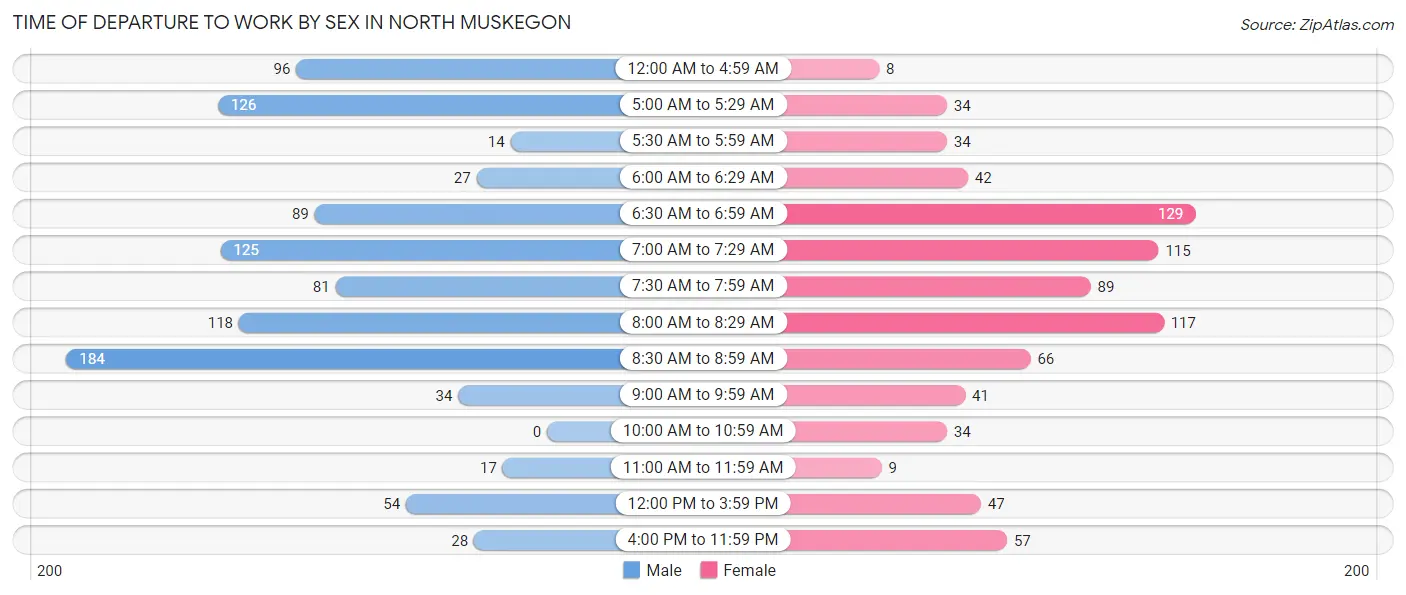
| Time of Departure | Male | Female |
| 12:00 AM to 4:59 AM | 96 (9.7%) | 8 (1.0%) |
| 5:00 AM to 5:29 AM | 126 (12.7%) | 34 (4.1%) |
| 5:30 AM to 5:59 AM | 14 (1.4%) | 34 (4.1%) |
| 6:00 AM to 6:29 AM | 27 (2.7%) | 42 (5.1%) |
| 6:30 AM to 6:59 AM | 89 (9.0%) | 129 (15.7%) |
| 7:00 AM to 7:29 AM | 125 (12.6%) | 115 (14.0%) |
| 7:30 AM to 7:59 AM | 81 (8.2%) | 89 (10.8%) |
| 8:00 AM to 8:29 AM | 118 (11.9%) | 117 (14.2%) |
| 8:30 AM to 8:59 AM | 184 (18.5%) | 66 (8.0%) |
| 9:00 AM to 9:59 AM | 34 (3.4%) | 41 (5.0%) |
| 10:00 AM to 10:59 AM | 0 (0.0%) | 34 (4.1%) |
| 11:00 AM to 11:59 AM | 17 (1.7%) | 9 (1.1%) |
| 12:00 PM to 3:59 PM | 54 (5.4%) | 47 (5.7%) |
| 4:00 PM to 11:59 PM | 28 (2.8%) | 57 (6.9%) |
| Total | 993 (100.0%) | 822 (100.0%) |
Housing Occupancy in North Muskegon
Occupancy by Ownership in North Muskegon
Of the total 1,580 dwellings in North Muskegon, owner-occupied units account for 1,274 (80.6%), while renter-occupied units make up 306 (19.4%).
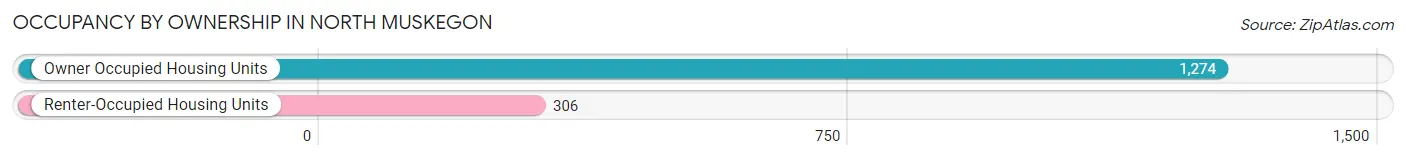
| Occupancy | # Housing Units | % Housing Units |
| Owner Occupied Housing Units | 1,274 | 80.6% |
| Renter-Occupied Housing Units | 306 | 19.4% |
| Total Occupied Housing Units | 1,580 | 100.0% |
Occupancy by Household Size in North Muskegon
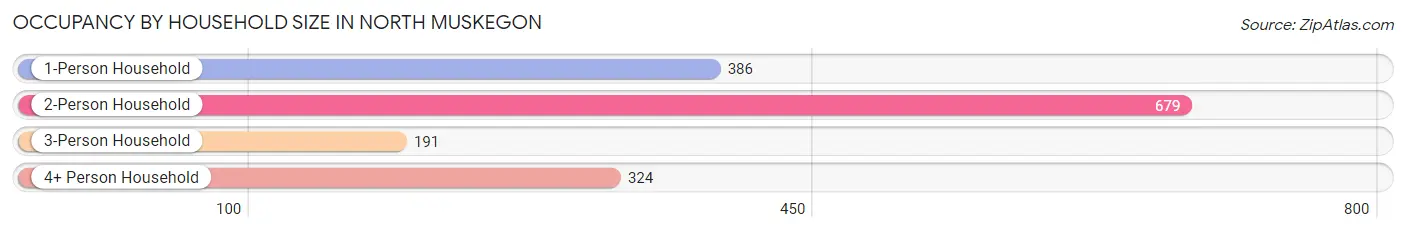
| Household Size | # Housing Units | % Housing Units |
| 1-Person Household | 386 | 24.4% |
| 2-Person Household | 679 | 43.0% |
| 3-Person Household | 191 | 12.1% |
| 4+ Person Household | 324 | 20.5% |
| Total Housing Units | 1,580 | 100.0% |
Occupancy by Ownership by Household Size in North Muskegon
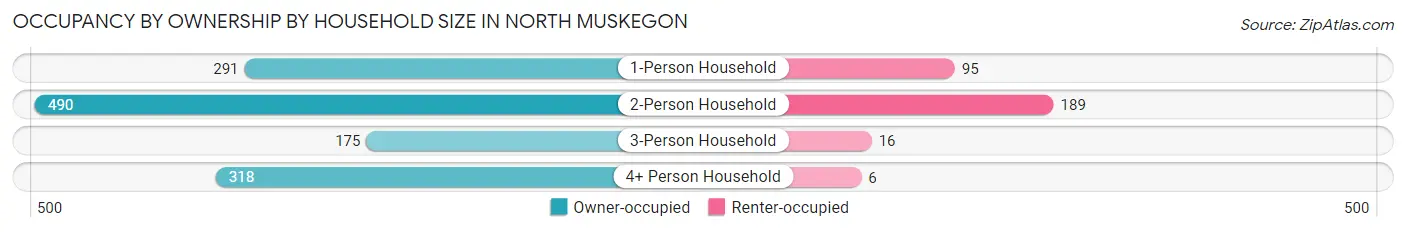
| Household Size | Owner-occupied | Renter-occupied |
| 1-Person Household | 291 (75.4%) | 95 (24.6%) |
| 2-Person Household | 490 (72.2%) | 189 (27.8%) |
| 3-Person Household | 175 (91.6%) | 16 (8.4%) |
| 4+ Person Household | 318 (98.2%) | 6 (1.8%) |
| Total Housing Units | 1,274 (80.6%) | 306 (19.4%) |
Occupancy by Educational Attainment in North Muskegon
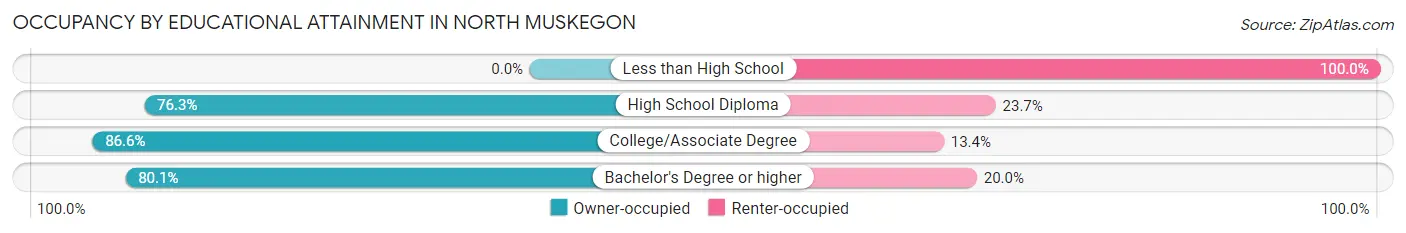
| Household Size | Owner-occupied | Renter-occupied |
| Less than High School | 0 (0.0%) | 18 (100.0%) |
| High School Diploma | 174 (76.3%) | 54 (23.7%) |
| College/Associate Degree | 426 (86.6%) | 66 (13.4%) |
| Bachelor's Degree or higher | 674 (80.0%) | 168 (20.0%) |
Occupancy by Age of Householder in North Muskegon
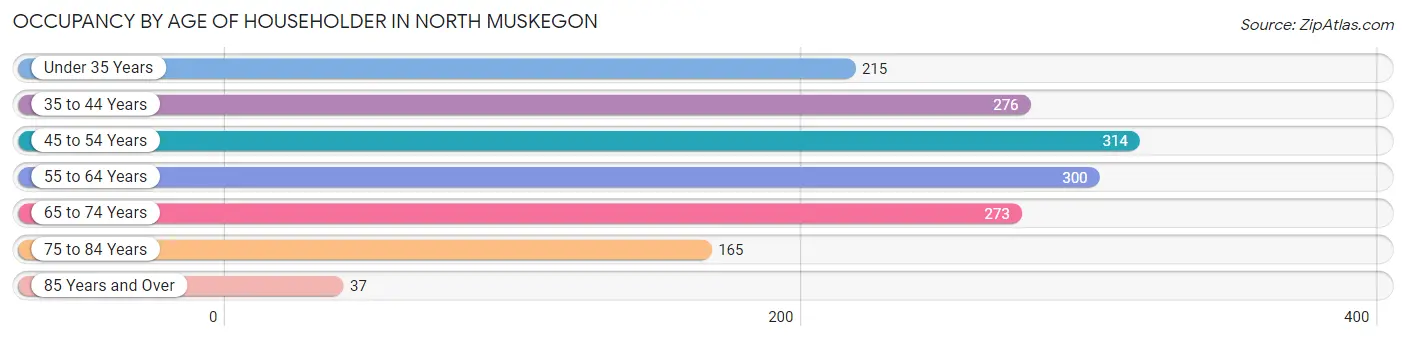
| Age Bracket | # Households | % Households |
| Under 35 Years | 215 | 13.6% |
| 35 to 44 Years | 276 | 17.5% |
| 45 to 54 Years | 314 | 19.9% |
| 55 to 64 Years | 300 | 19.0% |
| 65 to 74 Years | 273 | 17.3% |
| 75 to 84 Years | 165 | 10.4% |
| 85 Years and Over | 37 | 2.3% |
| Total | 1,580 | 100.0% |
Housing Finances in North Muskegon
Median Income by Occupancy in North Muskegon
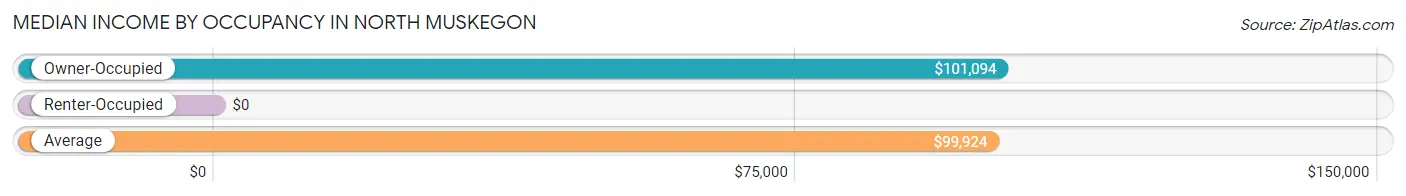
| Occupancy Type | # Households | Median Income |
| Owner-Occupied | 1,274 (80.6%) | $101,094 |
| Renter-Occupied | 306 (19.4%) | $0 |
| Average | 1,580 (100.0%) | $99,924 |
Occupancy by Householder Income Bracket in North Muskegon
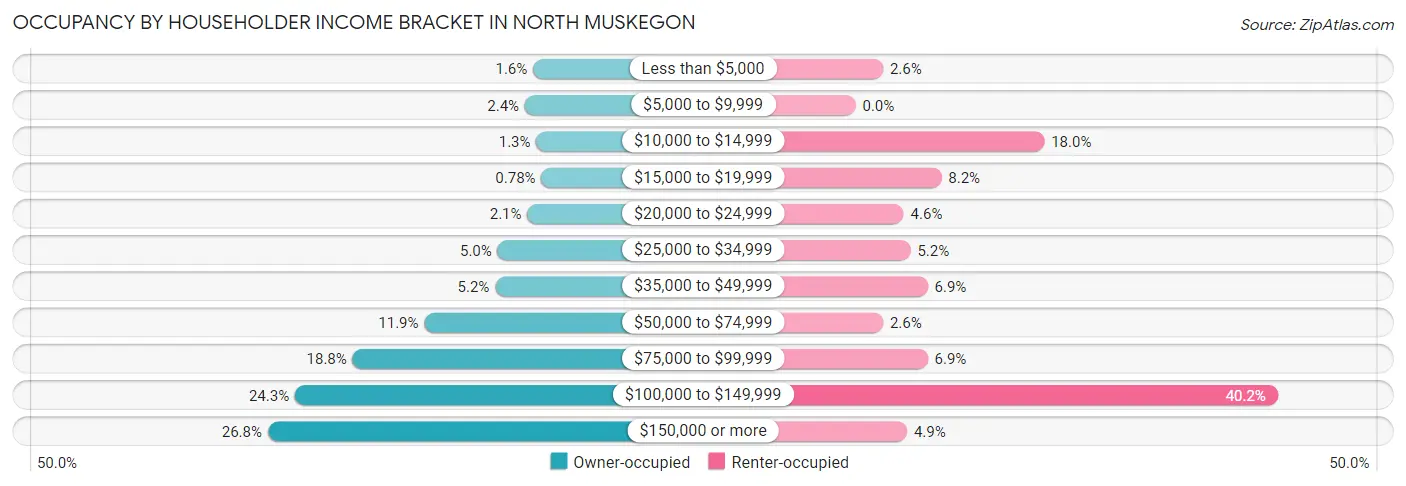
| Income Bracket | Owner-occupied | Renter-occupied |
| Less than $5,000 | 20 (1.6%) | 8 (2.6%) |
| $5,000 to $9,999 | 30 (2.4%) | 0 (0.0%) |
| $10,000 to $14,999 | 16 (1.3%) | 55 (18.0%) |
| $15,000 to $19,999 | 10 (0.8%) | 25 (8.2%) |
| $20,000 to $24,999 | 27 (2.1%) | 14 (4.6%) |
| $25,000 to $34,999 | 63 (5.0%) | 16 (5.2%) |
| $35,000 to $49,999 | 66 (5.2%) | 21 (6.9%) |
| $50,000 to $74,999 | 152 (11.9%) | 8 (2.6%) |
| $75,000 to $99,999 | 239 (18.8%) | 21 (6.9%) |
| $100,000 to $149,999 | 309 (24.2%) | 123 (40.2%) |
| $150,000 or more | 342 (26.8%) | 15 (4.9%) |
| Total | 1,274 (100.0%) | 306 (100.0%) |
Monthly Housing Cost Tiers in North Muskegon
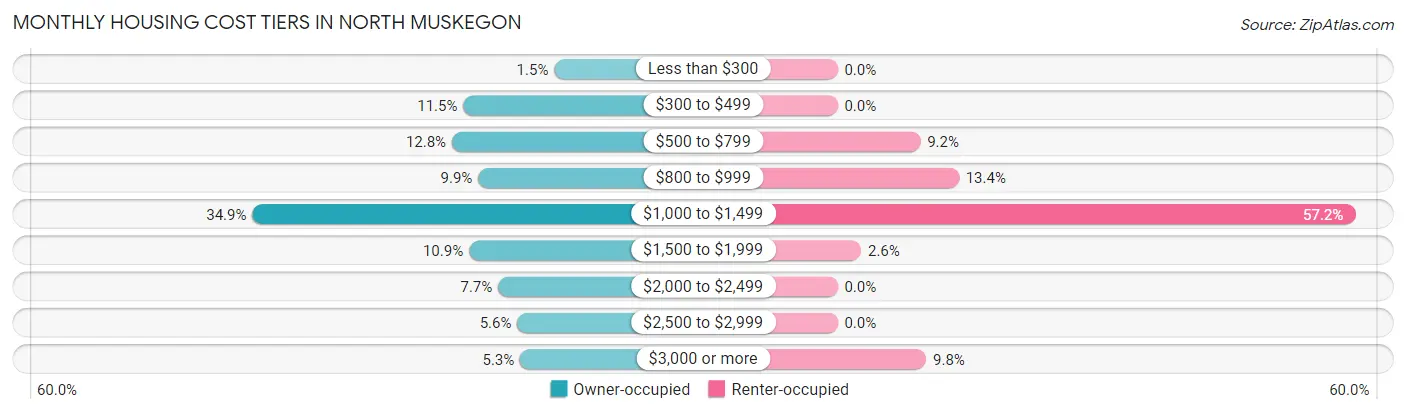
| Monthly Cost | Owner-occupied | Renter-occupied |
| Less than $300 | 19 (1.5%) | 0 (0.0%) |
| $300 to $499 | 147 (11.5%) | 0 (0.0%) |
| $500 to $799 | 163 (12.8%) | 28 (9.1%) |
| $800 to $999 | 126 (9.9%) | 41 (13.4%) |
| $1,000 to $1,499 | 444 (34.8%) | 175 (57.2%) |
| $1,500 to $1,999 | 139 (10.9%) | 8 (2.6%) |
| $2,000 to $2,499 | 98 (7.7%) | 0 (0.0%) |
| $2,500 to $2,999 | 71 (5.6%) | 0 (0.0%) |
| $3,000 or more | 67 (5.3%) | 30 (9.8%) |
| Total | 1,274 (100.0%) | 306 (100.0%) |
Physical Housing Characteristics in North Muskegon
Housing Structures in North Muskegon
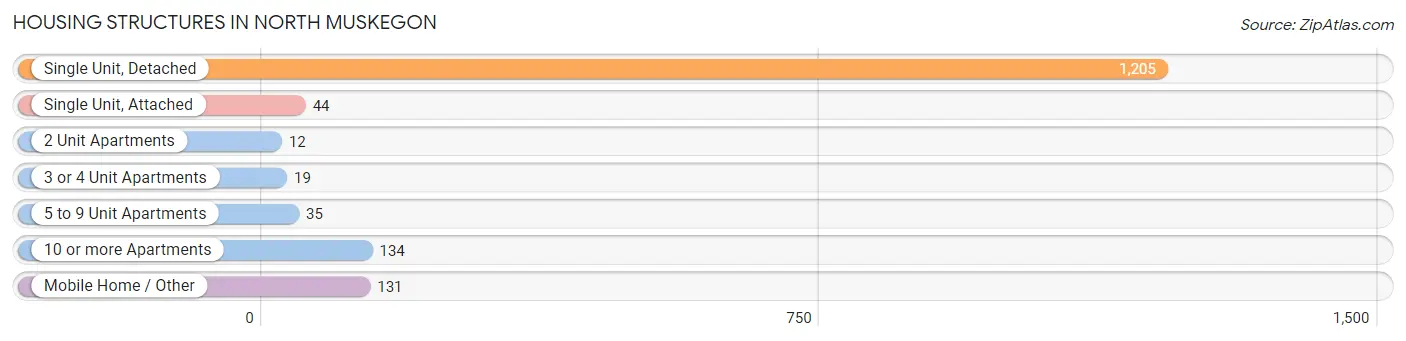
| Structure Type | # Housing Units | % Housing Units |
| Single Unit, Detached | 1,205 | 76.3% |
| Single Unit, Attached | 44 | 2.8% |
| 2 Unit Apartments | 12 | 0.8% |
| 3 or 4 Unit Apartments | 19 | 1.2% |
| 5 to 9 Unit Apartments | 35 | 2.2% |
| 10 or more Apartments | 134 | 8.5% |
| Mobile Home / Other | 131 | 8.3% |
| Total | 1,580 | 100.0% |
Housing Structures by Occupancy in North Muskegon
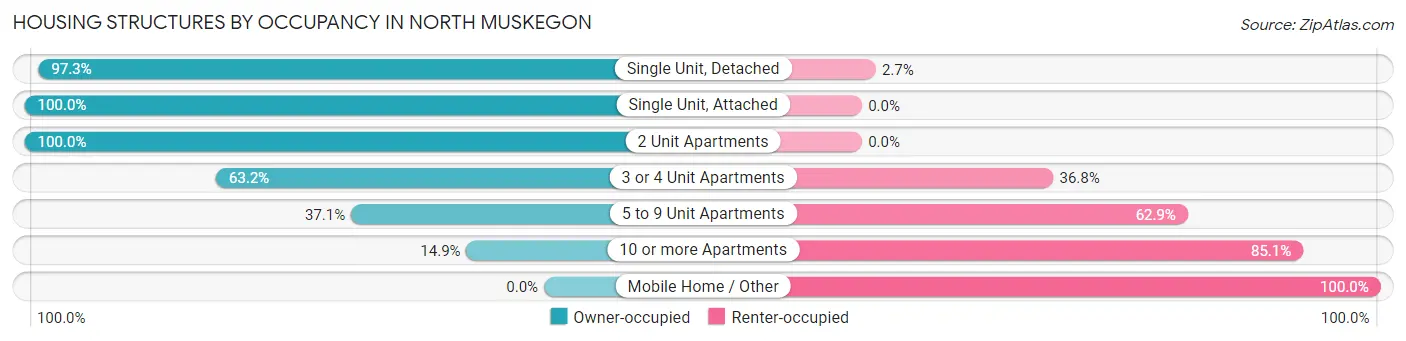
| Structure Type | Owner-occupied | Renter-occupied |
| Single Unit, Detached | 1,173 (97.3%) | 32 (2.7%) |
| Single Unit, Attached | 44 (100.0%) | 0 (0.0%) |
| 2 Unit Apartments | 12 (100.0%) | 0 (0.0%) |
| 3 or 4 Unit Apartments | 12 (63.2%) | 7 (36.8%) |
| 5 to 9 Unit Apartments | 13 (37.1%) | 22 (62.9%) |
| 10 or more Apartments | 20 (14.9%) | 114 (85.1%) |
| Mobile Home / Other | 0 (0.0%) | 131 (100.0%) |
| Total | 1,274 (80.6%) | 306 (19.4%) |
Housing Structures by Number of Rooms in North Muskegon
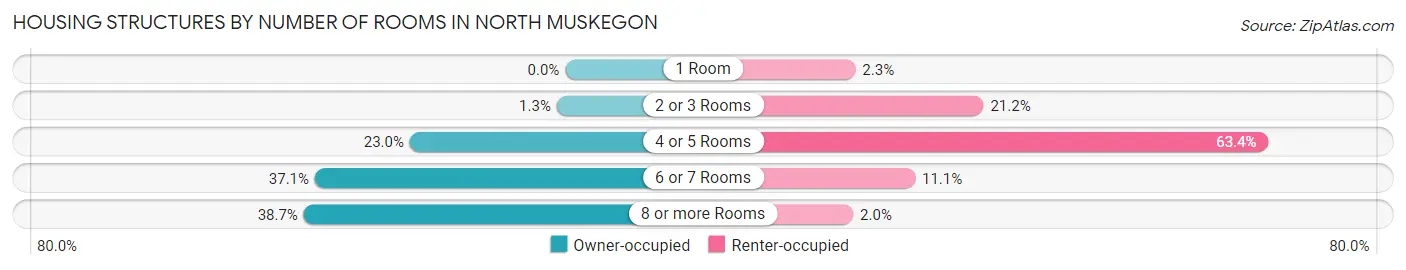
| Number of Rooms | Owner-occupied | Renter-occupied |
| 1 Room | 0 (0.0%) | 7 (2.3%) |
| 2 or 3 Rooms | 16 (1.3%) | 65 (21.2%) |
| 4 or 5 Rooms | 293 (23.0%) | 194 (63.4%) |
| 6 or 7 Rooms | 472 (37.0%) | 34 (11.1%) |
| 8 or more Rooms | 493 (38.7%) | 6 (2.0%) |
| Total | 1,274 (100.0%) | 306 (100.0%) |
Housing Structure by Heating Type in North Muskegon
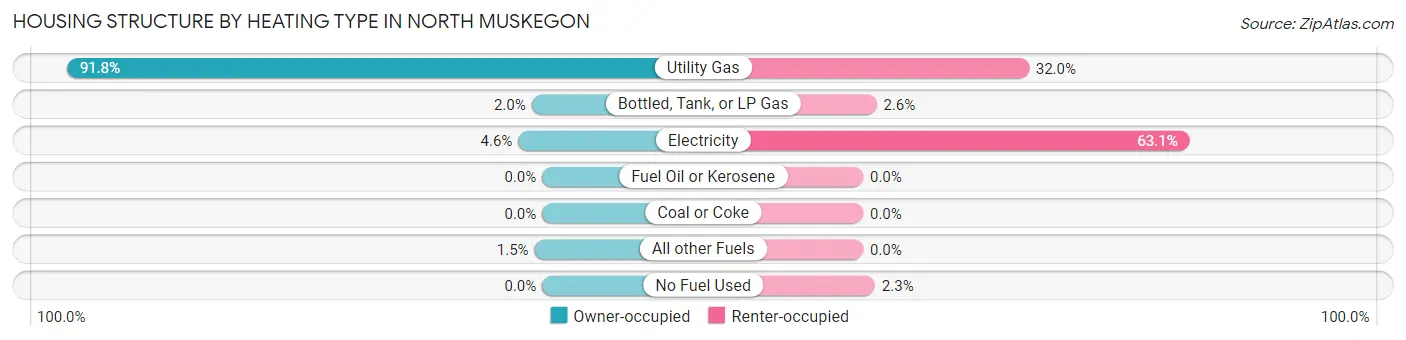
| Heating Type | Owner-occupied | Renter-occupied |
| Utility Gas | 1,170 (91.8%) | 98 (32.0%) |
| Bottled, Tank, or LP Gas | 26 (2.0%) | 8 (2.6%) |
| Electricity | 59 (4.6%) | 193 (63.1%) |
| Fuel Oil or Kerosene | 0 (0.0%) | 0 (0.0%) |
| Coal or Coke | 0 (0.0%) | 0 (0.0%) |
| All other Fuels | 19 (1.5%) | 0 (0.0%) |
| No Fuel Used | 0 (0.0%) | 7 (2.3%) |
| Total | 1,274 (100.0%) | 306 (100.0%) |
Household Vehicle Usage in North Muskegon
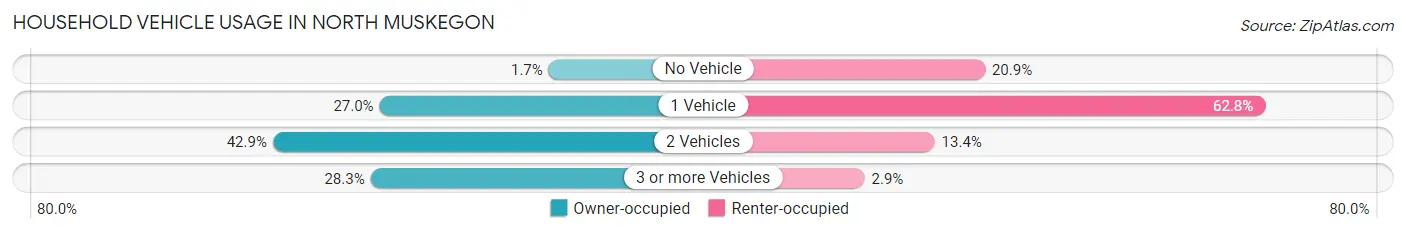
| Vehicles per Household | Owner-occupied | Renter-occupied |
| No Vehicle | 22 (1.7%) | 64 (20.9%) |
| 1 Vehicle | 344 (27.0%) | 192 (62.7%) |
| 2 Vehicles | 547 (42.9%) | 41 (13.4%) |
| 3 or more Vehicles | 361 (28.3%) | 9 (2.9%) |
| Total | 1,274 (100.0%) | 306 (100.0%) |
Real Estate & Mortgages in North Muskegon
Real Estate and Mortgage Overview in North Muskegon
| Characteristic | Without Mortgage | With Mortgage |
| Housing Units | 507 | 767 |
| Median Property Value | $255,400 | $213,500 |
| Median Household Income | $86,211 | $221 |
| Monthly Housing Costs | $684 | $67 |
| Real Estate Taxes | $3,574 | $0 |
Property Value by Mortgage Status in North Muskegon
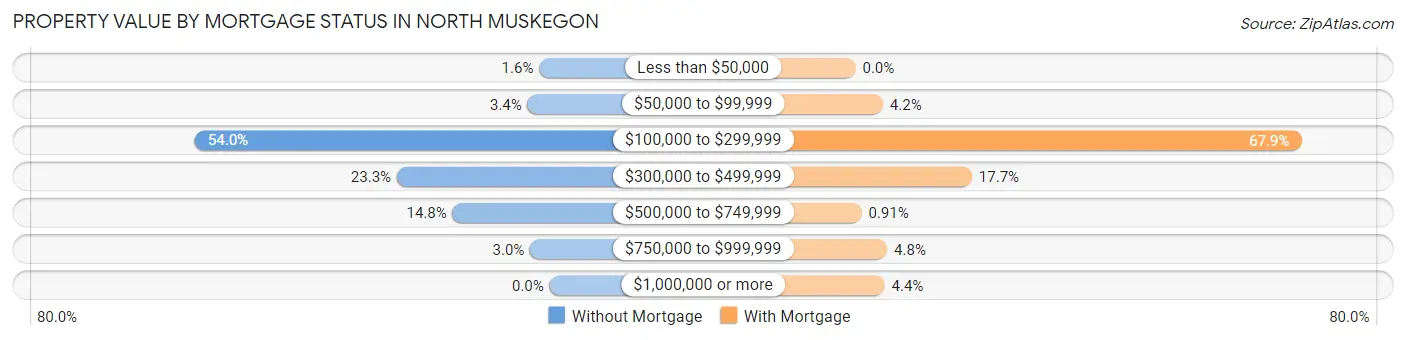
| Property Value | Without Mortgage | With Mortgage |
| Less than $50,000 | 8 (1.6%) | 0 (0.0%) |
| $50,000 to $99,999 | 17 (3.4%) | 32 (4.2%) |
| $100,000 to $299,999 | 274 (54.0%) | 521 (67.9%) |
| $300,000 to $499,999 | 118 (23.3%) | 136 (17.7%) |
| $500,000 to $749,999 | 75 (14.8%) | 7 (0.9%) |
| $750,000 to $999,999 | 15 (3.0%) | 37 (4.8%) |
| $1,000,000 or more | 0 (0.0%) | 34 (4.4%) |
| Total | 507 (100.0%) | 767 (100.0%) |
Household Income by Mortgage Status in North Muskegon
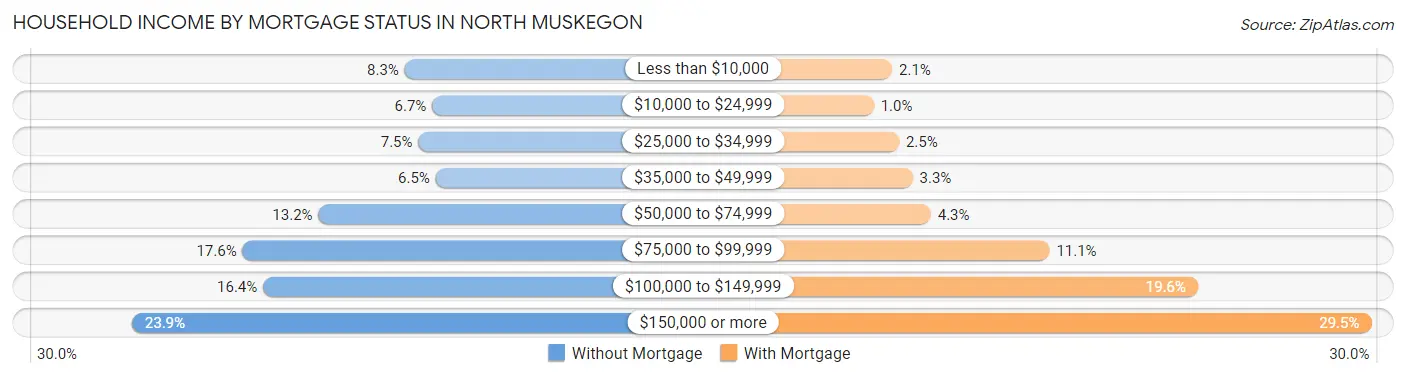
| Household Income | Without Mortgage | With Mortgage |
| Less than $10,000 | 42 (8.3%) | 16 (2.1%) |
| $10,000 to $24,999 | 34 (6.7%) | 8 (1.0%) |
| $25,000 to $34,999 | 38 (7.5%) | 19 (2.5%) |
| $35,000 to $49,999 | 33 (6.5%) | 25 (3.3%) |
| $50,000 to $74,999 | 67 (13.2%) | 33 (4.3%) |
| $75,000 to $99,999 | 89 (17.5%) | 85 (11.1%) |
| $100,000 to $149,999 | 83 (16.4%) | 150 (19.6%) |
| $150,000 or more | 121 (23.9%) | 226 (29.5%) |
| Total | 507 (100.0%) | 767 (100.0%) |
Property Value to Household Income Ratio in North Muskegon
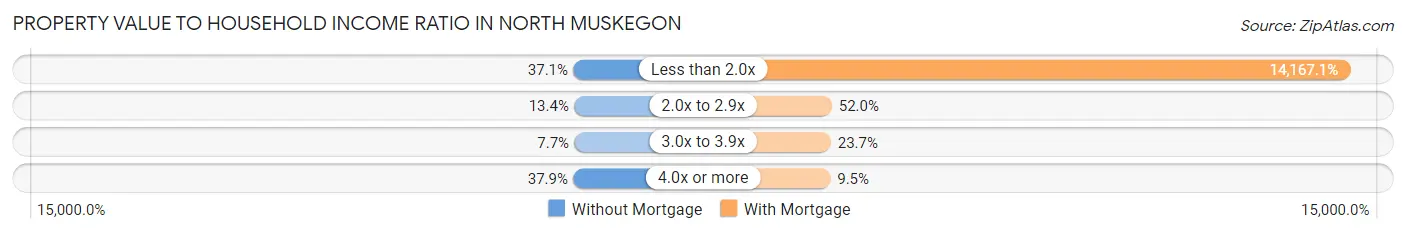
| Value-to-Income Ratio | Without Mortgage | With Mortgage |
| Less than 2.0x | 188 (37.1%) | 108,662 (14,167.1%) |
| 2.0x to 2.9x | 68 (13.4%) | 399 (52.0%) |
| 3.0x to 3.9x | 39 (7.7%) | 182 (23.7%) |
| 4.0x or more | 192 (37.9%) | 73 (9.5%) |
| Total | 507 (100.0%) | 767 (100.0%) |
Real Estate Taxes by Mortgage Status in North Muskegon
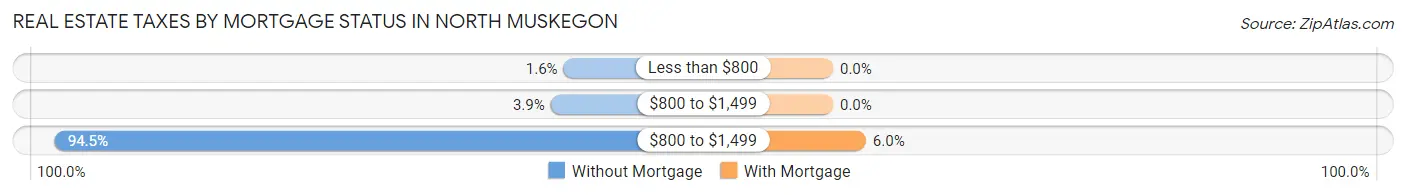
| Property Taxes | Without Mortgage | With Mortgage |
| Less than $800 | 8 (1.6%) | 0 (0.0%) |
| $800 to $1,499 | 20 (3.9%) | 0 (0.0%) |
| $800 to $1,499 | 479 (94.5%) | 46 (6.0%) |
| Total | 507 (100.0%) | 767 (100.0%) |
Health & Disability in North Muskegon
Health Insurance Coverage by Age in North Muskegon
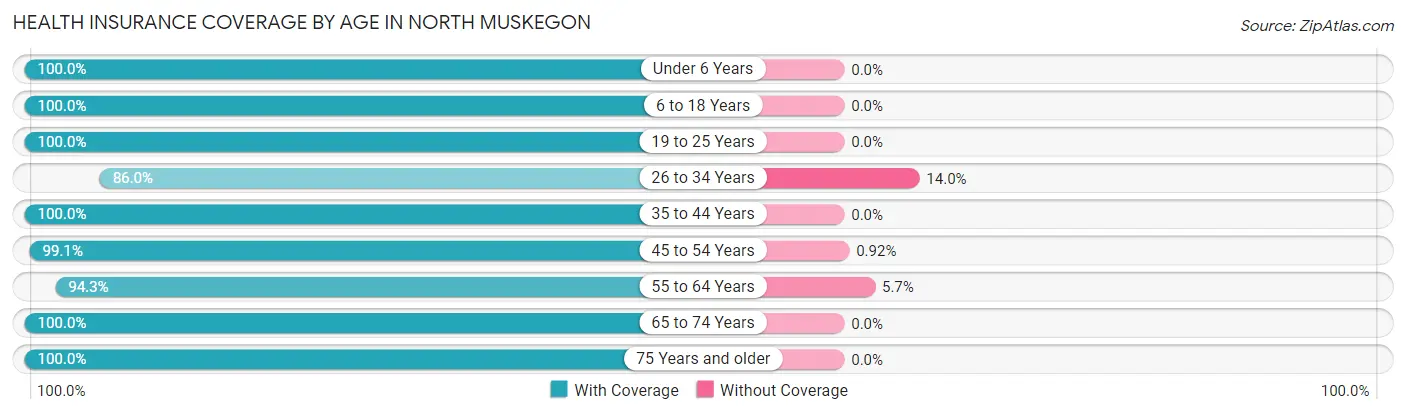
| Age Bracket | With Coverage | Without Coverage |
| Under 6 Years | 209 (100.0%) | 0 (0.0%) |
| 6 to 18 Years | 894 (100.0%) | 0 (0.0%) |
| 19 to 25 Years | 244 (100.0%) | 0 (0.0%) |
| 26 to 34 Years | 270 (86.0%) | 44 (14.0%) |
| 35 to 44 Years | 443 (100.0%) | 0 (0.0%) |
| 45 to 54 Years | 647 (99.1%) | 6 (0.9%) |
| 55 to 64 Years | 461 (94.3%) | 28 (5.7%) |
| 65 to 74 Years | 477 (100.0%) | 0 (0.0%) |
| 75 Years and older | 315 (100.0%) | 0 (0.0%) |
| Total | 3,960 (98.1%) | 78 (1.9%) |
Health Insurance Coverage by Citizenship Status in North Muskegon
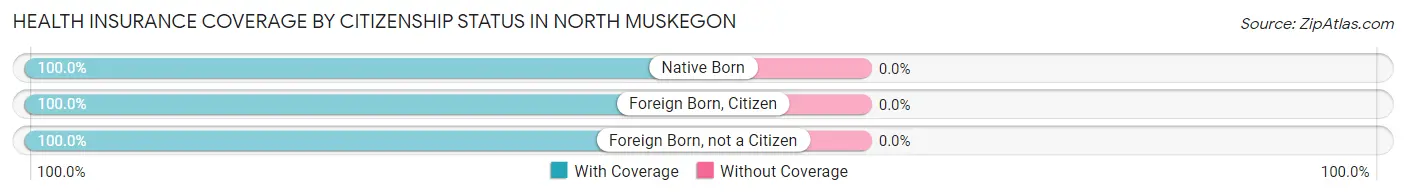
| Citizenship Status | With Coverage | Without Coverage |
| Native Born | 209 (100.0%) | 0 (0.0%) |
| Foreign Born, Citizen | 894 (100.0%) | 0 (0.0%) |
| Foreign Born, not a Citizen | 244 (100.0%) | 0 (0.0%) |
Health Insurance Coverage by Household Income in North Muskegon
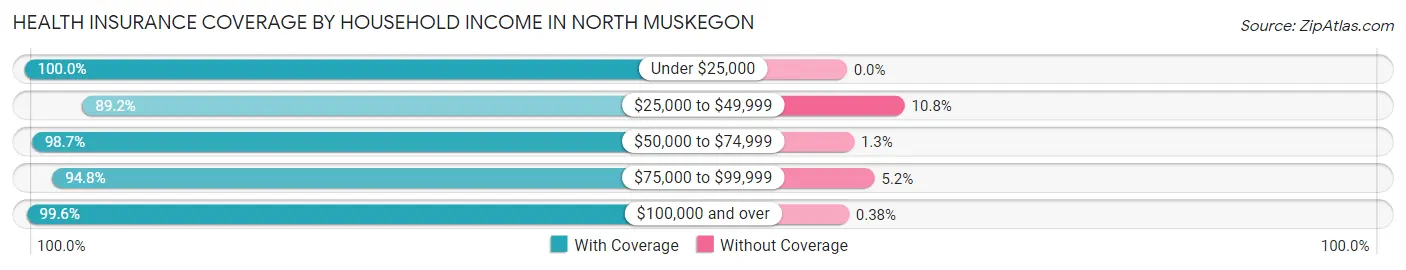
| Household Income | With Coverage | Without Coverage |
| Under $25,000 | 277 (100.0%) | 0 (0.0%) |
| $25,000 to $49,999 | 222 (89.2%) | 27 (10.8%) |
| $50,000 to $74,999 | 442 (98.7%) | 6 (1.3%) |
| $75,000 to $99,999 | 656 (94.8%) | 36 (5.2%) |
| $100,000 and over | 2,334 (99.6%) | 9 (0.4%) |
Public vs Private Health Insurance Coverage by Age in North Muskegon
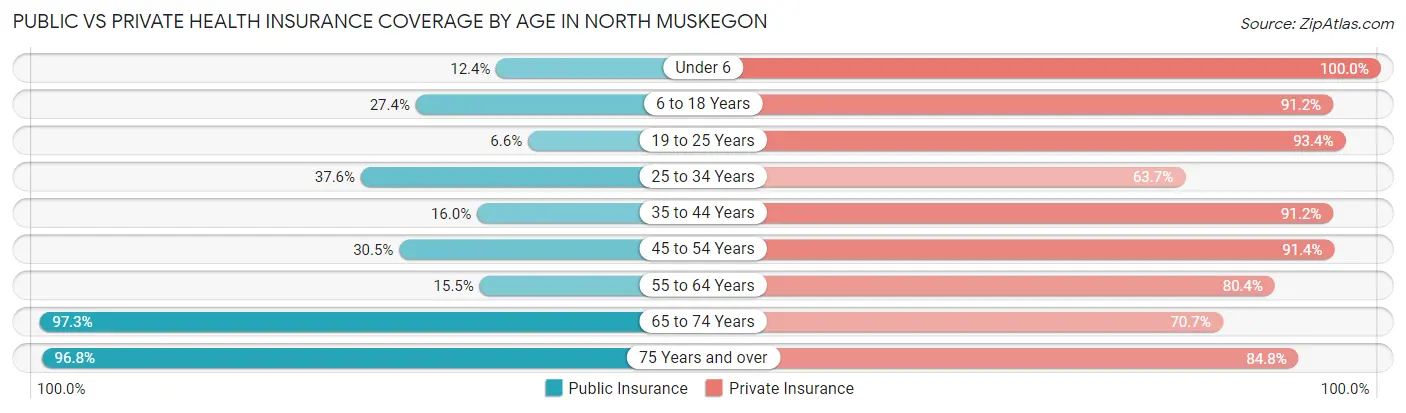
| Age Bracket | Public Insurance | Private Insurance |
| Under 6 | 26 (12.4%) | 209 (100.0%) |
| 6 to 18 Years | 245 (27.4%) | 815 (91.2%) |
| 19 to 25 Years | 16 (6.6%) | 228 (93.4%) |
| 25 to 34 Years | 118 (37.6%) | 200 (63.7%) |
| 35 to 44 Years | 71 (16.0%) | 404 (91.2%) |
| 45 to 54 Years | 199 (30.5%) | 597 (91.4%) |
| 55 to 64 Years | 76 (15.5%) | 393 (80.4%) |
| 65 to 74 Years | 464 (97.3%) | 337 (70.7%) |
| 75 Years and over | 305 (96.8%) | 267 (84.8%) |
| Total | 1,520 (37.6%) | 3,450 (85.4%) |
Disability Status by Sex by Age in North Muskegon
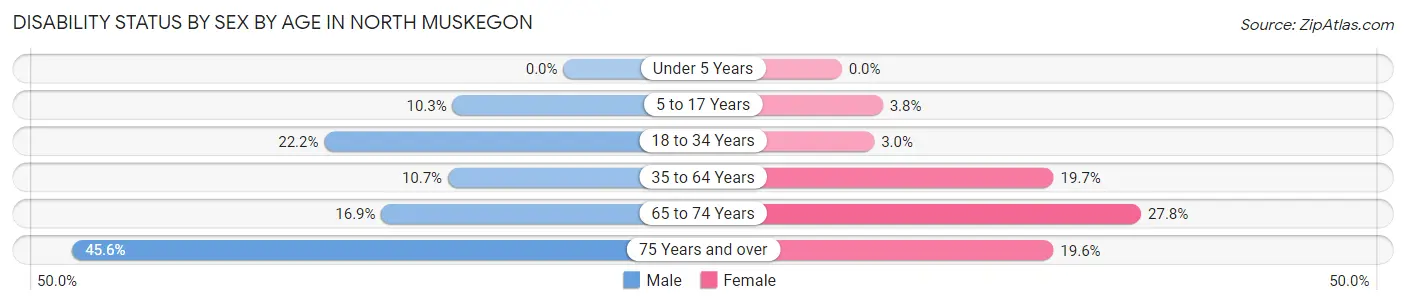
| Age Bracket | Male | Female |
| Under 5 Years | 0 (0.0%) | 0 (0.0%) |
| 5 to 17 Years | 47 (10.3%) | 15 (3.8%) |
| 18 to 34 Years | 73 (22.2%) | 10 (3.0%) |
| 35 to 64 Years | 88 (10.7%) | 150 (19.7%) |
| 65 to 74 Years | 38 (16.9%) | 70 (27.8%) |
| 75 Years and over | 67 (45.6%) | 33 (19.6%) |
Disability Class by Sex by Age in North Muskegon
Disability Class: Hearing Difficulty
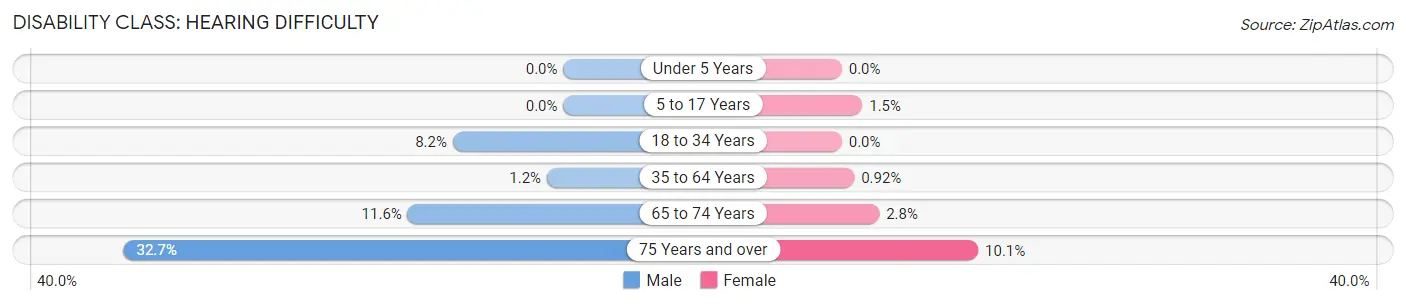
| Age Bracket | Male | Female |
| Under 5 Years | 0 (0.0%) | 0 (0.0%) |
| 5 to 17 Years | 0 (0.0%) | 6 (1.5%) |
| 18 to 34 Years | 27 (8.2%) | 0 (0.0%) |
| 35 to 64 Years | 10 (1.2%) | 7 (0.9%) |
| 65 to 74 Years | 26 (11.6%) | 7 (2.8%) |
| 75 Years and over | 48 (32.7%) | 17 (10.1%) |
Disability Class: Vision Difficulty
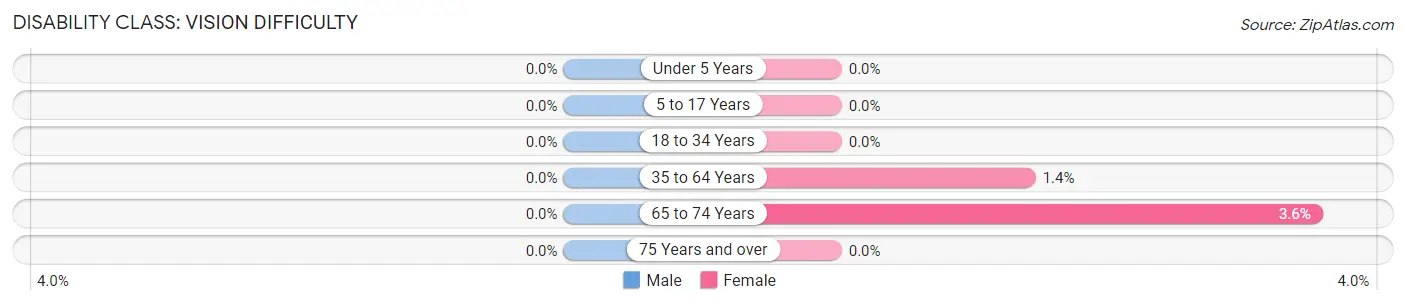
| Age Bracket | Male | Female |
| Under 5 Years | 0 (0.0%) | 0 (0.0%) |
| 5 to 17 Years | 0 (0.0%) | 0 (0.0%) |
| 18 to 34 Years | 0 (0.0%) | 0 (0.0%) |
| 35 to 64 Years | 0 (0.0%) | 11 (1.4%) |
| 65 to 74 Years | 0 (0.0%) | 9 (3.6%) |
| 75 Years and over | 0 (0.0%) | 0 (0.0%) |
Disability Class: Cognitive Difficulty
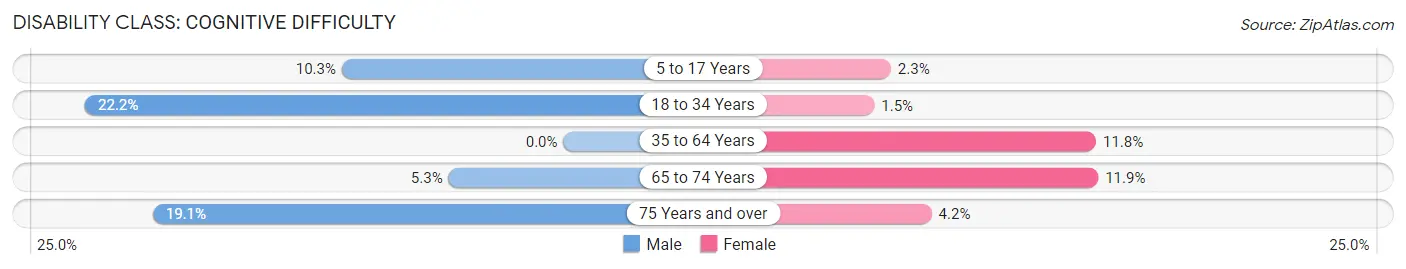
| Age Bracket | Male | Female |
| 5 to 17 Years | 47 (10.3%) | 9 (2.3%) |
| 18 to 34 Years | 73 (22.2%) | 5 (1.5%) |
| 35 to 64 Years | 0 (0.0%) | 90 (11.8%) |
| 65 to 74 Years | 12 (5.3%) | 30 (11.9%) |
| 75 Years and over | 28 (19.1%) | 7 (4.2%) |
Disability Class: Ambulatory Difficulty
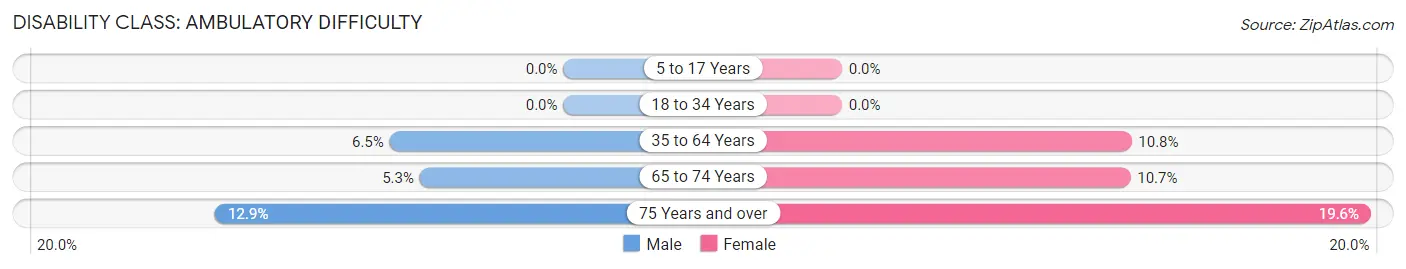
| Age Bracket | Male | Female |
| 5 to 17 Years | 0 (0.0%) | 0 (0.0%) |
| 18 to 34 Years | 0 (0.0%) | 0 (0.0%) |
| 35 to 64 Years | 53 (6.5%) | 82 (10.7%) |
| 65 to 74 Years | 12 (5.3%) | 27 (10.7%) |
| 75 Years and over | 19 (12.9%) | 33 (19.6%) |
Disability Class: Self-Care Difficulty
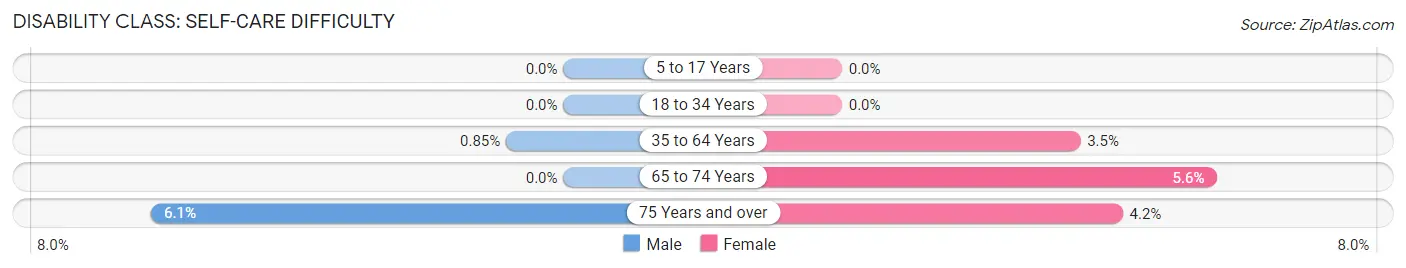
| Age Bracket | Male | Female |
| 5 to 17 Years | 0 (0.0%) | 0 (0.0%) |
| 18 to 34 Years | 0 (0.0%) | 0 (0.0%) |
| 35 to 64 Years | 7 (0.9%) | 27 (3.5%) |
| 65 to 74 Years | 0 (0.0%) | 14 (5.6%) |
| 75 Years and over | 9 (6.1%) | 7 (4.2%) |
Technology Access in North Muskegon
Computing Device Access in North Muskegon
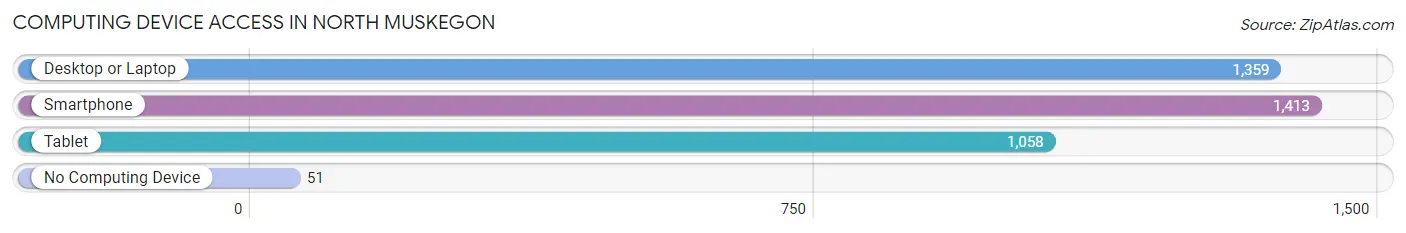
| Device Type | # Households | % Households |
| Desktop or Laptop | 1,359 | 86.0% |
| Smartphone | 1,413 | 89.4% |
| Tablet | 1,058 | 67.0% |
| No Computing Device | 51 | 3.2% |
| Total | 1,580 | 100.0% |
Internet Access in North Muskegon
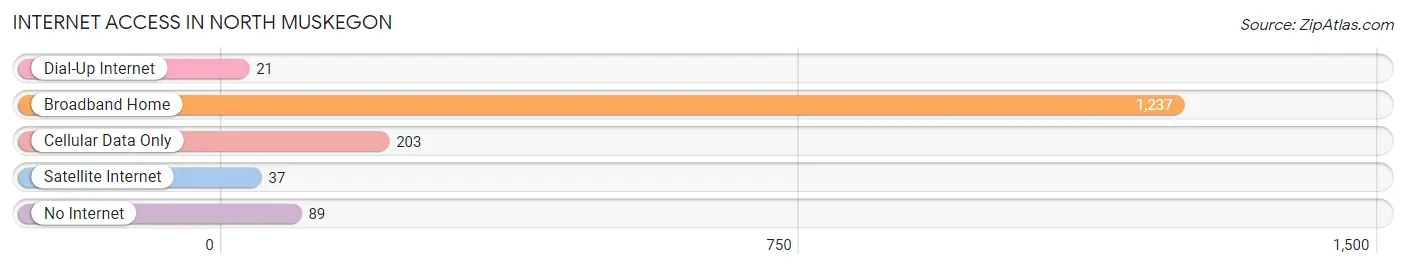
| Internet Type | # Households | % Households |
| Dial-Up Internet | 21 | 1.3% |
| Broadband Home | 1,237 | 78.3% |
| Cellular Data Only | 203 | 12.9% |
| Satellite Internet | 37 | 2.3% |
| No Internet | 89 | 5.6% |
| Total | 1,580 | 100.0% |
North Muskegon Summary
History
North Muskegon is a city located in Muskegon County, Michigan. It is situated on the shores of Lake Michigan and is part of the larger Muskegon metropolitan area. The city was first settled in 1837 by a group of settlers from New York. The city was originally known as Muskegon Heights, but was later changed to North Muskegon in 1891.
The city was incorporated in 1891 and has since grown to a population of over 4,000 people. The city is home to a variety of businesses, including manufacturing, retail, and tourism. The city is also home to a number of parks and recreational areas, including the Muskegon State Park, which is located on the shores of Lake Michigan.
Geography
North Muskegon is located in Muskegon County, Michigan. It is situated on the shores of Lake Michigan and is part of the larger Muskegon metropolitan area. The city is located at the intersection of US-31 and M-120. The city is bordered by Muskegon Heights to the south, Norton Shores to the east, and Fruitport Township to the west.
The city has a total area of 4.2 square miles, all of which is land. The city is located at an elevation of 602 feet above sea level. The city has a humid continental climate, with cold winters and warm summers.
Economy
North Muskegon is home to a variety of businesses, including manufacturing, retail, and tourism. The city is home to a number of manufacturing companies, including the Muskegon Manufacturing Company, which produces a variety of products, including furniture, automotive parts, and industrial equipment. The city is also home to a number of retail stores, including grocery stores, clothing stores, and home improvement stores.
The city is also home to a number of tourist attractions, including the Muskegon State Park, which is located on the shores of Lake Michigan. The park offers a variety of activities, including camping, fishing, swimming, and boating. The city is also home to a number of museums, including the Muskegon Museum of Art and the Muskegon Heritage Museum.
Demographics
As of the 2010 census, North Muskegon had a population of 4,072 people. The racial makeup of the city was 94.3% White, 1.3% African American, 0.4% Native American, 0.7% Asian, 0.1% Pacific Islander, 1.2% from other races, and 2.1% from two or more races. Hispanic or Latino of any race were 3.2% of the population.
The median household income in North Muskegon was $41,944, and the median family income was $50,917. The per capita income for the city was $20,945. About 11.2% of families and 14.2% of the population were below the poverty line, including 22.2% of those under age 18 and 8.2% of those age 65 or over.
Common Questions
What is Per Capita Income in North Muskegon?
Per Capita income in North Muskegon is $50,859.
What is the Median Family Income in North Muskegon?
Median Family Income in North Muskegon is $123,563.
What is the Median Household income in North Muskegon?
Median Household Income in North Muskegon is $99,924.
What is Income or Wage Gap in North Muskegon?
Income or Wage Gap in North Muskegon is 31.6%.
Women in North Muskegon earn 68.4 cents for every dollar earned by a man.
What is Inequality or Gini Index in North Muskegon?
Inequality or Gini Index in North Muskegon is 0.45.
What is the Total Population of North Muskegon?
Total Population of North Muskegon is 4,076.
What is the Total Male Population of North Muskegon?
Total Male Population of North Muskegon is 2,017.
What is the Total Female Population of North Muskegon?
Total Female Population of North Muskegon is 2,059.
What is the Ratio of Males per 100 Females in North Muskegon?
There are 97.96 Males per 100 Females in North Muskegon.
What is the Ratio of Females per 100 Males in North Muskegon?
There are 102.08 Females per 100 Males in North Muskegon.
What is the Median Population Age in North Muskegon?
Median Population Age in North Muskegon is 43.2 Years.
What is the Average Family Size in North Muskegon
Average Family Size in North Muskegon is 3.0 People.
What is the Average Household Size in North Muskegon
Average Household Size in North Muskegon is 2.5 People.
How Large is the Labor Force in North Muskegon?
There are 2,099 People in the Labor Forcein in North Muskegon.
What is the Percentage of People in the Labor Force in North Muskegon?
65.6% of People are in the Labor Force in North Muskegon.
What is the Unemployment Rate in North Muskegon?
Unemployment Rate in North Muskegon is 1.4%.