Elberta, MI Map & Demographics
Elberta Map
Elberta Overview
$52,988
PER CAPITA INCOME
$121,875
AVG FAMILY INCOME
$84,500
AVG HOUSEHOLD INCOME
21.1%
WAGE / INCOME GAP [ % ]
78.9¢/ $1
WAGE / INCOME GAP [ $ ]
0.44
INEQUALITY / GINI INDEX
225
TOTAL POPULATION
131
MALE POPULATION
94
FEMALE POPULATION
139.36
MALES / 100 FEMALES
71.76
FEMALES / 100 MALES
43.7
MEDIAN AGE
3.9
AVG FAMILY SIZE
3.1
AVG HOUSEHOLD SIZE
75
LABOR FORCE [ PEOPLE ]
38.7%
PERCENT IN LABOR FORCE
4.0%
UNEMPLOYMENT RATE
Elberta Zip Codes
Elberta Area Codes
Income in Elberta
Income Overview in Elberta
Per Capita Income in Elberta is $52,988, while median incomes of families and households are $121,875 and $84,500 respectively.
| Characteristic | Number | Measure |
| Per Capita Income | 225 | $52,988 |
| Median Family Income | 52 | $121,875 |
| Mean Family Income | 52 | $167,844 |
| Median Household Income | 72 | $84,500 |
| Mean Household Income | 72 | $135,072 |
| Income Deficit | 52 | $0 |
| Wage / Income Gap (%) | 225 | 21.12% |
| Wage / Income Gap ($) | 225 | 78.88¢ per $1 |
| Gini / Inequality Index | 225 | 0.44 |
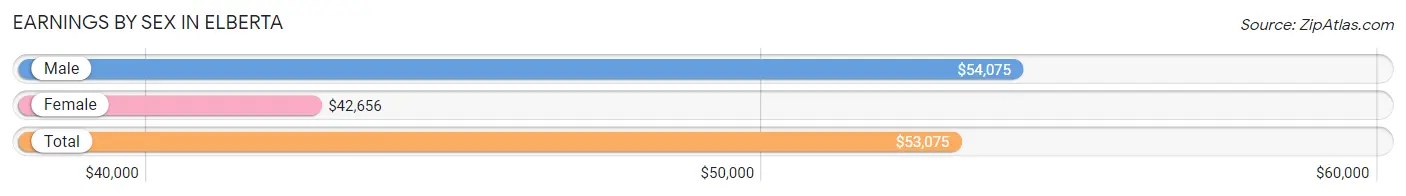
Earnings by Sex in Elberta
Average Earnings in Elberta are $53,075, $54,075 for men and $42,656 for women, a difference of 21.1%.
| Sex | Number | Average Earnings |
| Male | 77 (62.6%) | $54,075 |
| Female | 46 (37.4%) | $42,656 |
| Total | 123 (100.0%) | $53,075 |
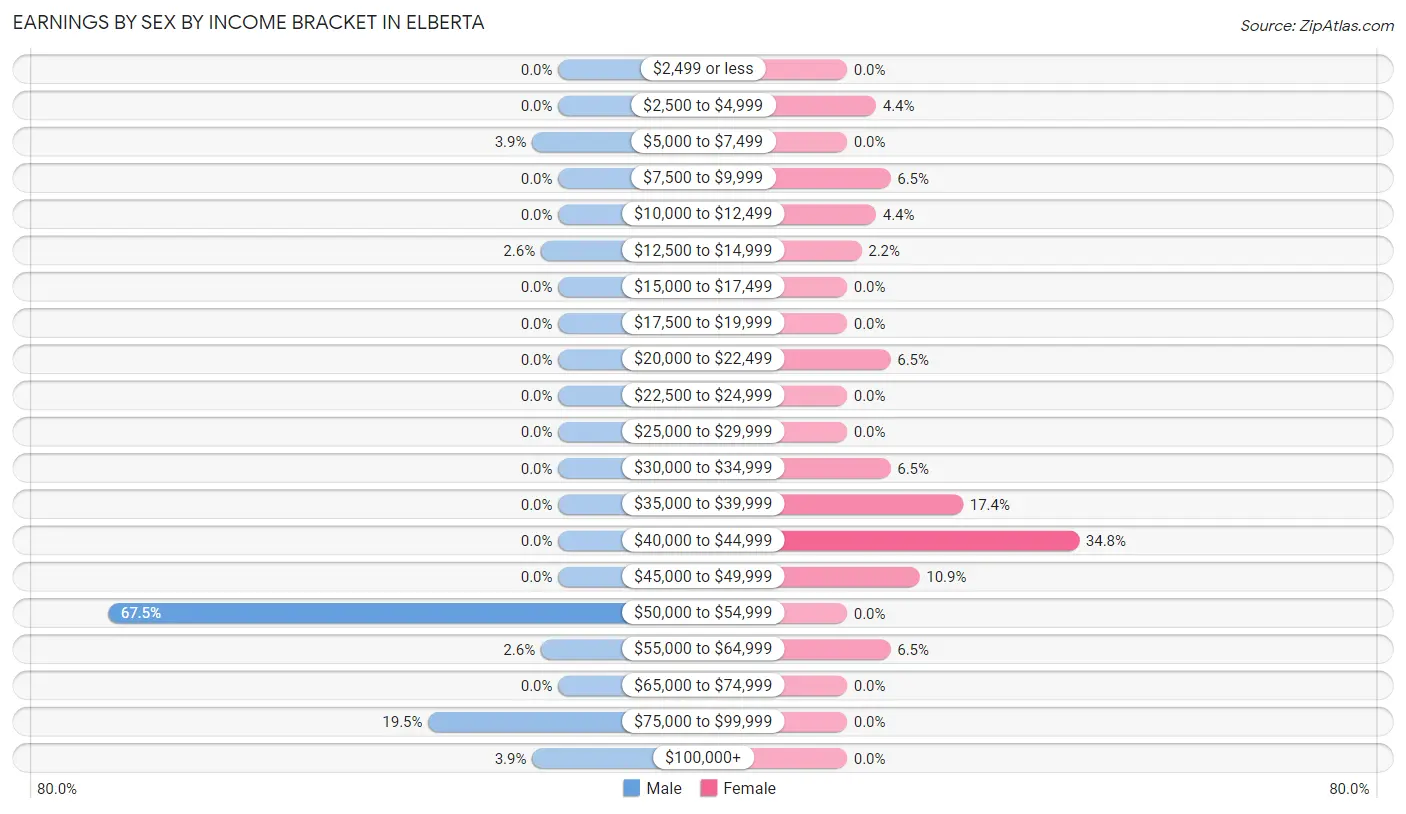
Earnings by Sex by Income Bracket in Elberta
The most common earnings brackets in Elberta are $50,000 to $54,999 for men (52 | 67.5%) and $40,000 to $44,999 for women (16 | 34.8%).
| Income | Male | Female |
| $2,499 or less | 0 (0.0%) | 0 (0.0%) |
| $2,500 to $4,999 | 0 (0.0%) | 2 (4.3%) |
| $5,000 to $7,499 | 3 (3.9%) | 0 (0.0%) |
| $7,500 to $9,999 | 0 (0.0%) | 3 (6.5%) |
| $10,000 to $12,499 | 0 (0.0%) | 2 (4.3%) |
| $12,500 to $14,999 | 2 (2.6%) | 1 (2.2%) |
| $15,000 to $17,499 | 0 (0.0%) | 0 (0.0%) |
| $17,500 to $19,999 | 0 (0.0%) | 0 (0.0%) |
| $20,000 to $22,499 | 0 (0.0%) | 3 (6.5%) |
| $22,500 to $24,999 | 0 (0.0%) | 0 (0.0%) |
| $25,000 to $29,999 | 0 (0.0%) | 0 (0.0%) |
| $30,000 to $34,999 | 0 (0.0%) | 3 (6.5%) |
| $35,000 to $39,999 | 0 (0.0%) | 8 (17.4%) |
| $40,000 to $44,999 | 0 (0.0%) | 16 (34.8%) |
| $45,000 to $49,999 | 0 (0.0%) | 5 (10.9%) |
| $50,000 to $54,999 | 52 (67.5%) | 0 (0.0%) |
| $55,000 to $64,999 | 2 (2.6%) | 3 (6.5%) |
| $65,000 to $74,999 | 0 (0.0%) | 0 (0.0%) |
| $75,000 to $99,999 | 15 (19.5%) | 0 (0.0%) |
| $100,000+ | 3 (3.9%) | 0 (0.0%) |
| Total | 77 (100.0%) | 46 (100.0%) |
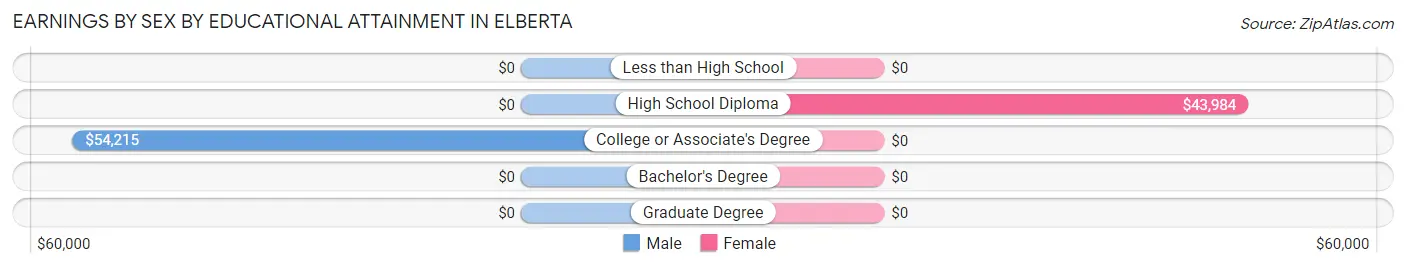
Earnings by Sex by Educational Attainment in Elberta
Average earnings in Elberta are $54,125 for men and $42,734 for women, a difference of 21.0%. Men with an educational attainment of college or associate's degree enjoy the highest average annual earnings of $54,215, while those with college or associate's degree education earn the least with $54,215. Women with an educational attainment of high school diploma earn the most with the average annual earnings of $43,984, while those with high school diploma education have the smallest earnings of $43,984.
| Educational Attainment | Male Income | Female Income |
| Less than High School | - | - |
| High School Diploma | - | - |
| College or Associate's Degree | $54,215 | $0 |
| Bachelor's Degree | - | - |
| Graduate Degree | - | - |
| Total | $54,125 | $42,734 |
Family Income in Elberta
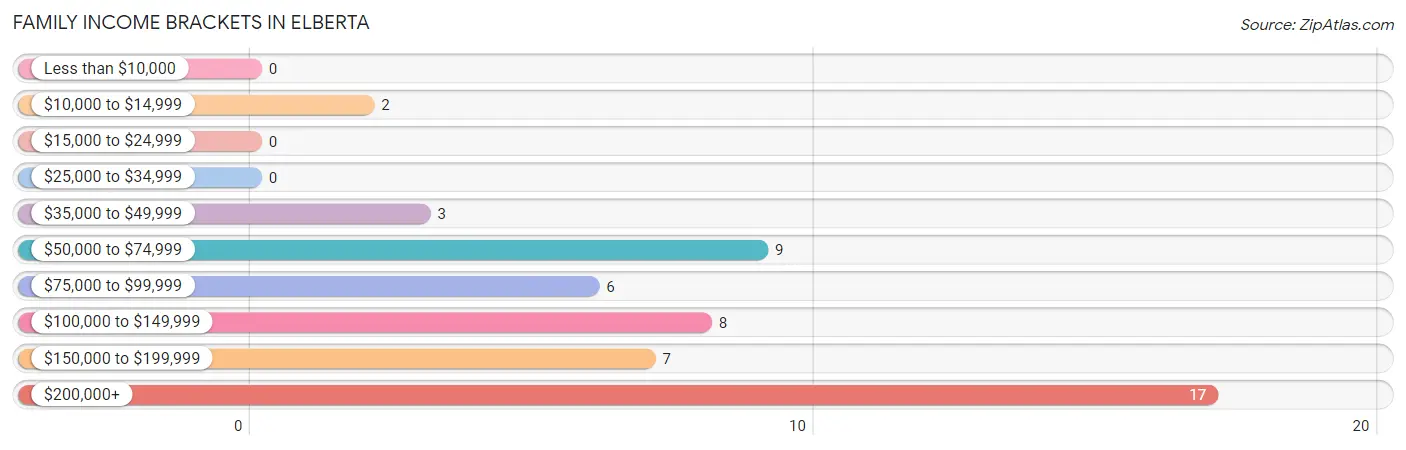
Family Income Brackets in Elberta
According to the Elberta family income data, there are 17 families falling into the $200,000+ income range, which is the most common income bracket and makes up 32.7% of all families.
| Income Bracket | # Families | % Families |
| Less than $10,000 | 0 | 0.0% |
| $10,000 to $14,999 | 2 | 3.8% |
| $15,000 to $24,999 | 0 | 0.0% |
| $25,000 to $34,999 | 0 | 0.0% |
| $35,000 to $49,999 | 3 | 5.8% |
| $50,000 to $74,999 | 9 | 17.3% |
| $75,000 to $99,999 | 6 | 11.5% |
| $100,000 to $149,999 | 8 | 15.4% |
| $150,000 to $199,999 | 7 | 13.5% |
| $200,000+ | 17 | 32.7% |
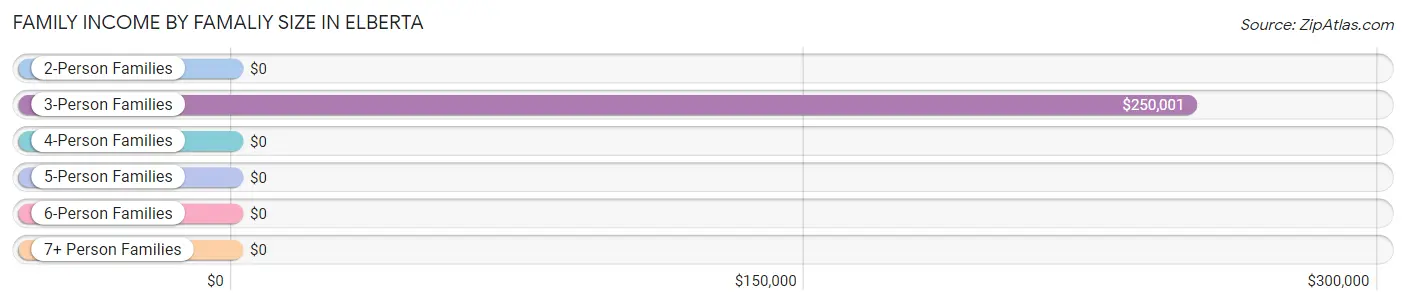
Family Income by Famaliy Size in Elberta
3-person families (22 | 42.3%) account for the highest median family income in Elberta with $250,001 per family, while 3-person families (22 | 42.3%) have the highest median income of $83,334 per family member.
| Income Bracket | # Families | Median Income |
| 2-Person Families | 20 (38.5%) | $0 |
| 3-Person Families | 22 (42.3%) | $250,001 |
| 4-Person Families | 0 (0.0%) | $0 |
| 5-Person Families | 10 (19.2%) | $0 |
| 6-Person Families | 0 (0.0%) | $0 |
| 7+ Person Families | 0 (0.0%) | $0 |
| Total | 52 (100.0%) | $121,875 |
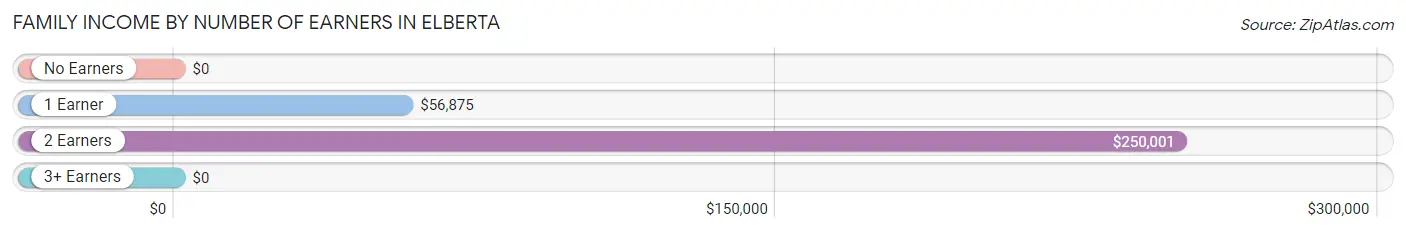
Family Income by Number of Earners in Elberta
| Number of Earners | # Families | Median Income |
| No Earners | 10 (19.2%) | $0 |
| 1 Earner | 13 (25.0%) | $56,875 |
| 2 Earners | 22 (42.3%) | $250,001 |
| 3+ Earners | 7 (13.5%) | $0 |
| Total | 52 (100.0%) | $121,875 |
Household Income in Elberta
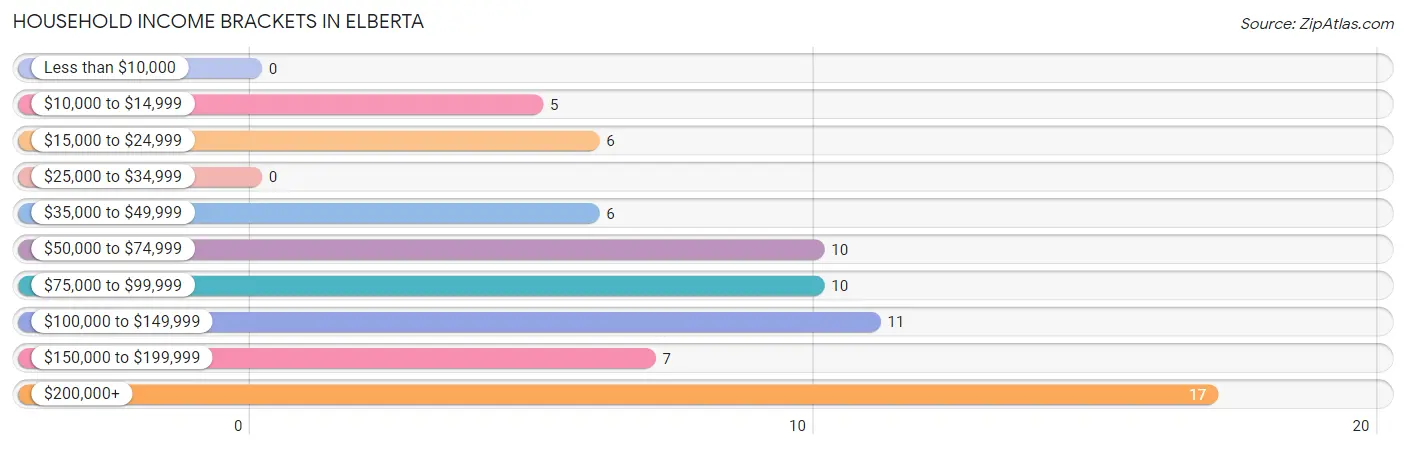
Household Income Brackets in Elberta
With 17 households falling in the category, the $200,000+ income range is the most frequent in Elberta, accounting for 23.6% of all households.
| Income Bracket | # Households | % Households |
| Less than $10,000 | 0 | 0.0% |
| $10,000 to $14,999 | 5 | 6.9% |
| $15,000 to $24,999 | 6 | 8.3% |
| $25,000 to $34,999 | 0 | 0.0% |
| $35,000 to $49,999 | 6 | 8.3% |
| $50,000 to $74,999 | 10 | 13.9% |
| $75,000 to $99,999 | 10 | 13.9% |
| $100,000 to $149,999 | 11 | 15.3% |
| $150,000 to $199,999 | 7 | 9.7% |
| $200,000+ | 17 | 23.6% |
Household Income by Householder Age in Elberta
The median household income in Elberta is $84,500, with the highest median household income of $84,500 found in the 25 to 44 years age bracket for the primary householder. A total of 8 households (11.1%) fall into this category. Meanwhile, the 15 to 24 years age bracket for the primary householder has the lowest median household income of $0, with 2 households (2.8%) in this group.
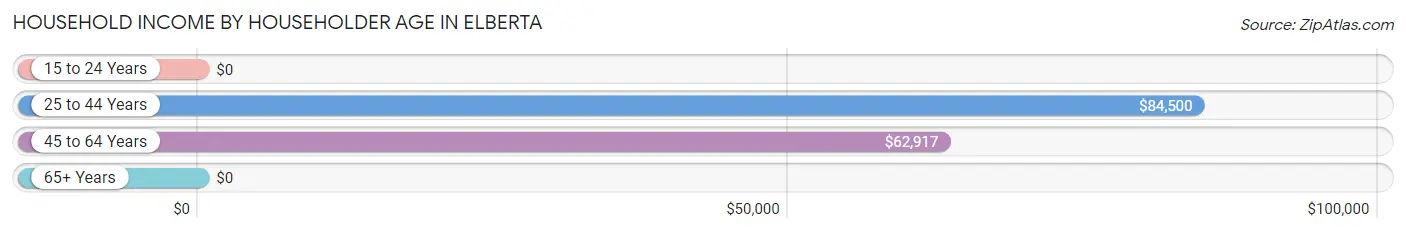
| Income Bracket | # Households | Median Income |
| 15 to 24 Years | 2 (2.8%) | $0 |
| 25 to 44 Years | 8 (11.1%) | $84,500 |
| 45 to 64 Years | 19 (26.4%) | $62,917 |
| 65+ Years | 43 (59.7%) | $0 |
| Total | 72 (100.0%) | $84,500 |
Poverty in Elberta
Income Below Poverty by Sex and Age in Elberta
With 2.3% poverty level for males and 5.3% for females among the residents of Elberta, 6 to 11 year old males and 45 to 54 year old females are the most vulnerable to poverty, with 3 males (50.0%) and 2 females (18.2%) in their respective age groups living below the poverty level.
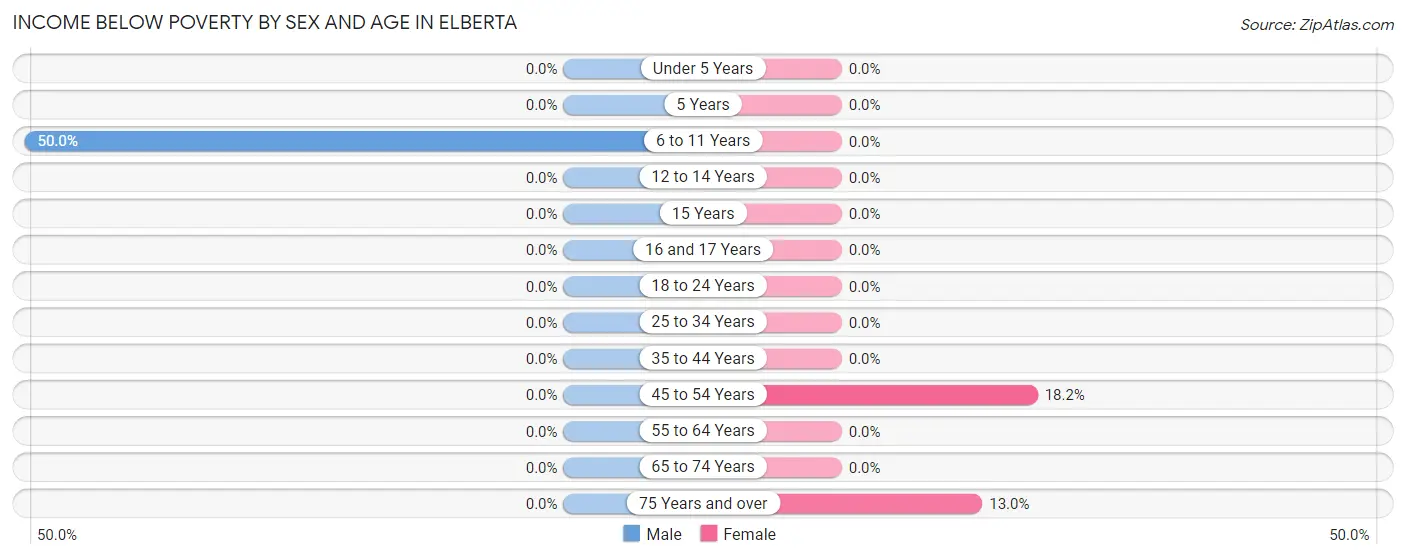
| Age Bracket | Male | Female |
| Under 5 Years | 0 (0.0%) | 0 (0.0%) |
| 5 Years | 0 (0.0%) | 0 (0.0%) |
| 6 to 11 Years | 3 (50.0%) | 0 (0.0%) |
| 12 to 14 Years | 0 (0.0%) | 0 (0.0%) |
| 15 Years | 0 (0.0%) | 0 (0.0%) |
| 16 and 17 Years | 0 (0.0%) | 0 (0.0%) |
| 18 to 24 Years | 0 (0.0%) | 0 (0.0%) |
| 25 to 34 Years | 0 (0.0%) | 0 (0.0%) |
| 35 to 44 Years | 0 (0.0%) | 0 (0.0%) |
| 45 to 54 Years | 0 (0.0%) | 2 (18.2%) |
| 55 to 64 Years | 0 (0.0%) | 0 (0.0%) |
| 65 to 74 Years | 0 (0.0%) | 0 (0.0%) |
| 75 Years and over | 0 (0.0%) | 3 (13.0%) |
| Total | 3 (2.3%) | 5 (5.3%) |
Income Above Poverty by Sex and Age in Elberta
According to the poverty statistics in Elberta, males aged 5 years and females aged under 5 years are the age groups that are most secure financially, with 100.0% of males and 100.0% of females in these age groups living above the poverty line.
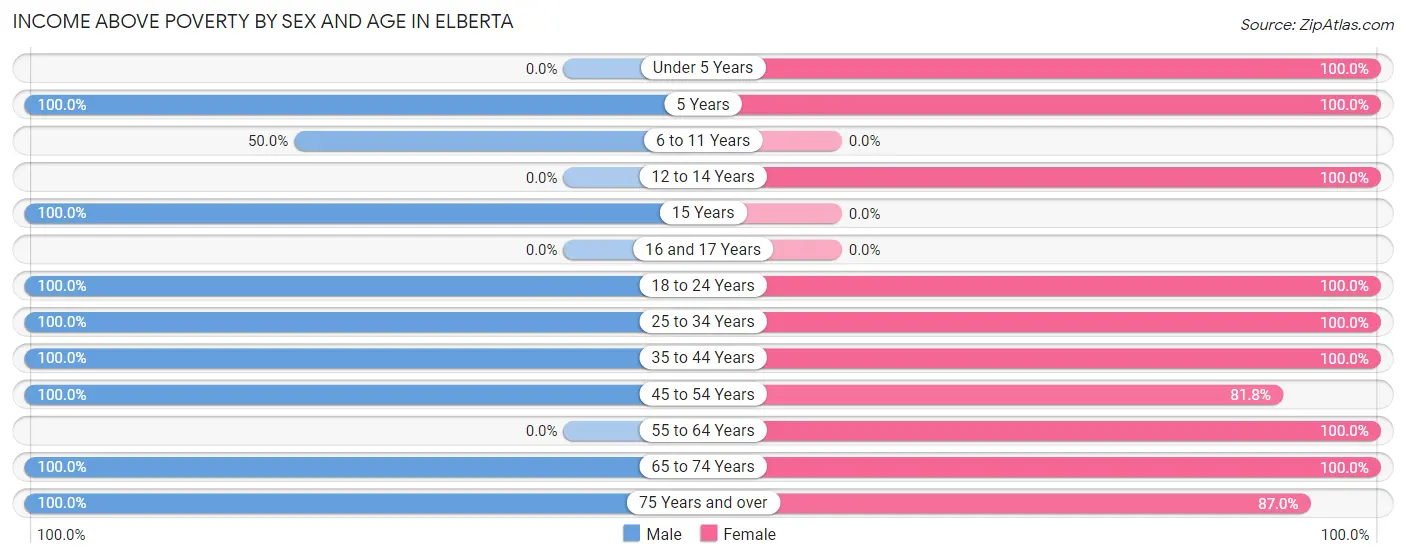
| Age Bracket | Male | Female |
| Under 5 Years | 0 (0.0%) | 6 (100.0%) |
| 5 Years | 6 (100.0%) | 3 (100.0%) |
| 6 to 11 Years | 3 (50.0%) | 0 (0.0%) |
| 12 to 14 Years | 0 (0.0%) | 4 (100.0%) |
| 15 Years | 6 (100.0%) | 0 (0.0%) |
| 16 and 17 Years | 0 (0.0%) | 0 (0.0%) |
| 18 to 24 Years | 2 (100.0%) | 4 (100.0%) |
| 25 to 34 Years | 56 (100.0%) | 8 (100.0%) |
| 35 to 44 Years | 12 (100.0%) | 6 (100.0%) |
| 45 to 54 Years | 7 (100.0%) | 9 (81.8%) |
| 55 to 64 Years | 0 (0.0%) | 11 (100.0%) |
| 65 to 74 Years | 22 (100.0%) | 18 (100.0%) |
| 75 Years and over | 14 (100.0%) | 20 (87.0%) |
| Total | 128 (97.7%) | 89 (94.7%) |
Income Below Poverty Among Married-Couple Families in Elberta
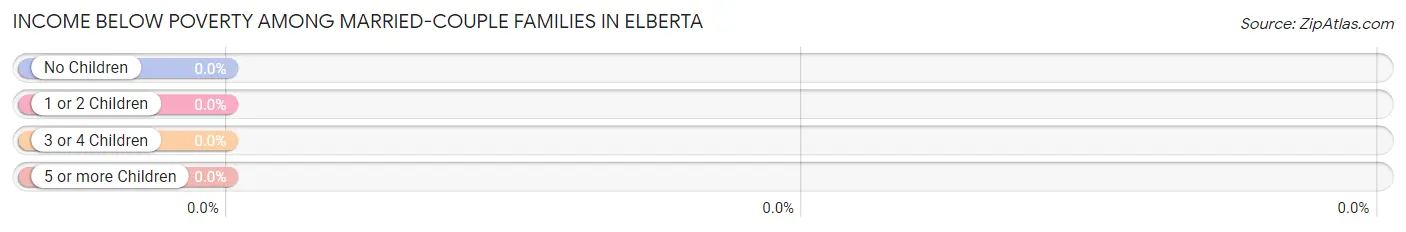
| Children | Above Poverty | Below Poverty |
| No Children | 32 (100.0%) | 0 (0.0%) |
| 1 or 2 Children | 15 (100.0%) | 0 (0.0%) |
| 3 or 4 Children | 0 (0.0%) | 0 (0.0%) |
| 5 or more Children | 0 (0.0%) | 0 (0.0%) |
| Total | 47 (100.0%) | 0 (0.0%) |
Income Below Poverty Among Single-Parent Households in Elberta
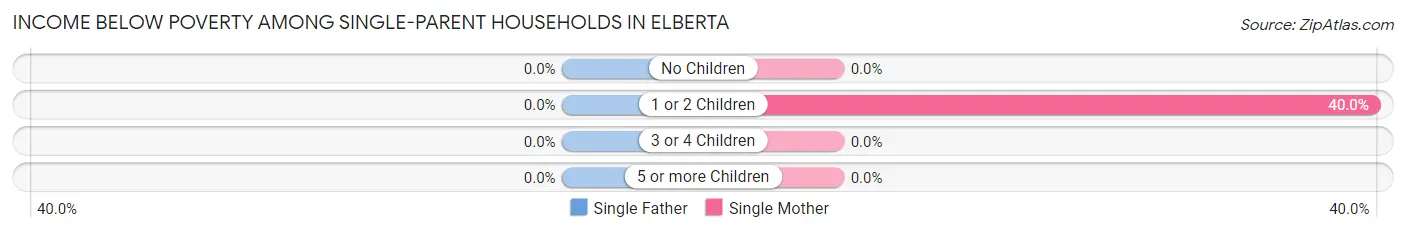
| Children | Single Father | Single Mother |
| No Children | 0 (0.0%) | 0 (0.0%) |
| 1 or 2 Children | 0 (0.0%) | 2 (40.0%) |
| 3 or 4 Children | 0 (0.0%) | 0 (0.0%) |
| 5 or more Children | 0 (0.0%) | 0 (0.0%) |
| Total | 0 (0.0%) | 2 (40.0%) |
Income Below Poverty Among Married-Couple vs Single-Parent Households in Elberta
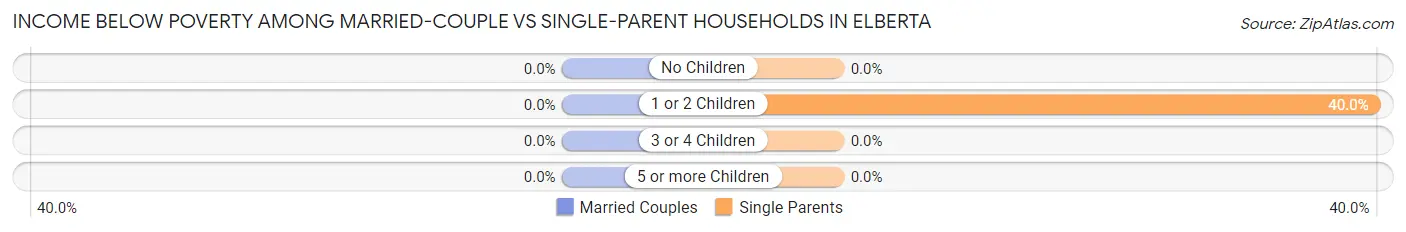
| Children | Married-Couple Families | Single-Parent Households |
| No Children | 0 (0.0%) | 0 (0.0%) |
| 1 or 2 Children | 0 (0.0%) | 2 (40.0%) |
| 3 or 4 Children | 0 (0.0%) | 0 (0.0%) |
| 5 or more Children | 0 (0.0%) | 0 (0.0%) |
| Total | 0 (0.0%) | 2 (40.0%) |
Race in Elberta
The most populous races in Elberta are White / Caucasian (182 | 80.9%), Native / Alaskan (43 | 19.1%), and Hispanic or Latino (13 | 5.8%).
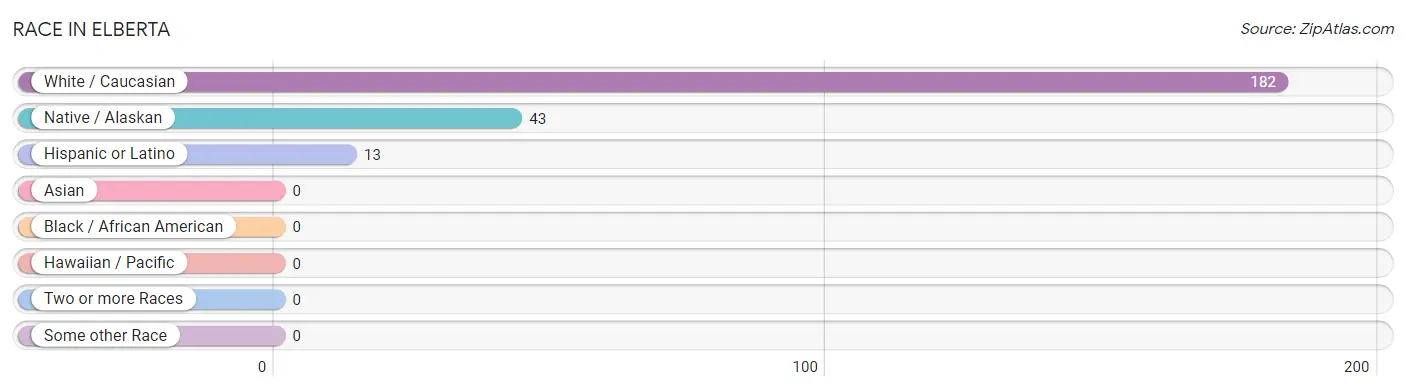
| Race | # Population | % Population |
| Asian | 0 | 0.0% |
| Black / African American | 0 | 0.0% |
| Hawaiian / Pacific | 0 | 0.0% |
| Hispanic or Latino | 13 | 5.8% |
| Native / Alaskan | 43 | 19.1% |
| White / Caucasian | 182 | 80.9% |
| Two or more Races | 0 | 0.0% |
| Some other Race | 0 | 0.0% |
| Total | 225 | 100.0% |
Ancestry in Elberta
The most populous ancestries reported in Elberta are German (54 | 24.0%), Yup'ik (43 | 19.1%), Irish (22 | 9.8%), English (13 | 5.8%), and French (13 | 5.8%), together accounting for 64.4% of all Elberta residents.
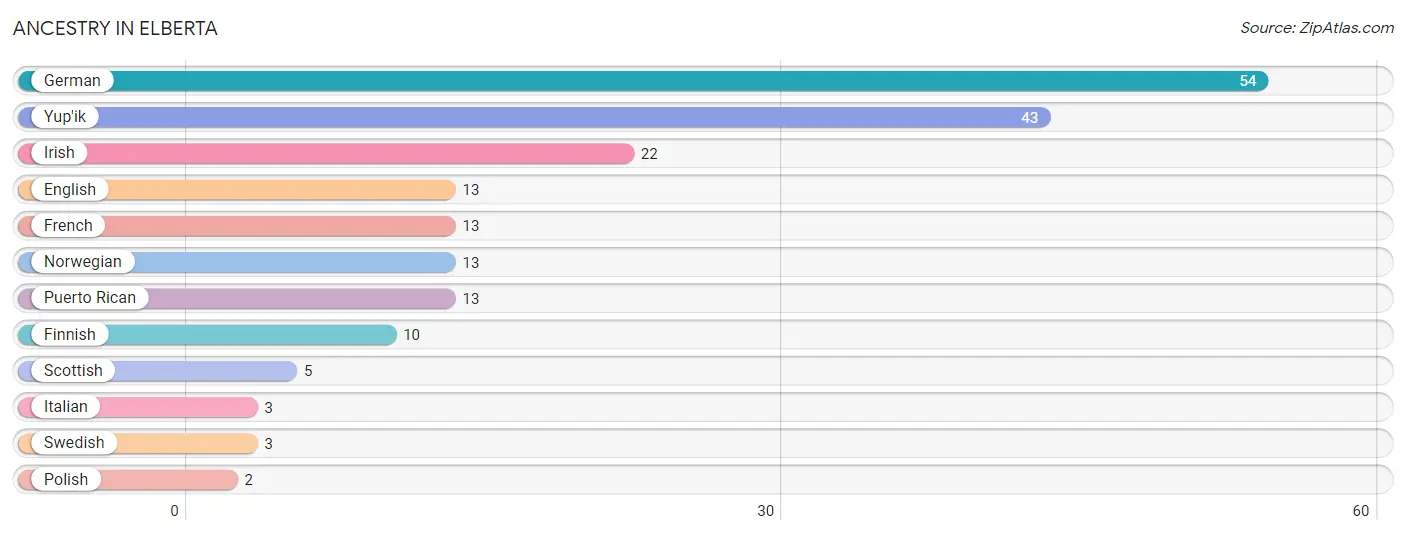
| Ancestry | # Population | % Population |
| English | 13 | 5.8% |
| Finnish | 10 | 4.4% |
| French | 13 | 5.8% |
| German | 54 | 24.0% |
| Irish | 22 | 9.8% |
| Italian | 3 | 1.3% |
| Norwegian | 13 | 5.8% |
| Polish | 2 | 0.9% |
| Puerto Rican | 13 | 5.8% |
| Scottish | 5 | 2.2% |
| Swedish | 3 | 1.3% |
| Yup'ik | 43 | 19.1% | View All 12 Rows |
Immigrants in Elberta

| Immigration Origin | # Population | % Population | View All 0 Rows |
Sex and Age in Elberta
Sex and Age in Elberta
The most populous age groups in Elberta are 30 to 34 Years (56 | 42.7%) for men and 65 to 69 Years (18 | 19.2%) for women.
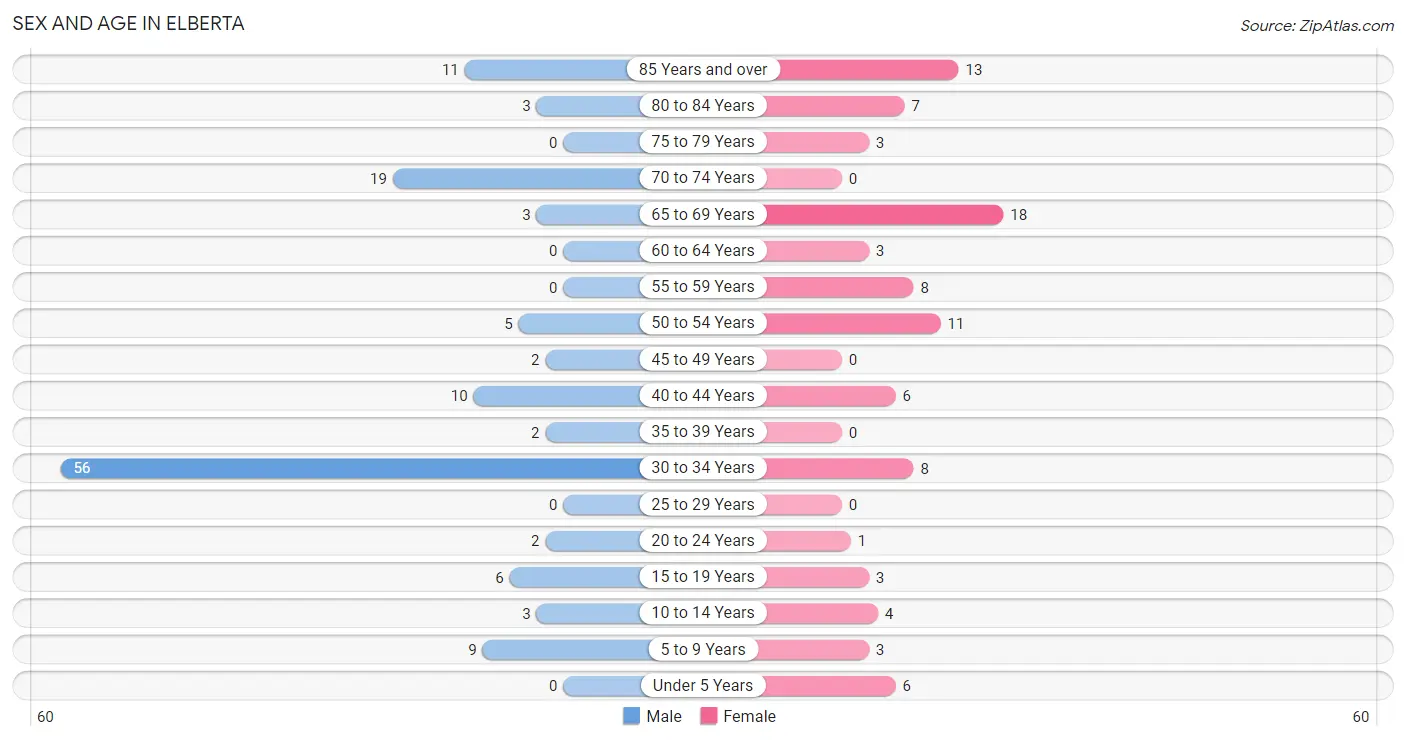
| Age Bracket | Male | Female |
| Under 5 Years | 0 (0.0%) | 6 (6.4%) |
| 5 to 9 Years | 9 (6.9%) | 3 (3.2%) |
| 10 to 14 Years | 3 (2.3%) | 4 (4.3%) |
| 15 to 19 Years | 6 (4.6%) | 3 (3.2%) |
| 20 to 24 Years | 2 (1.5%) | 1 (1.1%) |
| 25 to 29 Years | 0 (0.0%) | 0 (0.0%) |
| 30 to 34 Years | 56 (42.7%) | 8 (8.5%) |
| 35 to 39 Years | 2 (1.5%) | 0 (0.0%) |
| 40 to 44 Years | 10 (7.6%) | 6 (6.4%) |
| 45 to 49 Years | 2 (1.5%) | 0 (0.0%) |
| 50 to 54 Years | 5 (3.8%) | 11 (11.7%) |
| 55 to 59 Years | 0 (0.0%) | 8 (8.5%) |
| 60 to 64 Years | 0 (0.0%) | 3 (3.2%) |
| 65 to 69 Years | 3 (2.3%) | 18 (19.2%) |
| 70 to 74 Years | 19 (14.5%) | 0 (0.0%) |
| 75 to 79 Years | 0 (0.0%) | 3 (3.2%) |
| 80 to 84 Years | 3 (2.3%) | 7 (7.4%) |
| 85 Years and over | 11 (8.4%) | 13 (13.8%) |
| Total | 131 (100.0%) | 94 (100.0%) |
Families and Households in Elberta
Median Family Size in Elberta
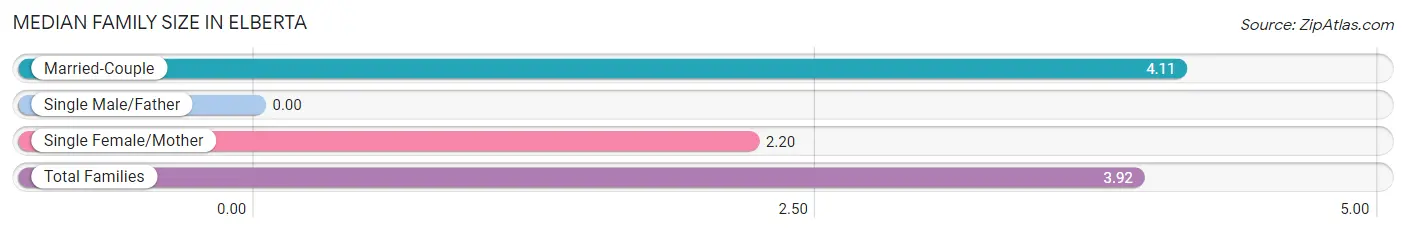
| Family Type | # Families | Family Size |
| Married-Couple | 47 (90.4%) | 4.11 |
| Single Male/Father | 0 (0.0%) | - |
| Single Female/Mother | 5 (9.6%) | 2.20 |
| Total Families | 52 (100.0%) | 3.92 |
Median Household Size in Elberta
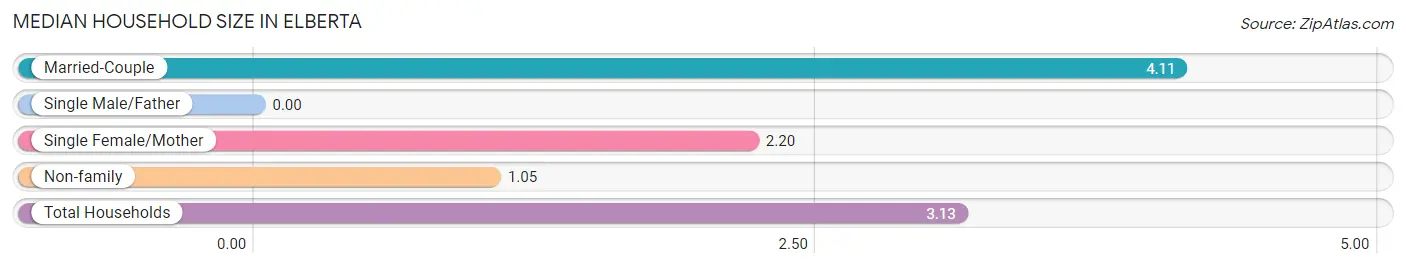
| Household Type | # Households | Household Size |
| Married-Couple | 47 (65.3%) | 4.11 |
| Single Male/Father | 0 (0.0%) | - |
| Single Female/Mother | 5 (6.9%) | 2.20 |
| Non-family | 20 (27.8%) | 1.05 |
| Total Households | 72 (100.0%) | 3.13 |
Household Size by Marriage Status in Elberta
Out of a total of 72 households in Elberta, 52 (72.2%) are family households, while 20 (27.8%) are nonfamily households. The most numerous type of family households are 3-person households, comprising 22, and the most common type of nonfamily households are 1-person households, comprising 18.
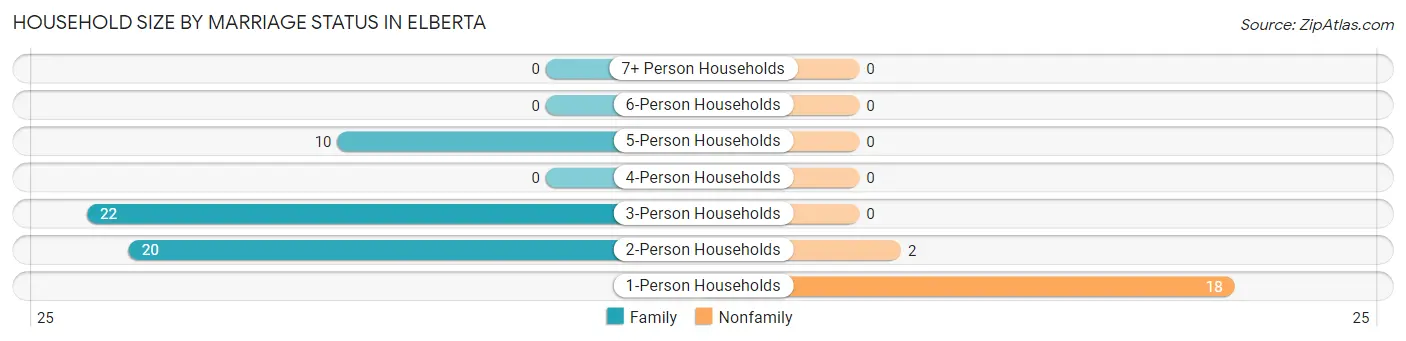
| Household Size | Family Households | Nonfamily Households |
| 1-Person Households | - | 18 (25.0%) |
| 2-Person Households | 20 (27.8%) | 2 (2.8%) |
| 3-Person Households | 22 (30.6%) | 0 (0.0%) |
| 4-Person Households | 0 (0.0%) | 0 (0.0%) |
| 5-Person Households | 10 (13.9%) | 0 (0.0%) |
| 6-Person Households | 0 (0.0%) | 0 (0.0%) |
| 7+ Person Households | 0 (0.0%) | 0 (0.0%) |
| Total | 52 (72.2%) | 20 (27.8%) |
Female Fertility in Elberta
Fertility by Age in Elberta
Average fertility rate in Elberta is 167.0 births per 1,000 women. Women in the age bracket of 35 to 50 years have the highest fertility rate with 500.0 births per 1,000 women. Women in the age bracket of 35 to 50 years acount for 100.0% of all women with births.
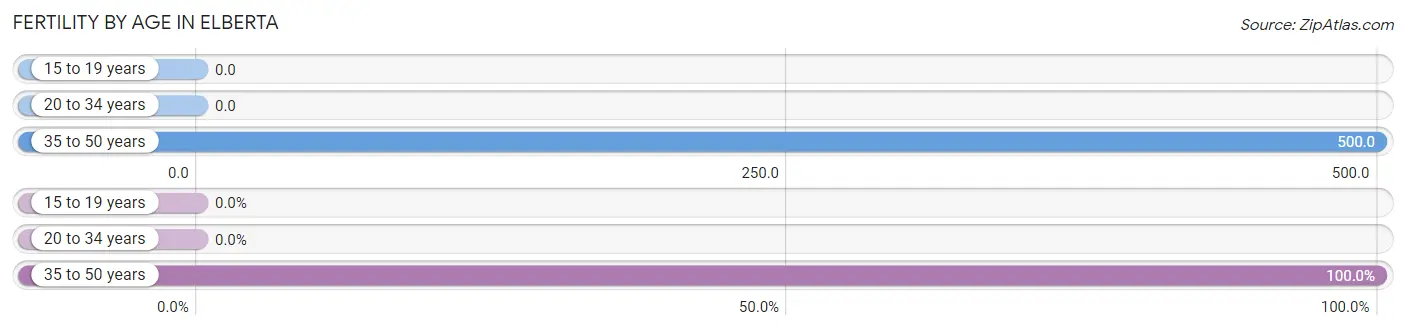
| Age Bracket | Women with Births | Births / 1,000 Women |
| 15 to 19 years | 0 (0.0%) | 0.0 |
| 20 to 34 years | 0 (0.0%) | 0.0 |
| 35 to 50 years | 3 (100.0%) | 500.0 |
| Total | 3 (100.0%) | 167.0 |
Fertility by Age by Marriage Status in Elberta
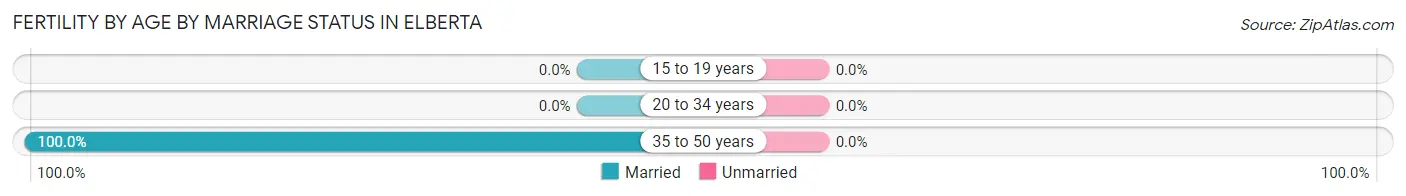
| Age Bracket | Married | Unmarried |
| 15 to 19 years | 0 (0.0%) | 0 (0.0%) |
| 20 to 34 years | 0 (0.0%) | 0 (0.0%) |
| 35 to 50 years | 3 (100.0%) | 0 (0.0%) |
| Total | 3 (100.0%) | 0 (0.0%) |
Fertility by Education in Elberta
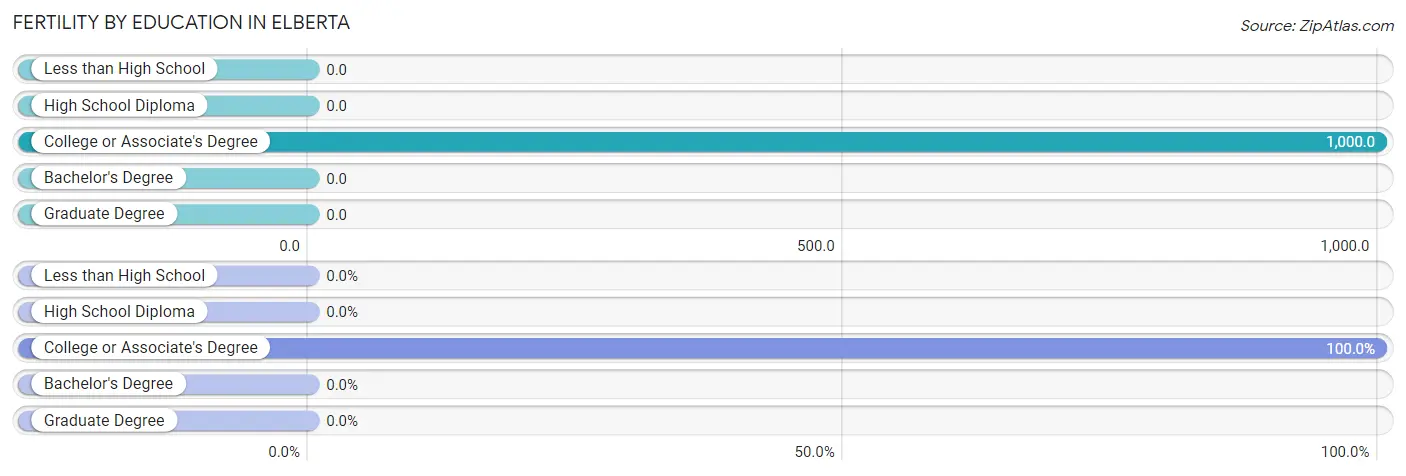
| Educational Attainment | Women with Births | Births / 1,000 Women |
| Less than High School | 0 (0.0%) | 0.0 |
| High School Diploma | 0 (0.0%) | 0.0 |
| College or Associate's Degree | 3 (100.0%) | 1,000.0 |
| Bachelor's Degree | 0 (0.0%) | 0.0 |
| Graduate Degree | 0 (0.0%) | 0.0 |
| Total | 3 (100.0%) | 167.0 |
Fertility by Education by Marriage Status in Elberta
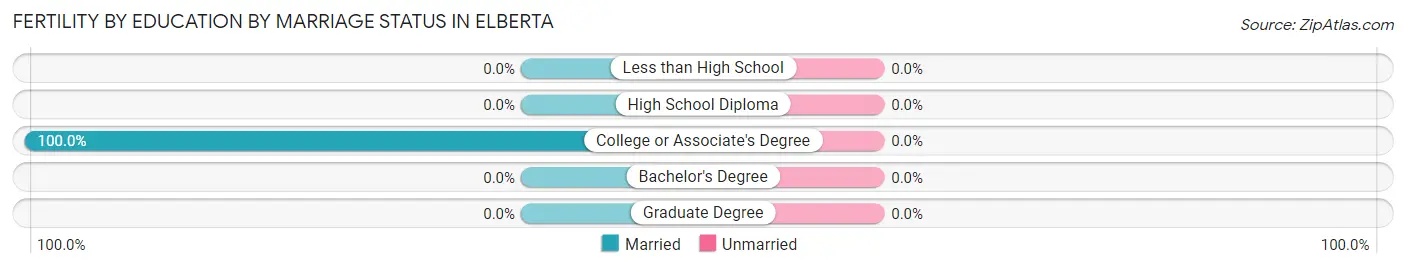
| Educational Attainment | Married | Unmarried |
| Less than High School | 0 (0.0%) | 0 (0.0%) |
| High School Diploma | 0 (0.0%) | 0 (0.0%) |
| College or Associate's Degree | 3 (100.0%) | 0 (0.0%) |
| Bachelor's Degree | 0 (0.0%) | 0 (0.0%) |
| Graduate Degree | 0 (0.0%) | 0 (0.0%) |
| Total | 3 (100.0%) | 0 (0.0%) |
Employment Characteristics in Elberta
Employment by Class of Employer in Elberta
Among the 69 employed individuals in Elberta, private company employees (62 | 89.9%), and local government employees (7 | 10.1%) make up the most common classes of employment.

| Employer Class | # Employees | % Employees |
| Private Company Employees | 62 | 89.9% |
| Self-Employed (Incorporated) | 0 | 0.0% |
| Self-Employed (Not Incorporated) | 0 | 0.0% |
| Not-for-profit Organizations | 0 | 0.0% |
| Local Government Employees | 7 | 10.1% |
| State Government Employees | 0 | 0.0% |
| Federal Government Employees | 0 | 0.0% |
| Unpaid Family Workers | 0 | 0.0% |
| Total | 69 | 100.0% |
Employment Status by Age in Elberta
According to the labor force statistics for Elberta, out of the total population over 16 years of age (194), 38.7% or 75 individuals are in the labor force, with 4.0% or 3 of them unemployed. The age group with the highest labor force participation rate is 20 to 24 years, with 100.0% or 3 individuals in the labor force. Within the labor force, the 45 to 54 years age range has the highest percentage of unemployed individuals, with 33.3% or 3 of them being unemployed.
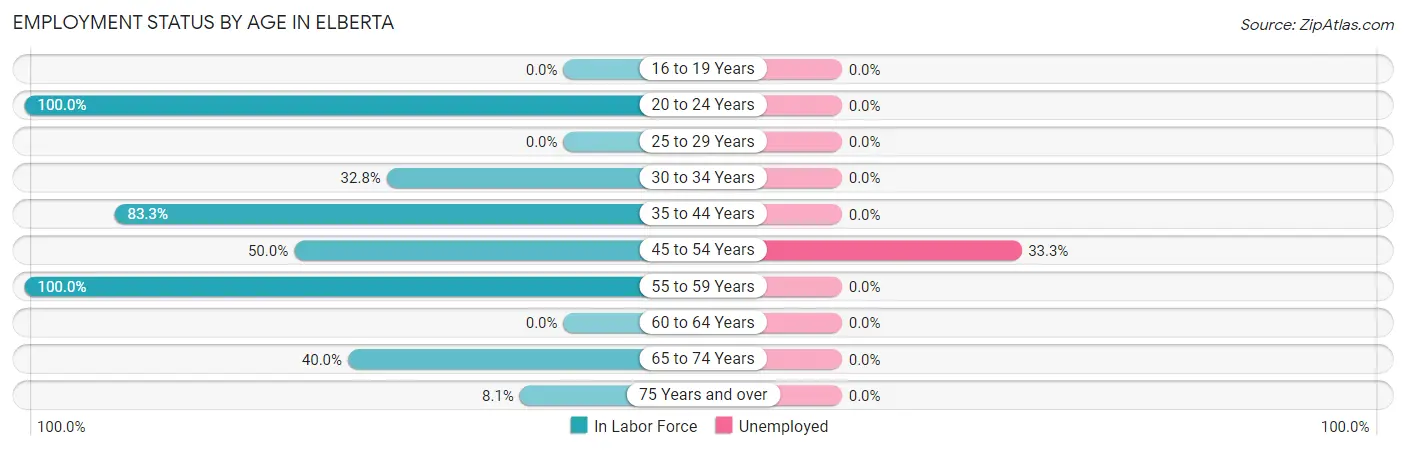
| Age Bracket | In Labor Force | Unemployed |
| 16 to 19 Years | 0 (0.0%) | 0 (0.0%) |
| 20 to 24 Years | 3 (100.0%) | 0 (0.0%) |
| 25 to 29 Years | 0 (0.0%) | 0 (0.0%) |
| 30 to 34 Years | 21 (32.8%) | 0 (0.0%) |
| 35 to 44 Years | 15 (83.3%) | 0 (0.0%) |
| 45 to 54 Years | 9 (50.0%) | 3 (33.3%) |
| 55 to 59 Years | 8 (100.0%) | 0 (0.0%) |
| 60 to 64 Years | 0 (0.0%) | 0 (0.0%) |
| 65 to 74 Years | 16 (40.0%) | 0 (0.0%) |
| 75 Years and over | 3 (8.1%) | 0 (0.0%) |
| Total | 75 (38.7%) | 3 (4.0%) |
Employment Status by Educational Attainment in Elberta
According to labor force statistics for Elberta, 47.7% of individuals (53) out of the total population between 25 and 64 years of age (111) are in the labor force, with 5.7% or 3 of them being unemployed. The group with the highest labor force participation rate are those with the educational attainment of less than high school, with 100.0% or 7 individuals in the labor force. Within the labor force, individuals with high school diploma education have the highest percentage of unemployment, with 20.0% or 3 of them being unemployed.
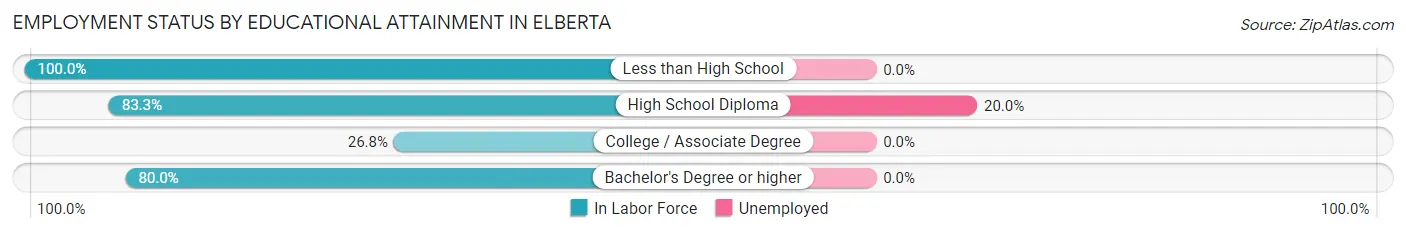
| Educational Attainment | In Labor Force | Unemployed |
| Less than High School | 7 (100.0%) | 0 (0.0%) |
| High School Diploma | 15 (83.3%) | 4 (20.0%) |
| College / Associate Degree | 19 (26.8%) | 0 (0.0%) |
| Bachelor's Degree or higher | 12 (80.0%) | 0 (0.0%) |
| Total | 53 (47.7%) | 6 (5.7%) |
Employment Occupations by Sex in Elberta
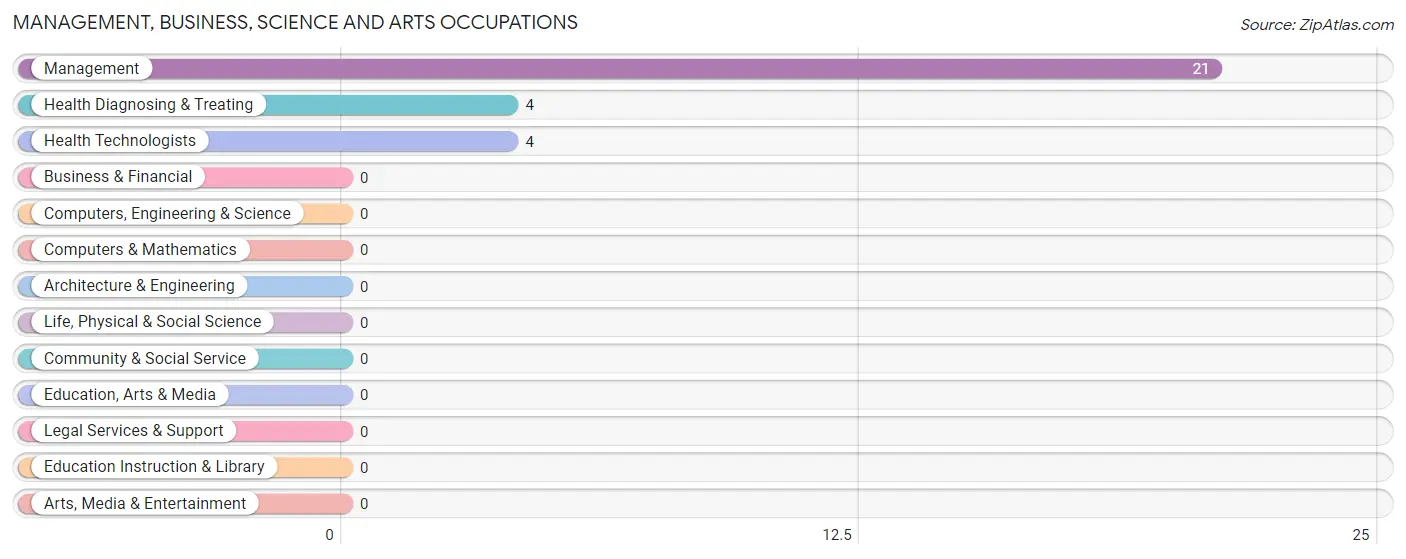
Management, Business, Science and Arts Occupations
The most common Management, Business, Science and Arts occupations in Elberta are Management (21 | 29.2%), Health Diagnosing & Treating (4 | 5.6%), and Health Technologists (4 | 5.6%).
Management, Business, Science and Arts Occupations by Sex
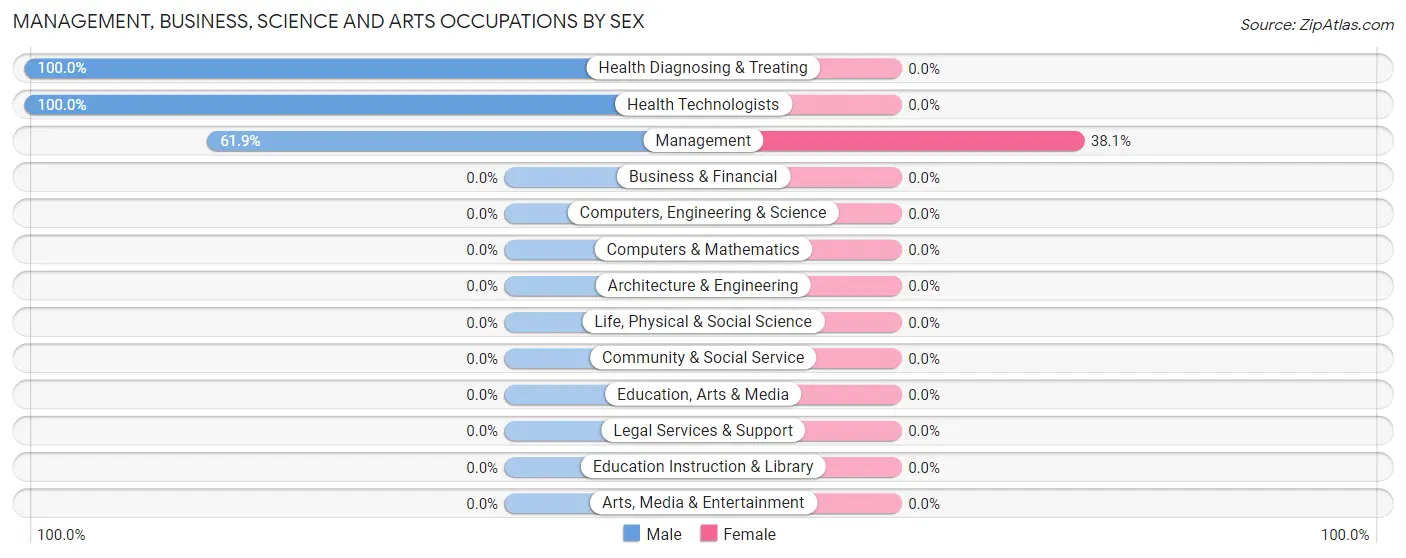
| Occupation | Male | Female |
| Management | 13 (61.9%) | 8 (38.1%) |
| Business & Financial | 0 (0.0%) | 0 (0.0%) |
| Computers, Engineering & Science | 0 (0.0%) | 0 (0.0%) |
| Computers & Mathematics | 0 (0.0%) | 0 (0.0%) |
| Architecture & Engineering | 0 (0.0%) | 0 (0.0%) |
| Life, Physical & Social Science | 0 (0.0%) | 0 (0.0%) |
| Community & Social Service | 0 (0.0%) | 0 (0.0%) |
| Education, Arts & Media | 0 (0.0%) | 0 (0.0%) |
| Legal Services & Support | 0 (0.0%) | 0 (0.0%) |
| Education Instruction & Library | 0 (0.0%) | 0 (0.0%) |
| Arts, Media & Entertainment | 0 (0.0%) | 0 (0.0%) |
| Health Diagnosing & Treating | 4 (100.0%) | 0 (0.0%) |
| Health Technologists | 4 (100.0%) | 0 (0.0%) |
| Total (Category) | 17 (68.0%) | 8 (32.0%) |
| Total (Overall) | 31 (43.1%) | 41 (56.9%) |
Services Occupations
The most common Services occupations in Elberta are Personal Care & Service (24 | 33.3%), Healthcare Support (3 | 4.2%), and Food Preparation & Serving (3 | 4.2%).
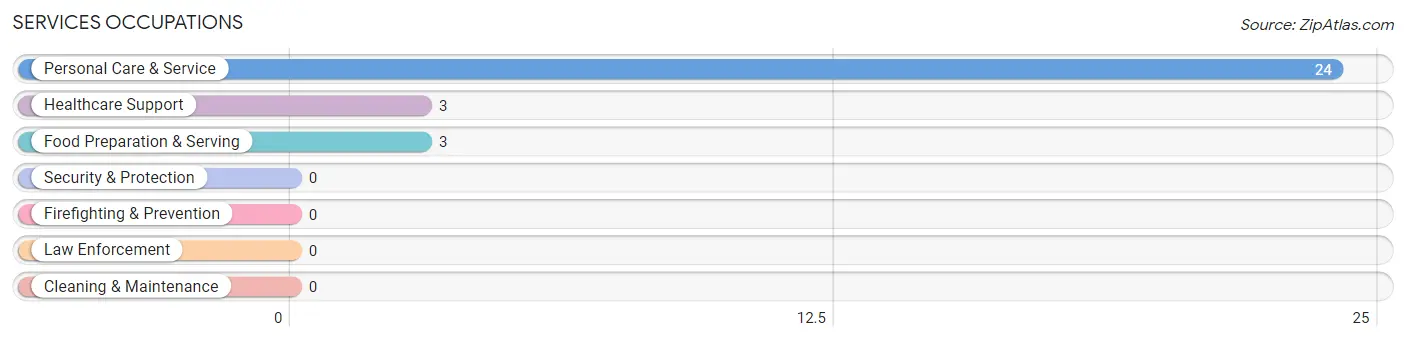
Services Occupations by Sex
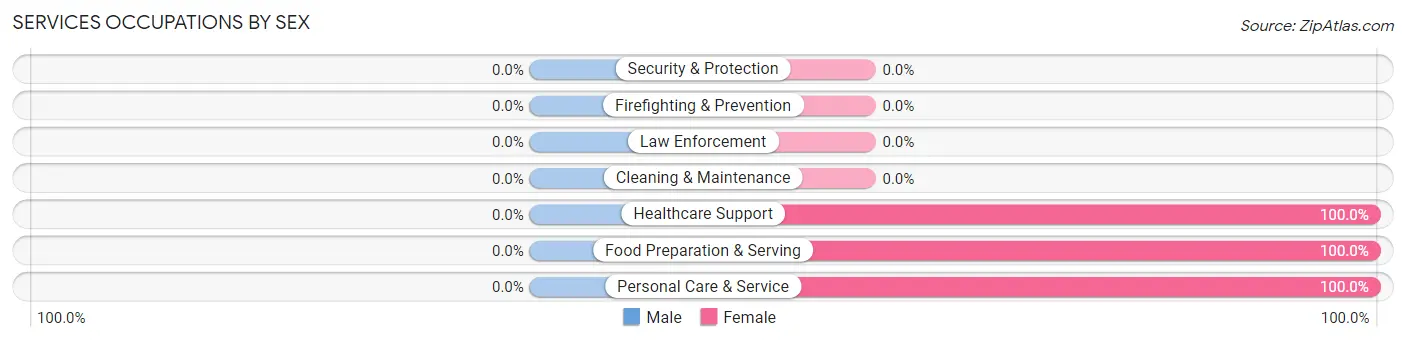
| Occupation | Male | Female |
| Healthcare Support | 0 (0.0%) | 3 (100.0%) |
| Security & Protection | 0 (0.0%) | 0 (0.0%) |
| Firefighting & Prevention | 0 (0.0%) | 0 (0.0%) |
| Law Enforcement | 0 (0.0%) | 0 (0.0%) |
| Food Preparation & Serving | 0 (0.0%) | 3 (100.0%) |
| Cleaning & Maintenance | 0 (0.0%) | 0 (0.0%) |
| Personal Care & Service | 0 (0.0%) | 24 (100.0%) |
| Total (Category) | 0 (0.0%) | 30 (100.0%) |
| Total (Overall) | 31 (43.1%) | 41 (56.9%) |
Sales and Office Occupations
The most common Sales and Office occupations in Elberta are , and Office & Administration (3 | 4.2%).
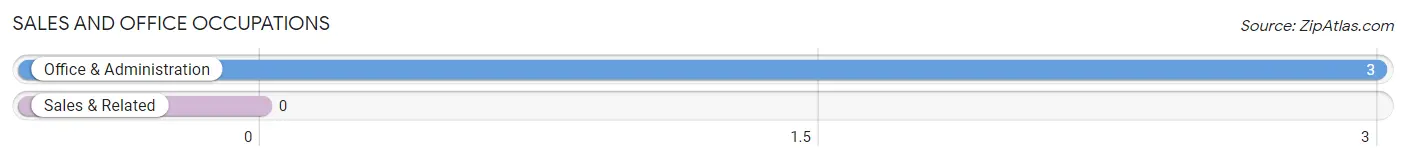
Sales and Office Occupations by Sex
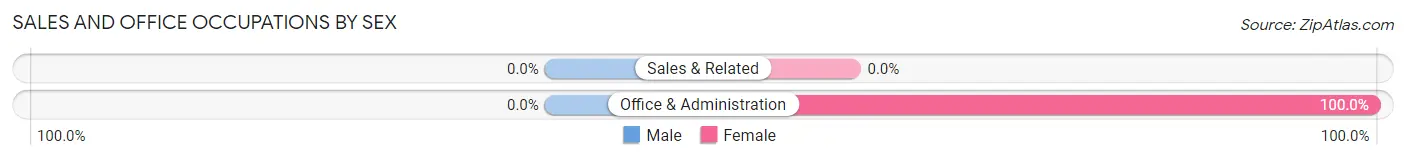
| Occupation | Male | Female |
| Sales & Related | 0 (0.0%) | 0 (0.0%) |
| Office & Administration | 0 (0.0%) | 3 (100.0%) |
| Total (Category) | 0 (0.0%) | 3 (100.0%) |
| Total (Overall) | 31 (43.1%) | 41 (56.9%) |
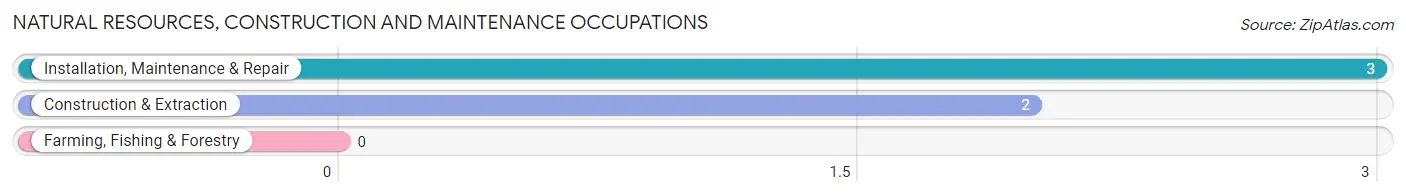
Natural Resources, Construction and Maintenance Occupations
The most common Natural Resources, Construction and Maintenance occupations in Elberta are Installation, Maintenance & Repair (3 | 4.2%), and Construction & Extraction (2 | 2.8%).
Natural Resources, Construction and Maintenance Occupations by Sex
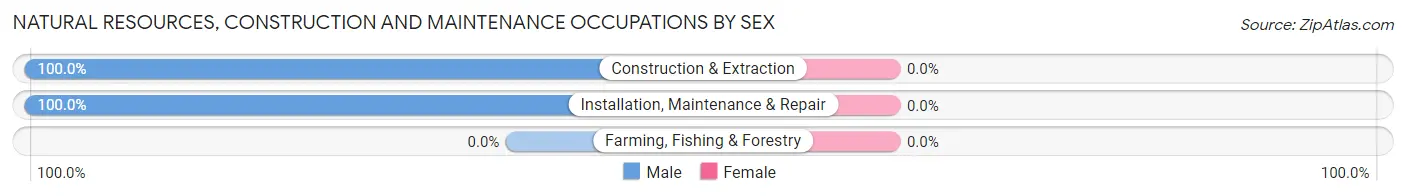
| Occupation | Male | Female |
| Farming, Fishing & Forestry | 0 (0.0%) | 0 (0.0%) |
| Construction & Extraction | 2 (100.0%) | 0 (0.0%) |
| Installation, Maintenance & Repair | 3 (100.0%) | 0 (0.0%) |
| Total (Category) | 5 (100.0%) | 0 (0.0%) |
| Total (Overall) | 31 (43.1%) | 41 (56.9%) |
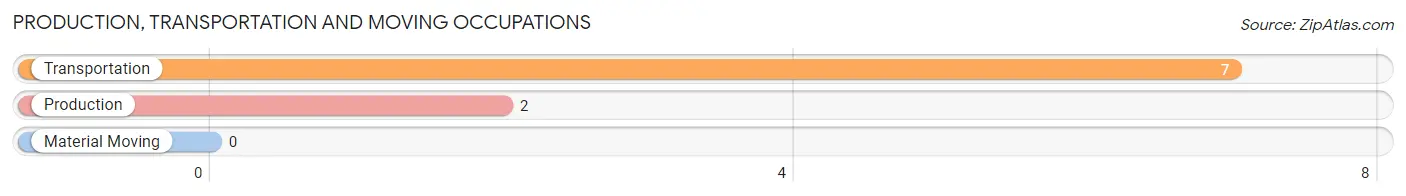
Production, Transportation and Moving Occupations
The most common Production, Transportation and Moving occupations in Elberta are Transportation (7 | 9.7%), and Production (2 | 2.8%).
Production, Transportation and Moving Occupations by Sex
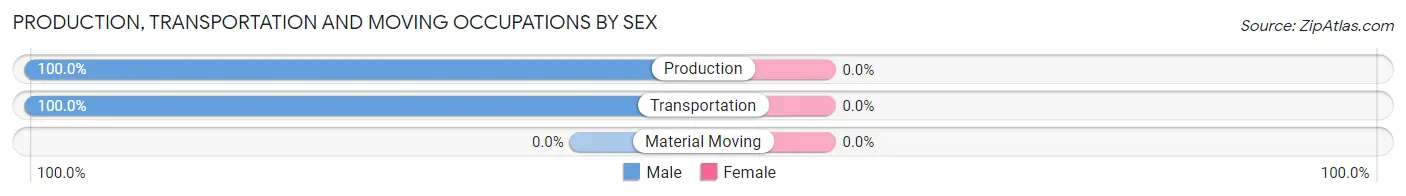
| Occupation | Male | Female |
| Production | 2 (100.0%) | 0 (0.0%) |
| Transportation | 7 (100.0%) | 0 (0.0%) |
| Material Moving | 0 (0.0%) | 0 (0.0%) |
| Total (Category) | 9 (100.0%) | 0 (0.0%) |
| Total (Overall) | 31 (43.1%) | 41 (56.9%) |
Employment Industries by Sex in Elberta
Employment Industries in Elberta
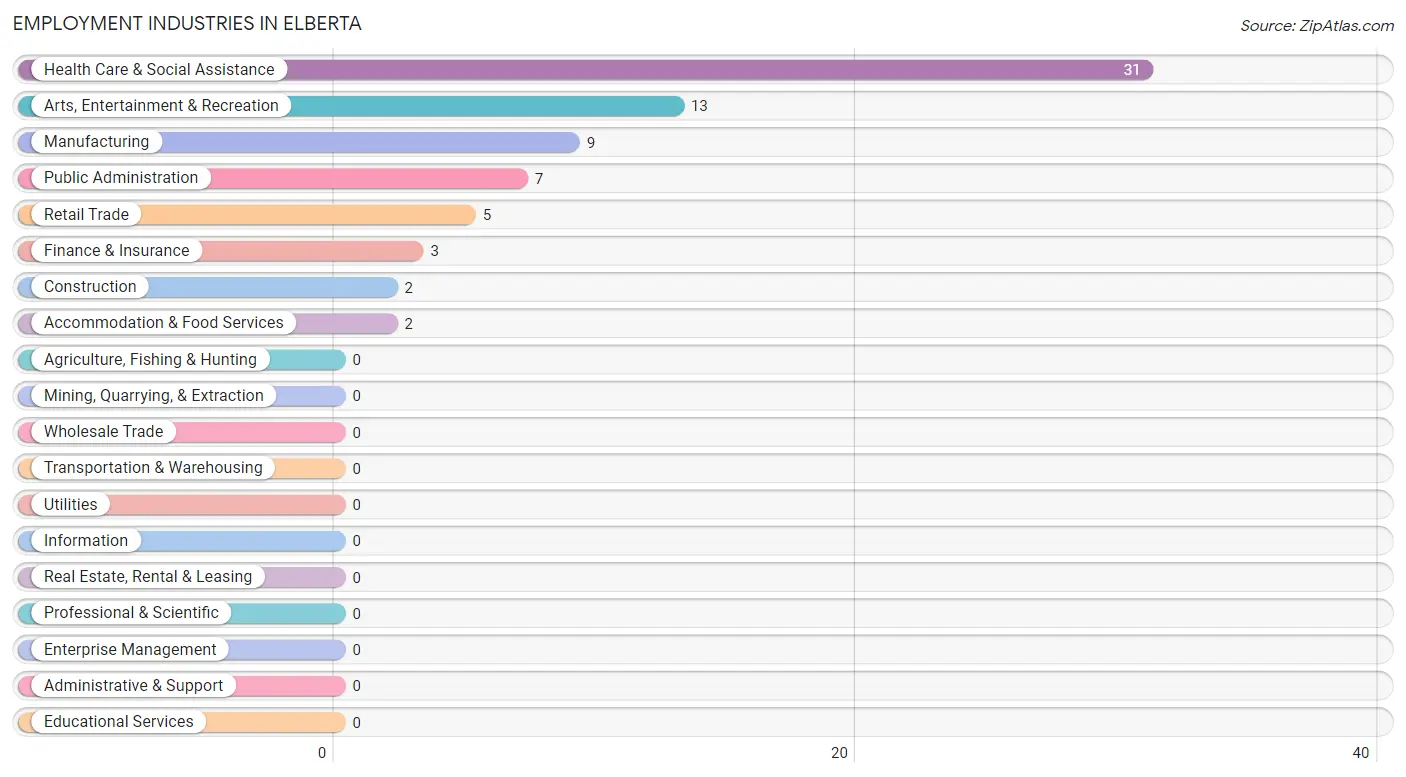
The major employment industries in Elberta include Health Care & Social Assistance (31 | 43.1%), Arts, Entertainment & Recreation (13 | 18.1%), Manufacturing (9 | 12.5%), Public Administration (7 | 9.7%), and Retail Trade (5 | 6.9%).
Employment Industries by Sex in Elberta
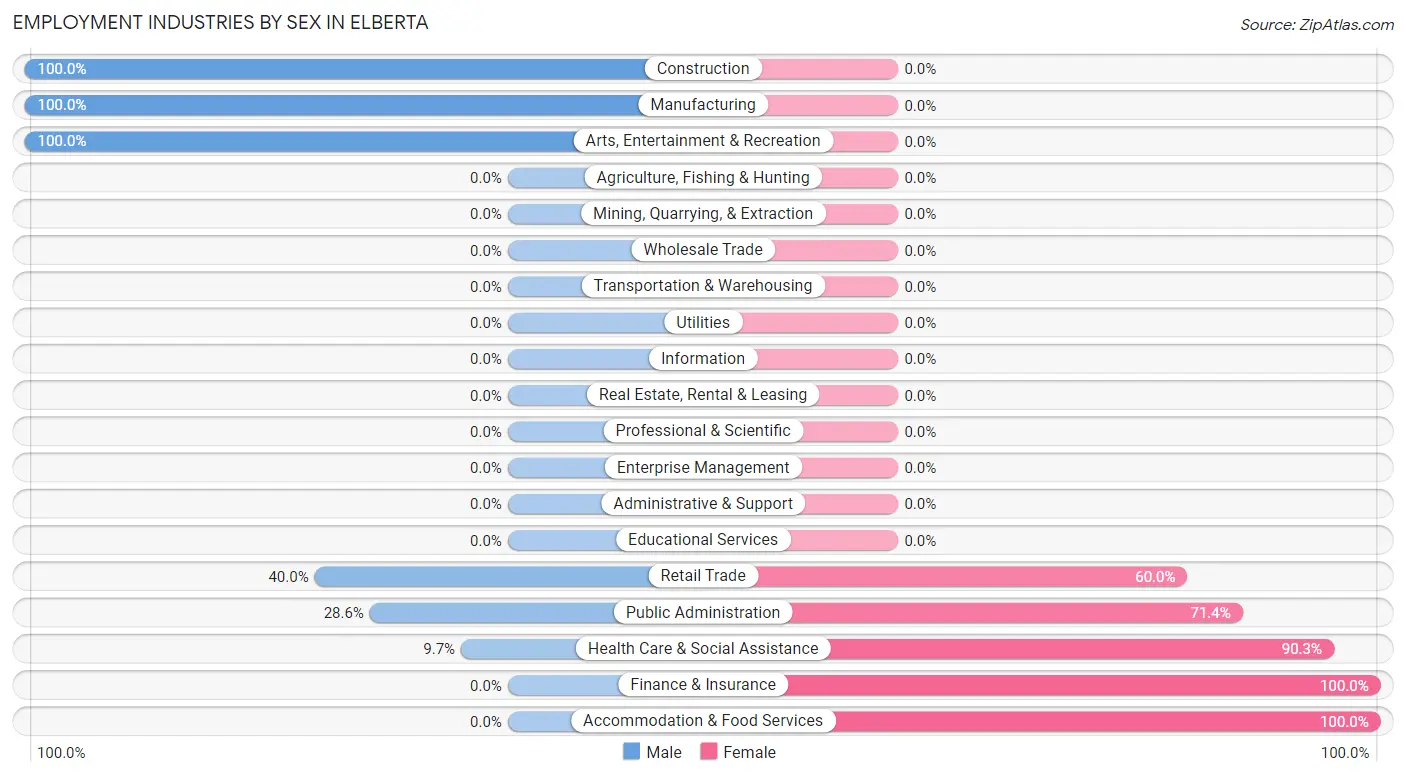
The Elberta industries that see more men than women are Construction (100.0%), Manufacturing (100.0%), and Arts, Entertainment & Recreation (100.0%), whereas the industries that tend to have a higher number of women are Finance & Insurance (100.0%), Accommodation & Food Services (100.0%), and Health Care & Social Assistance (90.3%).
| Industry | Male | Female |
| Agriculture, Fishing & Hunting | 0 (0.0%) | 0 (0.0%) |
| Mining, Quarrying, & Extraction | 0 (0.0%) | 0 (0.0%) |
| Construction | 2 (100.0%) | 0 (0.0%) |
| Manufacturing | 9 (100.0%) | 0 (0.0%) |
| Wholesale Trade | 0 (0.0%) | 0 (0.0%) |
| Retail Trade | 2 (40.0%) | 3 (60.0%) |
| Transportation & Warehousing | 0 (0.0%) | 0 (0.0%) |
| Utilities | 0 (0.0%) | 0 (0.0%) |
| Information | 0 (0.0%) | 0 (0.0%) |
| Finance & Insurance | 0 (0.0%) | 3 (100.0%) |
| Real Estate, Rental & Leasing | 0 (0.0%) | 0 (0.0%) |
| Professional & Scientific | 0 (0.0%) | 0 (0.0%) |
| Enterprise Management | 0 (0.0%) | 0 (0.0%) |
| Administrative & Support | 0 (0.0%) | 0 (0.0%) |
| Educational Services | 0 (0.0%) | 0 (0.0%) |
| Health Care & Social Assistance | 3 (9.7%) | 28 (90.3%) |
| Arts, Entertainment & Recreation | 13 (100.0%) | 0 (0.0%) |
| Accommodation & Food Services | 0 (0.0%) | 2 (100.0%) |
| Public Administration | 2 (28.6%) | 5 (71.4%) |
| Total | 31 (43.1%) | 41 (56.9%) |
Education in Elberta
School Enrollment in Elberta
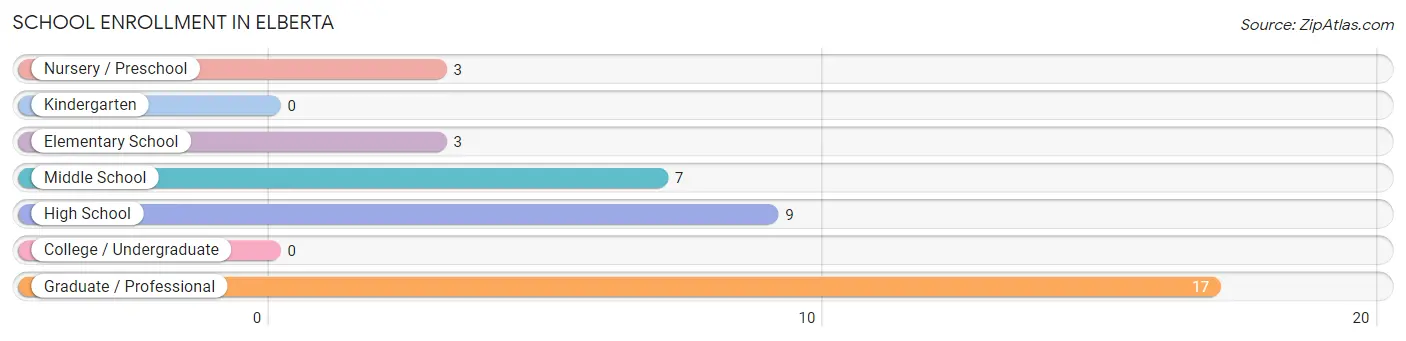
The most common levels of schooling among the 39 students in Elberta are graduate / professional (17 | 43.6%), high school (9 | 23.1%), and middle school (7 | 17.9%).
| School Level | # Students | % Students |
| Nursery / Preschool | 3 | 7.7% |
| Kindergarten | 0 | 0.0% |
| Elementary School | 3 | 7.7% |
| Middle School | 7 | 17.9% |
| High School | 9 | 23.1% |
| College / Undergraduate | 0 | 0.0% |
| Graduate / Professional | 17 | 43.6% |
| Total | 39 | 100.0% |
School Enrollment by Age by Funding Source in Elberta
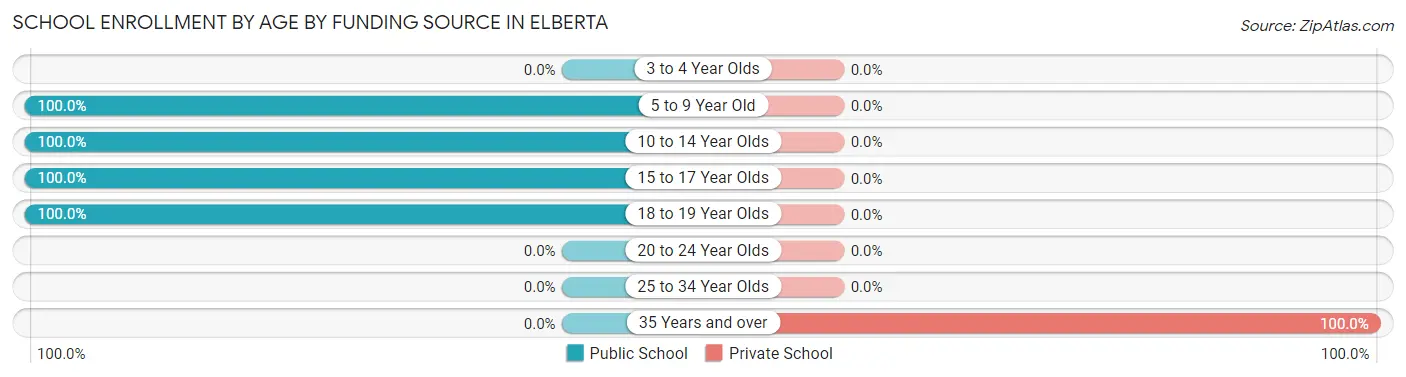
Out of a total of 39 students who are enrolled in schools in Elberta, 17 (43.6%) attend a private institution, while the remaining 22 (56.4%) are enrolled in public schools. The age group of 35 years and over has the highest likelihood of being enrolled in private schools, with 17 (100.0% in the age bracket) enrolled. Conversely, the age group of 5 to 9 year old has the lowest likelihood of being enrolled in a private school, with 6 (100.0% in the age bracket) attending a public institution.
| Age Bracket | Public School | Private School |
| 3 to 4 Year Olds | 0 (0.0%) | 0 (0.0%) |
| 5 to 9 Year Old | 6 (100.0%) | 0 (0.0%) |
| 10 to 14 Year Olds | 7 (100.0%) | 0 (0.0%) |
| 15 to 17 Year Olds | 6 (100.0%) | 0 (0.0%) |
| 18 to 19 Year Olds | 3 (100.0%) | 0 (0.0%) |
| 20 to 24 Year Olds | 0 (0.0%) | 0 (0.0%) |
| 25 to 34 Year Olds | 0 (0.0%) | 0 (0.0%) |
| 35 Years and over | 0 (0.0%) | 17 (100.0%) |
| Total | 22 (56.4%) | 17 (43.6%) |
Educational Attainment by Field of Study in Elberta
Education (41 | 56.2%), liberal arts & history (17 | 23.3%), science & technology (10 | 13.7%), literature & languages (3 | 4.1%), and engineering (2 | 2.7%) are the most common fields of study among 73 individuals in Elberta who have obtained a bachelor's degree or higher.
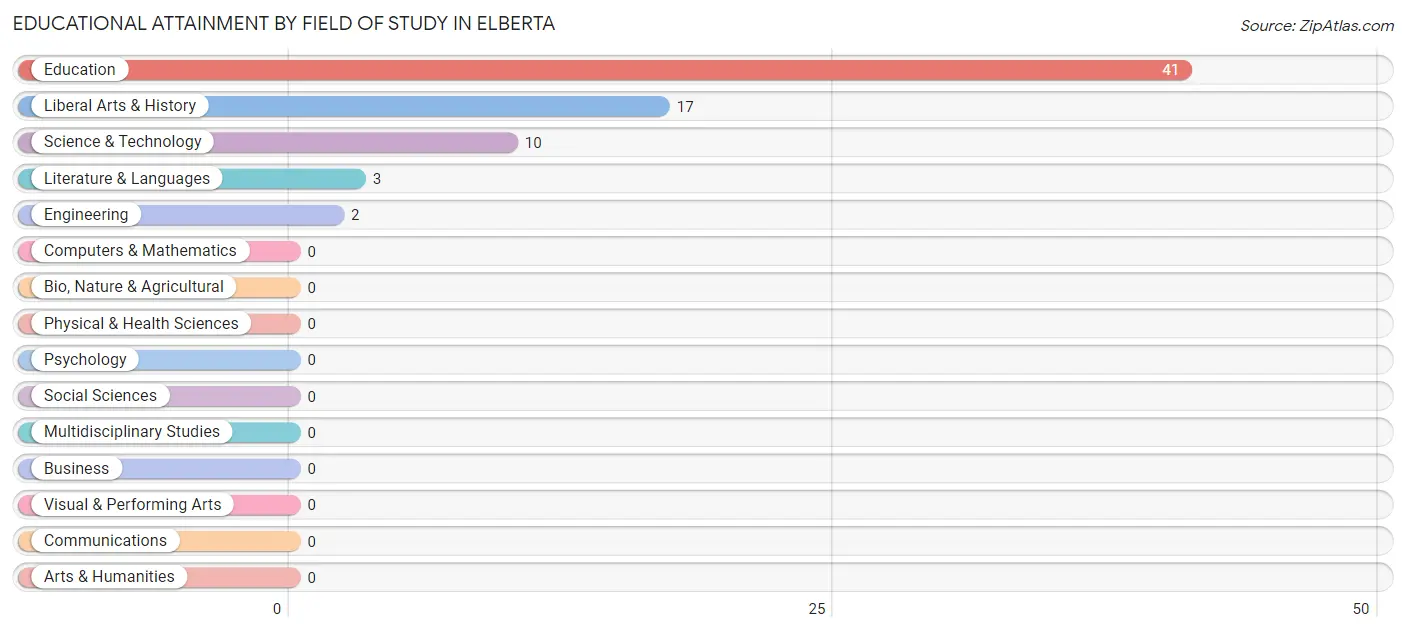
| Field of Study | # Graduates | % Graduates |
| Computers & Mathematics | 0 | 0.0% |
| Bio, Nature & Agricultural | 0 | 0.0% |
| Physical & Health Sciences | 0 | 0.0% |
| Psychology | 0 | 0.0% |
| Social Sciences | 0 | 0.0% |
| Engineering | 2 | 2.7% |
| Multidisciplinary Studies | 0 | 0.0% |
| Science & Technology | 10 | 13.7% |
| Business | 0 | 0.0% |
| Education | 41 | 56.2% |
| Literature & Languages | 3 | 4.1% |
| Liberal Arts & History | 17 | 23.3% |
| Visual & Performing Arts | 0 | 0.0% |
| Communications | 0 | 0.0% |
| Arts & Humanities | 0 | 0.0% |
| Total | 73 | 100.0% |
Transportation & Commute in Elberta
Vehicle Availability by Sex in Elberta
The most prevalent vehicle ownership categories in Elberta are males with 2 vehicles (16, accounting for 51.6%) and females with 2 vehicles (23, making up 42.1%).
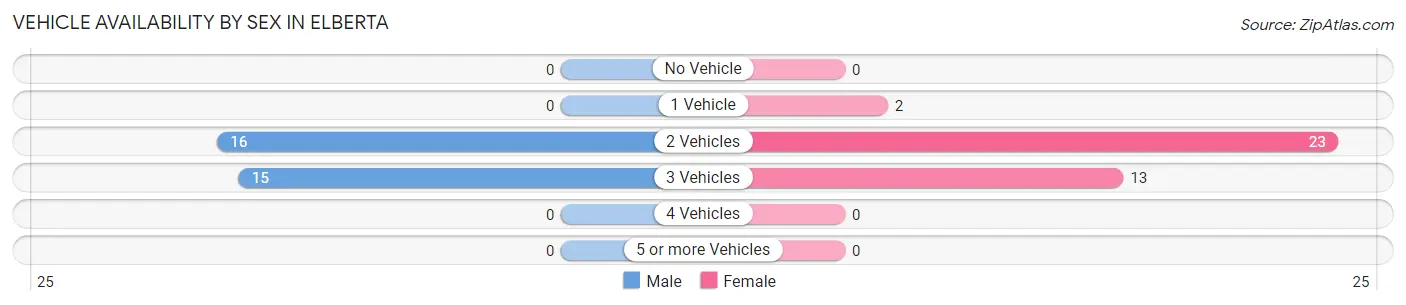
| Vehicles Available | Male | Female |
| No Vehicle | 0 (0.0%) | 0 (0.0%) |
| 1 Vehicle | 0 (0.0%) | 2 (5.3%) |
| 2 Vehicles | 16 (51.6%) | 23 (60.5%) |
| 3 Vehicles | 15 (48.4%) | 13 (34.2%) |
| 4 Vehicles | 0 (0.0%) | 0 (0.0%) |
| 5 or more Vehicles | 0 (0.0%) | 0 (0.0%) |
| Total | 31 (100.0%) | 38 (100.0%) |
Commute Time in Elberta
The most frequently occuring commute durations in Elberta are 5 to 9 minutes (22 commuters, 31.9%), 10 to 14 minutes (19 commuters, 27.5%), and 15 to 19 minutes (8 commuters, 11.6%).
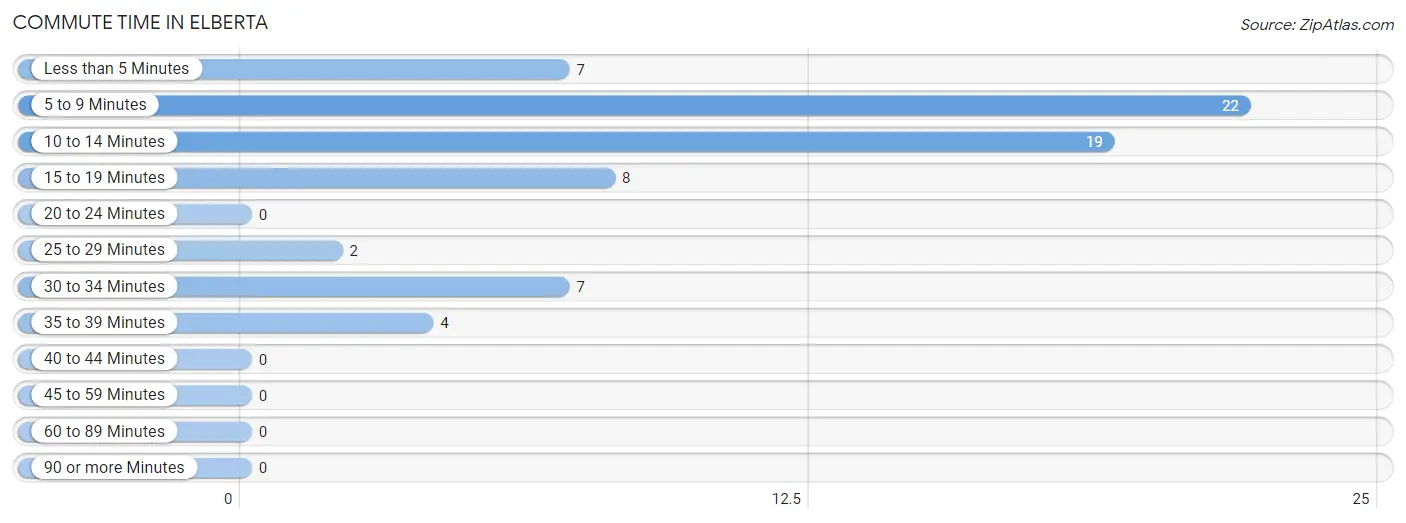
| Commute Time | # Commuters | % Commuters |
| Less than 5 Minutes | 7 | 10.1% |
| 5 to 9 Minutes | 22 | 31.9% |
| 10 to 14 Minutes | 19 | 27.5% |
| 15 to 19 Minutes | 8 | 11.6% |
| 20 to 24 Minutes | 0 | 0.0% |
| 25 to 29 Minutes | 2 | 2.9% |
| 30 to 34 Minutes | 7 | 10.1% |
| 35 to 39 Minutes | 4 | 5.8% |
| 40 to 44 Minutes | 0 | 0.0% |
| 45 to 59 Minutes | 0 | 0.0% |
| 60 to 89 Minutes | 0 | 0.0% |
| 90 or more Minutes | 0 | 0.0% |
Commute Time by Sex in Elberta
The most common commute times in Elberta are 10 to 14 minutes (16 commuters, 51.6%) for males and 5 to 9 minutes (20 commuters, 52.6%) for females.
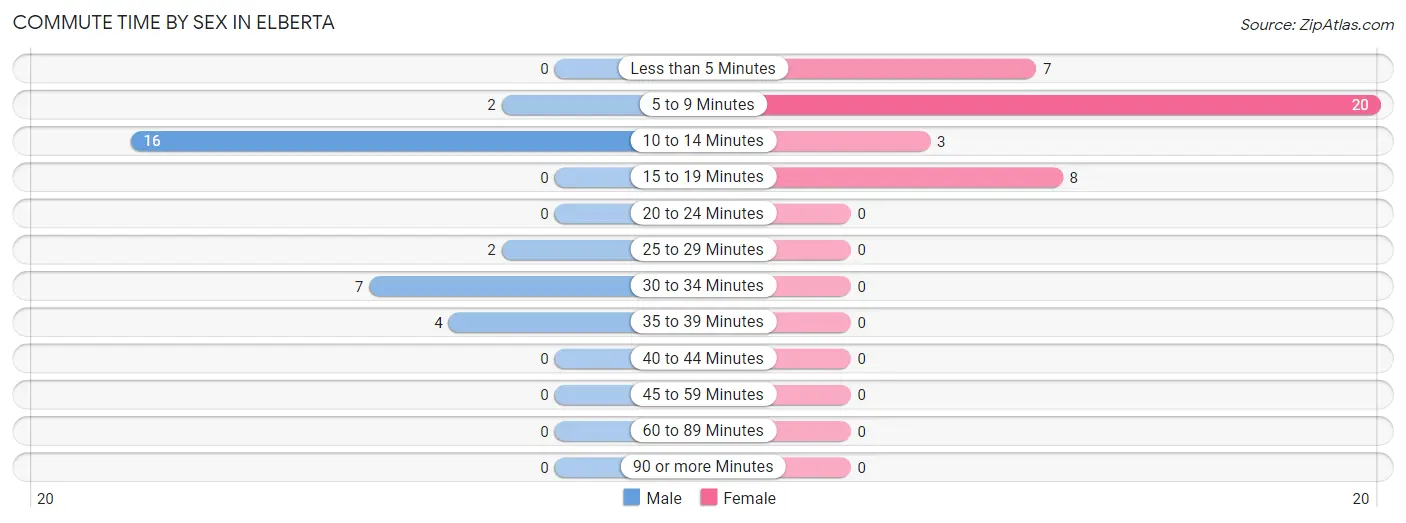
| Commute Time | Male | Female |
| Less than 5 Minutes | 0 (0.0%) | 7 (18.4%) |
| 5 to 9 Minutes | 2 (6.5%) | 20 (52.6%) |
| 10 to 14 Minutes | 16 (51.6%) | 3 (7.9%) |
| 15 to 19 Minutes | 0 (0.0%) | 8 (21.0%) |
| 20 to 24 Minutes | 0 (0.0%) | 0 (0.0%) |
| 25 to 29 Minutes | 2 (6.5%) | 0 (0.0%) |
| 30 to 34 Minutes | 7 (22.6%) | 0 (0.0%) |
| 35 to 39 Minutes | 4 (12.9%) | 0 (0.0%) |
| 40 to 44 Minutes | 0 (0.0%) | 0 (0.0%) |
| 45 to 59 Minutes | 0 (0.0%) | 0 (0.0%) |
| 60 to 89 Minutes | 0 (0.0%) | 0 (0.0%) |
| 90 or more Minutes | 0 (0.0%) | 0 (0.0%) |
Time of Departure to Work by Sex in Elberta
The most frequent times of departure to work in Elberta are 7:00 AM to 7:29 AM (23, 74.2%) for males and 8:00 AM to 8:29 AM (23, 60.5%) for females.
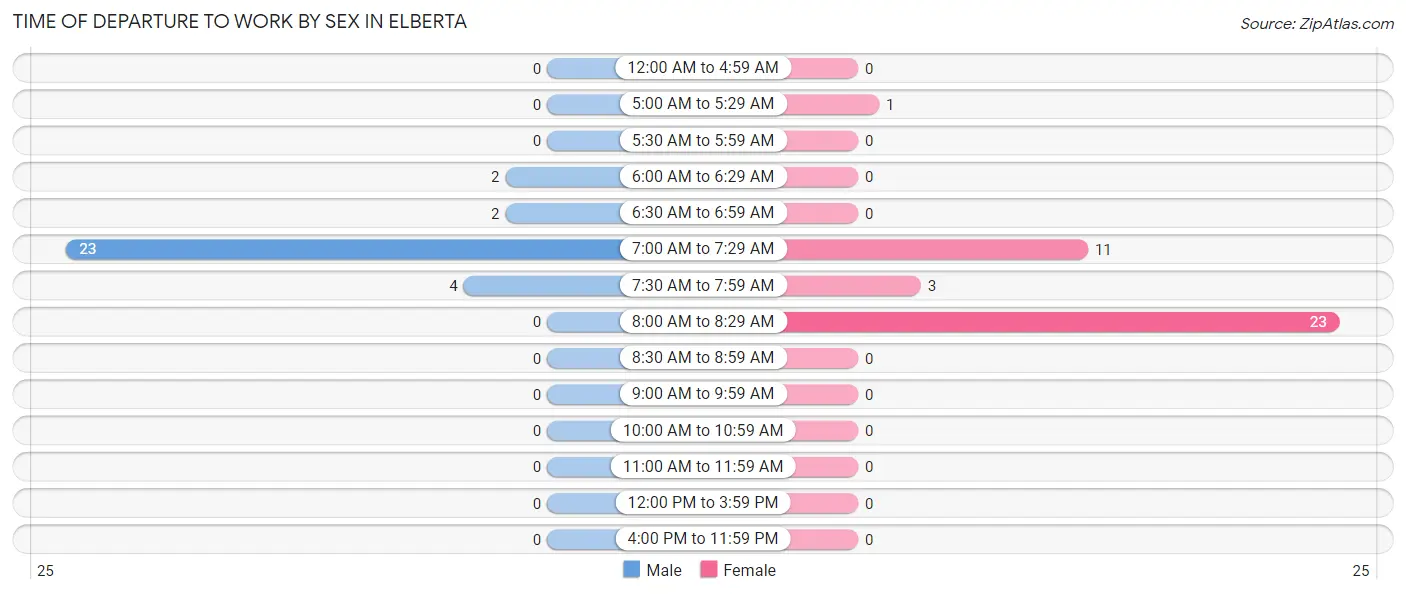
| Time of Departure | Male | Female |
| 12:00 AM to 4:59 AM | 0 (0.0%) | 0 (0.0%) |
| 5:00 AM to 5:29 AM | 0 (0.0%) | 1 (2.6%) |
| 5:30 AM to 5:59 AM | 0 (0.0%) | 0 (0.0%) |
| 6:00 AM to 6:29 AM | 2 (6.5%) | 0 (0.0%) |
| 6:30 AM to 6:59 AM | 2 (6.5%) | 0 (0.0%) |
| 7:00 AM to 7:29 AM | 23 (74.2%) | 11 (28.9%) |
| 7:30 AM to 7:59 AM | 4 (12.9%) | 3 (7.9%) |
| 8:00 AM to 8:29 AM | 0 (0.0%) | 23 (60.5%) |
| 8:30 AM to 8:59 AM | 0 (0.0%) | 0 (0.0%) |
| 9:00 AM to 9:59 AM | 0 (0.0%) | 0 (0.0%) |
| 10:00 AM to 10:59 AM | 0 (0.0%) | 0 (0.0%) |
| 11:00 AM to 11:59 AM | 0 (0.0%) | 0 (0.0%) |
| 12:00 PM to 3:59 PM | 0 (0.0%) | 0 (0.0%) |
| 4:00 PM to 11:59 PM | 0 (0.0%) | 0 (0.0%) |
| Total | 31 (100.0%) | 38 (100.0%) |
Housing Occupancy in Elberta
Occupancy by Ownership in Elberta
Of the total 72 dwellings in Elberta, owner-occupied units account for 67 (93.1%), while renter-occupied units make up 5 (6.9%).
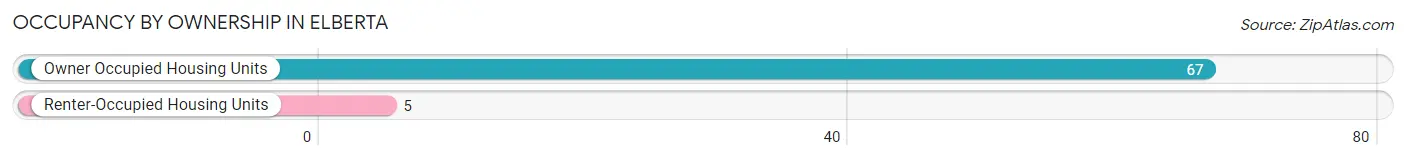
| Occupancy | # Housing Units | % Housing Units |
| Owner Occupied Housing Units | 67 | 93.1% |
| Renter-Occupied Housing Units | 5 | 6.9% |
| Total Occupied Housing Units | 72 | 100.0% |
Occupancy by Household Size in Elberta
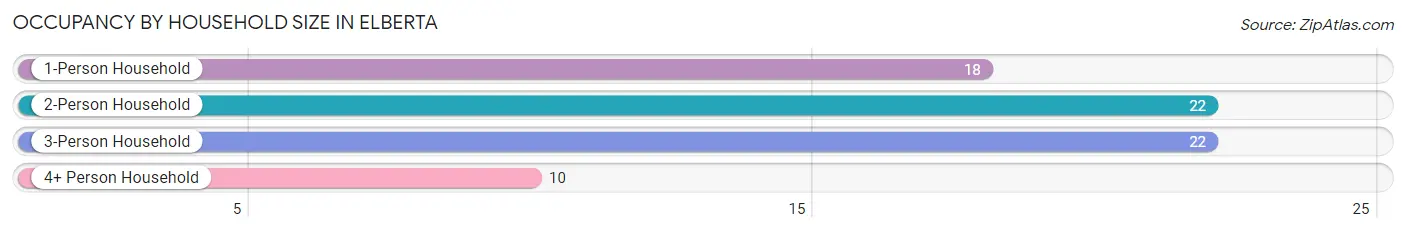
| Household Size | # Housing Units | % Housing Units |
| 1-Person Household | 18 | 25.0% |
| 2-Person Household | 22 | 30.6% |
| 3-Person Household | 22 | 30.6% |
| 4+ Person Household | 10 | 13.9% |
| Total Housing Units | 72 | 100.0% |
Occupancy by Ownership by Household Size in Elberta
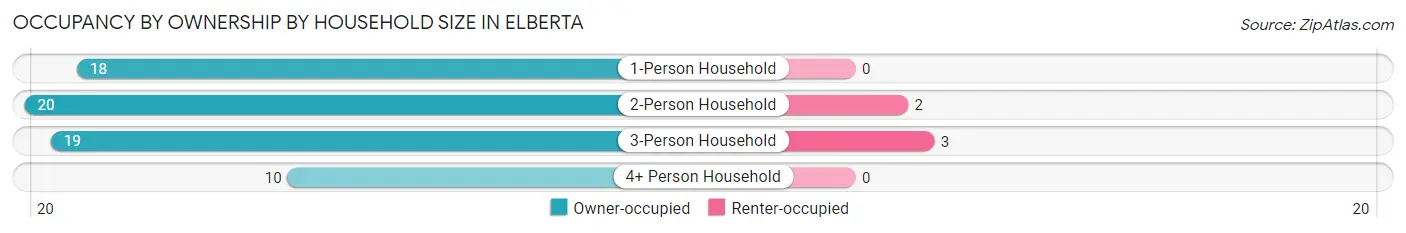
| Household Size | Owner-occupied | Renter-occupied |
| 1-Person Household | 18 (100.0%) | 0 (0.0%) |
| 2-Person Household | 20 (90.9%) | 2 (9.1%) |
| 3-Person Household | 19 (86.4%) | 3 (13.6%) |
| 4+ Person Household | 10 (100.0%) | 0 (0.0%) |
| Total Housing Units | 67 (93.1%) | 5 (6.9%) |
Occupancy by Educational Attainment in Elberta
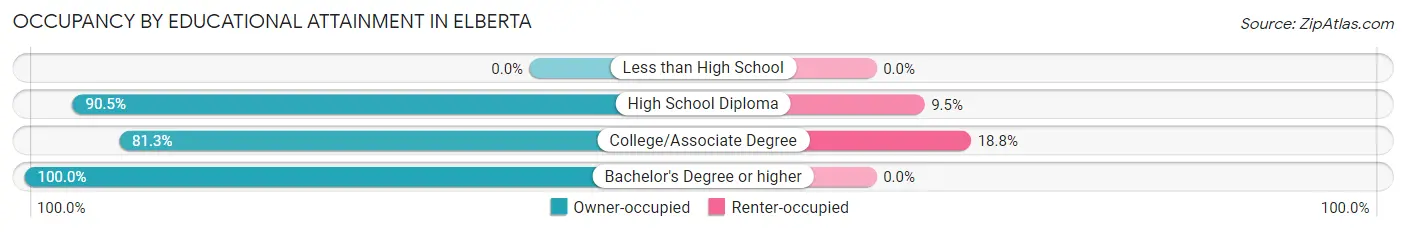
| Household Size | Owner-occupied | Renter-occupied |
| Less than High School | 0 (0.0%) | 0 (0.0%) |
| High School Diploma | 19 (90.5%) | 2 (9.5%) |
| College/Associate Degree | 13 (81.2%) | 3 (18.8%) |
| Bachelor's Degree or higher | 35 (100.0%) | 0 (0.0%) |
Occupancy by Age of Householder in Elberta
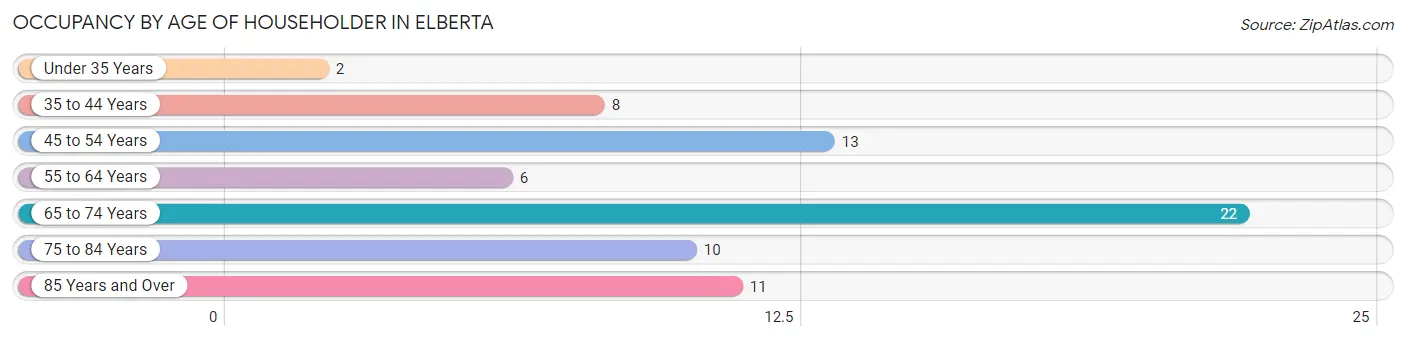
| Age Bracket | # Households | % Households |
| Under 35 Years | 2 | 2.8% |
| 35 to 44 Years | 8 | 11.1% |
| 45 to 54 Years | 13 | 18.1% |
| 55 to 64 Years | 6 | 8.3% |
| 65 to 74 Years | 22 | 30.6% |
| 75 to 84 Years | 10 | 13.9% |
| 85 Years and Over | 11 | 15.3% |
| Total | 72 | 100.0% |
Housing Finances in Elberta
Median Income by Occupancy in Elberta
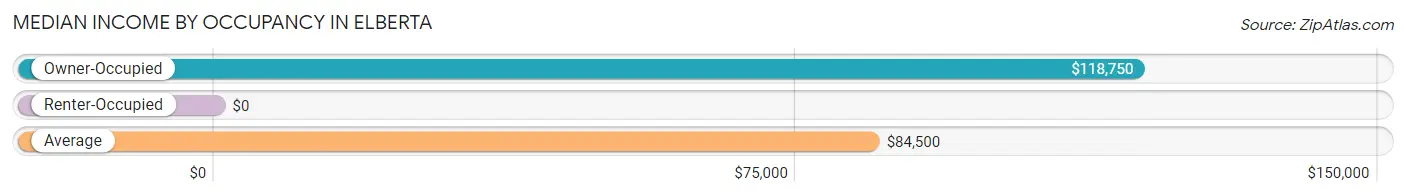
| Occupancy Type | # Households | Median Income |
| Owner-Occupied | 67 (93.1%) | $118,750 |
| Renter-Occupied | 5 (6.9%) | $0 |
| Average | 72 (100.0%) | $84,500 |
Occupancy by Householder Income Bracket in Elberta
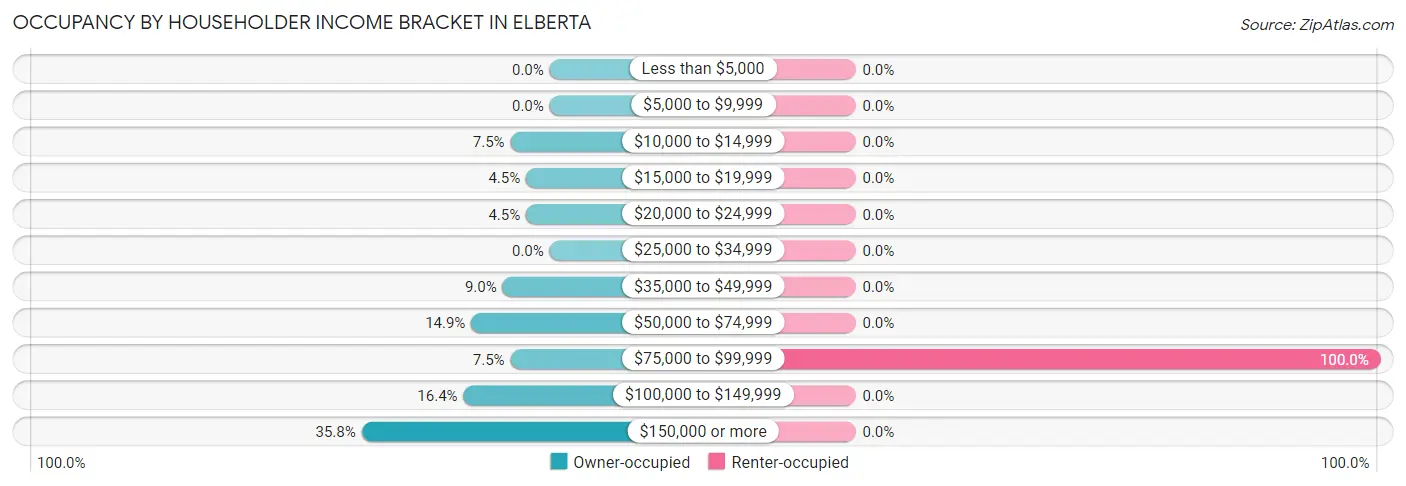
| Income Bracket | Owner-occupied | Renter-occupied |
| Less than $5,000 | 0 (0.0%) | 0 (0.0%) |
| $5,000 to $9,999 | 0 (0.0%) | 0 (0.0%) |
| $10,000 to $14,999 | 5 (7.5%) | 0 (0.0%) |
| $15,000 to $19,999 | 3 (4.5%) | 0 (0.0%) |
| $20,000 to $24,999 | 3 (4.5%) | 0 (0.0%) |
| $25,000 to $34,999 | 0 (0.0%) | 0 (0.0%) |
| $35,000 to $49,999 | 6 (9.0%) | 0 (0.0%) |
| $50,000 to $74,999 | 10 (14.9%) | 0 (0.0%) |
| $75,000 to $99,999 | 5 (7.5%) | 5 (100.0%) |
| $100,000 to $149,999 | 11 (16.4%) | 0 (0.0%) |
| $150,000 or more | 24 (35.8%) | 0 (0.0%) |
| Total | 67 (100.0%) | 5 (100.0%) |
Monthly Housing Cost Tiers in Elberta
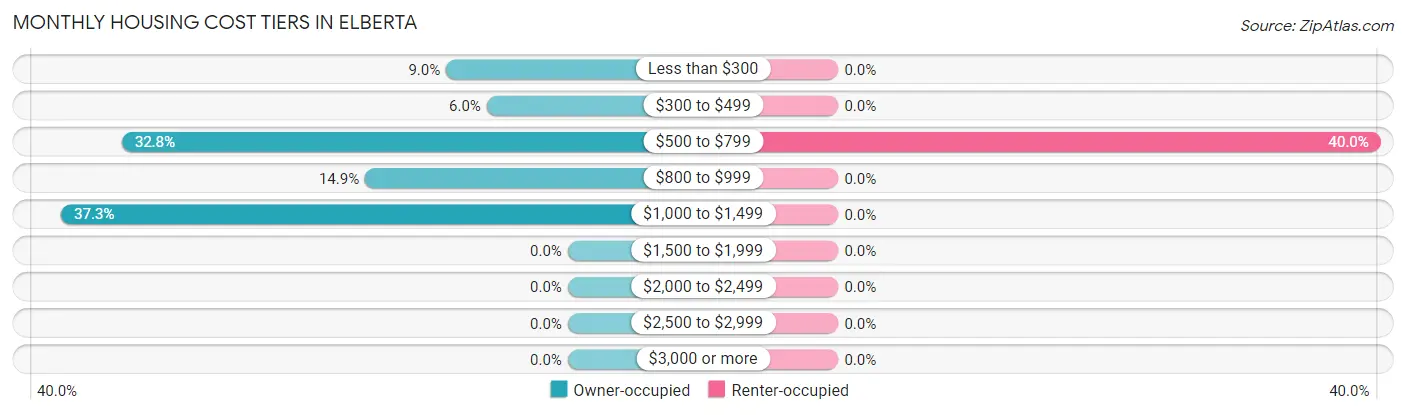
| Monthly Cost | Owner-occupied | Renter-occupied |
| Less than $300 | 6 (9.0%) | 0 (0.0%) |
| $300 to $499 | 4 (6.0%) | 0 (0.0%) |
| $500 to $799 | 22 (32.8%) | 2 (40.0%) |
| $800 to $999 | 10 (14.9%) | 0 (0.0%) |
| $1,000 to $1,499 | 25 (37.3%) | 0 (0.0%) |
| $1,500 to $1,999 | 0 (0.0%) | 0 (0.0%) |
| $2,000 to $2,499 | 0 (0.0%) | 0 (0.0%) |
| $2,500 to $2,999 | 0 (0.0%) | 0 (0.0%) |
| $3,000 or more | 0 (0.0%) | 0 (0.0%) |
| Total | 67 (100.0%) | 5 (100.0%) |
Physical Housing Characteristics in Elberta
Housing Structures in Elberta
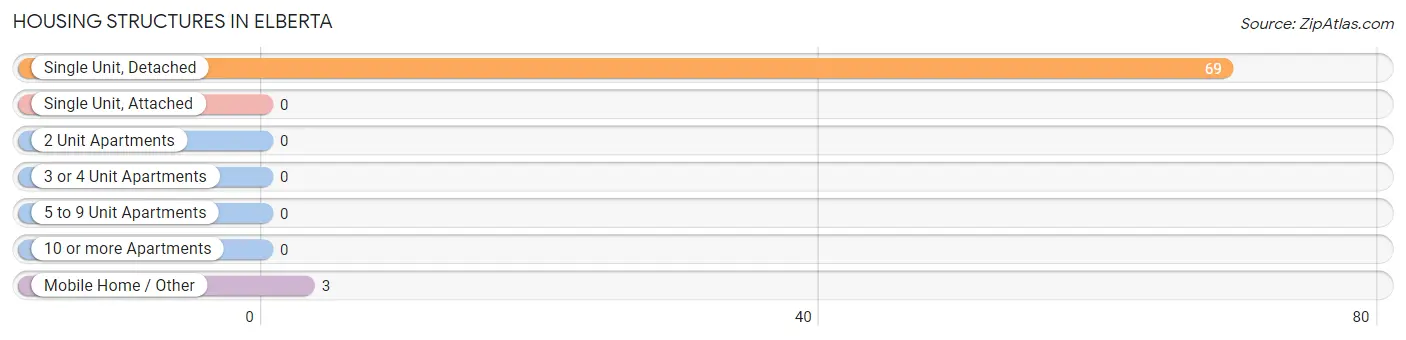
| Structure Type | # Housing Units | % Housing Units |
| Single Unit, Detached | 69 | 95.8% |
| Single Unit, Attached | 0 | 0.0% |
| 2 Unit Apartments | 0 | 0.0% |
| 3 or 4 Unit Apartments | 0 | 0.0% |
| 5 to 9 Unit Apartments | 0 | 0.0% |
| 10 or more Apartments | 0 | 0.0% |
| Mobile Home / Other | 3 | 4.2% |
| Total | 72 | 100.0% |
Housing Structures by Occupancy in Elberta
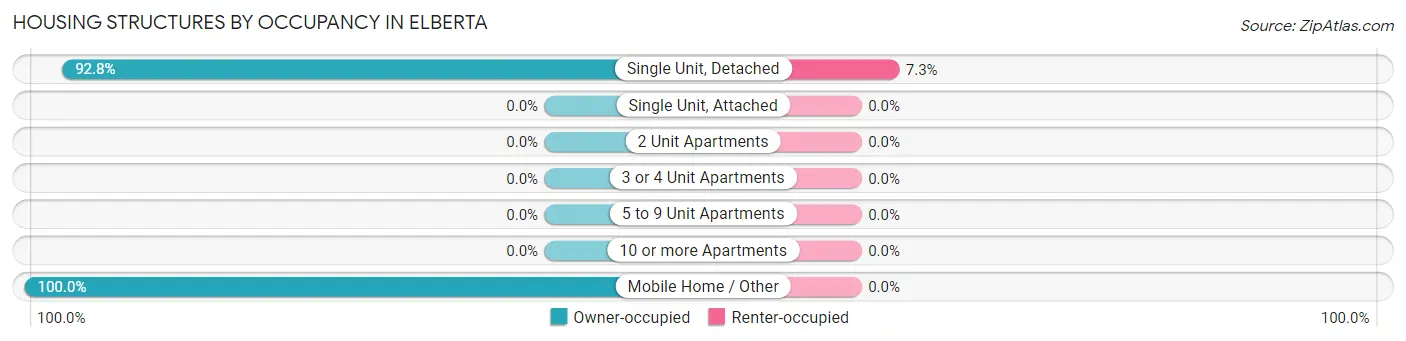
| Structure Type | Owner-occupied | Renter-occupied |
| Single Unit, Detached | 64 (92.7%) | 5 (7.2%) |
| Single Unit, Attached | 0 (0.0%) | 0 (0.0%) |
| 2 Unit Apartments | 0 (0.0%) | 0 (0.0%) |
| 3 or 4 Unit Apartments | 0 (0.0%) | 0 (0.0%) |
| 5 to 9 Unit Apartments | 0 (0.0%) | 0 (0.0%) |
| 10 or more Apartments | 0 (0.0%) | 0 (0.0%) |
| Mobile Home / Other | 3 (100.0%) | 0 (0.0%) |
| Total | 67 (93.1%) | 5 (6.9%) |
Housing Structures by Number of Rooms in Elberta
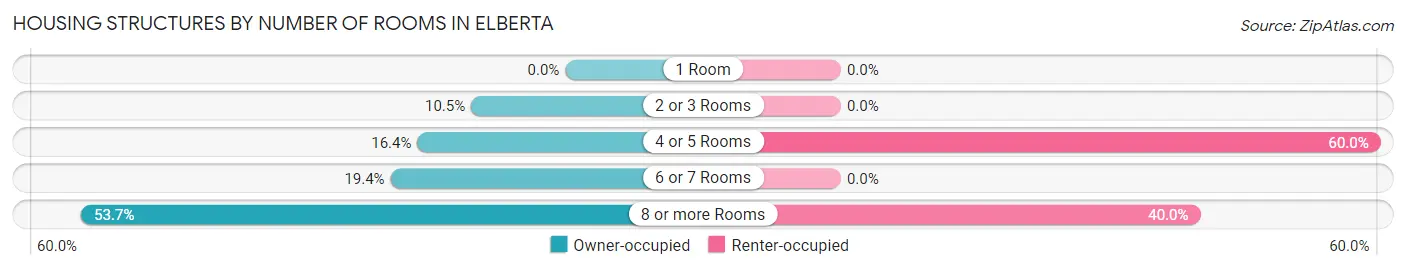
| Number of Rooms | Owner-occupied | Renter-occupied |
| 1 Room | 0 (0.0%) | 0 (0.0%) |
| 2 or 3 Rooms | 7 (10.4%) | 0 (0.0%) |
| 4 or 5 Rooms | 11 (16.4%) | 3 (60.0%) |
| 6 or 7 Rooms | 13 (19.4%) | 0 (0.0%) |
| 8 or more Rooms | 36 (53.7%) | 2 (40.0%) |
| Total | 67 (100.0%) | 5 (100.0%) |
Housing Structure by Heating Type in Elberta
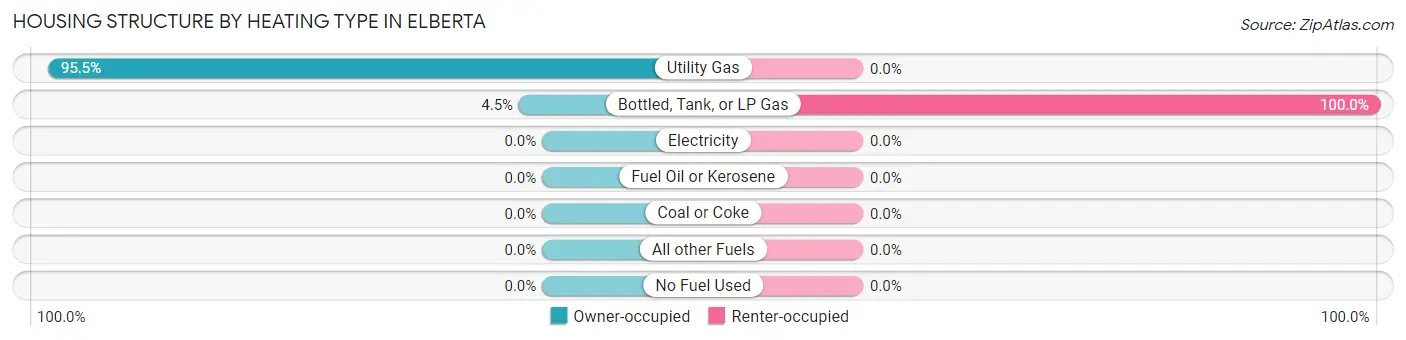
| Heating Type | Owner-occupied | Renter-occupied |
| Utility Gas | 64 (95.5%) | 0 (0.0%) |
| Bottled, Tank, or LP Gas | 3 (4.5%) | 5 (100.0%) |
| Electricity | 0 (0.0%) | 0 (0.0%) |
| Fuel Oil or Kerosene | 0 (0.0%) | 0 (0.0%) |
| Coal or Coke | 0 (0.0%) | 0 (0.0%) |
| All other Fuels | 0 (0.0%) | 0 (0.0%) |
| No Fuel Used | 0 (0.0%) | 0 (0.0%) |
| Total | 67 (100.0%) | 5 (100.0%) |
Household Vehicle Usage in Elberta
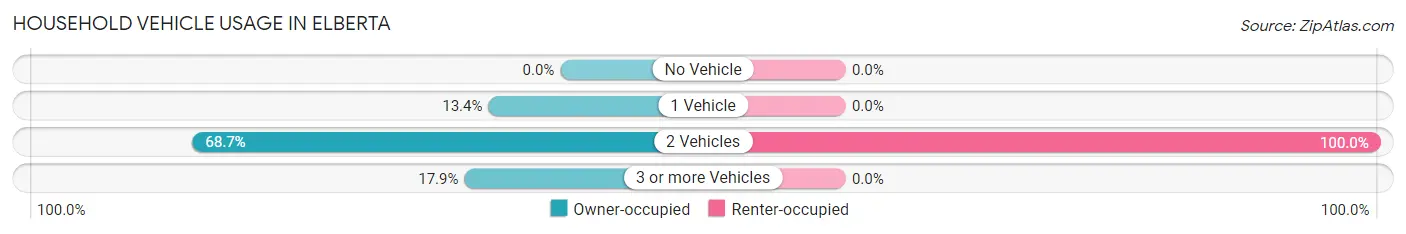
| Vehicles per Household | Owner-occupied | Renter-occupied |
| No Vehicle | 0 (0.0%) | 0 (0.0%) |
| 1 Vehicle | 9 (13.4%) | 0 (0.0%) |
| 2 Vehicles | 46 (68.7%) | 5 (100.0%) |
| 3 or more Vehicles | 12 (17.9%) | 0 (0.0%) |
| Total | 67 (100.0%) | 5 (100.0%) |
Real Estate & Mortgages in Elberta
Real Estate and Mortgage Overview in Elberta
| Characteristic | Without Mortgage | With Mortgage |
| Housing Units | 29 | 38 |
| Median Property Value | $267,500 | $214,700 |
| Median Household Income | $120,156 | $17 |
| Monthly Housing Costs | $644 | $0 |
| Real Estate Taxes | $3,318 | $2 |
Property Value by Mortgage Status in Elberta
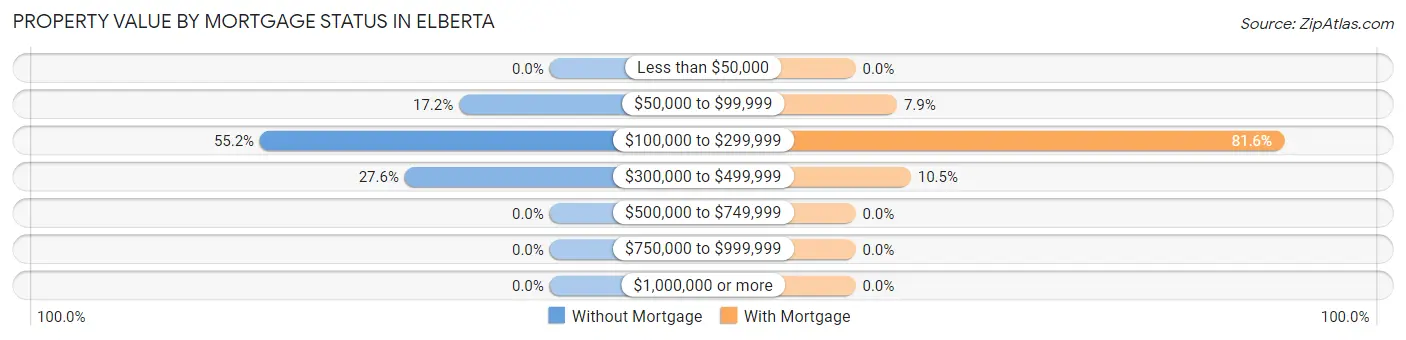
| Property Value | Without Mortgage | With Mortgage |
| Less than $50,000 | 0 (0.0%) | 0 (0.0%) |
| $50,000 to $99,999 | 5 (17.2%) | 3 (7.9%) |
| $100,000 to $299,999 | 16 (55.2%) | 31 (81.6%) |
| $300,000 to $499,999 | 8 (27.6%) | 4 (10.5%) |
| $500,000 to $749,999 | 0 (0.0%) | 0 (0.0%) |
| $750,000 to $999,999 | 0 (0.0%) | 0 (0.0%) |
| $1,000,000 or more | 0 (0.0%) | 0 (0.0%) |
| Total | 29 (100.0%) | 38 (100.0%) |
Household Income by Mortgage Status in Elberta
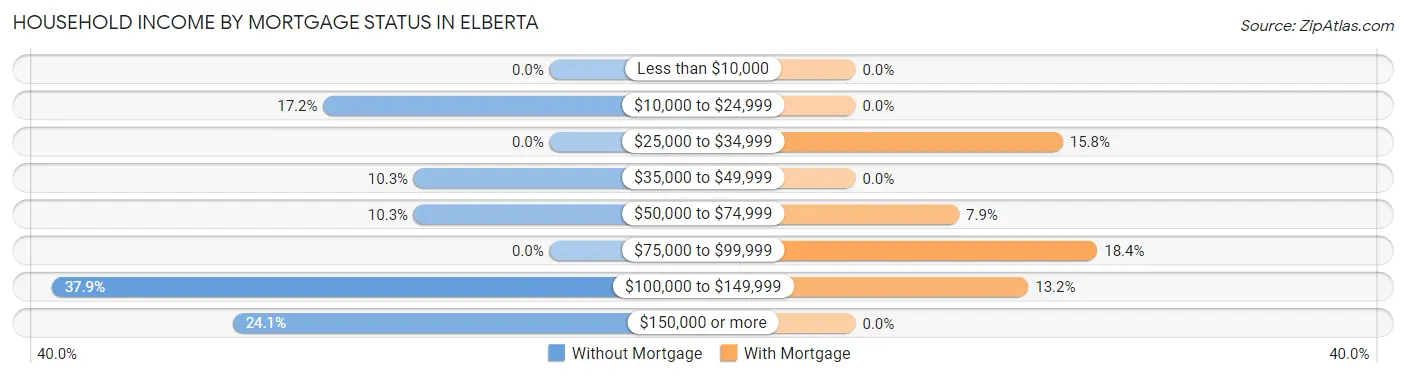
| Household Income | Without Mortgage | With Mortgage |
| Less than $10,000 | 0 (0.0%) | 0 (0.0%) |
| $10,000 to $24,999 | 5 (17.2%) | 0 (0.0%) |
| $25,000 to $34,999 | 0 (0.0%) | 6 (15.8%) |
| $35,000 to $49,999 | 3 (10.3%) | 0 (0.0%) |
| $50,000 to $74,999 | 3 (10.3%) | 3 (7.9%) |
| $75,000 to $99,999 | 0 (0.0%) | 7 (18.4%) |
| $100,000 to $149,999 | 11 (37.9%) | 5 (13.2%) |
| $150,000 or more | 7 (24.1%) | 0 (0.0%) |
| Total | 29 (100.0%) | 38 (100.0%) |
Property Value to Household Income Ratio in Elberta
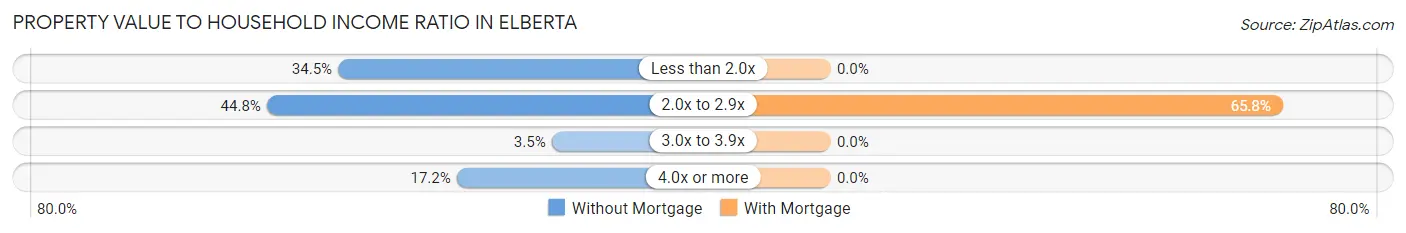
| Value-to-Income Ratio | Without Mortgage | With Mortgage |
| Less than 2.0x | 10 (34.5%) | 0 (0.0%) |
| 2.0x to 2.9x | 13 (44.8%) | 25 (65.8%) |
| 3.0x to 3.9x | 1 (3.5%) | 0 (0.0%) |
| 4.0x or more | 5 (17.2%) | 0 (0.0%) |
| Total | 29 (100.0%) | 38 (100.0%) |
Real Estate Taxes by Mortgage Status in Elberta
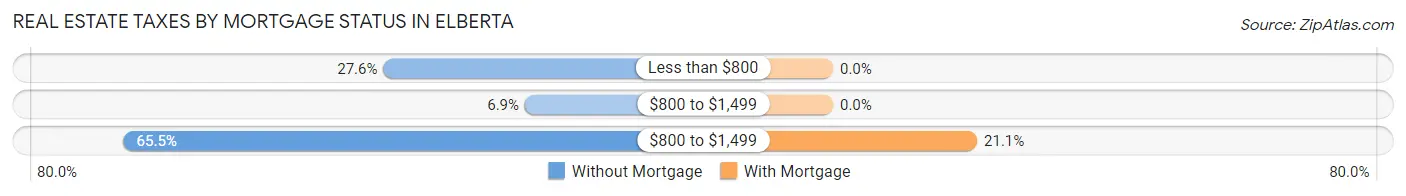
| Property Taxes | Without Mortgage | With Mortgage |
| Less than $800 | 8 (27.6%) | 0 (0.0%) |
| $800 to $1,499 | 2 (6.9%) | 0 (0.0%) |
| $800 to $1,499 | 19 (65.5%) | 8 (21.0%) |
| Total | 29 (100.0%) | 38 (100.0%) |
Health & Disability in Elberta
Health Insurance Coverage by Age in Elberta
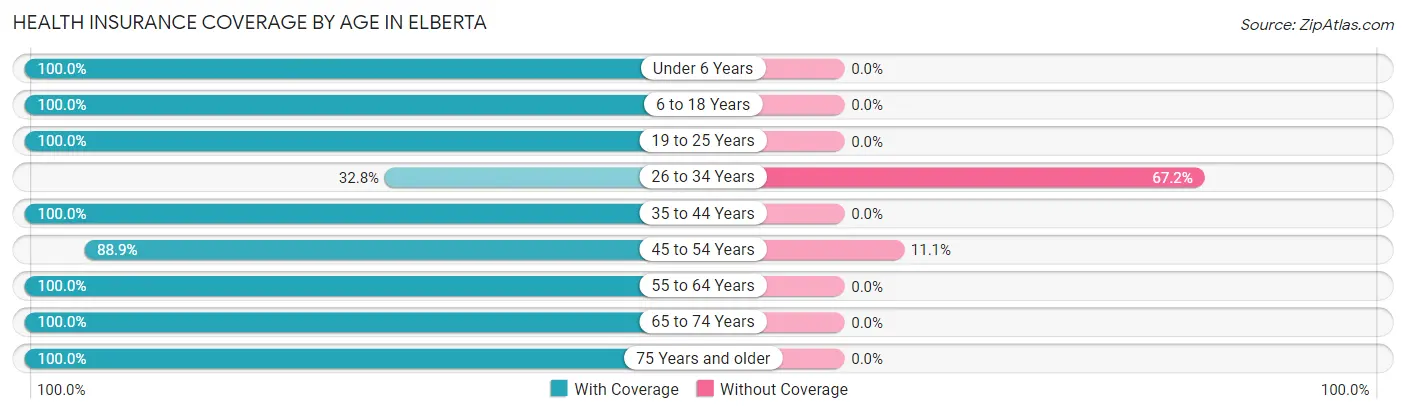
| Age Bracket | With Coverage | Without Coverage |
| Under 6 Years | 15 (100.0%) | 0 (0.0%) |
| 6 to 18 Years | 19 (100.0%) | 0 (0.0%) |
| 19 to 25 Years | 3 (100.0%) | 0 (0.0%) |
| 26 to 34 Years | 21 (32.8%) | 43 (67.2%) |
| 35 to 44 Years | 18 (100.0%) | 0 (0.0%) |
| 45 to 54 Years | 16 (88.9%) | 2 (11.1%) |
| 55 to 64 Years | 11 (100.0%) | 0 (0.0%) |
| 65 to 74 Years | 40 (100.0%) | 0 (0.0%) |
| 75 Years and older | 37 (100.0%) | 0 (0.0%) |
| Total | 180 (80.0%) | 45 (20.0%) |
Health Insurance Coverage by Citizenship Status in Elberta
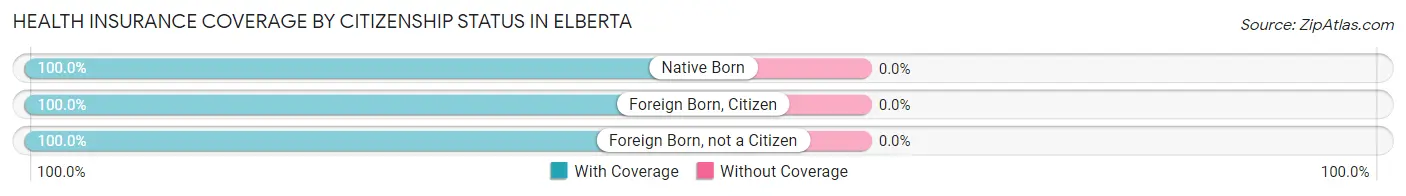
| Citizenship Status | With Coverage | Without Coverage |
| Native Born | 15 (100.0%) | 0 (0.0%) |
| Foreign Born, Citizen | 19 (100.0%) | 0 (0.0%) |
| Foreign Born, not a Citizen | 3 (100.0%) | 0 (0.0%) |
Health Insurance Coverage by Household Income in Elberta
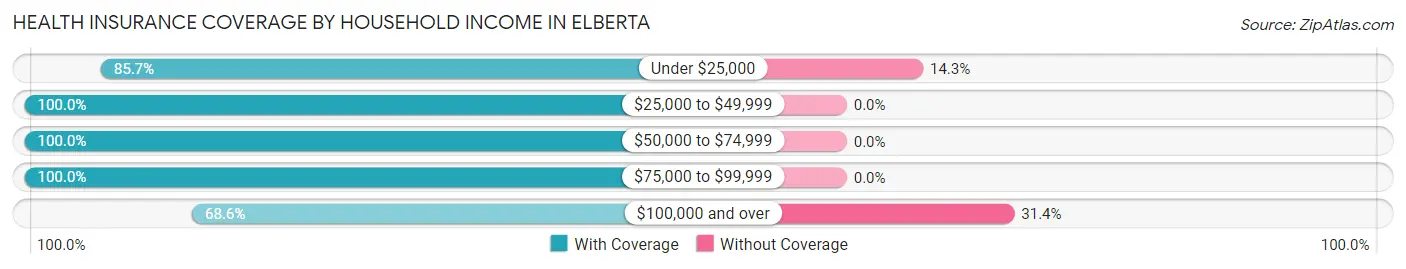
| Household Income | With Coverage | Without Coverage |
| Under $25,000 | 12 (85.7%) | 2 (14.3%) |
| $25,000 to $49,999 | 9 (100.0%) | 0 (0.0%) |
| $50,000 to $74,999 | 23 (100.0%) | 0 (0.0%) |
| $75,000 to $99,999 | 42 (100.0%) | 0 (0.0%) |
| $100,000 and over | 94 (68.6%) | 43 (31.4%) |
Public vs Private Health Insurance Coverage by Age in Elberta
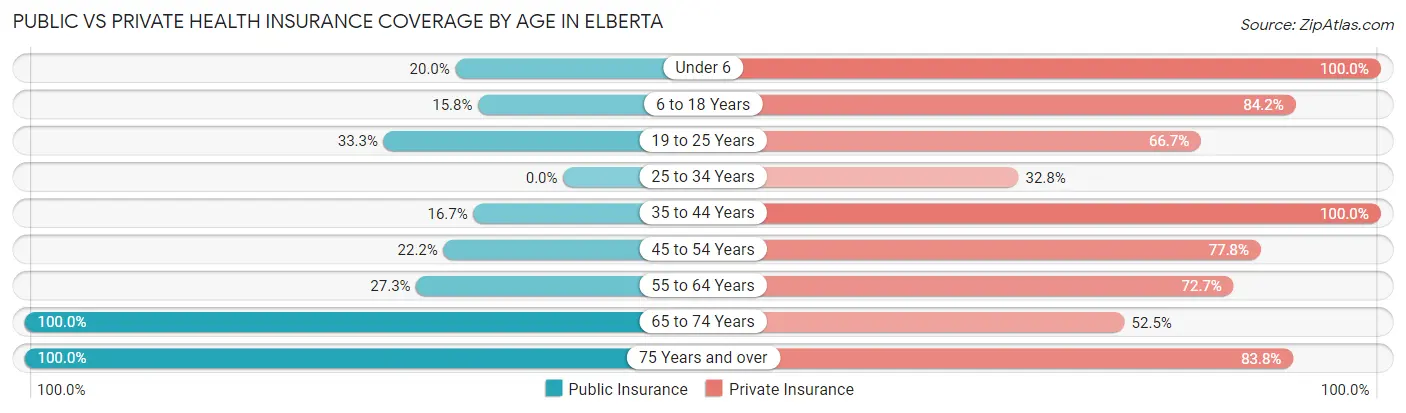
| Age Bracket | Public Insurance | Private Insurance |
| Under 6 | 3 (20.0%) | 15 (100.0%) |
| 6 to 18 Years | 3 (15.8%) | 16 (84.2%) |
| 19 to 25 Years | 1 (33.3%) | 2 (66.7%) |
| 25 to 34 Years | 0 (0.0%) | 21 (32.8%) |
| 35 to 44 Years | 3 (16.7%) | 18 (100.0%) |
| 45 to 54 Years | 4 (22.2%) | 14 (77.8%) |
| 55 to 64 Years | 3 (27.3%) | 8 (72.7%) |
| 65 to 74 Years | 40 (100.0%) | 21 (52.5%) |
| 75 Years and over | 37 (100.0%) | 31 (83.8%) |
| Total | 94 (41.8%) | 146 (64.9%) |
Disability Status by Sex by Age in Elberta
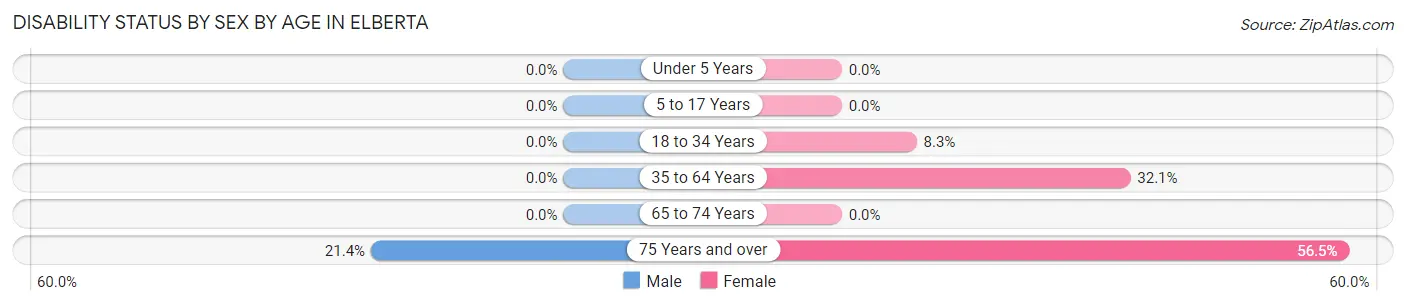
| Age Bracket | Male | Female |
| Under 5 Years | 0 (0.0%) | 0 (0.0%) |
| 5 to 17 Years | 0 (0.0%) | 0 (0.0%) |
| 18 to 34 Years | 0 (0.0%) | 1 (8.3%) |
| 35 to 64 Years | 0 (0.0%) | 9 (32.1%) |
| 65 to 74 Years | 0 (0.0%) | 0 (0.0%) |
| 75 Years and over | 3 (21.4%) | 13 (56.5%) |
Disability Class by Sex by Age in Elberta
Disability Class: Hearing Difficulty
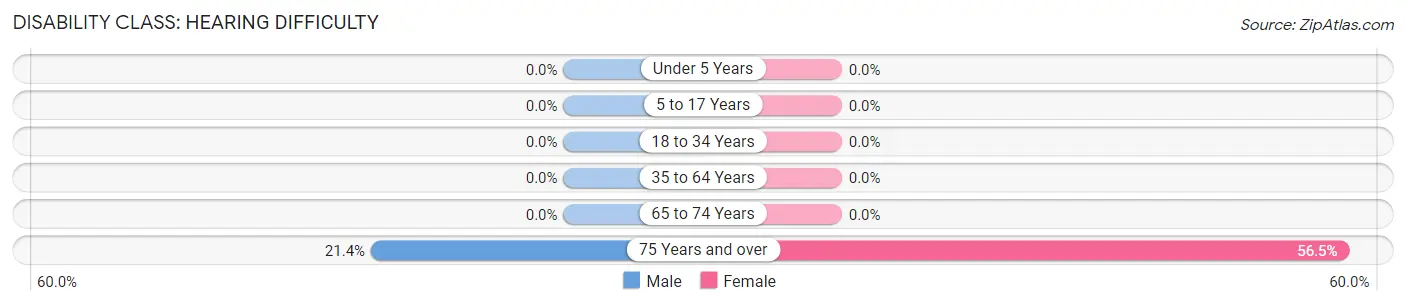
| Age Bracket | Male | Female |
| Under 5 Years | 0 (0.0%) | 0 (0.0%) |
| 5 to 17 Years | 0 (0.0%) | 0 (0.0%) |
| 18 to 34 Years | 0 (0.0%) | 0 (0.0%) |
| 35 to 64 Years | 0 (0.0%) | 0 (0.0%) |
| 65 to 74 Years | 0 (0.0%) | 0 (0.0%) |
| 75 Years and over | 3 (21.4%) | 13 (56.5%) |
Disability Class: Vision Difficulty
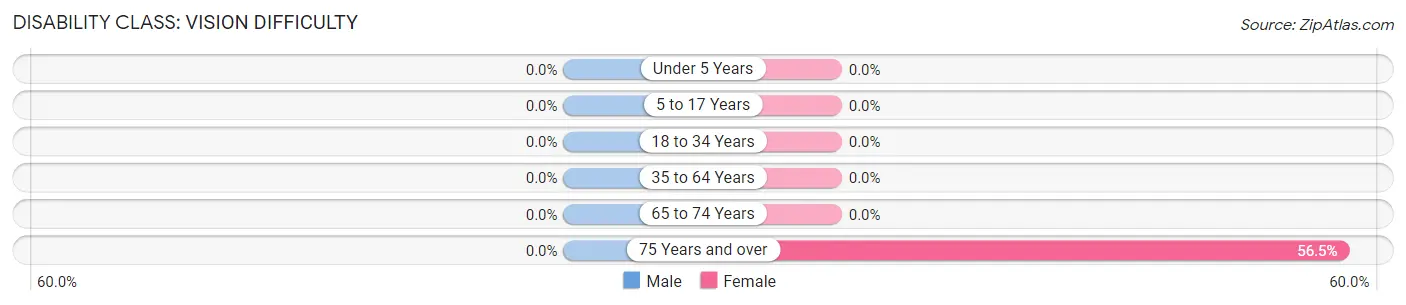
| Age Bracket | Male | Female |
| Under 5 Years | 0 (0.0%) | 0 (0.0%) |
| 5 to 17 Years | 0 (0.0%) | 0 (0.0%) |
| 18 to 34 Years | 0 (0.0%) | 0 (0.0%) |
| 35 to 64 Years | 0 (0.0%) | 0 (0.0%) |
| 65 to 74 Years | 0 (0.0%) | 0 (0.0%) |
| 75 Years and over | 0 (0.0%) | 13 (56.5%) |
Disability Class: Cognitive Difficulty
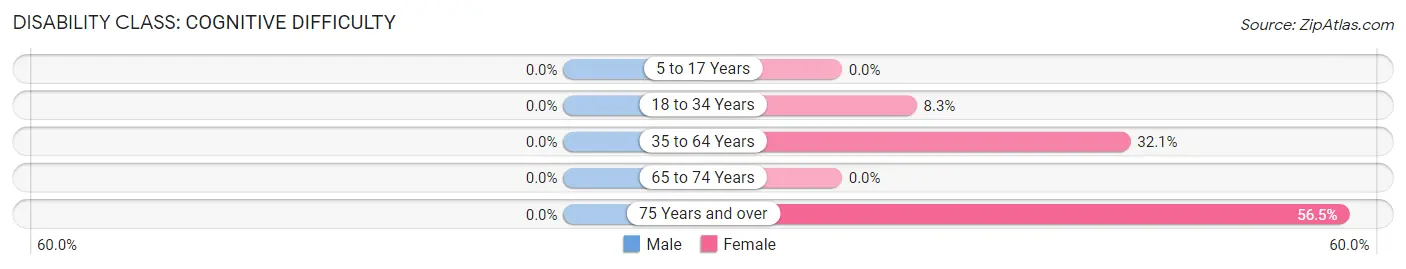
| Age Bracket | Male | Female |
| 5 to 17 Years | 0 (0.0%) | 0 (0.0%) |
| 18 to 34 Years | 0 (0.0%) | 1 (8.3%) |
| 35 to 64 Years | 0 (0.0%) | 9 (32.1%) |
| 65 to 74 Years | 0 (0.0%) | 0 (0.0%) |
| 75 Years and over | 0 (0.0%) | 13 (56.5%) |
Disability Class: Ambulatory Difficulty
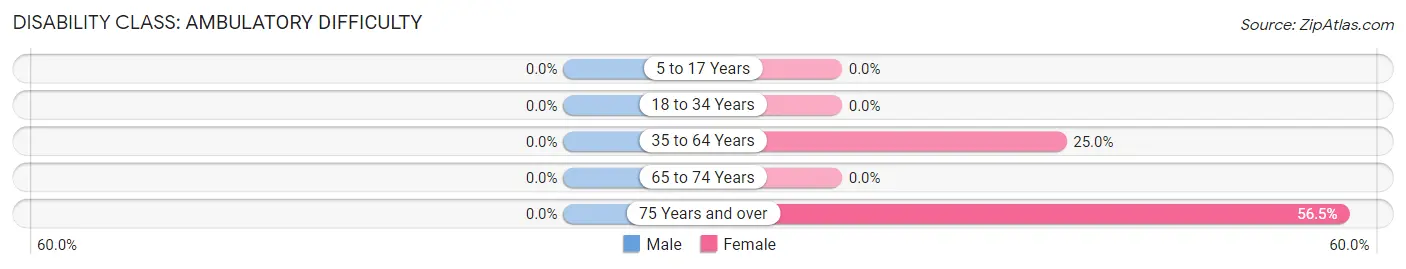
| Age Bracket | Male | Female |
| 5 to 17 Years | 0 (0.0%) | 0 (0.0%) |
| 18 to 34 Years | 0 (0.0%) | 0 (0.0%) |
| 35 to 64 Years | 0 (0.0%) | 7 (25.0%) |
| 65 to 74 Years | 0 (0.0%) | 0 (0.0%) |
| 75 Years and over | 0 (0.0%) | 13 (56.5%) |
Disability Class: Self-Care Difficulty
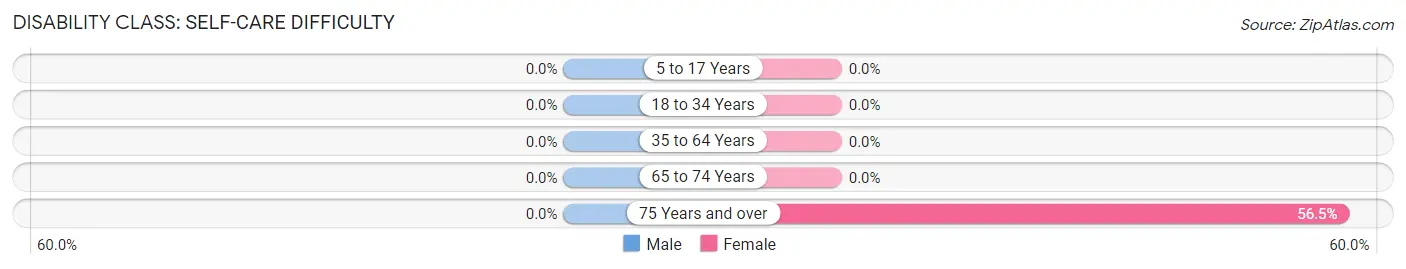
| Age Bracket | Male | Female |
| 5 to 17 Years | 0 (0.0%) | 0 (0.0%) |
| 18 to 34 Years | 0 (0.0%) | 0 (0.0%) |
| 35 to 64 Years | 0 (0.0%) | 0 (0.0%) |
| 65 to 74 Years | 0 (0.0%) | 0 (0.0%) |
| 75 Years and over | 0 (0.0%) | 13 (56.5%) |
Technology Access in Elberta
Computing Device Access in Elberta
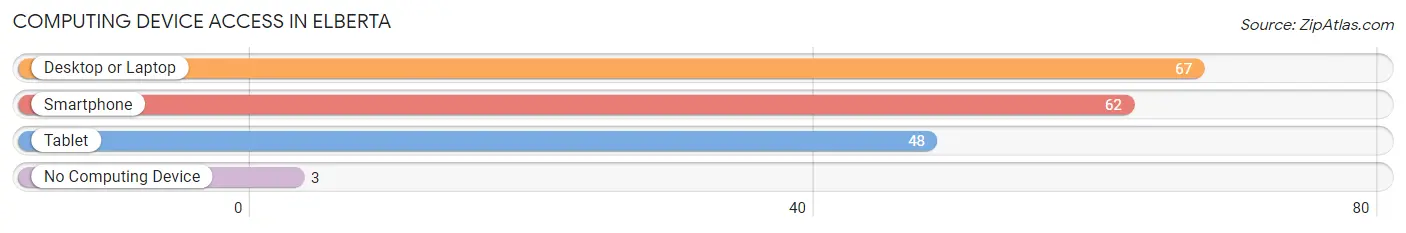
| Device Type | # Households | % Households |
| Desktop or Laptop | 67 | 93.1% |
| Smartphone | 62 | 86.1% |
| Tablet | 48 | 66.7% |
| No Computing Device | 3 | 4.2% |
| Total | 72 | 100.0% |
Internet Access in Elberta
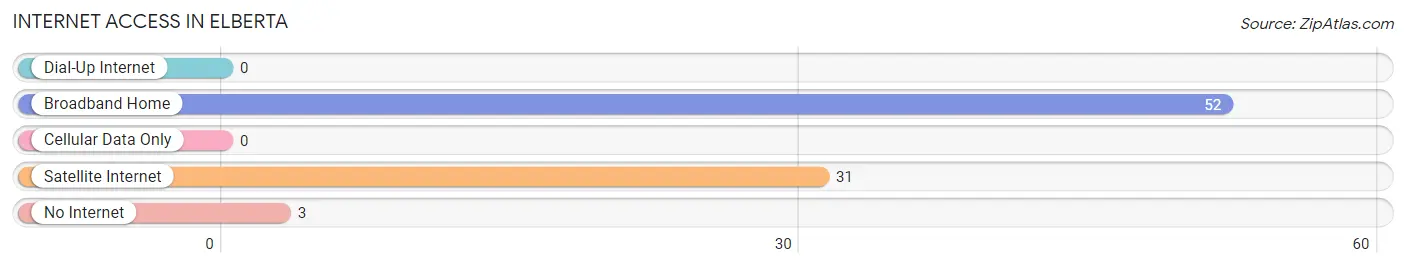
| Internet Type | # Households | % Households |
| Dial-Up Internet | 0 | 0.0% |
| Broadband Home | 52 | 72.2% |
| Cellular Data Only | 0 | 0.0% |
| Satellite Internet | 31 | 43.1% |
| No Internet | 3 | 4.2% |
| Total | 72 | 100.0% |
Elberta Summary
Elberta is a small village located in the northwest corner of Michigan’s Lower Peninsula. It is situated on the shores of Lake Michigan, just south of the city of Frankfort. The village has a population of just over 1,000 people and is part of Benzie County.
History
Elberta was founded in 1883 by a group of German immigrants who had come to the area to work in the lumber industry. The village was named after Elberta, Alabama, which was the hometown of one of the original settlers. The village was incorporated in 1895 and quickly grew to become a popular summer destination for tourists.
In the early 1900s, Elberta was a thriving fishing village. The village was home to several fish canneries, which provided employment for many of the local residents. The village also had a thriving lumber industry, which provided jobs for many of the local residents.
In the 1950s, Elberta began to experience a decline in its economy. The fish canneries closed and the lumber industry began to decline. The village was also hit hard by the Great Depression.
In the 1970s, Elberta began to experience a resurgence in its economy. The village was designated as a tourist destination and began to attract visitors from all over the country. The village also began to attract retirees who were looking for a quiet place to live.
Geography
Elberta is located in the northwest corner of Michigan’s Lower Peninsula. It is situated on the shores of Lake Michigan, just south of the city of Frankfort. The village is surrounded by rolling hills and forests. The village is located near the Sleeping Bear Dunes National Lakeshore, which is a popular tourist destination.
The village is located in a temperate climate zone, which means that it experiences warm summers and cold winters. The average temperature in the summer is around 70 degrees Fahrenheit and the average temperature in the winter is around 30 degrees Fahrenheit.
Economy
Elberta’s economy is largely based on tourism. The village is a popular destination for tourists who are looking for a quiet place to relax and enjoy the natural beauty of the area. The village also attracts retirees who are looking for a quiet place to live.
The village also has a thriving fishing industry. The village is home to several fish canneries, which provide employment for many of the local residents. The village also has a thriving lumber industry, which provides jobs for many of the local residents.
Demographics
As of the 2010 census, Elberta had a population of 1,072 people. The racial makeup of the village was 97.3% White, 0.7% African American, 0.3% Native American, 0.2% Asian, 0.1% Pacific Islander, 0.2% from other races, and 1.2% from two or more races. Hispanic or Latino of any race were 1.2% of the population.
The median income for a household in Elberta was $37,500 and the median income for a family was $45,000. The per capita income for the village was $20,000. About 8.3% of families and 10.2% of the population were below the poverty line, including 11.3% of those under age 18 and 8.3% of those age 65 or over.
Common Questions
What is Per Capita Income in Elberta?
Per Capita income in Elberta is $52,988.
What is the Median Family Income in Elberta?
Median Family Income in Elberta is $121,875.
What is the Median Household income in Elberta?
Median Household Income in Elberta is $84,500.
What is Income or Wage Gap in Elberta?
Income or Wage Gap in Elberta is 21.1%.
Women in Elberta earn 78.9 cents for every dollar earned by a man.
What is Inequality or Gini Index in Elberta?
Inequality or Gini Index in Elberta is 0.44.
What is the Total Population of Elberta?
Total Population of Elberta is 225.
What is the Total Male Population of Elberta?
Total Male Population of Elberta is 131.
What is the Total Female Population of Elberta?
Total Female Population of Elberta is 94.
What is the Ratio of Males per 100 Females in Elberta?
There are 139.36 Males per 100 Females in Elberta.
What is the Ratio of Females per 100 Males in Elberta?
There are 71.76 Females per 100 Males in Elberta.
What is the Median Population Age in Elberta?
Median Population Age in Elberta is 43.7 Years.
What is the Average Family Size in Elberta
Average Family Size in Elberta is 3.9 People.
What is the Average Household Size in Elberta
Average Household Size in Elberta is 3.1 People.
How Large is the Labor Force in Elberta?
There are 75 People in the Labor Forcein in Elberta.
What is the Percentage of People in the Labor Force in Elberta?
38.7% of People are in the Labor Force in Elberta.
What is the Unemployment Rate in Elberta?
Unemployment Rate in Elberta is 4.0%.