Benton Heights, MI Map & Demographics
Benton Heights Map
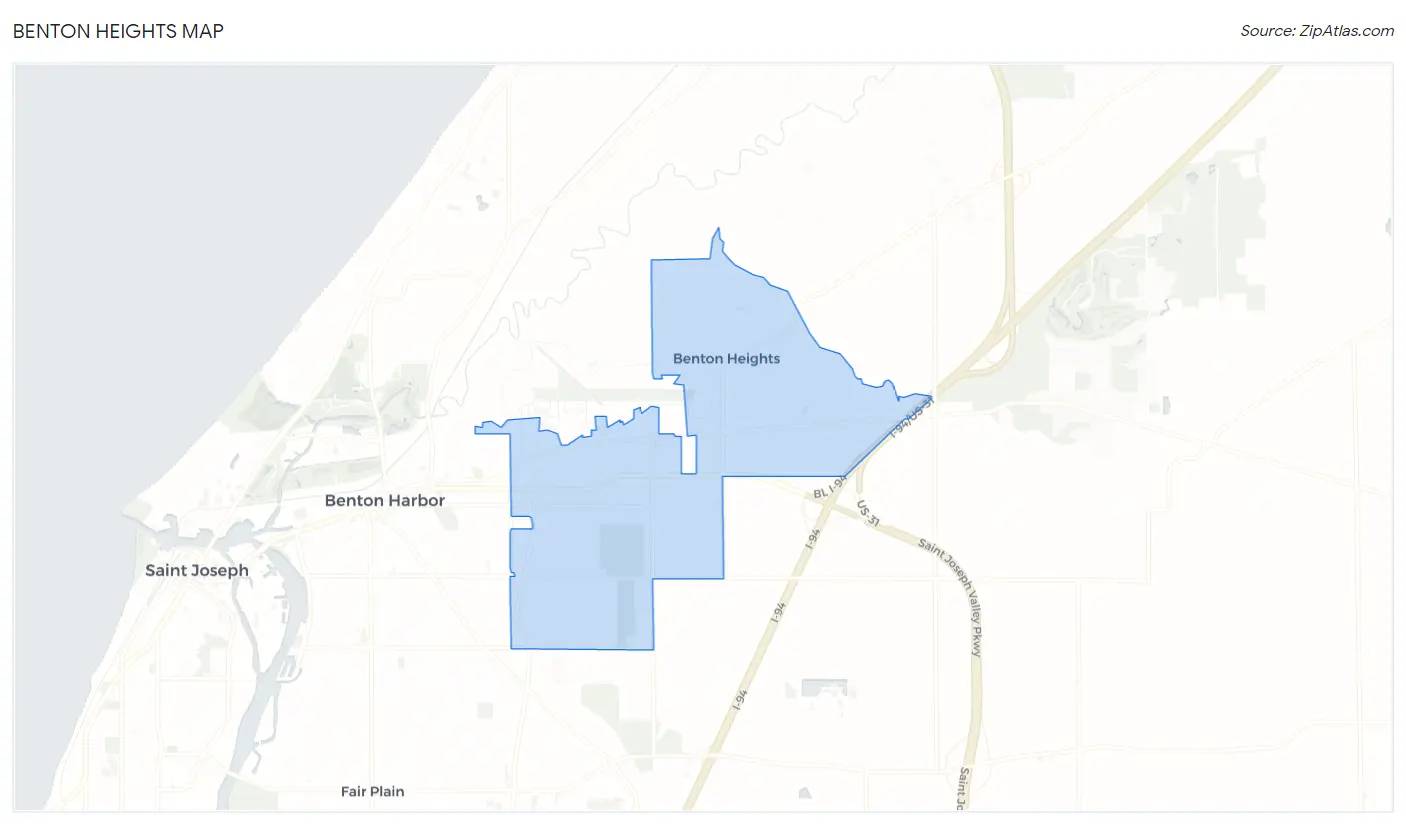
Benton Heights Overview
$15,213
PER CAPITA INCOME
$35,733
AVG FAMILY INCOME
$32,821
AVG HOUSEHOLD INCOME
34.7%
WAGE / INCOME GAP [ % ]
65.3¢/ $1
WAGE / INCOME GAP [ $ ]
0.42
INEQUALITY / GINI INDEX
3,763
TOTAL POPULATION
2,016
MALE POPULATION
1,747
FEMALE POPULATION
115.40
MALES / 100 FEMALES
86.66
FEMALES / 100 MALES
28.3
MEDIAN AGE
3.7
AVG FAMILY SIZE
2.8
AVG HOUSEHOLD SIZE
1,605
LABOR FORCE [ PEOPLE ]
65.3%
PERCENT IN LABOR FORCE
11.5%
UNEMPLOYMENT RATE
Income in Benton Heights
Income Overview in Benton Heights
Per Capita Income in Benton Heights is $15,213, while median incomes of families and households are $35,733 and $32,821 respectively.
| Characteristic | Number | Measure |
| Per Capita Income | 3,763 | $15,213 |
| Median Family Income | 813 | $35,733 |
| Mean Family Income | 813 | $45,008 |
| Median Household Income | 1,325 | $32,821 |
| Mean Household Income | 1,325 | $38,679 |
| Income Deficit | 813 | $0 |
| Wage / Income Gap (%) | 3,763 | 34.67% |
| Wage / Income Gap ($) | 3,763 | 65.33¢ per $1 |
| Gini / Inequality Index | 3,763 | 0.42 |
Earnings by Sex in Benton Heights
Average Earnings in Benton Heights are $20,513, $21,601 for men and $14,113 for women, a difference of 34.7%.
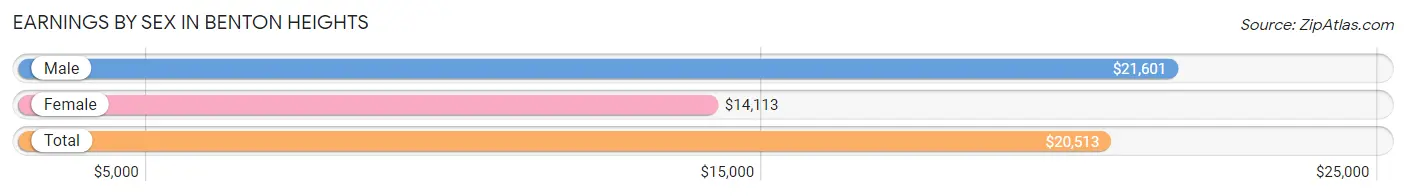
| Sex | Number | Average Earnings |
| Male | 887 (56.4%) | $21,601 |
| Female | 687 (43.6%) | $14,113 |
| Total | 1,574 (100.0%) | $20,513 |
Earnings by Sex by Income Bracket in Benton Heights
The most common earnings brackets in Benton Heights are $2,499 or less for men (150 | 16.9%) and $2,499 or less for women (179 | 26.1%).
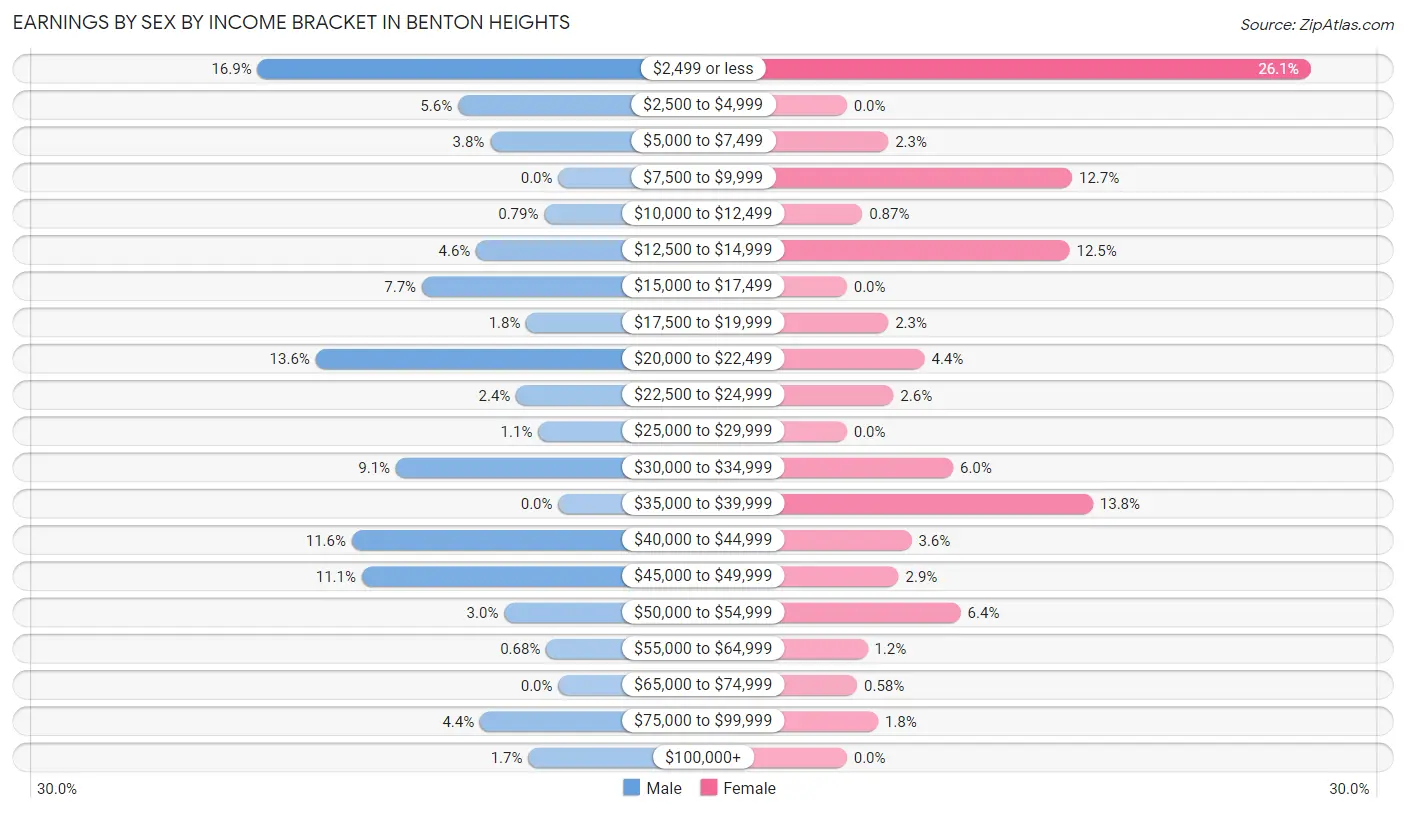
| Income | Male | Female |
| $2,499 or less | 150 (16.9%) | 179 (26.1%) |
| $2,500 to $4,999 | 50 (5.6%) | 0 (0.0%) |
| $5,000 to $7,499 | 34 (3.8%) | 16 (2.3%) |
| $7,500 to $9,999 | 0 (0.0%) | 87 (12.7%) |
| $10,000 to $12,499 | 7 (0.8%) | 6 (0.9%) |
| $12,500 to $14,999 | 41 (4.6%) | 86 (12.5%) |
| $15,000 to $17,499 | 68 (7.7%) | 0 (0.0%) |
| $17,500 to $19,999 | 16 (1.8%) | 16 (2.3%) |
| $20,000 to $22,499 | 121 (13.6%) | 30 (4.4%) |
| $22,500 to $24,999 | 21 (2.4%) | 18 (2.6%) |
| $25,000 to $29,999 | 10 (1.1%) | 0 (0.0%) |
| $30,000 to $34,999 | 81 (9.1%) | 41 (6.0%) |
| $35,000 to $39,999 | 0 (0.0%) | 95 (13.8%) |
| $40,000 to $44,999 | 103 (11.6%) | 25 (3.6%) |
| $45,000 to $49,999 | 98 (11.1%) | 20 (2.9%) |
| $50,000 to $54,999 | 27 (3.0%) | 44 (6.4%) |
| $55,000 to $64,999 | 6 (0.7%) | 8 (1.2%) |
| $65,000 to $74,999 | 0 (0.0%) | 4 (0.6%) |
| $75,000 to $99,999 | 39 (4.4%) | 12 (1.8%) |
| $100,000+ | 15 (1.7%) | 0 (0.0%) |
| Total | 887 (100.0%) | 687 (100.0%) |
Earnings by Sex by Educational Attainment in Benton Heights
Average earnings in Benton Heights are $26,250 for men and $20,458 for women, a difference of 22.1%. Men with an educational attainment of college or associate's degree enjoy the highest average annual earnings of $41,412, while those with less than high school education earn the least with $16,202. Women with an educational attainment of high school diploma earn the most with the average annual earnings of $35,905, while those with graduate degree education have the smallest earnings of $2,499.
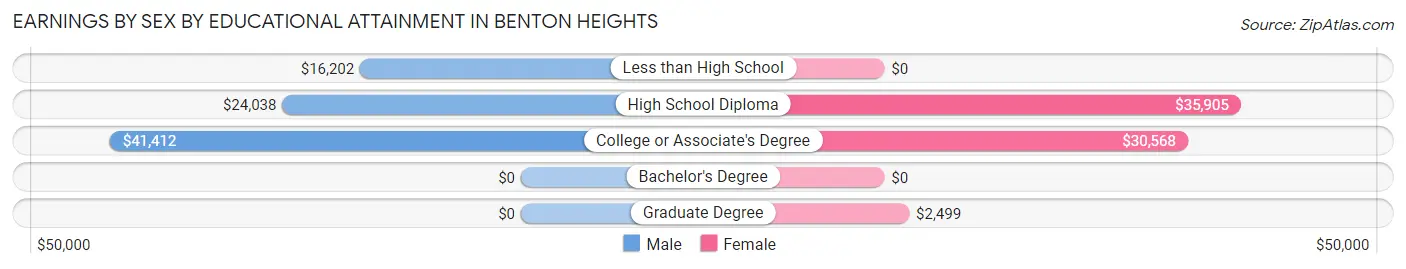
| Educational Attainment | Male Income | Female Income |
| Less than High School | $16,202 | $0 |
| High School Diploma | $24,038 | $35,905 |
| College or Associate's Degree | $41,412 | $30,568 |
| Bachelor's Degree | - | - |
| Graduate Degree | - | - |
| Total | $26,250 | $20,458 |
Family Income in Benton Heights
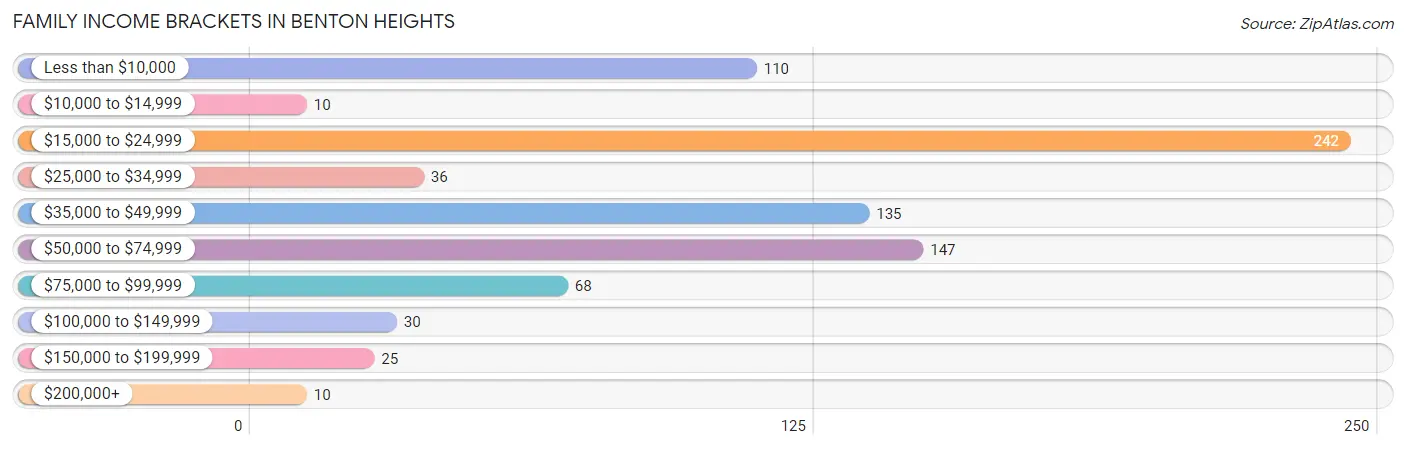
Family Income Brackets in Benton Heights
According to the Benton Heights family income data, there are 242 families falling into the $15,000 to $24,999 income range, which is the most common income bracket and makes up 29.8% of all families. Conversely, the $10,000 to $14,999 income bracket is the least frequent group with only 10 families (1.2%) belonging to this category.
| Income Bracket | # Families | % Families |
| Less than $10,000 | 110 | 13.5% |
| $10,000 to $14,999 | 10 | 1.2% |
| $15,000 to $24,999 | 242 | 29.8% |
| $25,000 to $34,999 | 36 | 4.4% |
| $35,000 to $49,999 | 135 | 16.6% |
| $50,000 to $74,999 | 147 | 18.1% |
| $75,000 to $99,999 | 68 | 8.4% |
| $100,000 to $149,999 | 30 | 3.7% |
| $150,000 to $199,999 | 25 | 3.1% |
| $200,000+ | 10 | 1.2% |
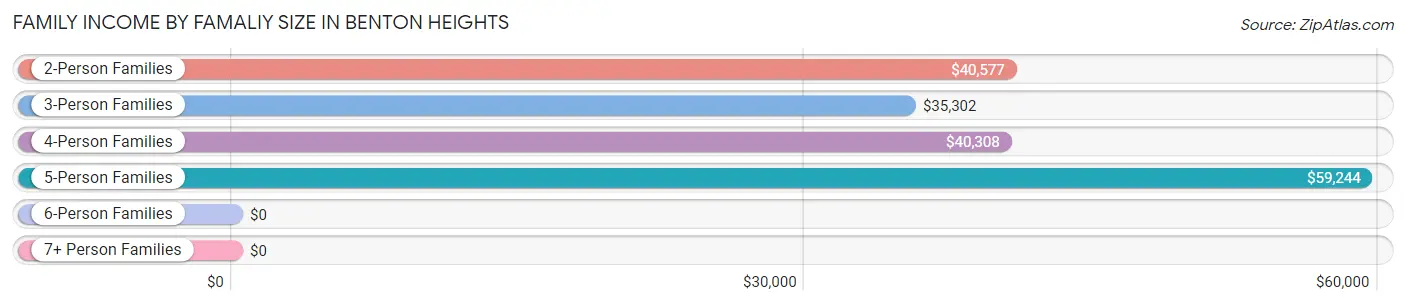
Family Income by Famaliy Size in Benton Heights
5-person families (94 | 11.6%) account for the highest median family income in Benton Heights with $59,244 per family, while 2-person families (210 | 25.8%) have the highest median income of $20,288 per family member.
| Income Bracket | # Families | Median Income |
| 2-Person Families | 210 (25.8%) | $40,577 |
| 3-Person Families | 209 (25.7%) | $35,302 |
| 4-Person Families | 191 (23.5%) | $40,308 |
| 5-Person Families | 94 (11.6%) | $59,244 |
| 6-Person Families | 52 (6.4%) | $0 |
| 7+ Person Families | 57 (7.0%) | $0 |
| Total | 813 (100.0%) | $35,733 |
Family Income by Number of Earners in Benton Heights
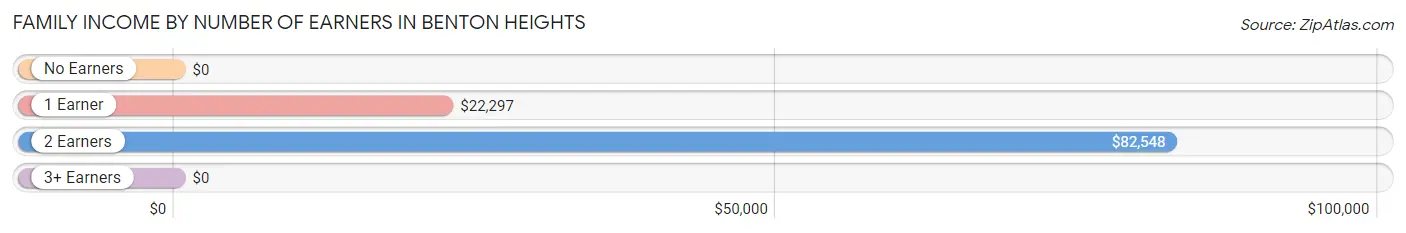
| Number of Earners | # Families | Median Income |
| No Earners | 92 (11.3%) | $0 |
| 1 Earner | 454 (55.8%) | $22,297 |
| 2 Earners | 155 (19.1%) | $82,548 |
| 3+ Earners | 112 (13.8%) | $0 |
| Total | 813 (100.0%) | $35,733 |
Household Income in Benton Heights
Household Income Brackets in Benton Heights
With 379 households falling in the category, the $15,000 to $24,999 income range is the most frequent in Benton Heights, accounting for 28.6% of all households. In contrast, only 11 households (0.8%) fall into the $200,000+ income bracket, making it the least populous group.
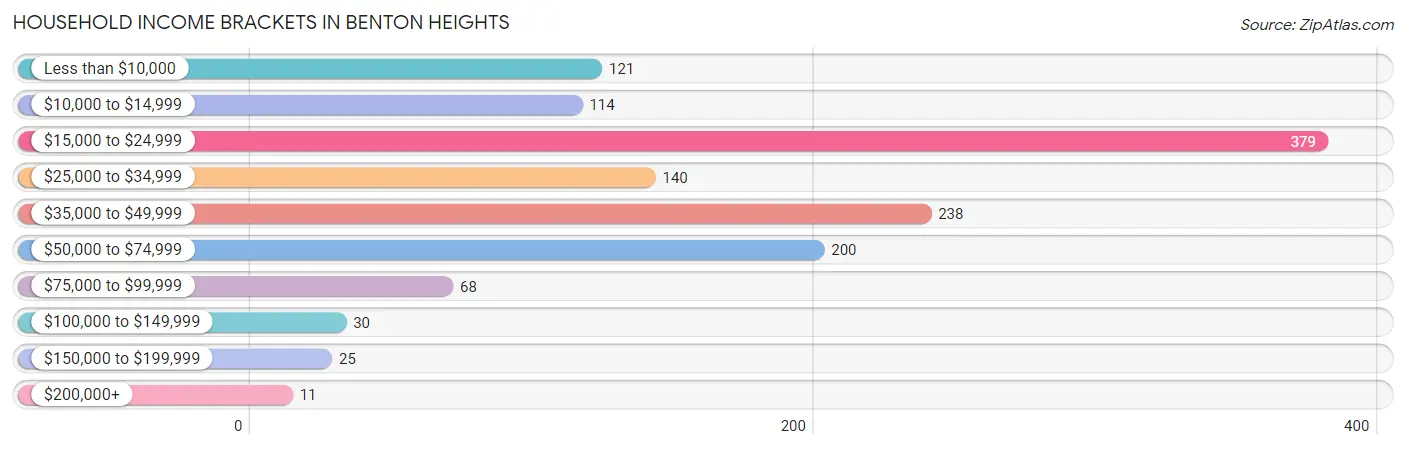
| Income Bracket | # Households | % Households |
| Less than $10,000 | 121 | 9.1% |
| $10,000 to $14,999 | 114 | 8.6% |
| $15,000 to $24,999 | 379 | 28.6% |
| $25,000 to $34,999 | 140 | 10.6% |
| $35,000 to $49,999 | 238 | 18.0% |
| $50,000 to $74,999 | 200 | 15.1% |
| $75,000 to $99,999 | 68 | 5.1% |
| $100,000 to $149,999 | 30 | 2.3% |
| $150,000 to $199,999 | 25 | 1.9% |
| $200,000+ | 11 | 0.8% |
Household Income by Householder Age in Benton Heights
The median household income in Benton Heights is $32,821, with the highest median household income of $40,848 found in the 45 to 64 years age bracket for the primary householder. A total of 446 households (33.7%) fall into this category. Meanwhile, the 15 to 24 years age bracket for the primary householder has the lowest median household income of $0, with 75 households (5.7%) in this group.
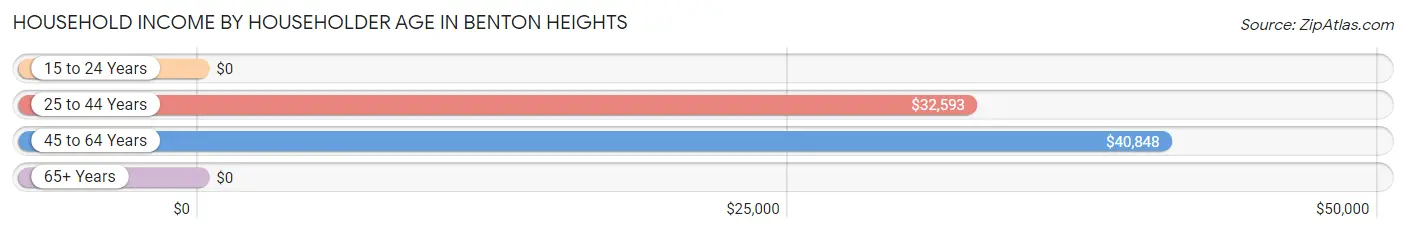
| Income Bracket | # Households | Median Income |
| 15 to 24 Years | 75 (5.7%) | $0 |
| 25 to 44 Years | 608 (45.9%) | $32,593 |
| 45 to 64 Years | 446 (33.7%) | $40,848 |
| 65+ Years | 196 (14.8%) | $0 |
| Total | 1,325 (100.0%) | $32,821 |
Poverty in Benton Heights
Income Below Poverty by Sex and Age in Benton Heights
With 40.4% poverty level for males and 46.0% for females among the residents of Benton Heights, 16 and 17 year old males and 15 year old females are the most vulnerable to poverty, with 15 males (100.0%) and 53 females (100.0%) in their respective age groups living below the poverty level.
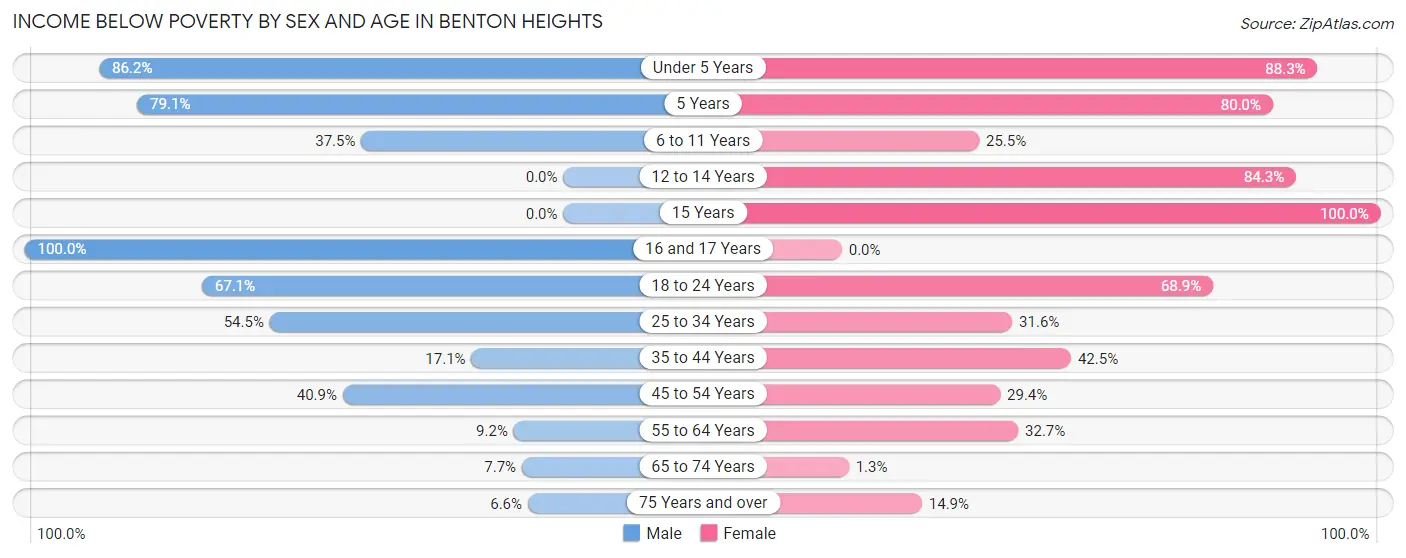
| Age Bracket | Male | Female |
| Under 5 Years | 218 (86.2%) | 143 (88.3%) |
| 5 Years | 53 (79.1%) | 60 (80.0%) |
| 6 to 11 Years | 75 (37.5%) | 66 (25.5%) |
| 12 to 14 Years | 0 (0.0%) | 86 (84.3%) |
| 15 Years | 0 (0.0%) | 53 (100.0%) |
| 16 and 17 Years | 15 (100.0%) | 0 (0.0%) |
| 18 to 24 Years | 106 (67.1%) | 133 (68.9%) |
| 25 to 34 Years | 212 (54.5%) | 80 (31.6%) |
| 35 to 44 Years | 42 (17.1%) | 57 (42.5%) |
| 45 to 54 Years | 52 (40.9%) | 57 (29.4%) |
| 55 to 64 Years | 22 (9.2%) | 54 (32.7%) |
| 65 to 74 Years | 6 (7.7%) | 1 (1.3%) |
| 75 Years and over | 6 (6.6%) | 11 (14.9%) |
| Total | 807 (40.4%) | 801 (46.0%) |
Income Above Poverty by Sex and Age in Benton Heights
According to the poverty statistics in Benton Heights, males aged 12 to 14 years and females aged 65 to 74 years are the age groups that are most secure financially, with 100.0% of males and 98.7% of females in these age groups living above the poverty line.
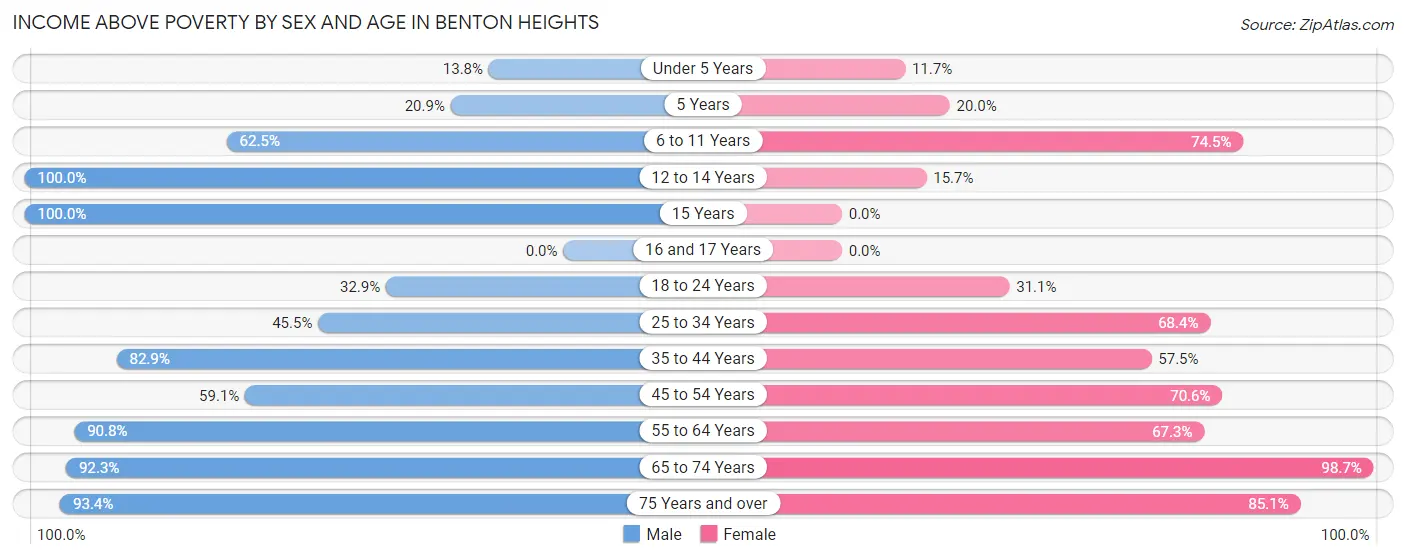
| Age Bracket | Male | Female |
| Under 5 Years | 35 (13.8%) | 19 (11.7%) |
| 5 Years | 14 (20.9%) | 15 (20.0%) |
| 6 to 11 Years | 125 (62.5%) | 193 (74.5%) |
| 12 to 14 Years | 25 (100.0%) | 16 (15.7%) |
| 15 Years | 109 (100.0%) | 0 (0.0%) |
| 16 and 17 Years | 0 (0.0%) | 0 (0.0%) |
| 18 to 24 Years | 52 (32.9%) | 60 (31.1%) |
| 25 to 34 Years | 177 (45.5%) | 173 (68.4%) |
| 35 to 44 Years | 204 (82.9%) | 77 (57.5%) |
| 45 to 54 Years | 75 (59.1%) | 137 (70.6%) |
| 55 to 64 Years | 217 (90.8%) | 111 (67.3%) |
| 65 to 74 Years | 72 (92.3%) | 77 (98.7%) |
| 75 Years and over | 85 (93.4%) | 63 (85.1%) |
| Total | 1,190 (59.6%) | 941 (54.0%) |
Income Below Poverty Among Married-Couple Families in Benton Heights
The poverty statistics for married-couple families in Benton Heights show that 28.1% or 92 of the total 328 families live below the poverty line. Families with 5 or more children have the highest poverty rate of 100.0%, comprising of 40 families. On the other hand, families with no children have the lowest poverty rate of 0.0%, which includes 0 families.
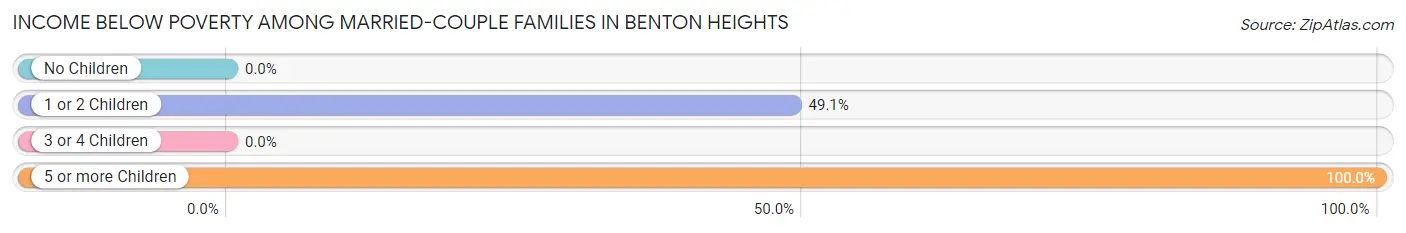
| Children | Above Poverty | Below Poverty |
| No Children | 148 (100.0%) | 0 (0.0%) |
| 1 or 2 Children | 54 (50.9%) | 52 (49.1%) |
| 3 or 4 Children | 34 (100.0%) | 0 (0.0%) |
| 5 or more Children | 0 (0.0%) | 40 (100.0%) |
| Total | 236 (72.0%) | 92 (28.1%) |
Income Below Poverty Among Single-Parent Households in Benton Heights
According to the poverty data in Benton Heights, 41.6% or 96 single-father households and 38.2% or 97 single-mother households are living below the poverty line. Among single-father households, those with 1 or 2 children have the highest poverty rate, with 96 households (72.7%) experiencing poverty. Likewise, among single-mother households, those with 3 or 4 children have the highest poverty rate, with 97 households (100.0%) falling below the poverty line.
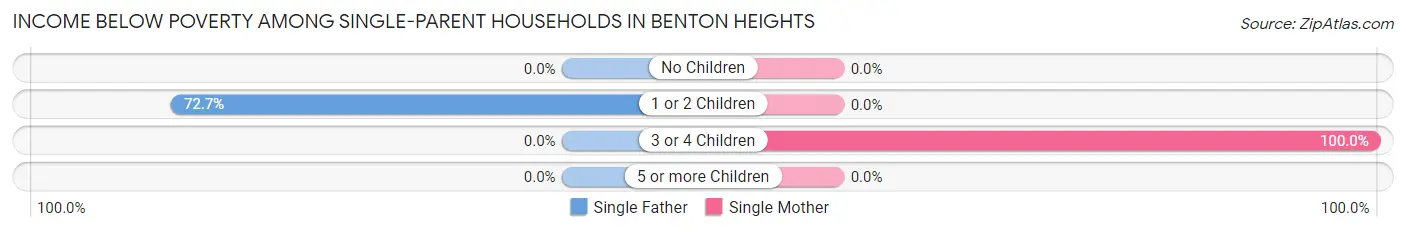
| Children | Single Father | Single Mother |
| No Children | 0 (0.0%) | 0 (0.0%) |
| 1 or 2 Children | 96 (72.7%) | 0 (0.0%) |
| 3 or 4 Children | 0 (0.0%) | 97 (100.0%) |
| 5 or more Children | 0 (0.0%) | 0 (0.0%) |
| Total | 96 (41.6%) | 97 (38.2%) |
Income Below Poverty Among Married-Couple vs Single-Parent Households in Benton Heights
The poverty data for Benton Heights shows that 92 of the married-couple family households (28.1%) and 193 of the single-parent households (39.8%) are living below the poverty level. Within the married-couple family households, those with 5 or more children have the highest poverty rate, with 40 households (100.0%) falling below the poverty line. Among the single-parent households, those with 3 or 4 children have the highest poverty rate, with 97 household (51.0%) living below poverty.
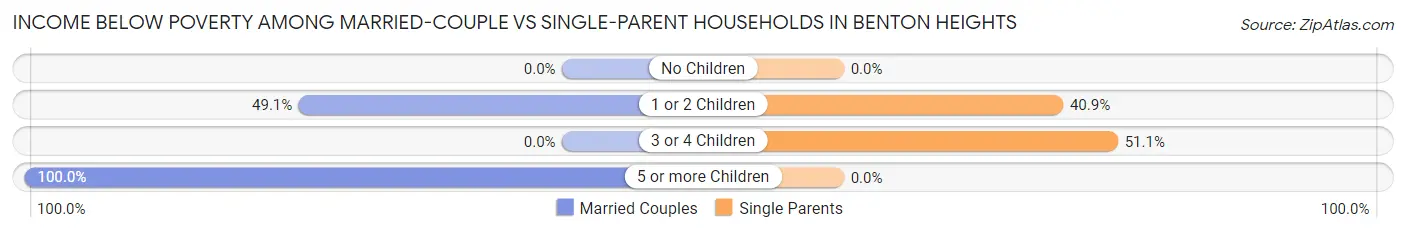
| Children | Married-Couple Families | Single-Parent Households |
| No Children | 0 (0.0%) | 0 (0.0%) |
| 1 or 2 Children | 52 (49.1%) | 96 (40.8%) |
| 3 or 4 Children | 0 (0.0%) | 97 (51.0%) |
| 5 or more Children | 40 (100.0%) | 0 (0.0%) |
| Total | 92 (28.1%) | 193 (39.8%) |
Race in Benton Heights
The most populous races in Benton Heights are Black / African American (2,162 | 57.5%), White / Caucasian (903 | 24.0%), and Hispanic or Latino (818 | 21.7%).
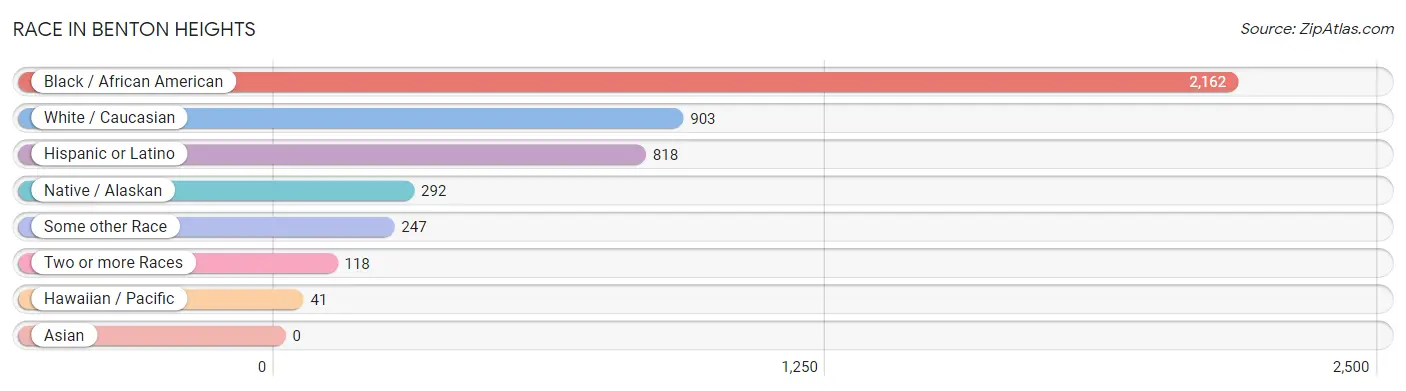
| Race | # Population | % Population |
| Asian | 0 | 0.0% |
| Black / African American | 2,162 | 57.5% |
| Hawaiian / Pacific | 41 | 1.1% |
| Hispanic or Latino | 818 | 21.7% |
| Native / Alaskan | 292 | 7.8% |
| White / Caucasian | 903 | 24.0% |
| Two or more Races | 118 | 3.1% |
| Some other Race | 247 | 6.6% |
| Total | 3,763 | 100.0% |
Ancestry in Benton Heights
The most populous ancestries reported in Benton Heights are Mexican (805 | 21.4%), African (500 | 13.3%), Subsaharan African (500 | 13.3%), Mexican American Indian (265 | 7.0%), and Italian (176 | 4.7%), together accounting for 59.7% of all Benton Heights residents.
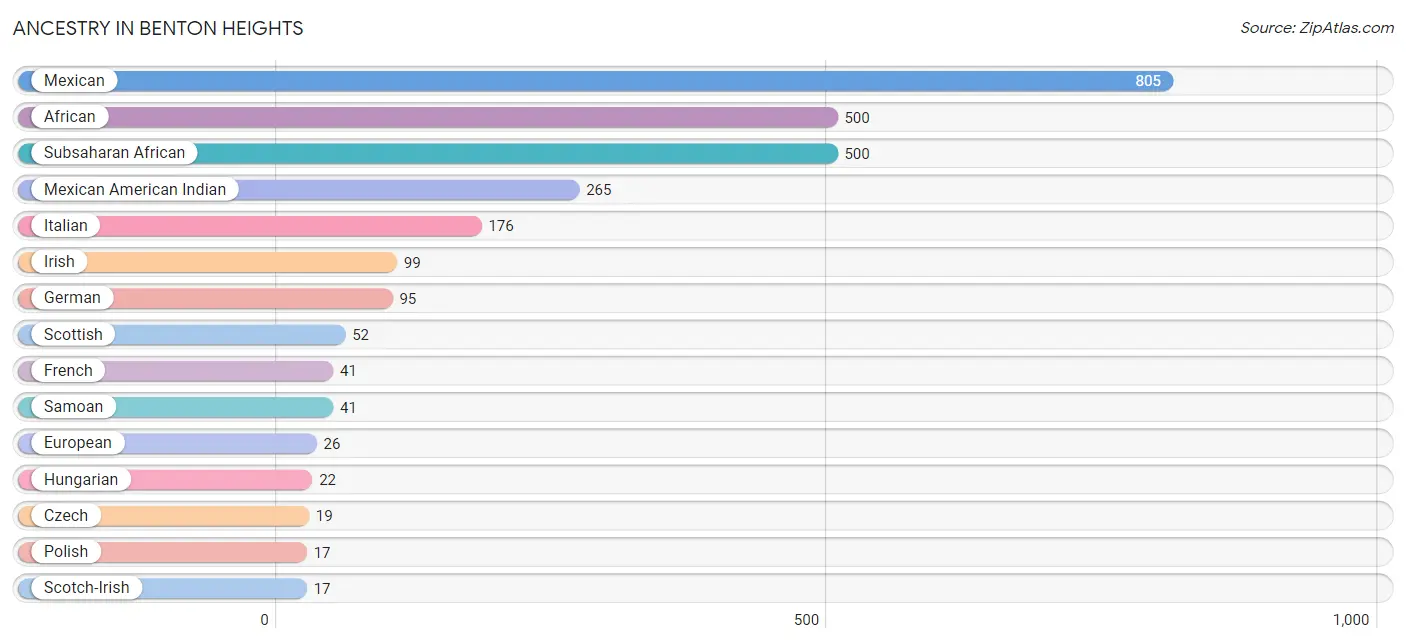
| Ancestry | # Population | % Population |
| African | 500 | 13.3% |
| American | 12 | 0.3% |
| Czech | 19 | 0.5% |
| English | 12 | 0.3% |
| European | 26 | 0.7% |
| French | 41 | 1.1% |
| French Canadian | 4 | 0.1% |
| German | 95 | 2.5% |
| Hungarian | 22 | 0.6% |
| Irish | 99 | 2.6% |
| Italian | 176 | 4.7% |
| Korean | 1 | 0.0% |
| Lithuanian | 10 | 0.3% |
| Mexican | 805 | 21.4% |
| Mexican American Indian | 265 | 7.0% |
| Polish | 17 | 0.4% |
| Puerto Rican | 13 | 0.4% |
| Samoan | 41 | 1.1% |
| Scotch-Irish | 17 | 0.4% |
| Scottish | 52 | 1.4% |
| Subsaharan African | 500 | 13.3% | View All 21 Rows |
Immigrants in Benton Heights
The most numerous immigrant groups reported in Benton Heights came from Latin America (277 | 7.4%), Central America (267 | 7.1%), Mexico (267 | 7.1%), Brazil (10 | 0.3%), and South America (10 | 0.3%), together accounting for 22.1% of all Benton Heights residents.
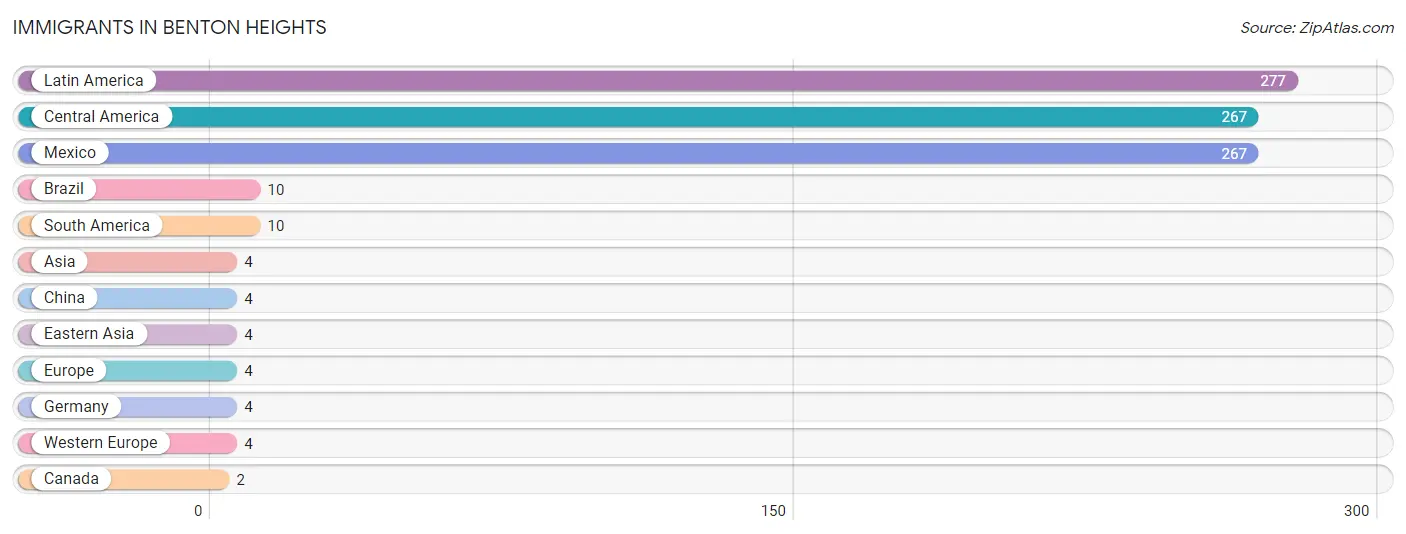
| Immigration Origin | # Population | % Population |
| Asia | 4 | 0.1% |
| Brazil | 10 | 0.3% |
| Canada | 2 | 0.1% |
| Central America | 267 | 7.1% |
| China | 4 | 0.1% |
| Eastern Asia | 4 | 0.1% |
| Europe | 4 | 0.1% |
| Germany | 4 | 0.1% |
| Latin America | 277 | 7.4% |
| Mexico | 267 | 7.1% |
| South America | 10 | 0.3% |
| Western Europe | 4 | 0.1% | View All 12 Rows |
Sex and Age in Benton Heights
Sex and Age in Benton Heights
The most populous age groups in Benton Heights are Under 5 Years (253 | 12.6%) for men and 5 to 9 Years (303 | 17.3%) for women.
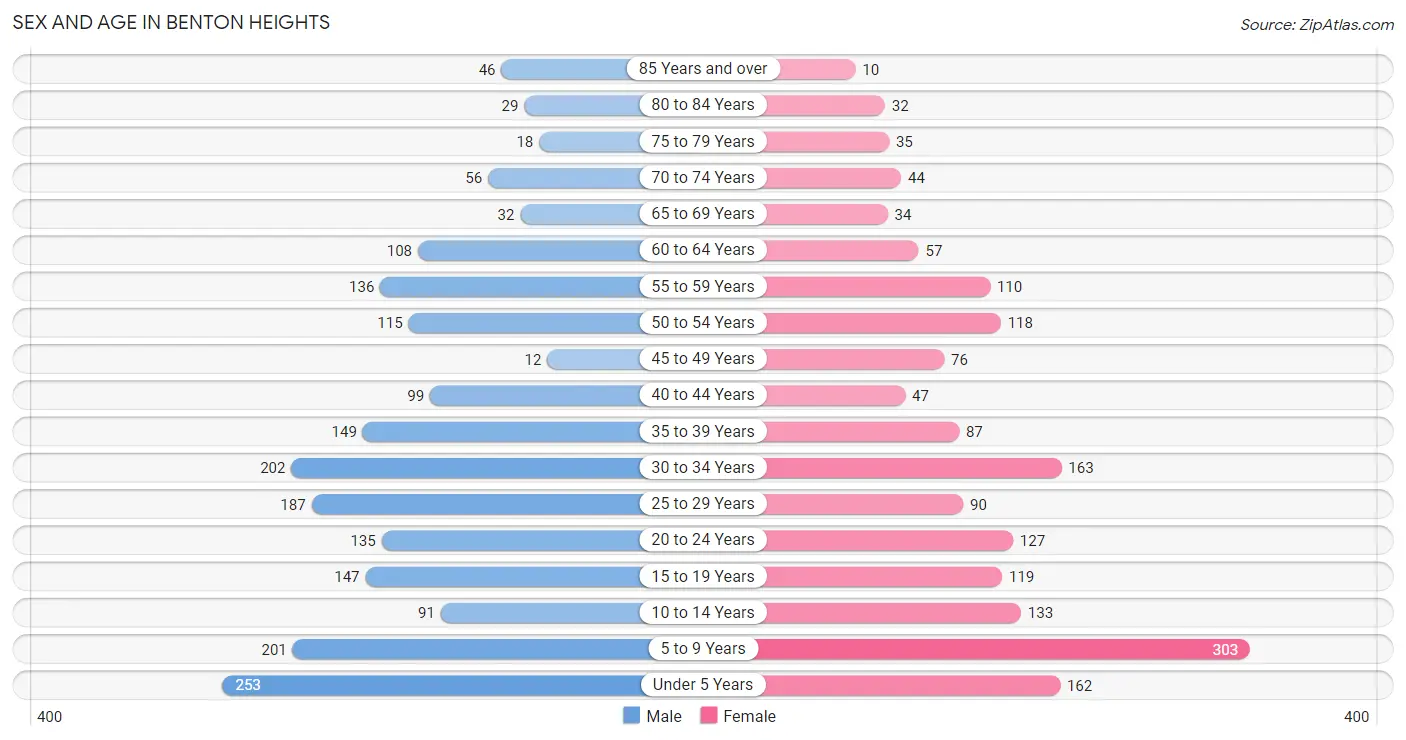
| Age Bracket | Male | Female |
| Under 5 Years | 253 (12.6%) | 162 (9.3%) |
| 5 to 9 Years | 201 (10.0%) | 303 (17.3%) |
| 10 to 14 Years | 91 (4.5%) | 133 (7.6%) |
| 15 to 19 Years | 147 (7.3%) | 119 (6.8%) |
| 20 to 24 Years | 135 (6.7%) | 127 (7.3%) |
| 25 to 29 Years | 187 (9.3%) | 90 (5.1%) |
| 30 to 34 Years | 202 (10.0%) | 163 (9.3%) |
| 35 to 39 Years | 149 (7.4%) | 87 (5.0%) |
| 40 to 44 Years | 99 (4.9%) | 47 (2.7%) |
| 45 to 49 Years | 12 (0.6%) | 76 (4.3%) |
| 50 to 54 Years | 115 (5.7%) | 118 (6.8%) |
| 55 to 59 Years | 136 (6.8%) | 110 (6.3%) |
| 60 to 64 Years | 108 (5.4%) | 57 (3.3%) |
| 65 to 69 Years | 32 (1.6%) | 34 (1.9%) |
| 70 to 74 Years | 56 (2.8%) | 44 (2.5%) |
| 75 to 79 Years | 18 (0.9%) | 35 (2.0%) |
| 80 to 84 Years | 29 (1.4%) | 32 (1.8%) |
| 85 Years and over | 46 (2.3%) | 10 (0.6%) |
| Total | 2,016 (100.0%) | 1,747 (100.0%) |
Families and Households in Benton Heights
Median Family Size in Benton Heights
The median family size in Benton Heights is 3.72 persons per family, with married-couple families (328 | 40.3%) accounting for the largest median family size of 4.41 persons per family. On the other hand, single female/mother families (254 | 31.2%) represent the smallest median family size with 3.02 persons per family.
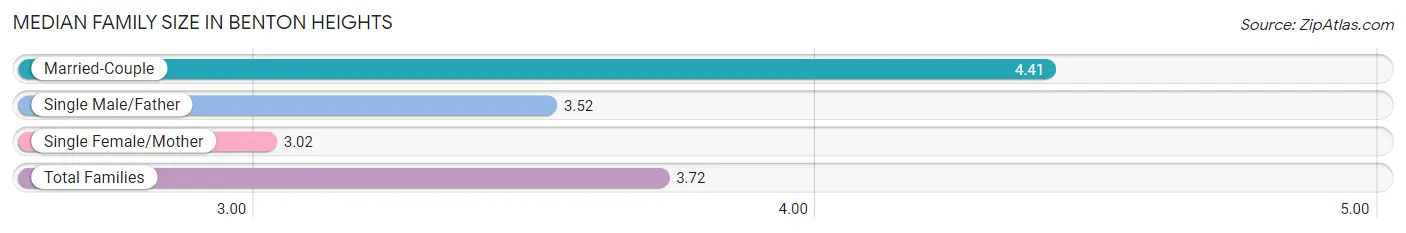
| Family Type | # Families | Family Size |
| Married-Couple | 328 (40.3%) | 4.41 |
| Single Male/Father | 231 (28.4%) | 3.52 |
| Single Female/Mother | 254 (31.2%) | 3.02 |
| Total Families | 813 (100.0%) | 3.72 |
Median Household Size in Benton Heights
The median household size in Benton Heights is 2.78 persons per household, with married-couple households (328 | 24.7%) accounting for the largest median household size of 4.41 persons per household. non-family households (512 | 38.6%) represent the smallest median household size with 1.08 persons per household.
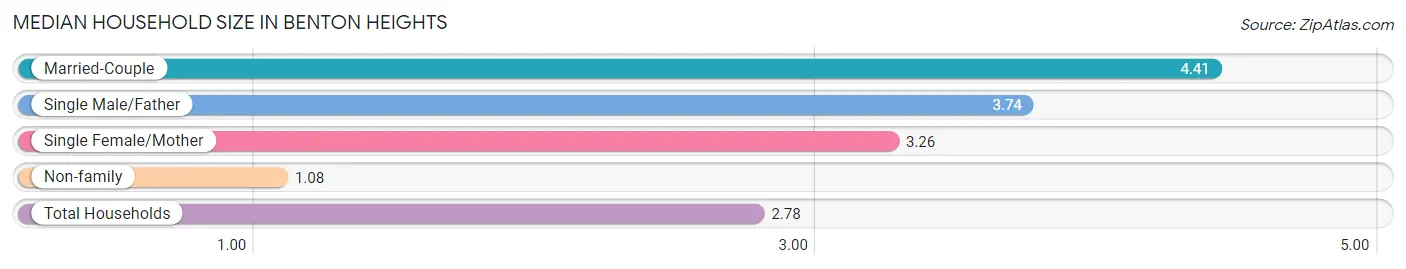
| Household Type | # Households | Household Size |
| Married-Couple | 328 (24.7%) | 4.41 |
| Single Male/Father | 231 (17.4%) | 3.74 |
| Single Female/Mother | 254 (19.2%) | 3.26 |
| Non-family | 512 (38.6%) | 1.08 |
| Total Households | 1,325 (100.0%) | 2.78 |
Household Size by Marriage Status in Benton Heights
Out of a total of 1,325 households in Benton Heights, 813 (61.4%) are family households, while 512 (38.6%) are nonfamily households. The most numerous type of family households are 4-person households, comprising 228, and the most common type of nonfamily households are 1-person households, comprising 490.
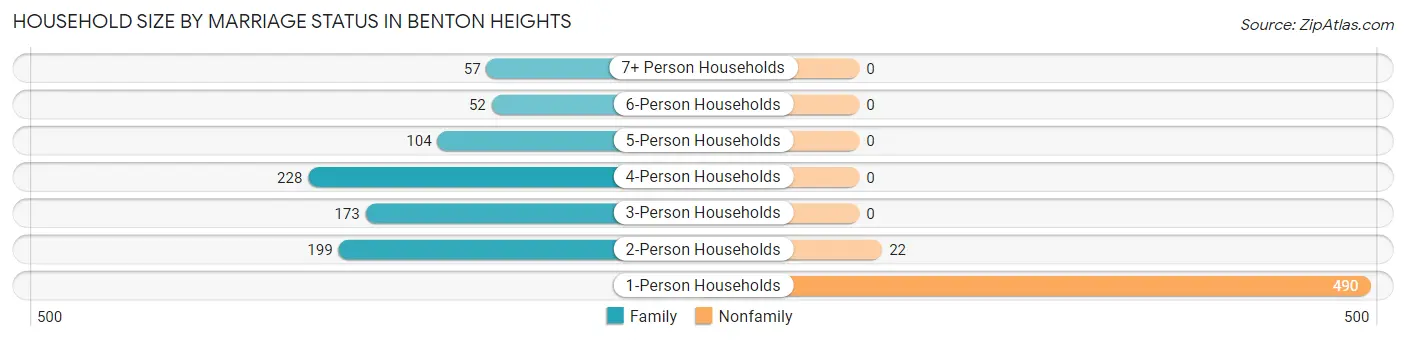
| Household Size | Family Households | Nonfamily Households |
| 1-Person Households | - | 490 (37.0%) |
| 2-Person Households | 199 (15.0%) | 22 (1.7%) |
| 3-Person Households | 173 (13.1%) | 0 (0.0%) |
| 4-Person Households | 228 (17.2%) | 0 (0.0%) |
| 5-Person Households | 104 (7.9%) | 0 (0.0%) |
| 6-Person Households | 52 (3.9%) | 0 (0.0%) |
| 7+ Person Households | 57 (4.3%) | 0 (0.0%) |
| Total | 813 (61.4%) | 512 (38.6%) |
Female Fertility in Benton Heights
Fertility by Age in Benton Heights
Average fertility rate in Benton Heights is 81.0 births per 1,000 women. Women in the age bracket of 20 to 34 years have the highest fertility rate with 155.0 births per 1,000 women. Women in the age bracket of 20 to 34 years acount for 100.0% of all women with births.
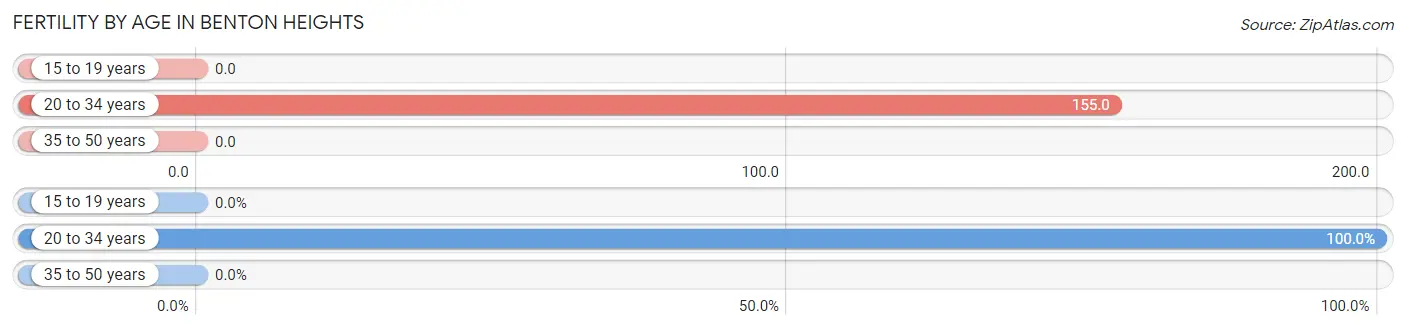
| Age Bracket | Women with Births | Births / 1,000 Women |
| 15 to 19 years | 0 (0.0%) | 0.0 |
| 20 to 34 years | 59 (100.0%) | 155.0 |
| 35 to 50 years | 0 (0.0%) | 0.0 |
| Total | 59 (100.0%) | 81.0 |
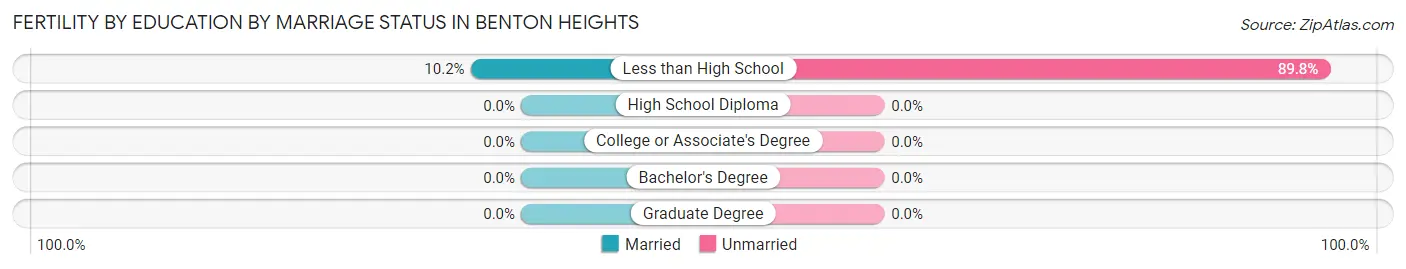
Fertility by Age by Marriage Status in Benton Heights
10.2% of women with births (59) in Benton Heights are married. The highest percentage of unmarried women with births falls into 20 to 34 years age bracket with 89.8% of them unmarried at the time of birth, while the lowest percentage of unmarried women with births belong to 20 to 34 years age bracket with 89.8% of them unmarried.
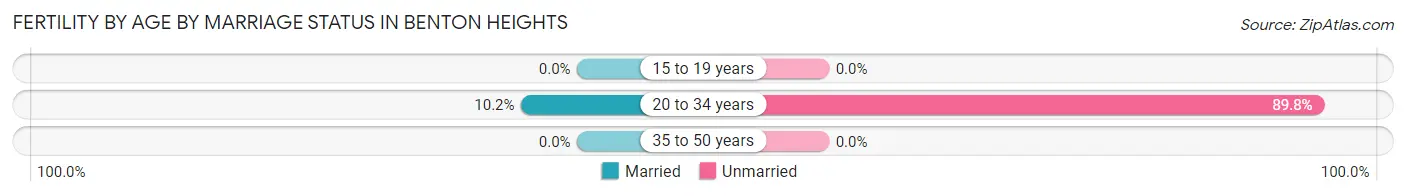
| Age Bracket | Married | Unmarried |
| 15 to 19 years | 0 (0.0%) | 0 (0.0%) |
| 20 to 34 years | 6 (10.2%) | 53 (89.8%) |
| 35 to 50 years | 0 (0.0%) | 0 (0.0%) |
| Total | 6 (10.2%) | 53 (89.8%) |
Fertility by Education in Benton Heights
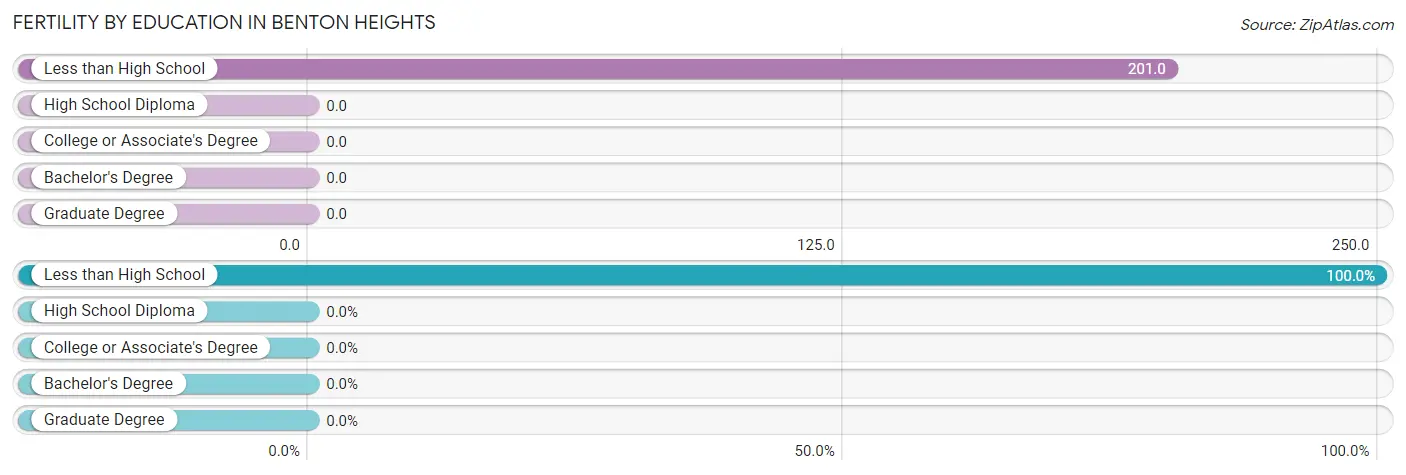
| Educational Attainment | Women with Births | Births / 1,000 Women |
| Less than High School | 59 (100.0%) | 201.0 |
| High School Diploma | 0 (0.0%) | 0.0 |
| College or Associate's Degree | 0 (0.0%) | 0.0 |
| Bachelor's Degree | 0 (0.0%) | 0.0 |
| Graduate Degree | 0 (0.0%) | 0.0 |
| Total | 59 (100.0%) | 81.0 |
Fertility by Education by Marriage Status in Benton Heights
89.8% of women with births in Benton Heights are unmarried. Women with the educational attainment of less than high school are most likely to be married with 10.2% of them married at childbirth, while women with the educational attainment of less than high school are least likely to be married with 89.8% of them unmarried at childbirth.
| Educational Attainment | Married | Unmarried |
| Less than High School | 6 (10.2%) | 53 (89.8%) |
| High School Diploma | 0 (0.0%) | 0 (0.0%) |
| College or Associate's Degree | 0 (0.0%) | 0 (0.0%) |
| Bachelor's Degree | 0 (0.0%) | 0 (0.0%) |
| Graduate Degree | 0 (0.0%) | 0 (0.0%) |
| Total | 6 (10.2%) | 53 (89.8%) |
Employment Characteristics in Benton Heights
Employment by Class of Employer in Benton Heights
Among the 1,336 employed individuals in Benton Heights, private company employees (990 | 74.1%), self-employed (not incorporated) (126 | 9.4%), and not-for-profit organizations (121 | 9.1%) make up the most common classes of employment.
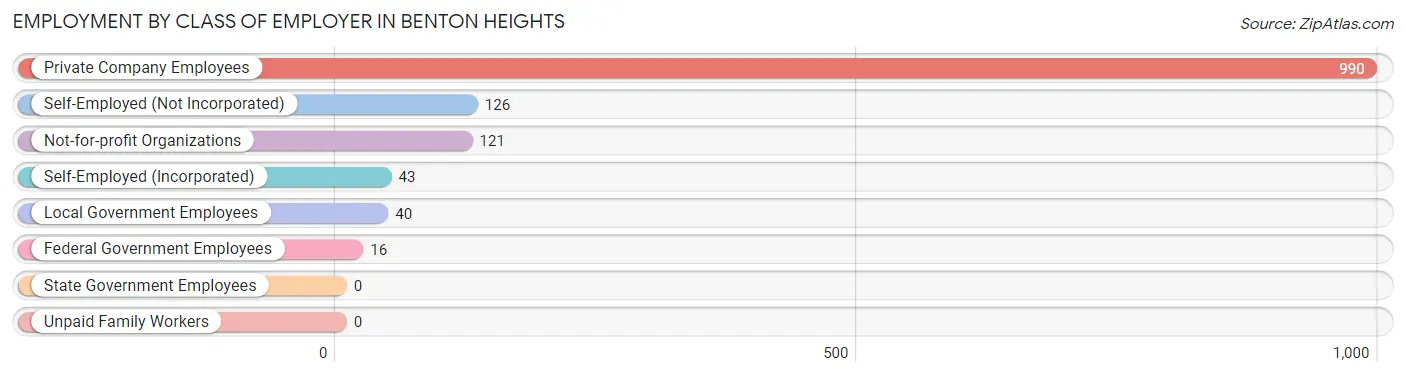
| Employer Class | # Employees | % Employees |
| Private Company Employees | 990 | 74.1% |
| Self-Employed (Incorporated) | 43 | 3.2% |
| Self-Employed (Not Incorporated) | 126 | 9.4% |
| Not-for-profit Organizations | 121 | 9.1% |
| Local Government Employees | 40 | 3.0% |
| State Government Employees | 0 | 0.0% |
| Federal Government Employees | 16 | 1.2% |
| Unpaid Family Workers | 0 | 0.0% |
| Total | 1,336 | 100.0% |
Employment Status by Age in Benton Heights
According to the labor force statistics for Benton Heights, out of the total population over 16 years of age (2,458), 65.3% or 1,605 individuals are in the labor force, with 11.5% or 185 of them unemployed. The age group with the highest labor force participation rate is 25 to 29 years, with 87.7% or 243 individuals in the labor force. Within the labor force, the 20 to 24 years age range has the highest percentage of unemployed individuals, with 50.7% or 106 of them being unemployed.
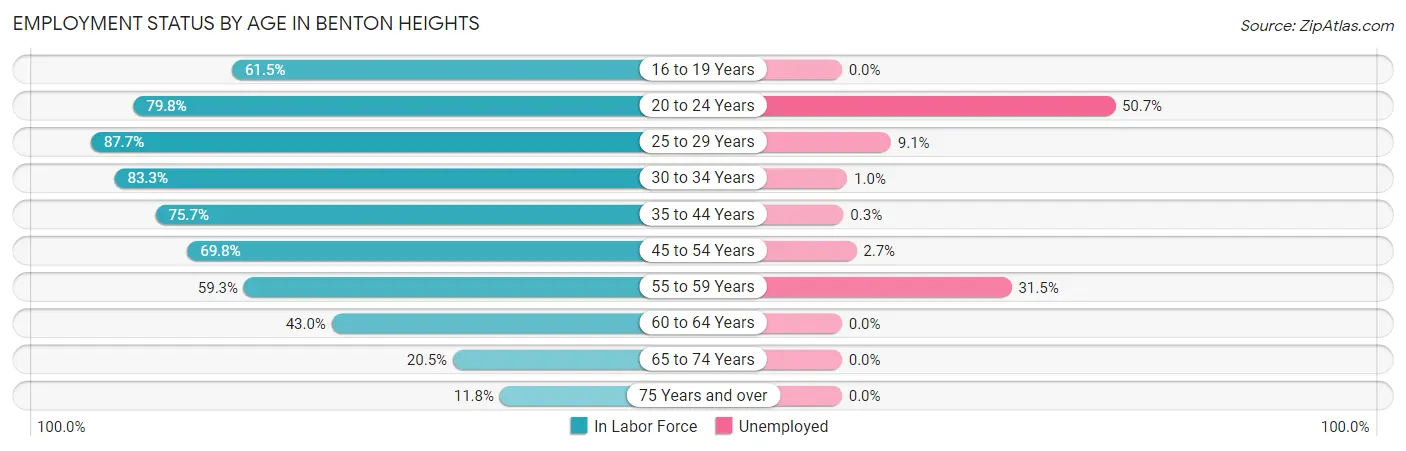
| Age Bracket | In Labor Force | Unemployed |
| 16 to 19 Years | 64 (61.5%) | 0 (0.0%) |
| 20 to 24 Years | 209 (79.8%) | 106 (50.7%) |
| 25 to 29 Years | 243 (87.7%) | 22 (9.1%) |
| 30 to 34 Years | 304 (83.3%) | 3 (1.0%) |
| 35 to 44 Years | 289 (75.7%) | 1 (0.3%) |
| 45 to 54 Years | 224 (69.8%) | 6 (2.7%) |
| 55 to 59 Years | 146 (59.3%) | 46 (31.5%) |
| 60 to 64 Years | 71 (43.0%) | 0 (0.0%) |
| 65 to 74 Years | 34 (20.5%) | 0 (0.0%) |
| 75 Years and over | 20 (11.8%) | 0 (0.0%) |
| Total | 1,605 (65.3%) | 185 (11.5%) |
Employment Status by Educational Attainment in Benton Heights
According to labor force statistics for Benton Heights, 72.7% of individuals (1,277) out of the total population between 25 and 64 years of age (1,756) are in the labor force, with 6.1% or 78 of them being unemployed. The group with the highest labor force participation rate are those with the educational attainment of bachelor's degree or higher, with 100.0% or 262 individuals in the labor force. Within the labor force, individuals with less than high school education have the highest percentage of unemployment, with 23.5% or 46 of them being unemployed.
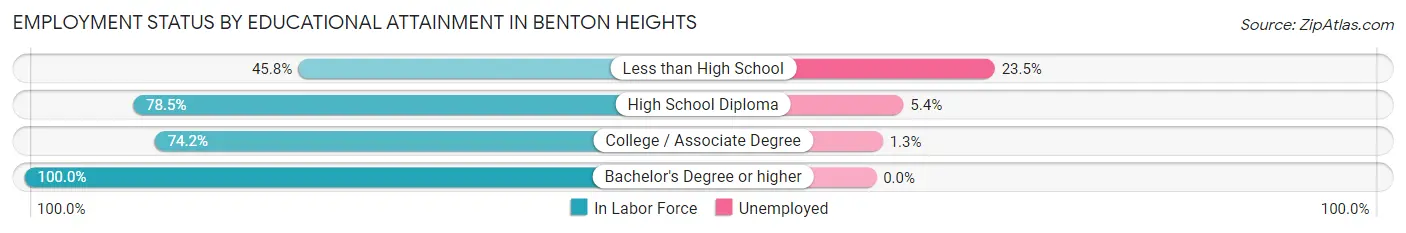
| Educational Attainment | In Labor Force | Unemployed |
| Less than High School | 196 (45.8%) | 101 (23.5%) |
| High School Diploma | 517 (78.5%) | 36 (5.4%) |
| College / Associate Degree | 302 (74.2%) | 5 (1.3%) |
| Bachelor's Degree or higher | 262 (100.0%) | 0 (0.0%) |
| Total | 1,277 (72.7%) | 107 (6.1%) |
Employment Occupations by Sex in Benton Heights
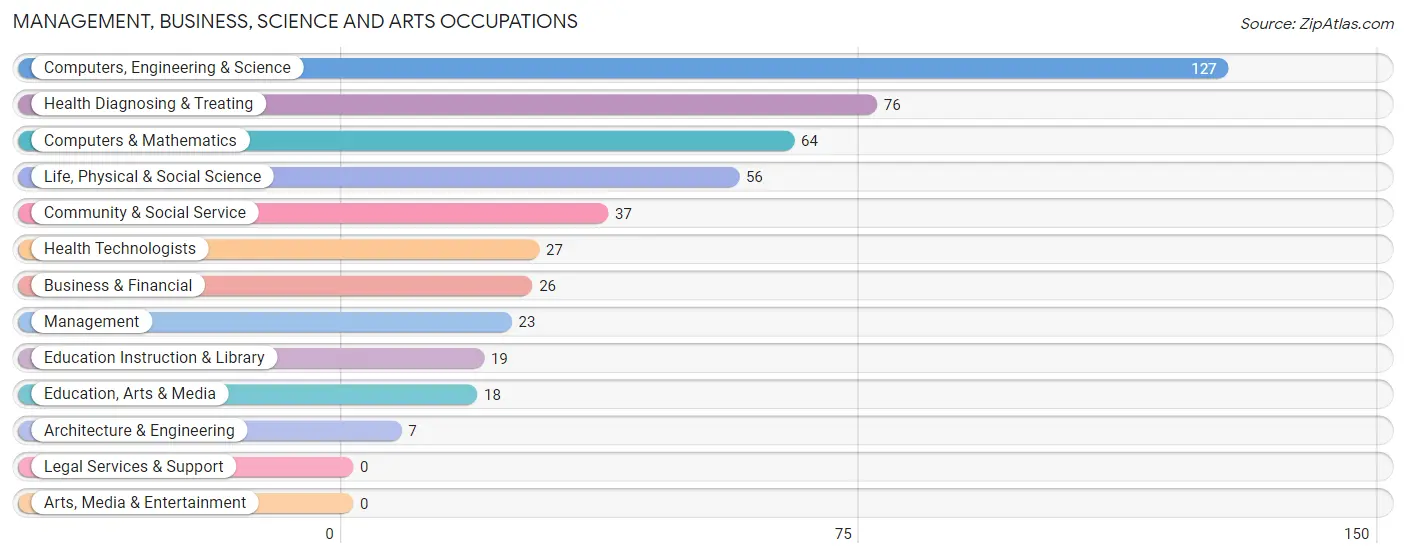
Management, Business, Science and Arts Occupations
The most common Management, Business, Science and Arts occupations in Benton Heights are Computers, Engineering & Science (127 | 8.9%), Health Diagnosing & Treating (76 | 5.3%), Computers & Mathematics (64 | 4.5%), Life, Physical & Social Science (56 | 3.9%), and Community & Social Service (37 | 2.6%).
Management, Business, Science and Arts Occupations by Sex
Within the Management, Business, Science and Arts occupations in Benton Heights, the most male-oriented occupations are Computers & Mathematics (100.0%), Architecture & Engineering (100.0%), and Management (69.6%), while the most female-oriented occupations are Life, Physical & Social Science (100.0%), Health Diagnosing & Treating (100.0%), and Health Technologists (100.0%).
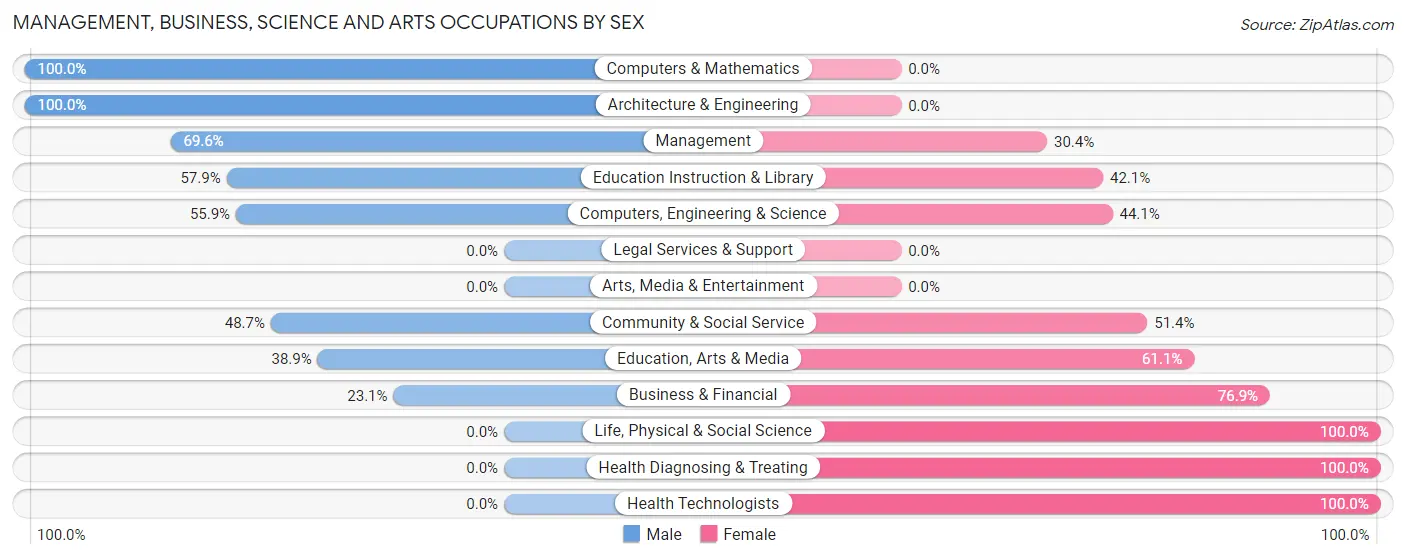
| Occupation | Male | Female |
| Management | 16 (69.6%) | 7 (30.4%) |
| Business & Financial | 6 (23.1%) | 20 (76.9%) |
| Computers, Engineering & Science | 71 (55.9%) | 56 (44.1%) |
| Computers & Mathematics | 64 (100.0%) | 0 (0.0%) |
| Architecture & Engineering | 7 (100.0%) | 0 (0.0%) |
| Life, Physical & Social Science | 0 (0.0%) | 56 (100.0%) |
| Community & Social Service | 18 (48.6%) | 19 (51.3%) |
| Education, Arts & Media | 7 (38.9%) | 11 (61.1%) |
| Legal Services & Support | 0 (0.0%) | 0 (0.0%) |
| Education Instruction & Library | 11 (57.9%) | 8 (42.1%) |
| Arts, Media & Entertainment | 0 (0.0%) | 0 (0.0%) |
| Health Diagnosing & Treating | 0 (0.0%) | 76 (100.0%) |
| Health Technologists | 0 (0.0%) | 27 (100.0%) |
| Total (Category) | 111 (38.4%) | 178 (61.6%) |
| Total (Overall) | 739 (52.0%) | 681 (48.0%) |
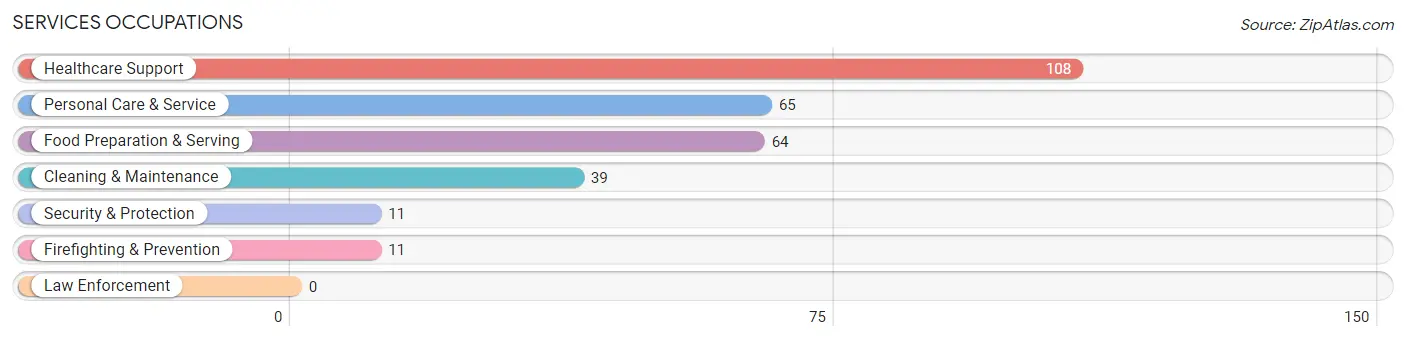
Services Occupations
The most common Services occupations in Benton Heights are Healthcare Support (108 | 7.6%), Personal Care & Service (65 | 4.6%), Food Preparation & Serving (64 | 4.5%), Cleaning & Maintenance (39 | 2.8%), and Security & Protection (11 | 0.8%).
Services Occupations by Sex
Within the Services occupations in Benton Heights, the most male-oriented occupations are Food Preparation & Serving (84.4%), Security & Protection (54.5%), and Firefighting & Prevention (54.5%), while the most female-oriented occupations are Personal Care & Service (100.0%), Cleaning & Maintenance (84.6%), and Healthcare Support (69.4%).
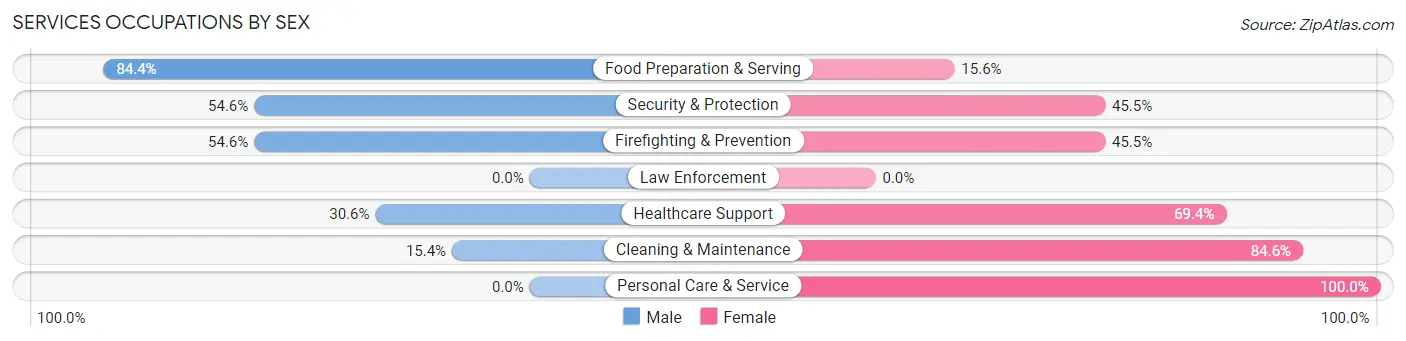
| Occupation | Male | Female |
| Healthcare Support | 33 (30.6%) | 75 (69.4%) |
| Security & Protection | 6 (54.5%) | 5 (45.5%) |
| Firefighting & Prevention | 6 (54.5%) | 5 (45.5%) |
| Law Enforcement | 0 (0.0%) | 0 (0.0%) |
| Food Preparation & Serving | 54 (84.4%) | 10 (15.6%) |
| Cleaning & Maintenance | 6 (15.4%) | 33 (84.6%) |
| Personal Care & Service | 0 (0.0%) | 65 (100.0%) |
| Total (Category) | 99 (34.5%) | 188 (65.5%) |
| Total (Overall) | 739 (52.0%) | 681 (48.0%) |
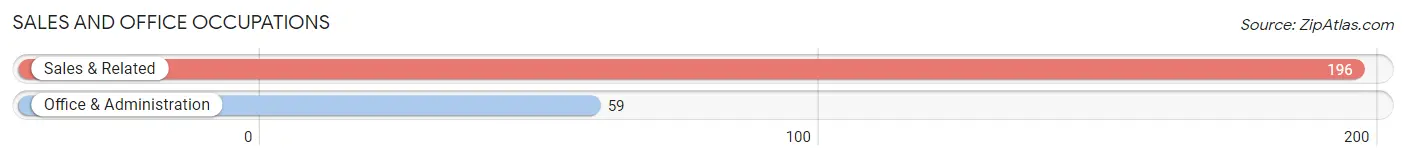
Sales and Office Occupations
The most common Sales and Office occupations in Benton Heights are Sales & Related (196 | 13.8%), and Office & Administration (59 | 4.2%).
Sales and Office Occupations by Sex
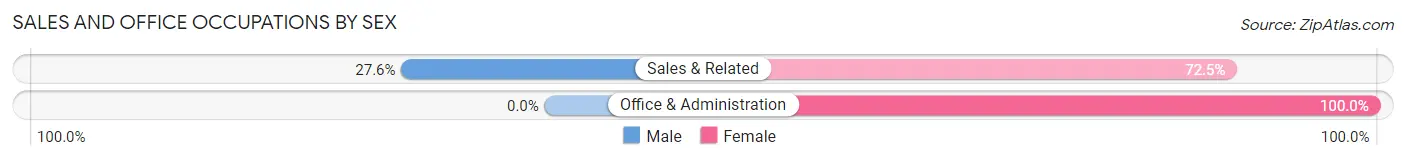
| Occupation | Male | Female |
| Sales & Related | 54 (27.6%) | 142 (72.5%) |
| Office & Administration | 0 (0.0%) | 59 (100.0%) |
| Total (Category) | 54 (21.2%) | 201 (78.8%) |
| Total (Overall) | 739 (52.0%) | 681 (48.0%) |
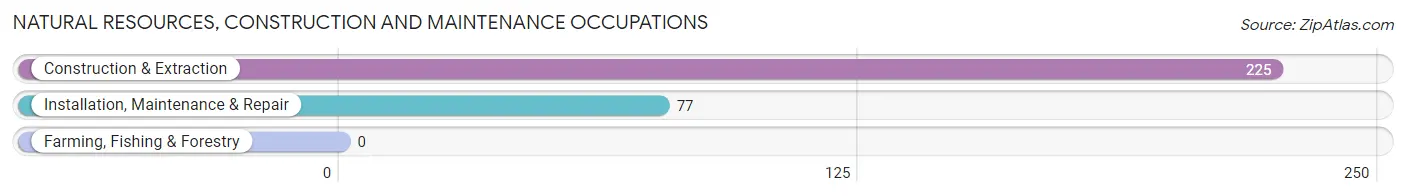
Natural Resources, Construction and Maintenance Occupations
The most common Natural Resources, Construction and Maintenance occupations in Benton Heights are Construction & Extraction (225 | 15.9%), and Installation, Maintenance & Repair (77 | 5.4%).
Natural Resources, Construction and Maintenance Occupations by Sex
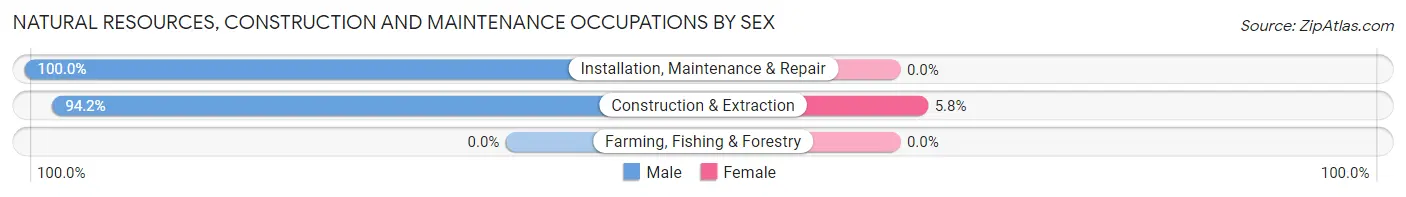
| Occupation | Male | Female |
| Farming, Fishing & Forestry | 0 (0.0%) | 0 (0.0%) |
| Construction & Extraction | 212 (94.2%) | 13 (5.8%) |
| Installation, Maintenance & Repair | 77 (100.0%) | 0 (0.0%) |
| Total (Category) | 289 (95.7%) | 13 (4.3%) |
| Total (Overall) | 739 (52.0%) | 681 (48.0%) |
Production, Transportation and Moving Occupations
The most common Production, Transportation and Moving occupations in Benton Heights are Production (168 | 11.8%), and Material Moving (119 | 8.4%).
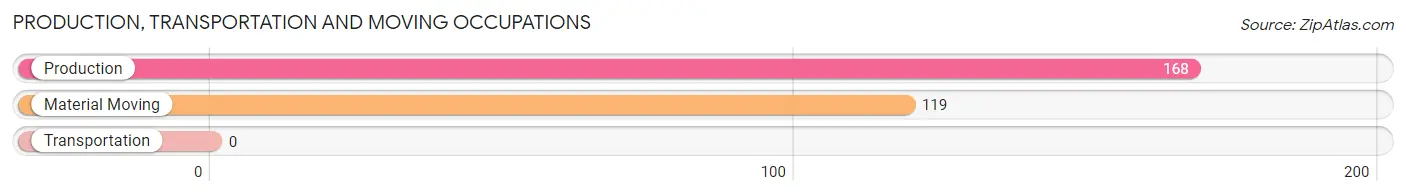
Production, Transportation and Moving Occupations by Sex
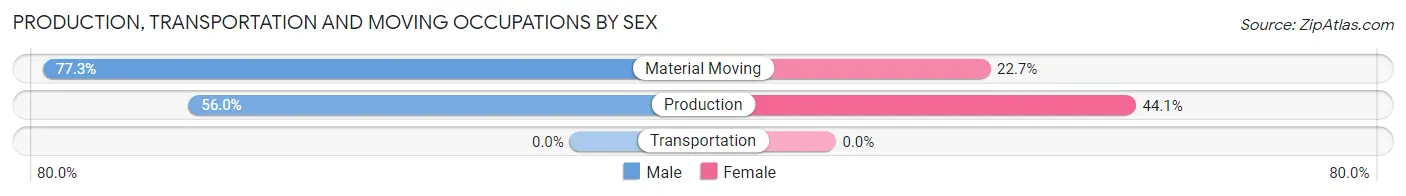
| Occupation | Male | Female |
| Production | 94 (55.9%) | 74 (44.1%) |
| Transportation | 0 (0.0%) | 0 (0.0%) |
| Material Moving | 92 (77.3%) | 27 (22.7%) |
| Total (Category) | 186 (64.8%) | 101 (35.2%) |
| Total (Overall) | 739 (52.0%) | 681 (48.0%) |
Employment Industries by Sex in Benton Heights
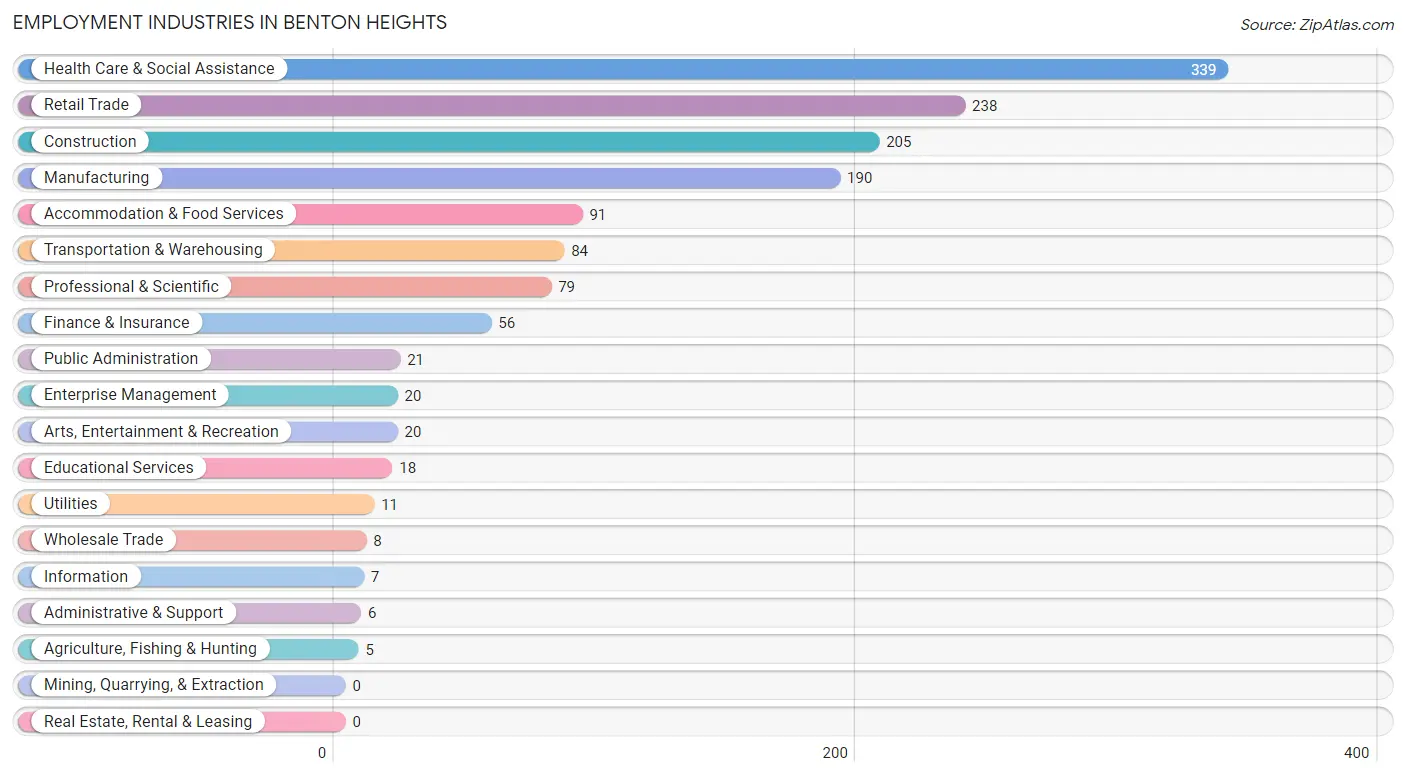
Employment Industries in Benton Heights
The major employment industries in Benton Heights include Health Care & Social Assistance (339 | 23.9%), Retail Trade (238 | 16.8%), Construction (205 | 14.4%), Manufacturing (190 | 13.4%), and Accommodation & Food Services (91 | 6.4%).
Employment Industries by Sex in Benton Heights
The Benton Heights industries that see more men than women are Agriculture, Fishing & Hunting (100.0%), Wholesale Trade (100.0%), and Transportation & Warehousing (100.0%), whereas the industries that tend to have a higher number of women are Information (100.0%), Professional & Scientific (100.0%), and Arts, Entertainment & Recreation (100.0%).
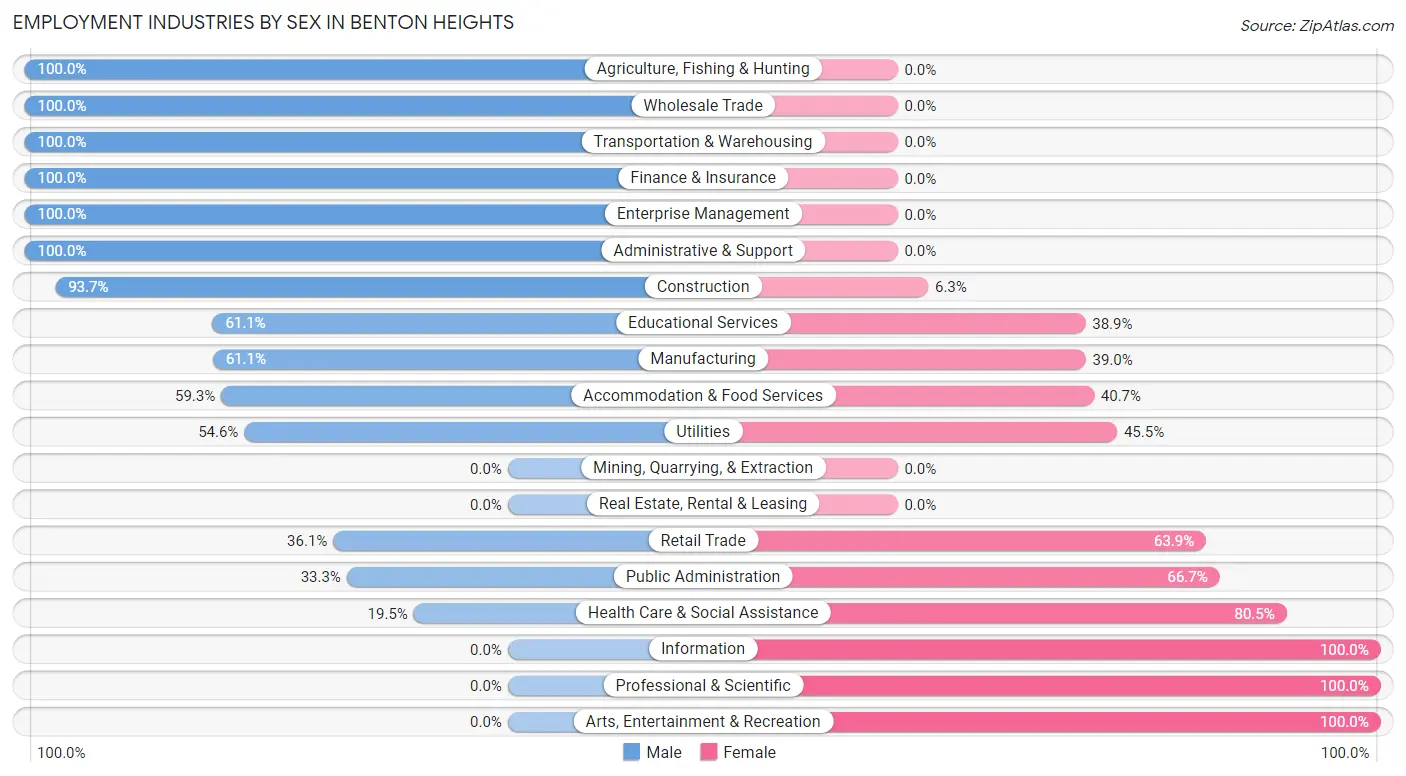
| Industry | Male | Female |
| Agriculture, Fishing & Hunting | 5 (100.0%) | 0 (0.0%) |
| Mining, Quarrying, & Extraction | 0 (0.0%) | 0 (0.0%) |
| Construction | 192 (93.7%) | 13 (6.3%) |
| Manufacturing | 116 (61.1%) | 74 (39.0%) |
| Wholesale Trade | 8 (100.0%) | 0 (0.0%) |
| Retail Trade | 86 (36.1%) | 152 (63.9%) |
| Transportation & Warehousing | 84 (100.0%) | 0 (0.0%) |
| Utilities | 6 (54.5%) | 5 (45.5%) |
| Information | 0 (0.0%) | 7 (100.0%) |
| Finance & Insurance | 56 (100.0%) | 0 (0.0%) |
| Real Estate, Rental & Leasing | 0 (0.0%) | 0 (0.0%) |
| Professional & Scientific | 0 (0.0%) | 79 (100.0%) |
| Enterprise Management | 20 (100.0%) | 0 (0.0%) |
| Administrative & Support | 6 (100.0%) | 0 (0.0%) |
| Educational Services | 11 (61.1%) | 7 (38.9%) |
| Health Care & Social Assistance | 66 (19.5%) | 273 (80.5%) |
| Arts, Entertainment & Recreation | 0 (0.0%) | 20 (100.0%) |
| Accommodation & Food Services | 54 (59.3%) | 37 (40.7%) |
| Public Administration | 7 (33.3%) | 14 (66.7%) |
| Total | 739 (52.0%) | 681 (48.0%) |
Education in Benton Heights
School Enrollment in Benton Heights
The most common levels of schooling among the 1,165 students in Benton Heights are middle school (264 | 22.7%), high school (243 | 20.9%), and elementary school (235 | 20.2%).
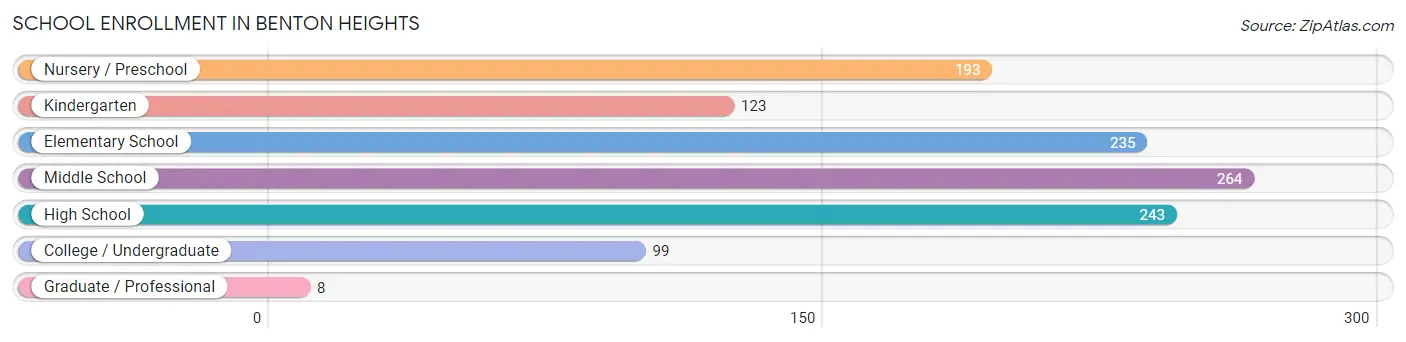
| School Level | # Students | % Students |
| Nursery / Preschool | 193 | 16.6% |
| Kindergarten | 123 | 10.6% |
| Elementary School | 235 | 20.2% |
| Middle School | 264 | 22.7% |
| High School | 243 | 20.9% |
| College / Undergraduate | 99 | 8.5% |
| Graduate / Professional | 8 | 0.7% |
| Total | 1,165 | 100.0% |
School Enrollment by Age by Funding Source in Benton Heights
Out of a total of 1,165 students who are enrolled in schools in Benton Heights, 212 (18.2%) attend a private institution, while the remaining 953 (81.8%) are enrolled in public schools. The age group of 25 to 34 year olds has the highest likelihood of being enrolled in private schools, with 8 (44.4% in the age bracket) enrolled. Conversely, the age group of 3 to 4 year olds has the lowest likelihood of being enrolled in a private school, with 104 (100.0% in the age bracket) attending a public institution.
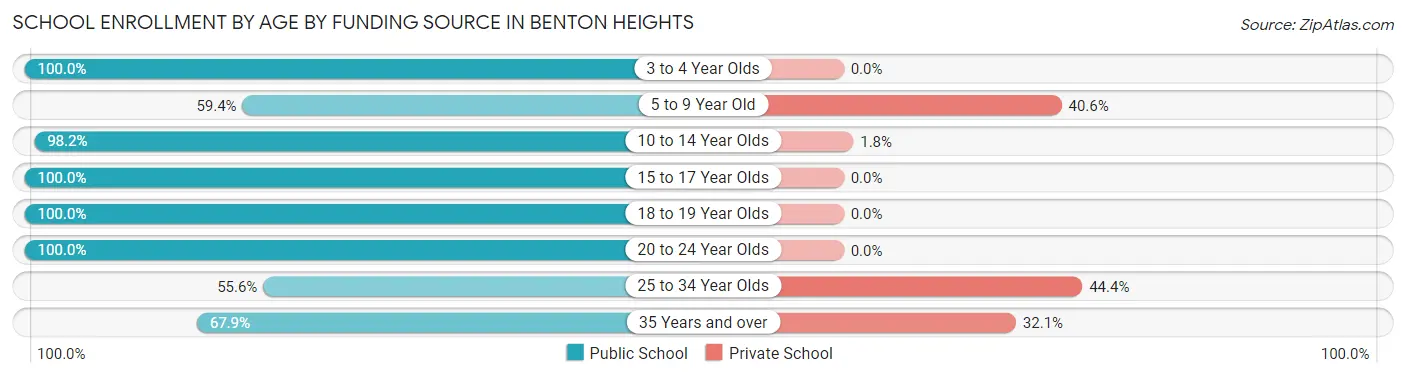
| Age Bracket | Public School | Private School |
| 3 to 4 Year Olds | 104 (100.0%) | 0 (0.0%) |
| 5 to 9 Year Old | 268 (59.4%) | 183 (40.6%) |
| 10 to 14 Year Olds | 220 (98.2%) | 4 (1.8%) |
| 15 to 17 Year Olds | 177 (100.0%) | 0 (0.0%) |
| 18 to 19 Year Olds | 73 (100.0%) | 0 (0.0%) |
| 20 to 24 Year Olds | 65 (100.0%) | 0 (0.0%) |
| 25 to 34 Year Olds | 10 (55.6%) | 8 (44.4%) |
| 35 Years and over | 36 (67.9%) | 17 (32.1%) |
| Total | 953 (81.8%) | 212 (18.2%) |
Educational Attainment by Field of Study in Benton Heights
Engineering (97 | 30.8%), psychology (72 | 22.9%), business (45 | 14.3%), education (39 | 12.4%), and science & technology (27 | 8.6%) are the most common fields of study among 315 individuals in Benton Heights who have obtained a bachelor's degree or higher.
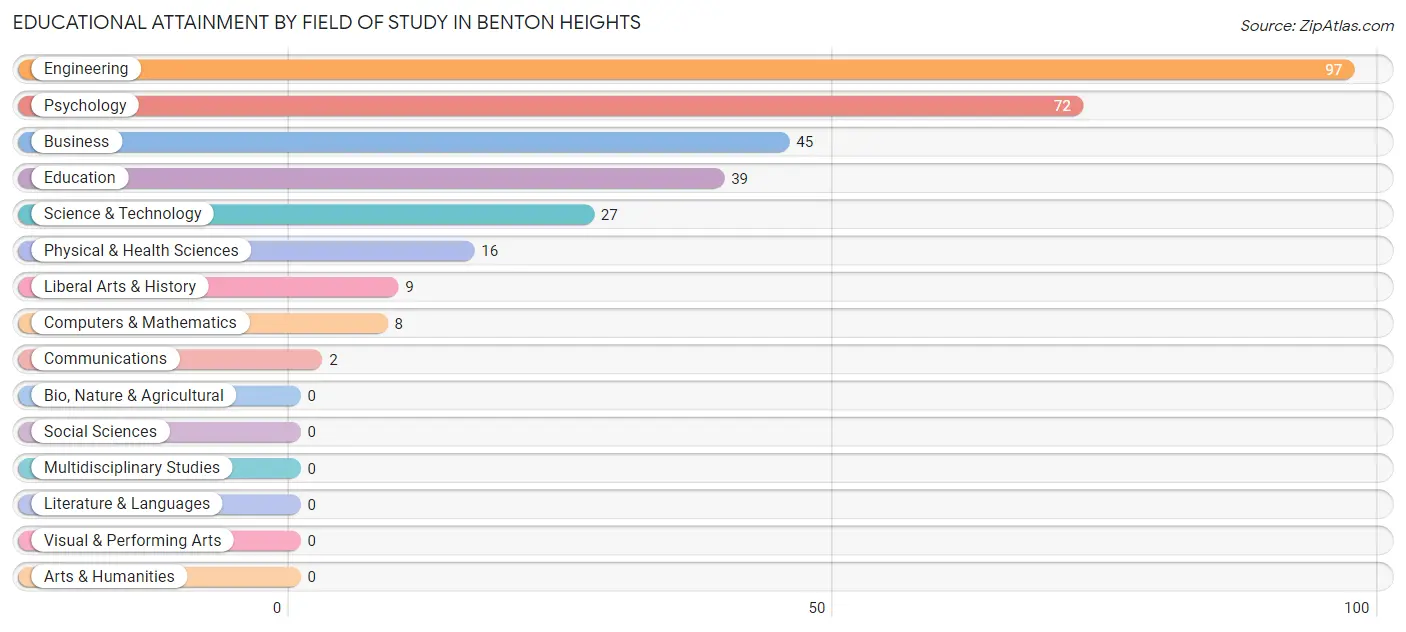
| Field of Study | # Graduates | % Graduates |
| Computers & Mathematics | 8 | 2.5% |
| Bio, Nature & Agricultural | 0 | 0.0% |
| Physical & Health Sciences | 16 | 5.1% |
| Psychology | 72 | 22.9% |
| Social Sciences | 0 | 0.0% |
| Engineering | 97 | 30.8% |
| Multidisciplinary Studies | 0 | 0.0% |
| Science & Technology | 27 | 8.6% |
| Business | 45 | 14.3% |
| Education | 39 | 12.4% |
| Literature & Languages | 0 | 0.0% |
| Liberal Arts & History | 9 | 2.9% |
| Visual & Performing Arts | 0 | 0.0% |
| Communications | 2 | 0.6% |
| Arts & Humanities | 0 | 0.0% |
| Total | 315 | 100.0% |
Transportation & Commute in Benton Heights
Vehicle Availability by Sex in Benton Heights
The most prevalent vehicle ownership categories in Benton Heights are males with 1 vehicle (307, accounting for 45.2%) and females with 1 vehicle (305, making up 46.9%).
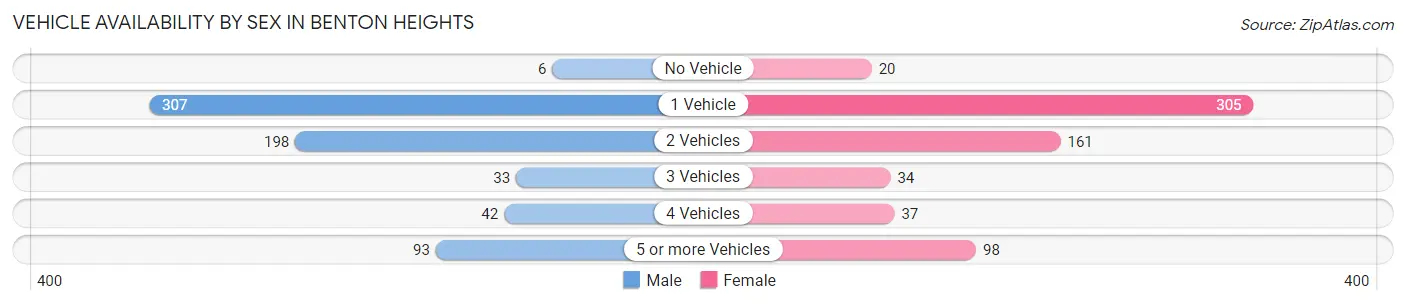
| Vehicles Available | Male | Female |
| No Vehicle | 6 (0.9%) | 20 (3.0%) |
| 1 Vehicle | 307 (45.2%) | 305 (46.6%) |
| 2 Vehicles | 198 (29.2%) | 161 (24.6%) |
| 3 Vehicles | 33 (4.9%) | 34 (5.2%) |
| 4 Vehicles | 42 (6.2%) | 37 (5.7%) |
| 5 or more Vehicles | 93 (13.7%) | 98 (15.0%) |
| Total | 679 (100.0%) | 655 (100.0%) |
Commute Time in Benton Heights
The most frequently occuring commute durations in Benton Heights are 15 to 19 minutes (497 commuters, 38.7%), 10 to 14 minutes (260 commuters, 20.3%), and 20 to 24 minutes (243 commuters, 18.9%).
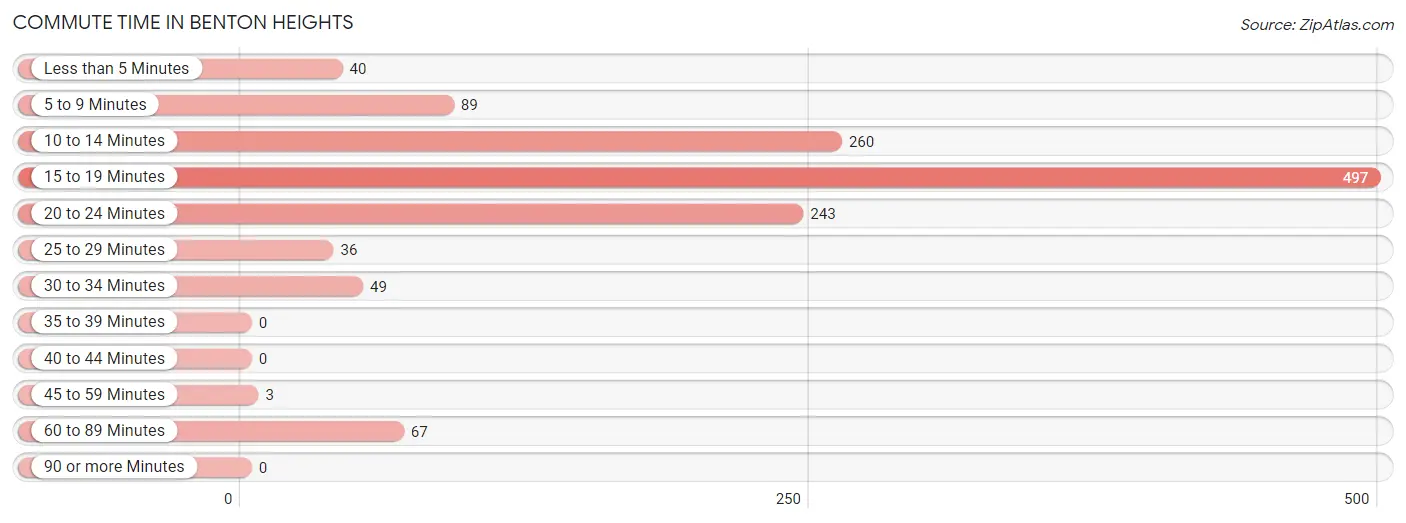
| Commute Time | # Commuters | % Commuters |
| Less than 5 Minutes | 40 | 3.1% |
| 5 to 9 Minutes | 89 | 6.9% |
| 10 to 14 Minutes | 260 | 20.3% |
| 15 to 19 Minutes | 497 | 38.7% |
| 20 to 24 Minutes | 243 | 18.9% |
| 25 to 29 Minutes | 36 | 2.8% |
| 30 to 34 Minutes | 49 | 3.8% |
| 35 to 39 Minutes | 0 | 0.0% |
| 40 to 44 Minutes | 0 | 0.0% |
| 45 to 59 Minutes | 3 | 0.2% |
| 60 to 89 Minutes | 67 | 5.2% |
| 90 or more Minutes | 0 | 0.0% |
Commute Time by Sex in Benton Heights
The most common commute times in Benton Heights are 15 to 19 minutes (245 commuters, 37.0%) for males and 15 to 19 minutes (252 commuters, 40.5%) for females.
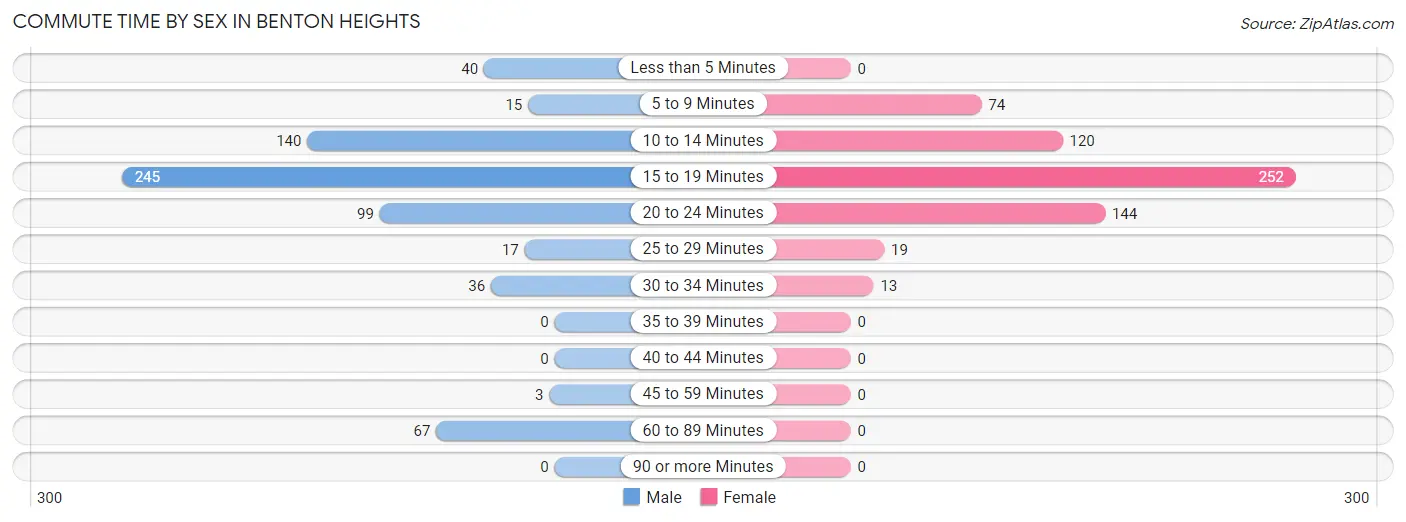
| Commute Time | Male | Female |
| Less than 5 Minutes | 40 (6.0%) | 0 (0.0%) |
| 5 to 9 Minutes | 15 (2.3%) | 74 (11.9%) |
| 10 to 14 Minutes | 140 (21.1%) | 120 (19.3%) |
| 15 to 19 Minutes | 245 (37.0%) | 252 (40.5%) |
| 20 to 24 Minutes | 99 (14.9%) | 144 (23.2%) |
| 25 to 29 Minutes | 17 (2.6%) | 19 (3.0%) |
| 30 to 34 Minutes | 36 (5.4%) | 13 (2.1%) |
| 35 to 39 Minutes | 0 (0.0%) | 0 (0.0%) |
| 40 to 44 Minutes | 0 (0.0%) | 0 (0.0%) |
| 45 to 59 Minutes | 3 (0.4%) | 0 (0.0%) |
| 60 to 89 Minutes | 67 (10.1%) | 0 (0.0%) |
| 90 or more Minutes | 0 (0.0%) | 0 (0.0%) |
Time of Departure to Work by Sex in Benton Heights
The most frequent times of departure to work in Benton Heights are 9:00 AM to 9:59 AM (143, 21.6%) for males and 7:00 AM to 7:29 AM (161, 25.9%) for females.
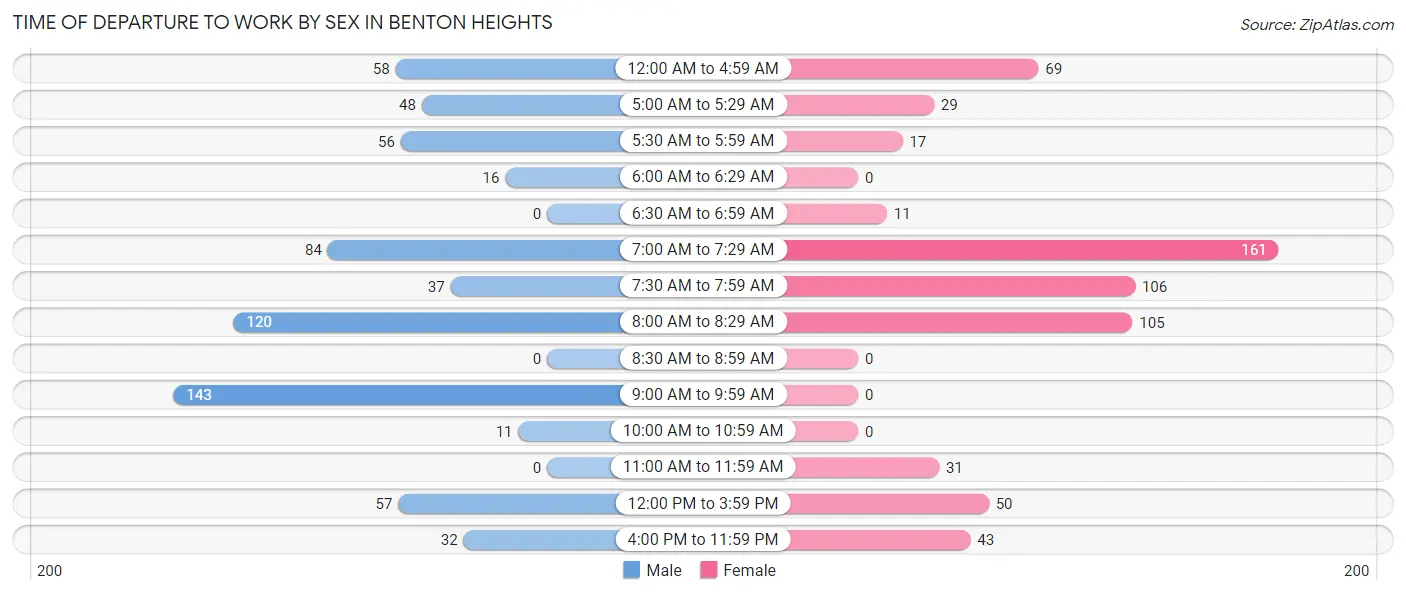
| Time of Departure | Male | Female |
| 12:00 AM to 4:59 AM | 58 (8.8%) | 69 (11.1%) |
| 5:00 AM to 5:29 AM | 48 (7.2%) | 29 (4.7%) |
| 5:30 AM to 5:59 AM | 56 (8.5%) | 17 (2.7%) |
| 6:00 AM to 6:29 AM | 16 (2.4%) | 0 (0.0%) |
| 6:30 AM to 6:59 AM | 0 (0.0%) | 11 (1.8%) |
| 7:00 AM to 7:29 AM | 84 (12.7%) | 161 (25.9%) |
| 7:30 AM to 7:59 AM | 37 (5.6%) | 106 (17.0%) |
| 8:00 AM to 8:29 AM | 120 (18.1%) | 105 (16.9%) |
| 8:30 AM to 8:59 AM | 0 (0.0%) | 0 (0.0%) |
| 9:00 AM to 9:59 AM | 143 (21.6%) | 0 (0.0%) |
| 10:00 AM to 10:59 AM | 11 (1.7%) | 0 (0.0%) |
| 11:00 AM to 11:59 AM | 0 (0.0%) | 31 (5.0%) |
| 12:00 PM to 3:59 PM | 57 (8.6%) | 50 (8.0%) |
| 4:00 PM to 11:59 PM | 32 (4.8%) | 43 (6.9%) |
| Total | 662 (100.0%) | 622 (100.0%) |
Housing Occupancy in Benton Heights
Occupancy by Ownership in Benton Heights
Of the total 1,325 dwellings in Benton Heights, owner-occupied units account for 720 (54.3%), while renter-occupied units make up 605 (45.7%).
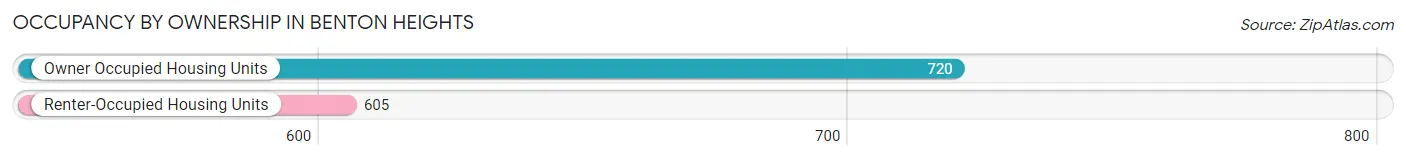
| Occupancy | # Housing Units | % Housing Units |
| Owner Occupied Housing Units | 720 | 54.3% |
| Renter-Occupied Housing Units | 605 | 45.7% |
| Total Occupied Housing Units | 1,325 | 100.0% |
Occupancy by Household Size in Benton Heights
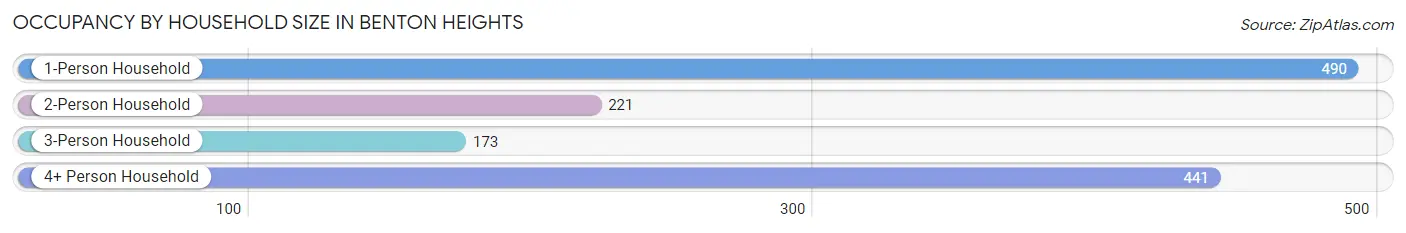
| Household Size | # Housing Units | % Housing Units |
| 1-Person Household | 490 | 37.0% |
| 2-Person Household | 221 | 16.7% |
| 3-Person Household | 173 | 13.1% |
| 4+ Person Household | 441 | 33.3% |
| Total Housing Units | 1,325 | 100.0% |
Occupancy by Ownership by Household Size in Benton Heights
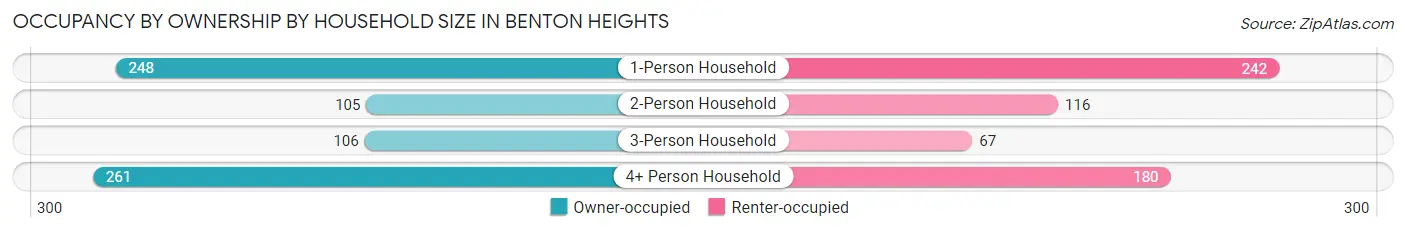
| Household Size | Owner-occupied | Renter-occupied |
| 1-Person Household | 248 (50.6%) | 242 (49.4%) |
| 2-Person Household | 105 (47.5%) | 116 (52.5%) |
| 3-Person Household | 106 (61.3%) | 67 (38.7%) |
| 4+ Person Household | 261 (59.2%) | 180 (40.8%) |
| Total Housing Units | 720 (54.3%) | 605 (45.7%) |
Occupancy by Educational Attainment in Benton Heights
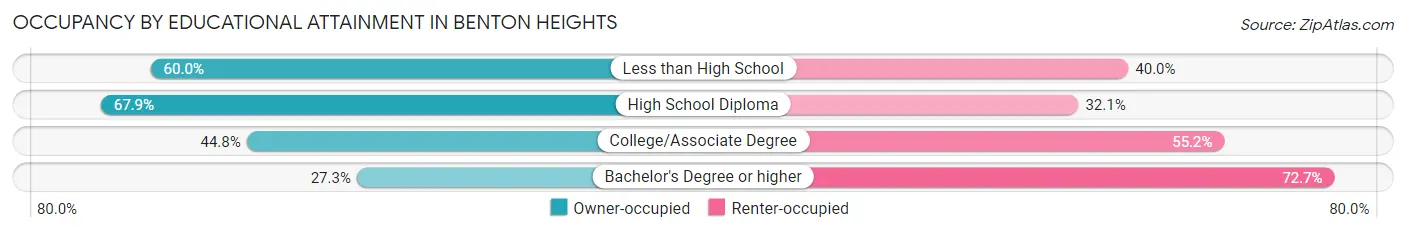
| Household Size | Owner-occupied | Renter-occupied |
| Less than High School | 144 (60.0%) | 96 (40.0%) |
| High School Diploma | 364 (67.9%) | 172 (32.1%) |
| College/Associate Degree | 159 (44.8%) | 196 (55.2%) |
| Bachelor's Degree or higher | 53 (27.3%) | 141 (72.7%) |
Occupancy by Age of Householder in Benton Heights
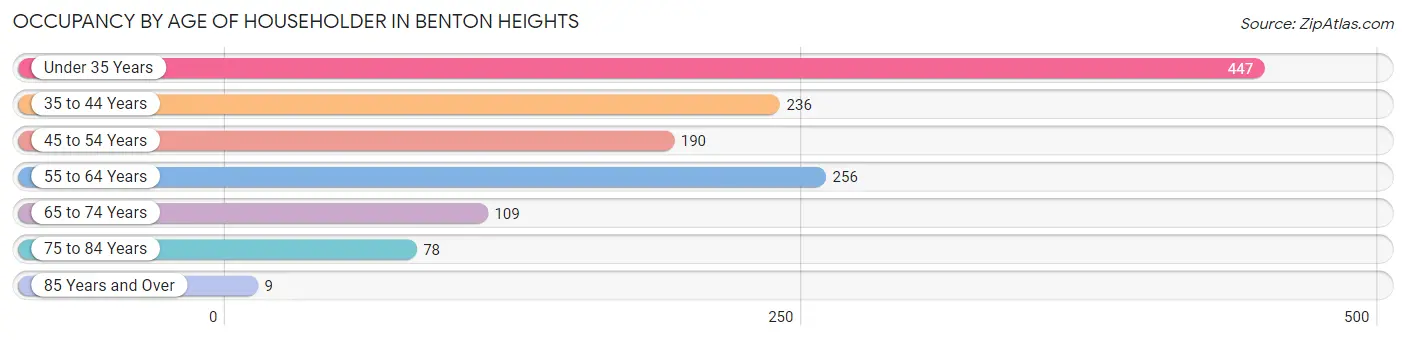
| Age Bracket | # Households | % Households |
| Under 35 Years | 447 | 33.7% |
| 35 to 44 Years | 236 | 17.8% |
| 45 to 54 Years | 190 | 14.3% |
| 55 to 64 Years | 256 | 19.3% |
| 65 to 74 Years | 109 | 8.2% |
| 75 to 84 Years | 78 | 5.9% |
| 85 Years and Over | 9 | 0.7% |
| Total | 1,325 | 100.0% |
Housing Finances in Benton Heights
Median Income by Occupancy in Benton Heights
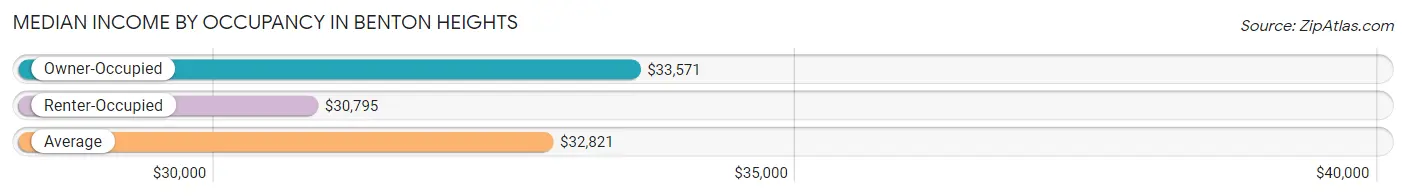
| Occupancy Type | # Households | Median Income |
| Owner-Occupied | 720 (54.3%) | $33,571 |
| Renter-Occupied | 605 (45.7%) | $30,795 |
| Average | 1,325 (100.0%) | $32,821 |
Occupancy by Householder Income Bracket in Benton Heights
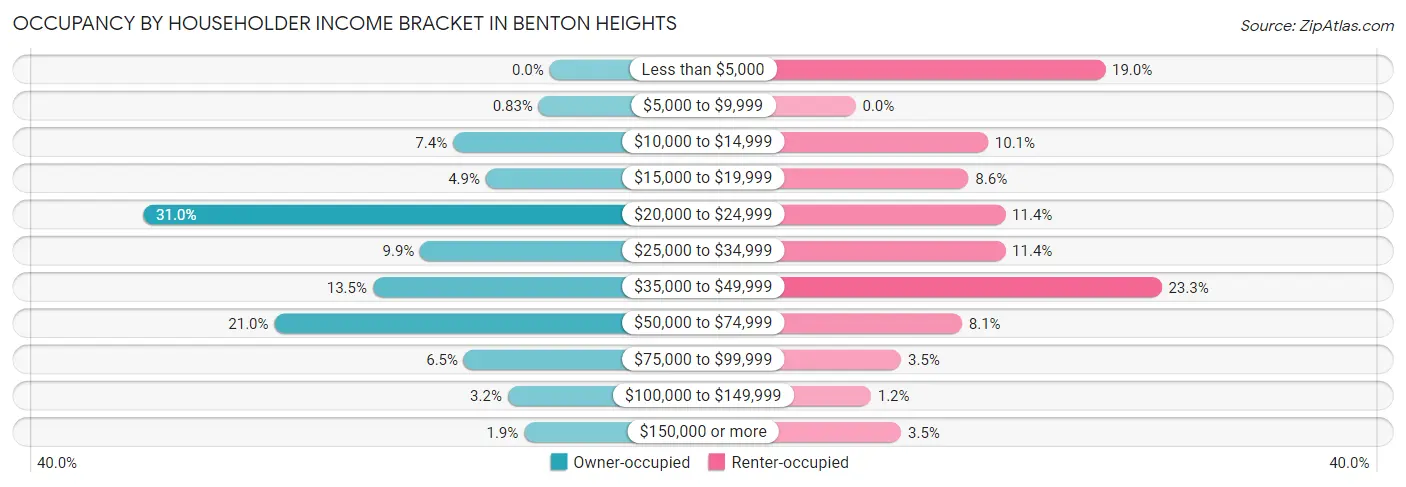
| Income Bracket | Owner-occupied | Renter-occupied |
| Less than $5,000 | 0 (0.0%) | 115 (19.0%) |
| $5,000 to $9,999 | 6 (0.8%) | 0 (0.0%) |
| $10,000 to $14,999 | 53 (7.4%) | 61 (10.1%) |
| $15,000 to $19,999 | 35 (4.9%) | 52 (8.6%) |
| $20,000 to $24,999 | 223 (31.0%) | 69 (11.4%) |
| $25,000 to $34,999 | 71 (9.9%) | 69 (11.4%) |
| $35,000 to $49,999 | 97 (13.5%) | 141 (23.3%) |
| $50,000 to $74,999 | 151 (21.0%) | 49 (8.1%) |
| $75,000 to $99,999 | 47 (6.5%) | 21 (3.5%) |
| $100,000 to $149,999 | 23 (3.2%) | 7 (1.2%) |
| $150,000 or more | 14 (1.9%) | 21 (3.5%) |
| Total | 720 (100.0%) | 605 (100.0%) |
Monthly Housing Cost Tiers in Benton Heights
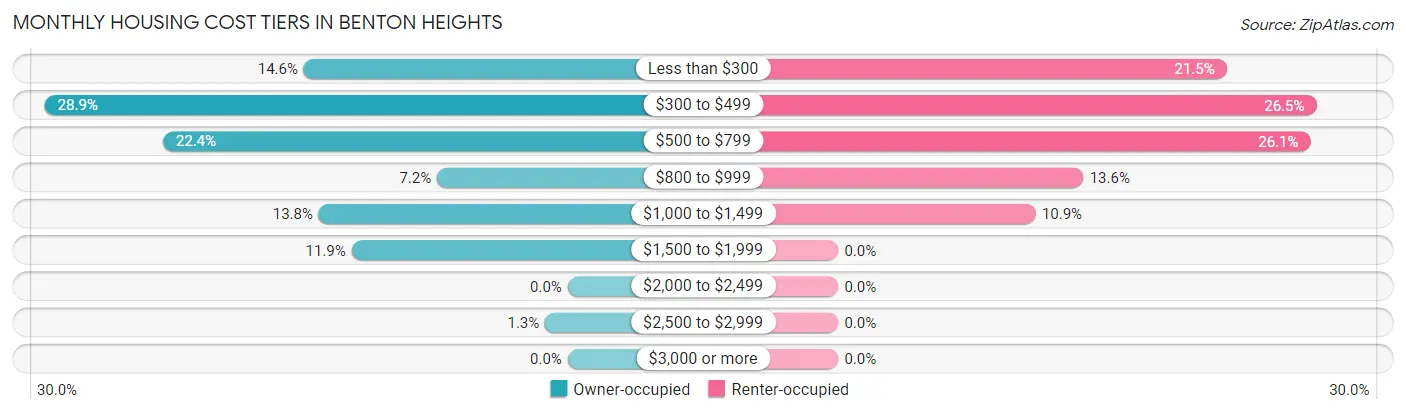
| Monthly Cost | Owner-occupied | Renter-occupied |
| Less than $300 | 105 (14.6%) | 130 (21.5%) |
| $300 to $499 | 208 (28.9%) | 160 (26.5%) |
| $500 to $799 | 161 (22.4%) | 158 (26.1%) |
| $800 to $999 | 52 (7.2%) | 82 (13.6%) |
| $1,000 to $1,499 | 99 (13.8%) | 66 (10.9%) |
| $1,500 to $1,999 | 86 (11.9%) | 0 (0.0%) |
| $2,000 to $2,499 | 0 (0.0%) | 0 (0.0%) |
| $2,500 to $2,999 | 9 (1.3%) | 0 (0.0%) |
| $3,000 or more | 0 (0.0%) | 0 (0.0%) |
| Total | 720 (100.0%) | 605 (100.0%) |
Physical Housing Characteristics in Benton Heights
Housing Structures in Benton Heights
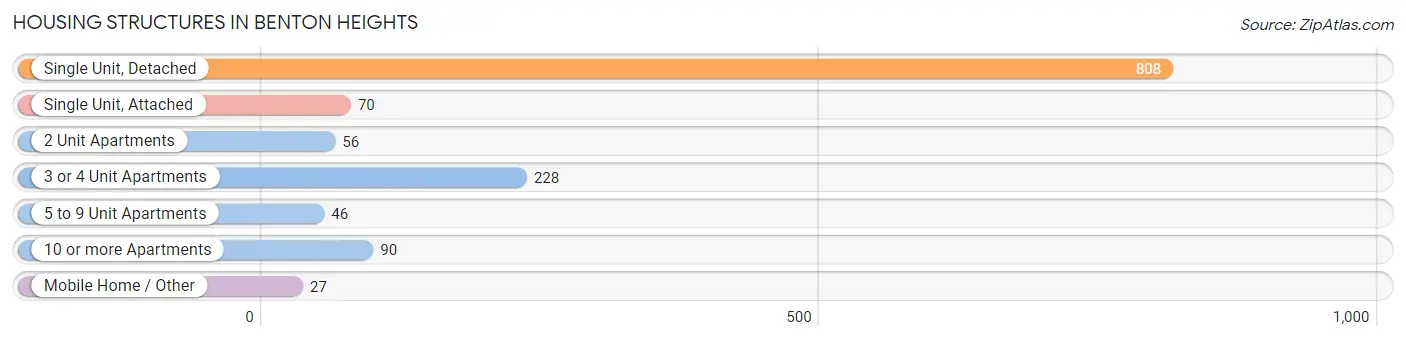
| Structure Type | # Housing Units | % Housing Units |
| Single Unit, Detached | 808 | 61.0% |
| Single Unit, Attached | 70 | 5.3% |
| 2 Unit Apartments | 56 | 4.2% |
| 3 or 4 Unit Apartments | 228 | 17.2% |
| 5 to 9 Unit Apartments | 46 | 3.5% |
| 10 or more Apartments | 90 | 6.8% |
| Mobile Home / Other | 27 | 2.0% |
| Total | 1,325 | 100.0% |
Housing Structures by Occupancy in Benton Heights
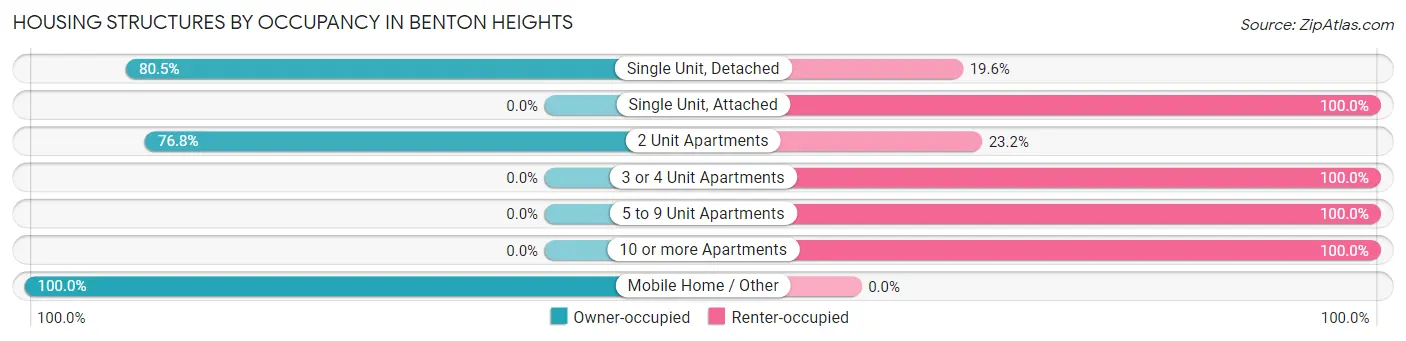
| Structure Type | Owner-occupied | Renter-occupied |
| Single Unit, Detached | 650 (80.4%) | 158 (19.6%) |
| Single Unit, Attached | 0 (0.0%) | 70 (100.0%) |
| 2 Unit Apartments | 43 (76.8%) | 13 (23.2%) |
| 3 or 4 Unit Apartments | 0 (0.0%) | 228 (100.0%) |
| 5 to 9 Unit Apartments | 0 (0.0%) | 46 (100.0%) |
| 10 or more Apartments | 0 (0.0%) | 90 (100.0%) |
| Mobile Home / Other | 27 (100.0%) | 0 (0.0%) |
| Total | 720 (54.3%) | 605 (45.7%) |
Housing Structures by Number of Rooms in Benton Heights
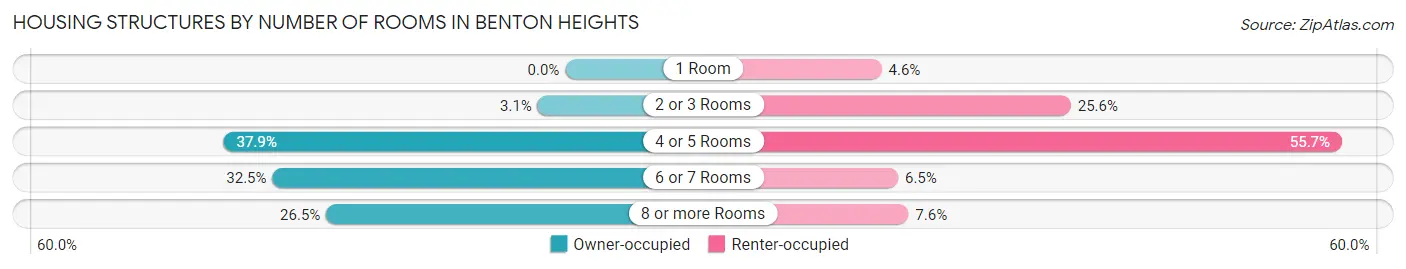
| Number of Rooms | Owner-occupied | Renter-occupied |
| 1 Room | 0 (0.0%) | 28 (4.6%) |
| 2 or 3 Rooms | 22 (3.1%) | 155 (25.6%) |
| 4 or 5 Rooms | 273 (37.9%) | 337 (55.7%) |
| 6 or 7 Rooms | 234 (32.5%) | 39 (6.5%) |
| 8 or more Rooms | 191 (26.5%) | 46 (7.6%) |
| Total | 720 (100.0%) | 605 (100.0%) |
Housing Structure by Heating Type in Benton Heights
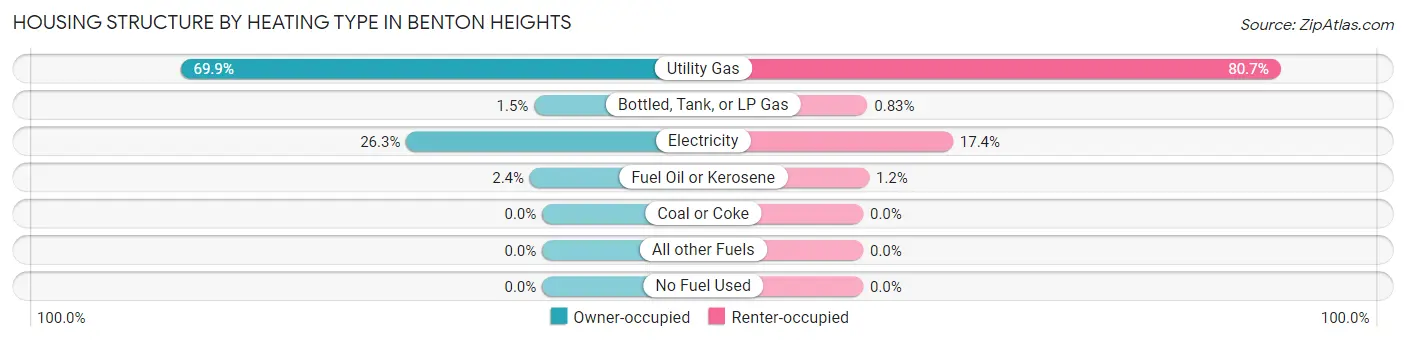
| Heating Type | Owner-occupied | Renter-occupied |
| Utility Gas | 503 (69.9%) | 488 (80.7%) |
| Bottled, Tank, or LP Gas | 11 (1.5%) | 5 (0.8%) |
| Electricity | 189 (26.3%) | 105 (17.4%) |
| Fuel Oil or Kerosene | 17 (2.4%) | 7 (1.2%) |
| Coal or Coke | 0 (0.0%) | 0 (0.0%) |
| All other Fuels | 0 (0.0%) | 0 (0.0%) |
| No Fuel Used | 0 (0.0%) | 0 (0.0%) |
| Total | 720 (100.0%) | 605 (100.0%) |
Household Vehicle Usage in Benton Heights
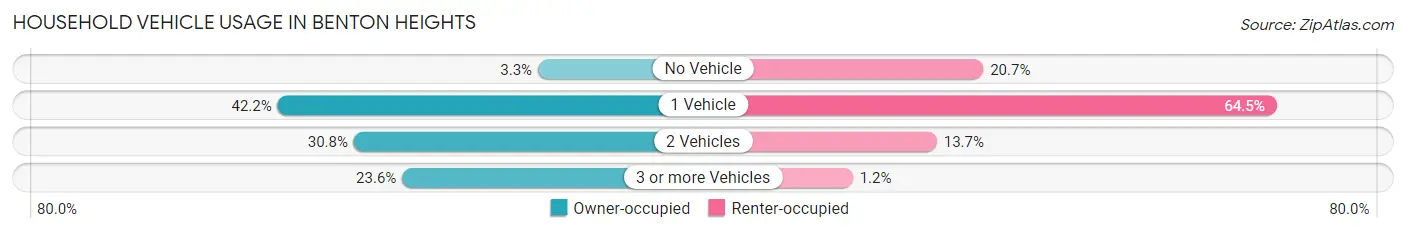
| Vehicles per Household | Owner-occupied | Renter-occupied |
| No Vehicle | 24 (3.3%) | 125 (20.7%) |
| 1 Vehicle | 304 (42.2%) | 390 (64.5%) |
| 2 Vehicles | 222 (30.8%) | 83 (13.7%) |
| 3 or more Vehicles | 170 (23.6%) | 7 (1.2%) |
| Total | 720 (100.0%) | 605 (100.0%) |
Real Estate & Mortgages in Benton Heights
Real Estate and Mortgage Overview in Benton Heights
| Characteristic | Without Mortgage | With Mortgage |
| Housing Units | 423 | 297 |
| Median Property Value | $79,300 | $117,000 |
| Median Household Income | $24,302 | $14 |
| Monthly Housing Costs | $431 | $0 |
| Real Estate Taxes | $1,168 | $0 |
Property Value by Mortgage Status in Benton Heights
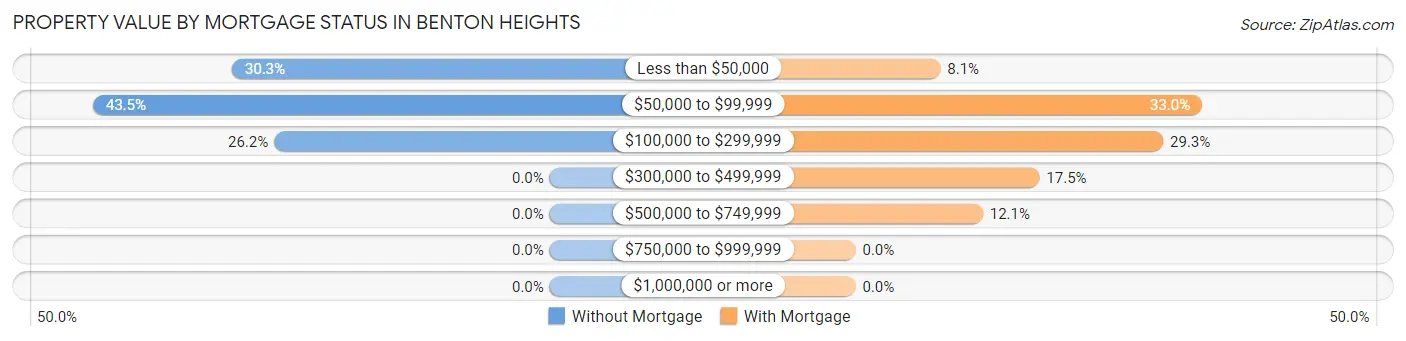
| Property Value | Without Mortgage | With Mortgage |
| Less than $50,000 | 128 (30.3%) | 24 (8.1%) |
| $50,000 to $99,999 | 184 (43.5%) | 98 (33.0%) |
| $100,000 to $299,999 | 111 (26.2%) | 87 (29.3%) |
| $300,000 to $499,999 | 0 (0.0%) | 52 (17.5%) |
| $500,000 to $749,999 | 0 (0.0%) | 36 (12.1%) |
| $750,000 to $999,999 | 0 (0.0%) | 0 (0.0%) |
| $1,000,000 or more | 0 (0.0%) | 0 (0.0%) |
| Total | 423 (100.0%) | 297 (100.0%) |
Household Income by Mortgage Status in Benton Heights
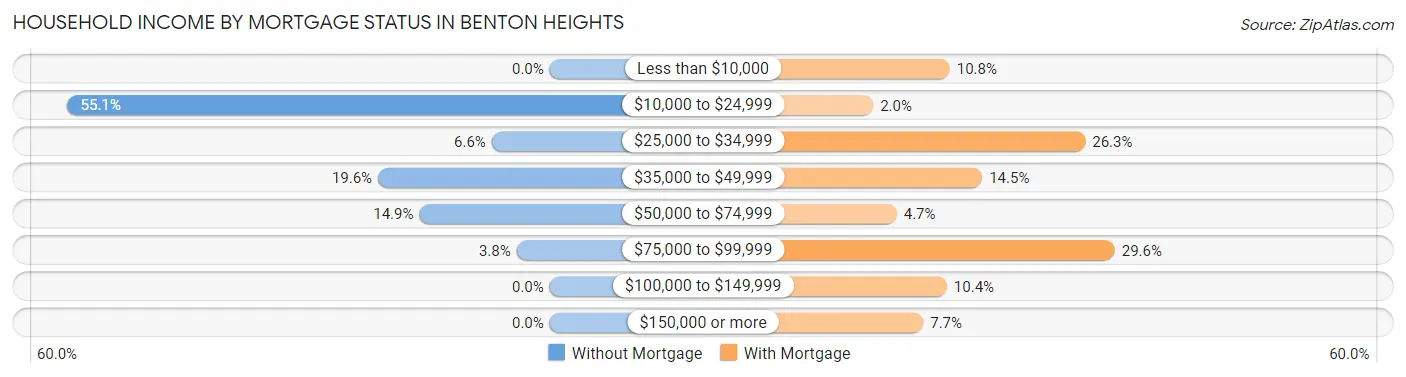
| Household Income | Without Mortgage | With Mortgage |
| Less than $10,000 | 0 (0.0%) | 32 (10.8%) |
| $10,000 to $24,999 | 233 (55.1%) | 6 (2.0%) |
| $25,000 to $34,999 | 28 (6.6%) | 78 (26.3%) |
| $35,000 to $49,999 | 83 (19.6%) | 43 (14.5%) |
| $50,000 to $74,999 | 63 (14.9%) | 14 (4.7%) |
| $75,000 to $99,999 | 16 (3.8%) | 88 (29.6%) |
| $100,000 to $149,999 | 0 (0.0%) | 31 (10.4%) |
| $150,000 or more | 0 (0.0%) | 23 (7.7%) |
| Total | 423 (100.0%) | 297 (100.0%) |
Property Value to Household Income Ratio in Benton Heights
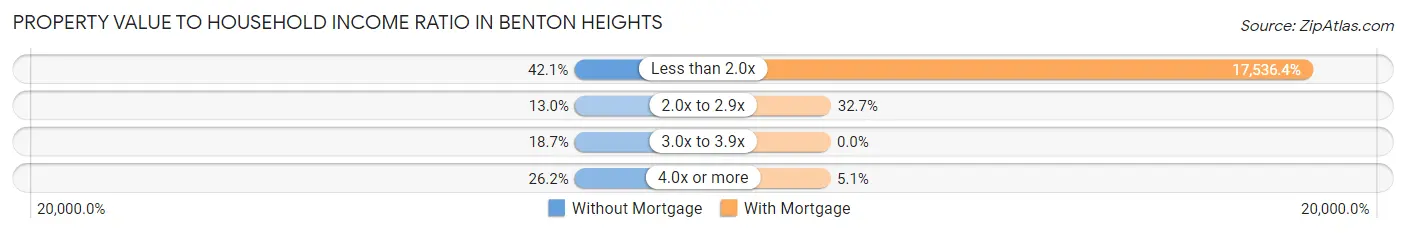
| Value-to-Income Ratio | Without Mortgage | With Mortgage |
| Less than 2.0x | 178 (42.1%) | 52,083 (17,536.4%) |
| 2.0x to 2.9x | 55 (13.0%) | 97 (32.7%) |
| 3.0x to 3.9x | 79 (18.7%) | 0 (0.0%) |
| 4.0x or more | 111 (26.2%) | 15 (5.1%) |
| Total | 423 (100.0%) | 297 (100.0%) |
Real Estate Taxes by Mortgage Status in Benton Heights
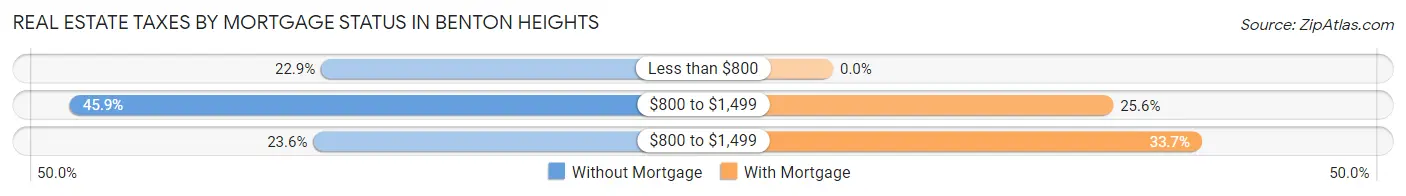
| Property Taxes | Without Mortgage | With Mortgage |
| Less than $800 | 97 (22.9%) | 0 (0.0%) |
| $800 to $1,499 | 194 (45.9%) | 76 (25.6%) |
| $800 to $1,499 | 100 (23.6%) | 100 (33.7%) |
| Total | 423 (100.0%) | 297 (100.0%) |
Health & Disability in Benton Heights
Health Insurance Coverage by Age in Benton Heights
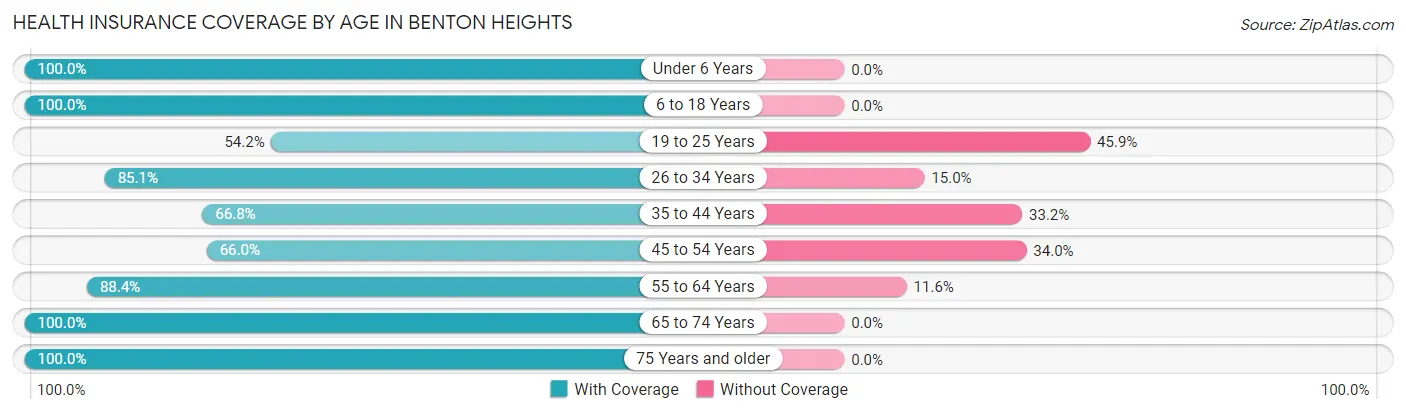
| Age Bracket | With Coverage | Without Coverage |
| Under 6 Years | 557 (100.0%) | 0 (0.0%) |
| 6 to 18 Years | 829 (100.0%) | 0 (0.0%) |
| 19 to 25 Years | 176 (54.1%) | 149 (45.9%) |
| 26 to 34 Years | 512 (85.1%) | 90 (14.9%) |
| 35 to 44 Years | 254 (66.8%) | 126 (33.2%) |
| 45 to 54 Years | 212 (66.0%) | 109 (34.0%) |
| 55 to 64 Years | 357 (88.4%) | 47 (11.6%) |
| 65 to 74 Years | 156 (100.0%) | 0 (0.0%) |
| 75 Years and older | 165 (100.0%) | 0 (0.0%) |
| Total | 3,218 (86.1%) | 521 (13.9%) |
Health Insurance Coverage by Citizenship Status in Benton Heights
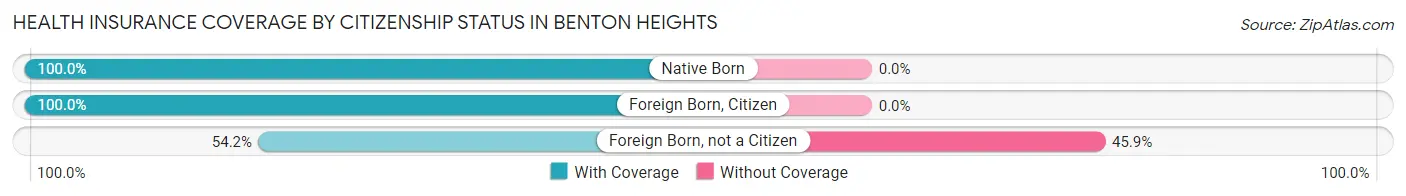
| Citizenship Status | With Coverage | Without Coverage |
| Native Born | 557 (100.0%) | 0 (0.0%) |
| Foreign Born, Citizen | 829 (100.0%) | 0 (0.0%) |
| Foreign Born, not a Citizen | 176 (54.1%) | 149 (45.9%) |
Health Insurance Coverage by Household Income in Benton Heights
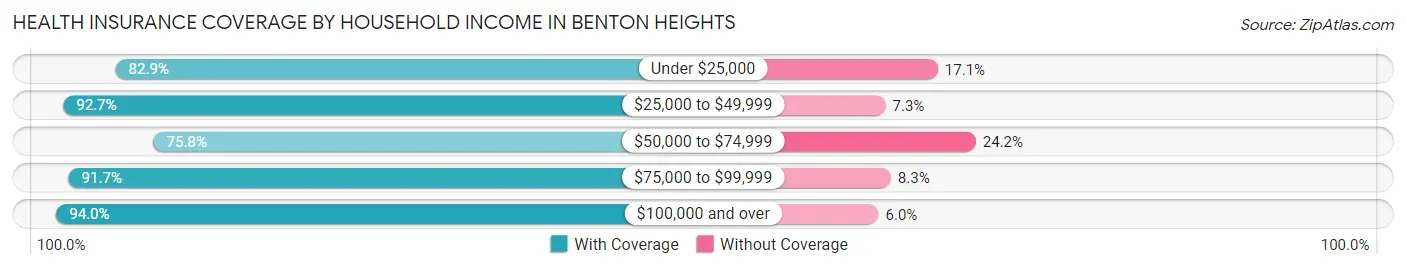
| Household Income | With Coverage | Without Coverage |
| Under $25,000 | 1,389 (82.9%) | 286 (17.1%) |
| $25,000 to $49,999 | 842 (92.7%) | 66 (7.3%) |
| $50,000 to $74,999 | 395 (75.8%) | 126 (24.2%) |
| $75,000 to $99,999 | 322 (91.7%) | 29 (8.3%) |
| $100,000 and over | 221 (94.0%) | 14 (6.0%) |
Public vs Private Health Insurance Coverage by Age in Benton Heights
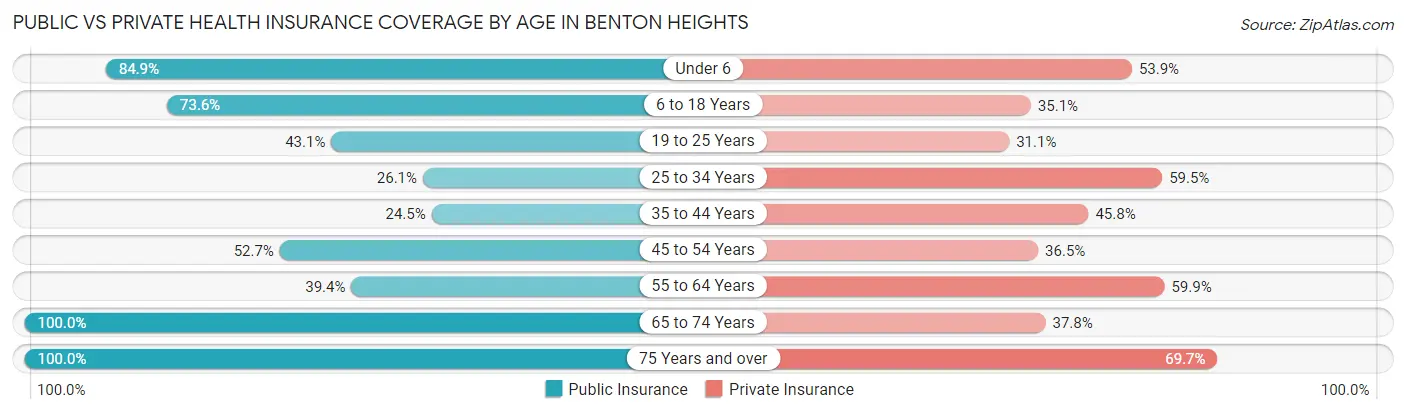
| Age Bracket | Public Insurance | Private Insurance |
| Under 6 | 473 (84.9%) | 300 (53.9%) |
| 6 to 18 Years | 610 (73.6%) | 291 (35.1%) |
| 19 to 25 Years | 140 (43.1%) | 101 (31.1%) |
| 25 to 34 Years | 157 (26.1%) | 358 (59.5%) |
| 35 to 44 Years | 93 (24.5%) | 174 (45.8%) |
| 45 to 54 Years | 169 (52.6%) | 117 (36.4%) |
| 55 to 64 Years | 159 (39.4%) | 242 (59.9%) |
| 65 to 74 Years | 156 (100.0%) | 59 (37.8%) |
| 75 Years and over | 165 (100.0%) | 115 (69.7%) |
| Total | 2,122 (56.8%) | 1,757 (47.0%) |
Disability Status by Sex by Age in Benton Heights
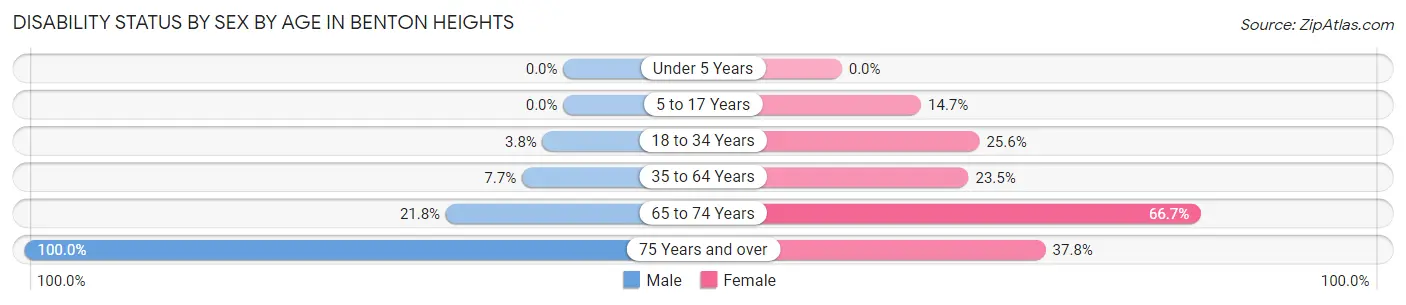
| Age Bracket | Male | Female |
| Under 5 Years | 0 (0.0%) | 0 (0.0%) |
| 5 to 17 Years | 0 (0.0%) | 72 (14.7%) |
| 18 to 34 Years | 21 (3.8%) | 114 (25.6%) |
| 35 to 64 Years | 47 (7.7%) | 116 (23.5%) |
| 65 to 74 Years | 17 (21.8%) | 52 (66.7%) |
| 75 Years and over | 91 (100.0%) | 28 (37.8%) |
Disability Class by Sex by Age in Benton Heights
Disability Class: Hearing Difficulty
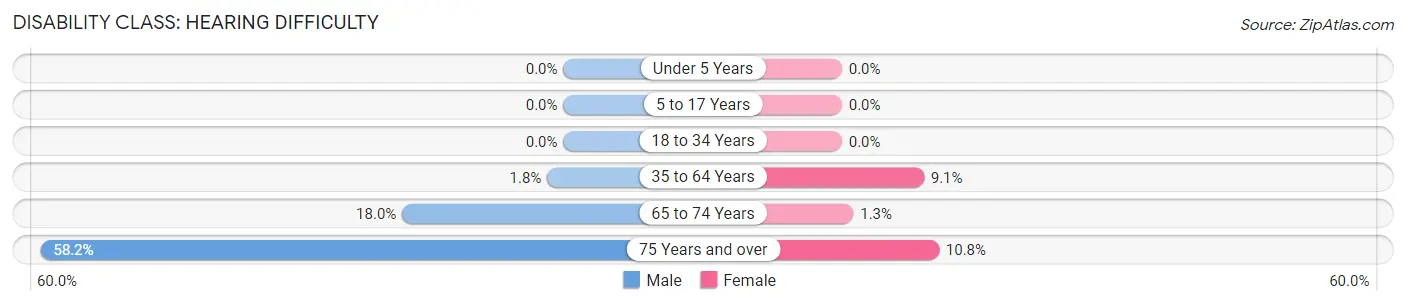
| Age Bracket | Male | Female |
| Under 5 Years | 0 (0.0%) | 0 (0.0%) |
| 5 to 17 Years | 0 (0.0%) | 0 (0.0%) |
| 18 to 34 Years | 0 (0.0%) | 0 (0.0%) |
| 35 to 64 Years | 11 (1.8%) | 45 (9.1%) |
| 65 to 74 Years | 14 (17.9%) | 1 (1.3%) |
| 75 Years and over | 53 (58.2%) | 8 (10.8%) |
Disability Class: Vision Difficulty
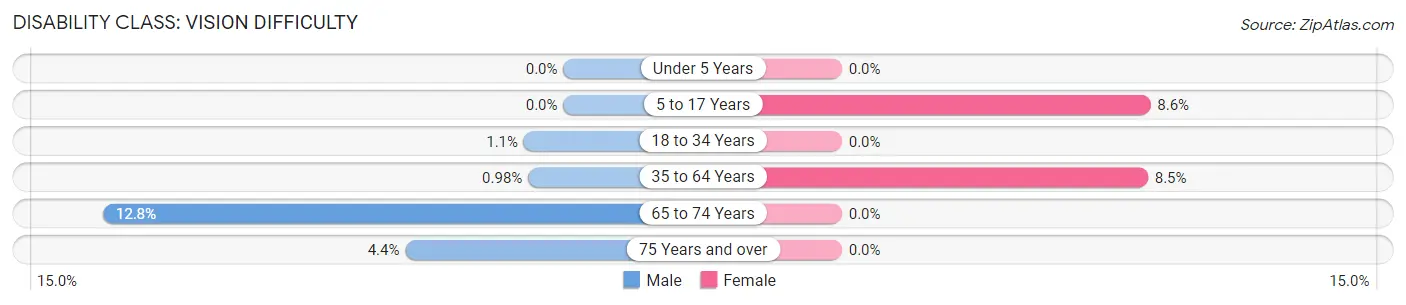
| Age Bracket | Male | Female |
| Under 5 Years | 0 (0.0%) | 0 (0.0%) |
| 5 to 17 Years | 0 (0.0%) | 42 (8.6%) |
| 18 to 34 Years | 6 (1.1%) | 0 (0.0%) |
| 35 to 64 Years | 6 (1.0%) | 42 (8.5%) |
| 65 to 74 Years | 10 (12.8%) | 0 (0.0%) |
| 75 Years and over | 4 (4.4%) | 0 (0.0%) |
Disability Class: Cognitive Difficulty
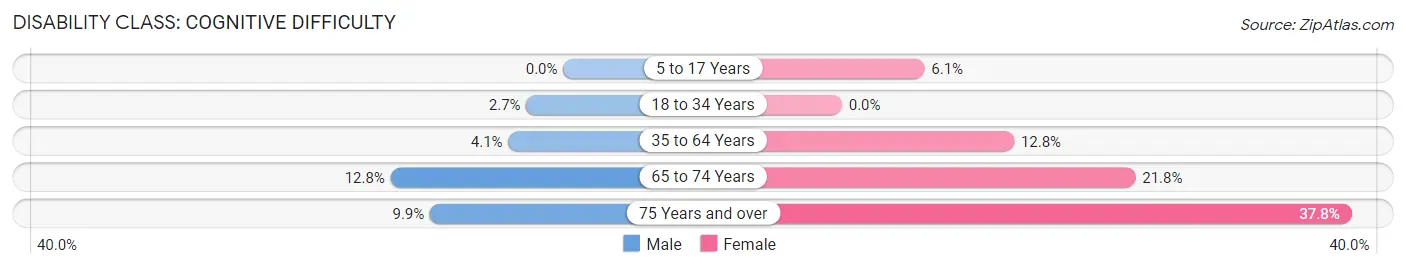
| Age Bracket | Male | Female |
| 5 to 17 Years | 0 (0.0%) | 30 (6.1%) |
| 18 to 34 Years | 15 (2.7%) | 0 (0.0%) |
| 35 to 64 Years | 25 (4.1%) | 63 (12.8%) |
| 65 to 74 Years | 10 (12.8%) | 17 (21.8%) |
| 75 Years and over | 9 (9.9%) | 28 (37.8%) |
Disability Class: Ambulatory Difficulty
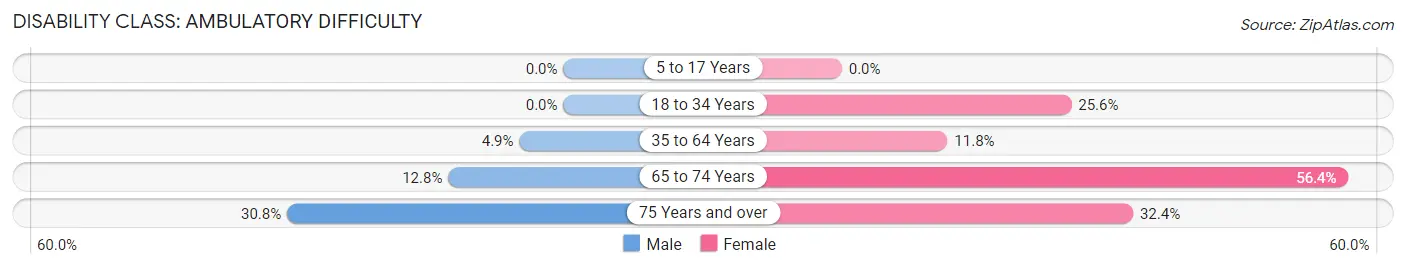
| Age Bracket | Male | Female |
| 5 to 17 Years | 0 (0.0%) | 0 (0.0%) |
| 18 to 34 Years | 0 (0.0%) | 114 (25.6%) |
| 35 to 64 Years | 30 (4.9%) | 58 (11.8%) |
| 65 to 74 Years | 10 (12.8%) | 44 (56.4%) |
| 75 Years and over | 28 (30.8%) | 24 (32.4%) |
Disability Class: Self-Care Difficulty
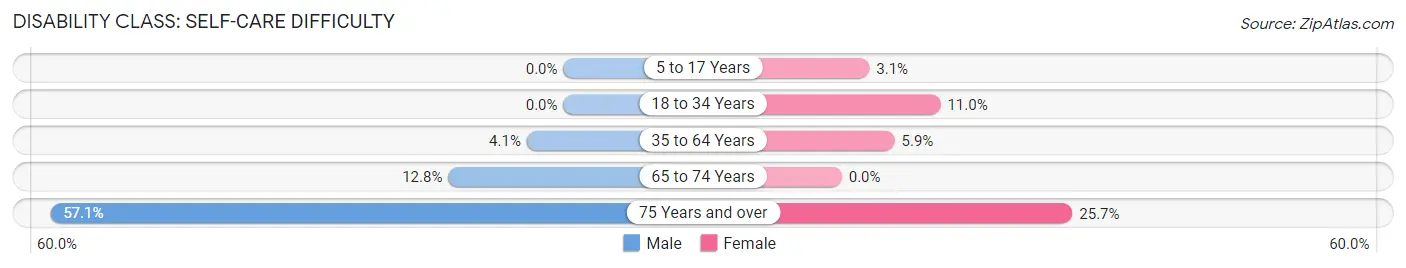
| Age Bracket | Male | Female |
| 5 to 17 Years | 0 (0.0%) | 15 (3.1%) |
| 18 to 34 Years | 0 (0.0%) | 49 (11.0%) |
| 35 to 64 Years | 25 (4.1%) | 29 (5.9%) |
| 65 to 74 Years | 10 (12.8%) | 0 (0.0%) |
| 75 Years and over | 52 (57.1%) | 19 (25.7%) |
Technology Access in Benton Heights
Computing Device Access in Benton Heights
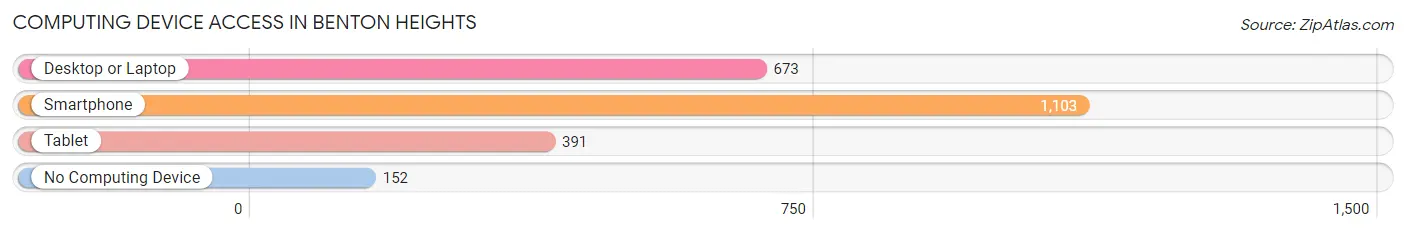
| Device Type | # Households | % Households |
| Desktop or Laptop | 673 | 50.8% |
| Smartphone | 1,103 | 83.3% |
| Tablet | 391 | 29.5% |
| No Computing Device | 152 | 11.5% |
| Total | 1,325 | 100.0% |
Internet Access in Benton Heights
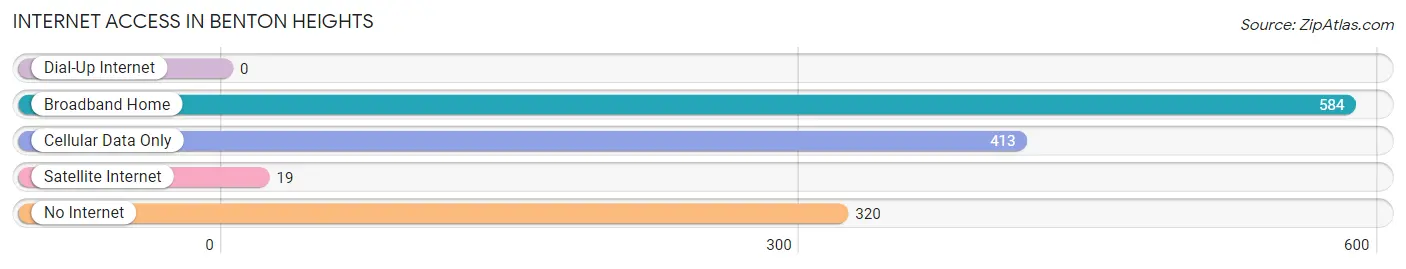
| Internet Type | # Households | % Households |
| Dial-Up Internet | 0 | 0.0% |
| Broadband Home | 584 | 44.1% |
| Cellular Data Only | 413 | 31.2% |
| Satellite Internet | 19 | 1.4% |
| No Internet | 320 | 24.1% |
| Total | 1,325 | 100.0% |
Benton Heights Summary
Benton Heights is a small unincorporated community located in the southwestern corner of Michigan’s Lower Peninsula. It is situated in the county of Berrien, approximately 10 miles south of the city of Benton Harbor. The community is bordered by the cities of St. Joseph and Benton Harbor, as well as the townships of Benton Charter and Hagar.
History
The area that is now known as Benton Heights was first settled in the early 1800s by a group of settlers from New York. The settlers were attracted to the area due to its fertile soil and abundant natural resources. The first permanent settlement was established in 1837 and was named Benton Heights. The community was named after the nearby city of Benton Harbor, which was named after Thomas Hart Benton, a prominent politician from Missouri.
The early settlers of Benton Heights were primarily farmers and the community grew slowly over the years. In the late 1800s, the area began to experience a period of rapid growth due to the development of the nearby cities of St. Joseph and Benton Harbor. This growth was further fueled by the construction of the Grand Trunk Railroad, which connected Benton Heights to the larger cities.
By the early 1900s, Benton Heights had become a thriving community with a population of over 1,000 people. The community was home to a variety of businesses, including a general store, a post office, a blacksmith shop, and several churches.
Geography
Benton Heights is located in the southwestern corner of Michigan’s Lower Peninsula. It is situated in the county of Berrien, approximately 10 miles south of the city of Benton Harbor. The community is bordered by the cities of St. Joseph and Benton Harbor, as well as the townships of Benton Charter and Hagar.
The terrain of Benton Heights is mostly flat, with some rolling hills in the northern part of the community. The area is drained by the Paw Paw River, which flows through the community from north to south. The climate of Benton Heights is classified as humid continental, with hot summers and cold winters.
Economy
The economy of Benton Heights is largely based on agriculture and tourism. The area is home to several farms, which produce a variety of crops, including corn, soybeans, and wheat. The community is also home to several wineries, which produce a variety of wines.
In addition to agriculture, Benton Heights is home to several small businesses, including restaurants, retail stores, and service providers. The community is also home to several manufacturing companies, which produce a variety of products, including furniture, clothing, and automotive parts.
Demographics
As of the 2010 census, the population of Benton Heights was 1,093. The racial makeup of the community was 94.3% White, 2.2% African American, 0.7% Native American, 0.4% Asian, 0.1% Pacific Islander, and 2.3% from other races. The median household income in Benton Heights was $37,917, and the median family income was $45,938. The per capita income in Benton Heights was $19,845.
Conclusion
Benton Heights is a small unincorporated community located in the southwestern corner of Michigan’s Lower Peninsula. It is situated in the county of Berrien, approximately 10 miles south of the city of Benton Harbor. The community is bordered by the cities of St. Joseph and Benton Harbor, as well as the townships of Benton Charter and Hagar. The economy of Benton Heights is largely based on agriculture and tourism, and the population of the community was 1,093 as of the 2010 census.
Common Questions
What is Per Capita Income in Benton Heights?
Per Capita income in Benton Heights is $15,213.
What is the Median Family Income in Benton Heights?
Median Family Income in Benton Heights is $35,733.
What is the Median Household income in Benton Heights?
Median Household Income in Benton Heights is $32,821.
What is Income or Wage Gap in Benton Heights?
Income or Wage Gap in Benton Heights is 34.7%.
Women in Benton Heights earn 65.3 cents for every dollar earned by a man.
What is Inequality or Gini Index in Benton Heights?
Inequality or Gini Index in Benton Heights is 0.42.
What is the Total Population of Benton Heights?
Total Population of Benton Heights is 3,763.
What is the Total Male Population of Benton Heights?
Total Male Population of Benton Heights is 2,016.
What is the Total Female Population of Benton Heights?
Total Female Population of Benton Heights is 1,747.
What is the Ratio of Males per 100 Females in Benton Heights?
There are 115.40 Males per 100 Females in Benton Heights.
What is the Ratio of Females per 100 Males in Benton Heights?
There are 86.66 Females per 100 Males in Benton Heights.
What is the Median Population Age in Benton Heights?
Median Population Age in Benton Heights is 28.3 Years.
What is the Average Family Size in Benton Heights
Average Family Size in Benton Heights is 3.7 People.
What is the Average Household Size in Benton Heights
Average Household Size in Benton Heights is 2.8 People.
How Large is the Labor Force in Benton Heights?
There are 1,605 People in the Labor Forcein in Benton Heights.
What is the Percentage of People in the Labor Force in Benton Heights?
65.3% of People are in the Labor Force in Benton Heights.
What is the Unemployment Rate in Benton Heights?
Unemployment Rate in Benton Heights is 11.5%.