Oak Park, MI Map & Demographics
Oak Park Map
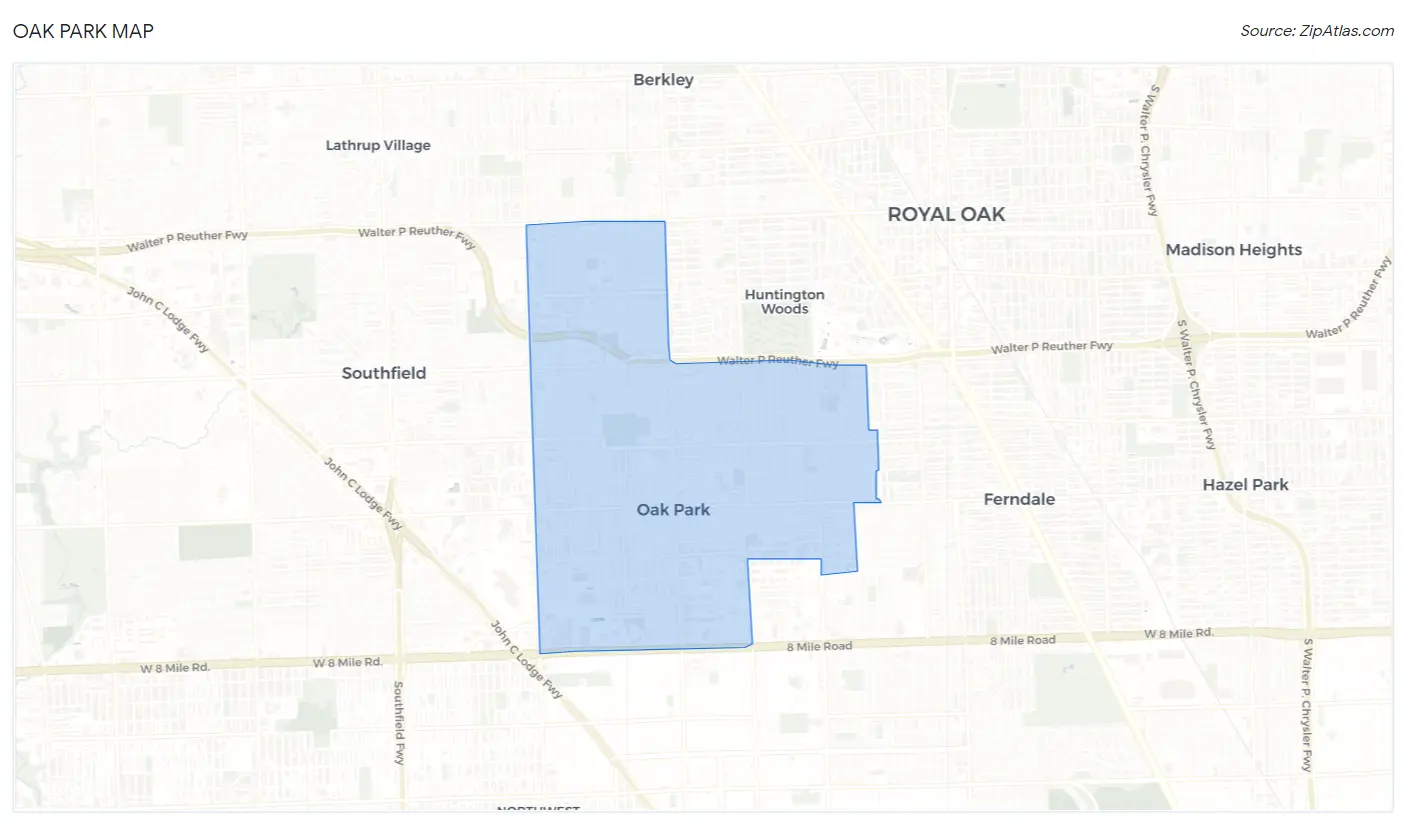
Oak Park Overview
$34,974
PER CAPITA INCOME
$72,666
AVG FAMILY INCOME
$61,991
AVG HOUSEHOLD INCOME
8.0%
WAGE / INCOME GAP [ % ]
92.0¢/ $1
WAGE / INCOME GAP [ $ ]
$9,776
FAMILY INCOME DEFICIT
0.43
INEQUALITY / GINI INDEX
29,495
TOTAL POPULATION
13,716
MALE POPULATION
15,779
FEMALE POPULATION
86.93
MALES / 100 FEMALES
115.04
FEMALES / 100 MALES
37.9
MEDIAN AGE
3.1
AVG FAMILY SIZE
2.4
AVG HOUSEHOLD SIZE
16,596
LABOR FORCE [ PEOPLE ]
67.3%
PERCENT IN LABOR FORCE
9.9%
UNEMPLOYMENT RATE
Oak Park Zip Codes
Income in Oak Park
Income Overview in Oak Park
Per Capita Income in Oak Park is $34,974, while median incomes of families and households are $72,666 and $61,991 respectively.
| Characteristic | Number | Measure |
| Per Capita Income | 29,495 | $34,974 |
| Median Family Income | 7,067 | $72,666 |
| Mean Family Income | 7,067 | $90,259 |
| Median Household Income | 12,432 | $61,991 |
| Mean Household Income | 12,432 | $79,378 |
| Income Deficit | 7,067 | $9,776 |
| Wage / Income Gap (%) | 29,495 | 8.00% |
| Wage / Income Gap ($) | 29,495 | 92.00¢ per $1 |
| Gini / Inequality Index | 29,495 | 0.43 |
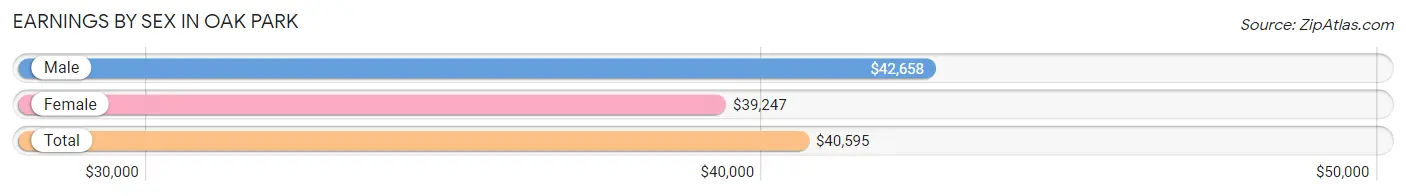
Earnings by Sex in Oak Park
Average Earnings in Oak Park are $40,595, $42,658 for men and $39,247 for women, a difference of 8.0%.
| Sex | Number | Average Earnings |
| Male | 8,197 (48.4%) | $42,658 |
| Female | 8,737 (51.6%) | $39,247 |
| Total | 16,934 (100.0%) | $40,595 |
Earnings by Sex by Income Bracket in Oak Park
The most common earnings brackets in Oak Park are $100,000+ for men (902 | 11.0%) and $75,000 to $99,999 for women (847 | 9.7%).
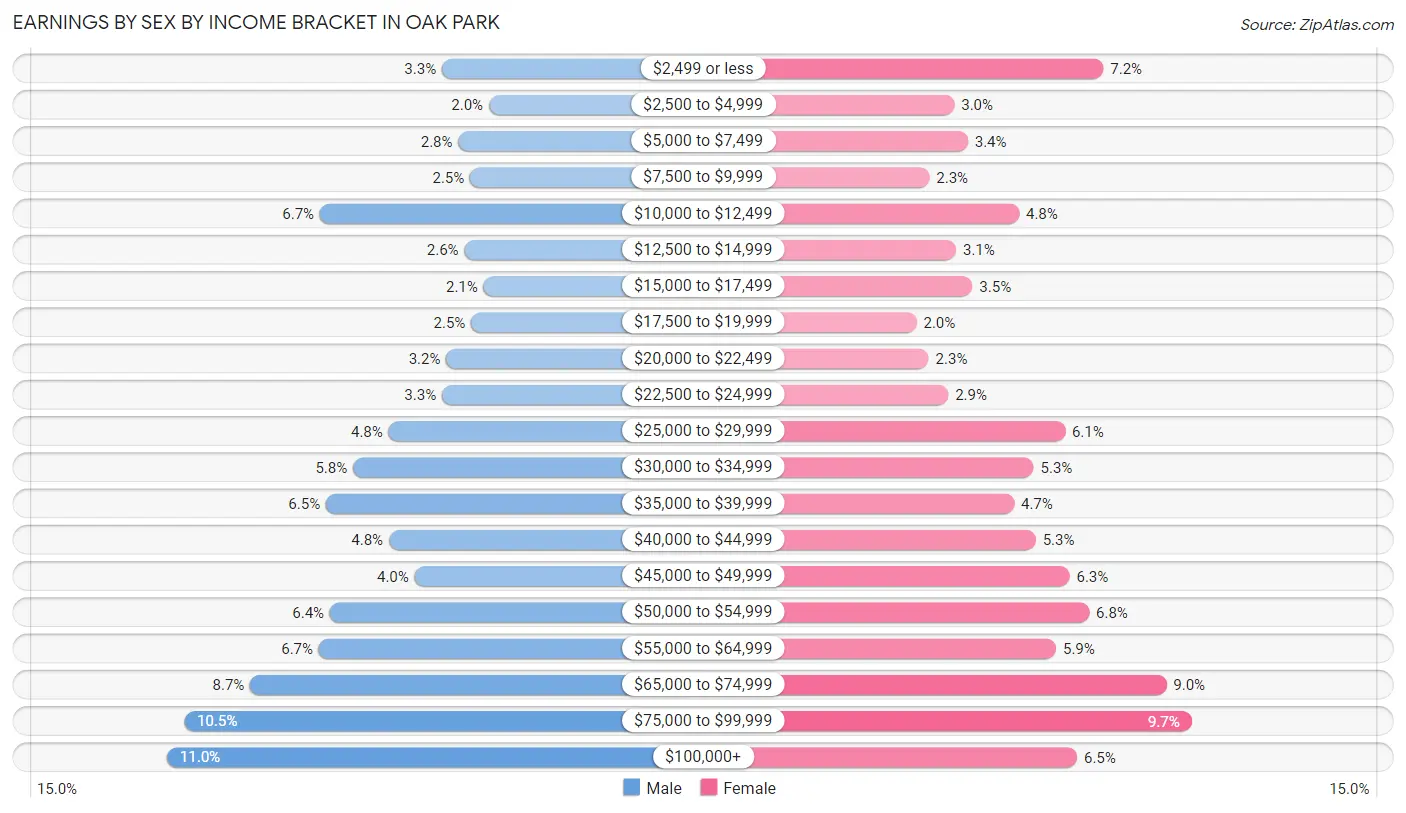
| Income | Male | Female |
| $2,499 or less | 268 (3.3%) | 630 (7.2%) |
| $2,500 to $4,999 | 160 (1.9%) | 264 (3.0%) |
| $5,000 to $7,499 | 230 (2.8%) | 297 (3.4%) |
| $7,500 to $9,999 | 203 (2.5%) | 203 (2.3%) |
| $10,000 to $12,499 | 549 (6.7%) | 423 (4.8%) |
| $12,500 to $14,999 | 216 (2.6%) | 268 (3.1%) |
| $15,000 to $17,499 | 172 (2.1%) | 308 (3.5%) |
| $17,500 to $19,999 | 201 (2.5%) | 171 (2.0%) |
| $20,000 to $22,499 | 258 (3.2%) | 201 (2.3%) |
| $22,500 to $24,999 | 268 (3.3%) | 249 (2.9%) |
| $25,000 to $29,999 | 391 (4.8%) | 536 (6.1%) |
| $30,000 to $34,999 | 473 (5.8%) | 459 (5.2%) |
| $35,000 to $39,999 | 535 (6.5%) | 411 (4.7%) |
| $40,000 to $44,999 | 390 (4.8%) | 464 (5.3%) |
| $45,000 to $49,999 | 331 (4.0%) | 547 (6.3%) |
| $50,000 to $54,999 | 526 (6.4%) | 595 (6.8%) |
| $55,000 to $64,999 | 552 (6.7%) | 514 (5.9%) |
| $65,000 to $74,999 | 710 (8.7%) | 785 (9.0%) |
| $75,000 to $99,999 | 862 (10.5%) | 847 (9.7%) |
| $100,000+ | 902 (11.0%) | 565 (6.5%) |
| Total | 8,197 (100.0%) | 8,737 (100.0%) |
Earnings by Sex by Educational Attainment in Oak Park
Average earnings in Oak Park are $49,643 for men and $42,979 for women, a difference of 13.4%. Men with an educational attainment of graduate degree enjoy the highest average annual earnings of $68,808, while those with college or associate's degree education earn the least with $44,884. Women with an educational attainment of bachelor's degree earn the most with the average annual earnings of $59,044, while those with high school diploma education have the smallest earnings of $18,600.
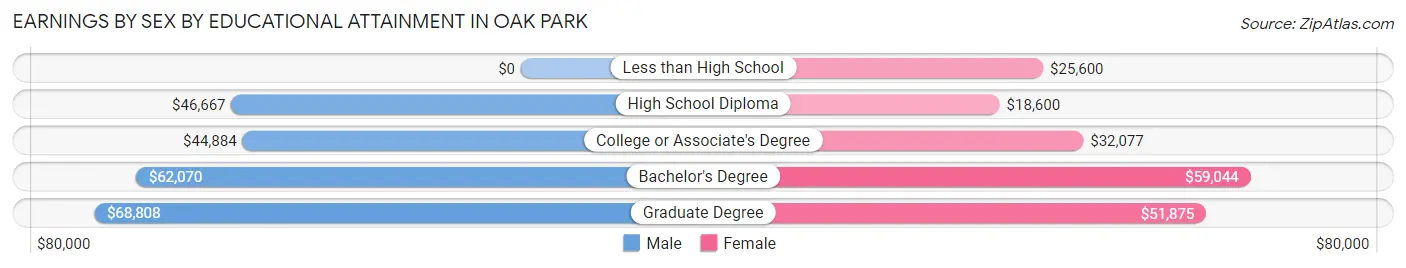
| Educational Attainment | Male Income | Female Income |
| Less than High School | - | - |
| High School Diploma | $46,667 | $18,600 |
| College or Associate's Degree | $44,884 | $32,077 |
| Bachelor's Degree | $62,070 | $59,044 |
| Graduate Degree | $68,808 | $51,875 |
| Total | $49,643 | $42,979 |
Family Income in Oak Park
Family Income Brackets in Oak Park
According to the Oak Park family income data, there are 1,470 families falling into the $50,000 to $74,999 income range, which is the most common income bracket and makes up 20.8% of all families. Conversely, the less than $10,000 income bracket is the least frequent group with only 177 families (2.5%) belonging to this category.

| Income Bracket | # Families | % Families |
| Less than $10,000 | 177 | 2.5% |
| $10,000 to $14,999 | 276 | 3.9% |
| $15,000 to $24,999 | 459 | 6.5% |
| $25,000 to $34,999 | 502 | 7.1% |
| $35,000 to $49,999 | 735 | 10.4% |
| $50,000 to $74,999 | 1,470 | 20.8% |
| $75,000 to $99,999 | 1,110 | 15.7% |
| $100,000 to $149,999 | 1,399 | 19.8% |
| $150,000 to $199,999 | 452 | 6.4% |
| $200,000+ | 481 | 6.8% |
Family Income by Famaliy Size in Oak Park
4-person families (1,021 | 14.4%) account for the highest median family income in Oak Park with $95,722 per family, while 3-person families (1,694 | 24.0%) have the highest median income of $31,243 per family member.
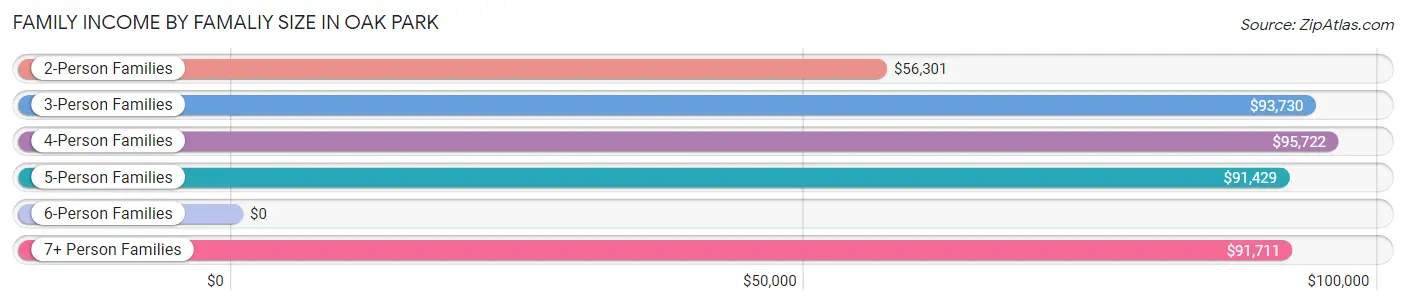
| Income Bracket | # Families | Median Income |
| 2-Person Families | 3,681 (52.1%) | $56,301 |
| 3-Person Families | 1,694 (24.0%) | $93,730 |
| 4-Person Families | 1,021 (14.4%) | $95,722 |
| 5-Person Families | 442 (6.2%) | $91,429 |
| 6-Person Families | 113 (1.6%) | $0 |
| 7+ Person Families | 116 (1.6%) | $91,711 |
| Total | 7,067 (100.0%) | $72,666 |
Family Income by Number of Earners in Oak Park
The median family income in Oak Park is $72,666, with families comprising 3+ earners (806) having the highest median family income of $118,036, while families with no earners (1,058) have the lowest median family income of $33,724, accounting for 11.4% and 15.0% of families, respectively.
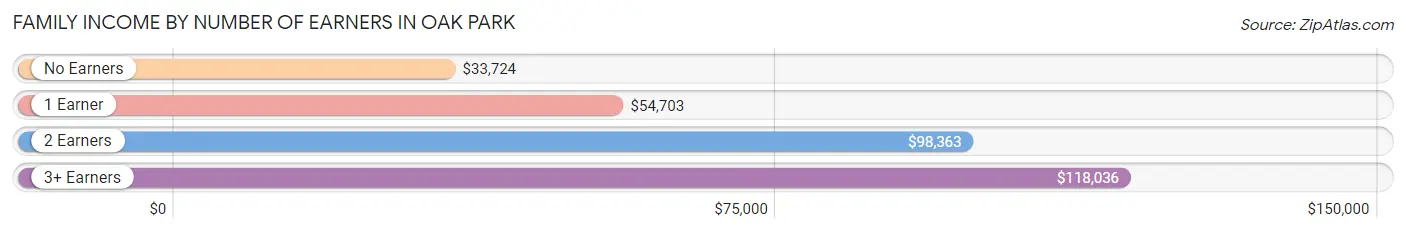
| Number of Earners | # Families | Median Income |
| No Earners | 1,058 (15.0%) | $33,724 |
| 1 Earner | 2,092 (29.6%) | $54,703 |
| 2 Earners | 3,111 (44.0%) | $98,363 |
| 3+ Earners | 806 (11.4%) | $118,036 |
| Total | 7,067 (100.0%) | $72,666 |
Household Income in Oak Park
Household Income Brackets in Oak Park
With 2,325 households falling in the category, the $50,000 to $74,999 income range is the most frequent in Oak Park, accounting for 18.7% of all households. In contrast, only 472 households (3.8%) fall into the less than $10,000 income bracket, making it the least populous group.
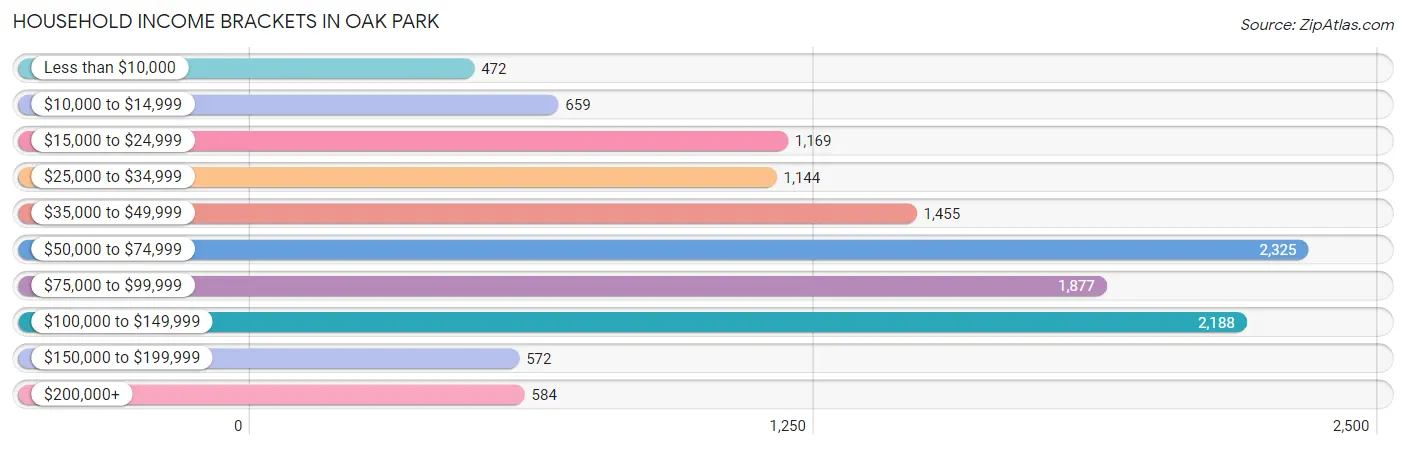
| Income Bracket | # Households | % Households |
| Less than $10,000 | 472 | 3.8% |
| $10,000 to $14,999 | 659 | 5.3% |
| $15,000 to $24,999 | 1,169 | 9.4% |
| $25,000 to $34,999 | 1,144 | 9.2% |
| $35,000 to $49,999 | 1,455 | 11.7% |
| $50,000 to $74,999 | 2,325 | 18.7% |
| $75,000 to $99,999 | 1,877 | 15.1% |
| $100,000 to $149,999 | 2,188 | 17.6% |
| $150,000 to $199,999 | 572 | 4.6% |
| $200,000+ | 584 | 4.7% |
Household Income by Householder Age in Oak Park
The median household income in Oak Park is $61,991, with the highest median household income of $75,125 found in the 45 to 64 years age bracket for the primary householder. A total of 4,358 households (35.0%) fall into this category. Meanwhile, the 65+ years age bracket for the primary householder has the lowest median household income of $43,340, with 3,282 households (26.4%) in this group.
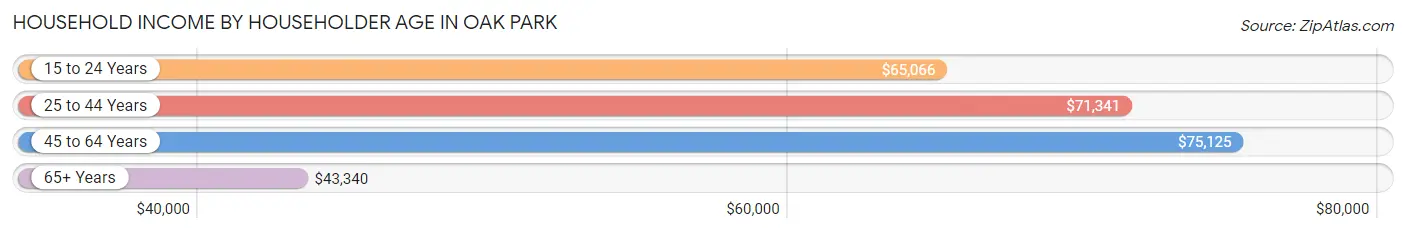
| Income Bracket | # Households | Median Income |
| 15 to 24 Years | 318 (2.6%) | $65,066 |
| 25 to 44 Years | 4,474 (36.0%) | $71,341 |
| 45 to 64 Years | 4,358 (35.0%) | $75,125 |
| 65+ Years | 3,282 (26.4%) | $43,340 |
| Total | 12,432 (100.0%) | $61,991 |
Poverty in Oak Park
Income Below Poverty by Sex and Age in Oak Park
With 12.0% poverty level for males and 16.7% for females among the residents of Oak Park, 12 to 14 year old males and 12 to 14 year old females are the most vulnerable to poverty, with 161 males (29.8%) and 229 females (46.4%) in their respective age groups living below the poverty level.
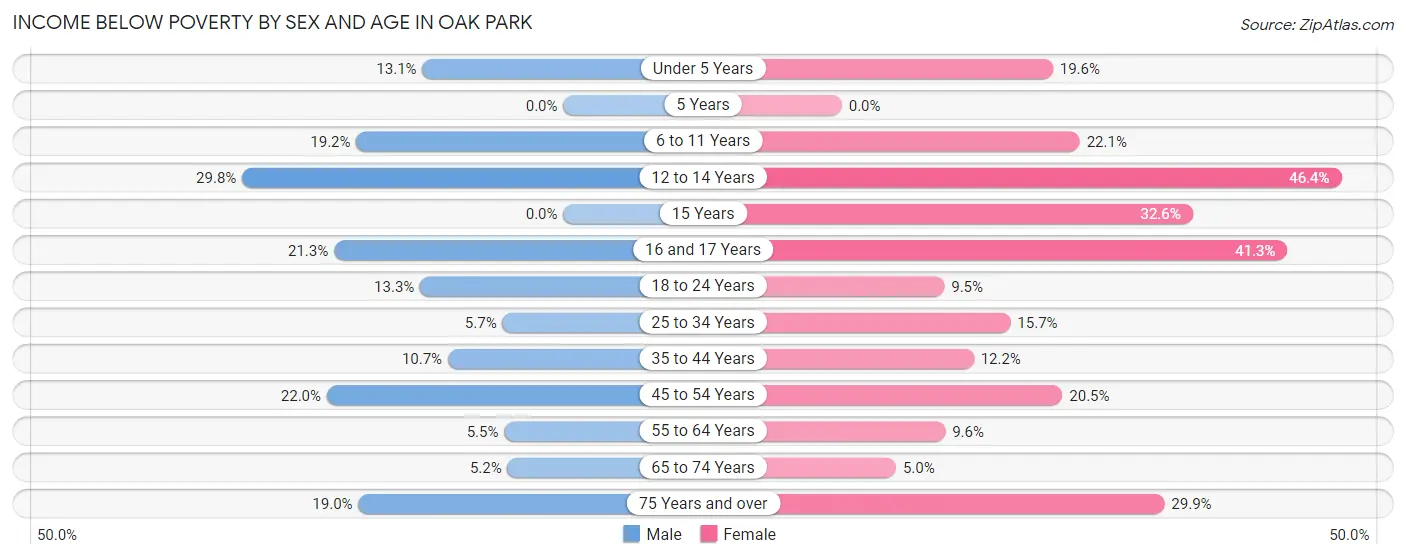
| Age Bracket | Male | Female |
| Under 5 Years | 84 (13.1%) | 113 (19.6%) |
| 5 Years | 0 (0.0%) | 0 (0.0%) |
| 6 to 11 Years | 185 (19.2%) | 223 (22.1%) |
| 12 to 14 Years | 161 (29.8%) | 229 (46.4%) |
| 15 Years | 0 (0.0%) | 69 (32.6%) |
| 16 and 17 Years | 90 (21.3%) | 148 (41.3%) |
| 18 to 24 Years | 173 (13.3%) | 122 (9.5%) |
| 25 to 34 Years | 140 (5.7%) | 435 (15.7%) |
| 35 to 44 Years | 206 (10.7%) | 231 (12.2%) |
| 45 to 54 Years | 322 (22.0%) | 451 (20.5%) |
| 55 to 64 Years | 93 (5.5%) | 180 (9.6%) |
| 65 to 74 Years | 68 (5.2%) | 96 (5.0%) |
| 75 Years and over | 120 (19.0%) | 338 (29.9%) |
| Total | 1,642 (12.0%) | 2,635 (16.7%) |
Income Above Poverty by Sex and Age in Oak Park
According to the poverty statistics in Oak Park, males aged 5 years and females aged 5 years are the age groups that are most secure financially, with 100.0% of males and 100.0% of females in these age groups living above the poverty line.
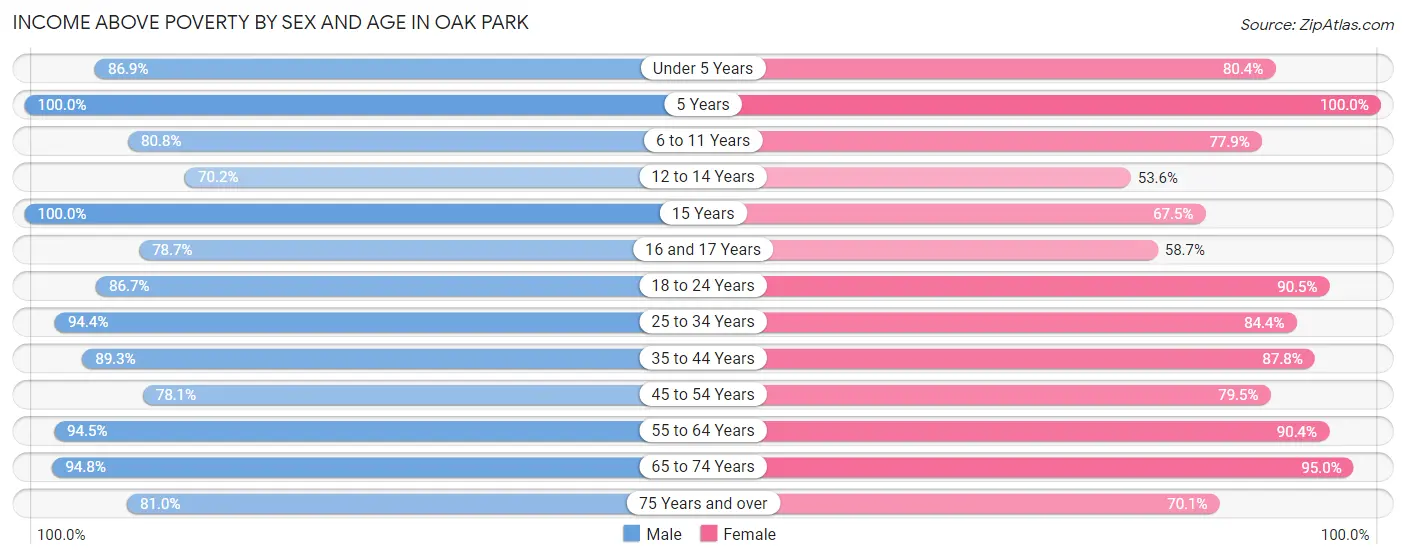
| Age Bracket | Male | Female |
| Under 5 Years | 558 (86.9%) | 464 (80.4%) |
| 5 Years | 206 (100.0%) | 56 (100.0%) |
| 6 to 11 Years | 778 (80.8%) | 787 (77.9%) |
| 12 to 14 Years | 379 (70.2%) | 265 (53.6%) |
| 15 Years | 59 (100.0%) | 143 (67.4%) |
| 16 and 17 Years | 333 (78.7%) | 210 (58.7%) |
| 18 to 24 Years | 1,129 (86.7%) | 1,161 (90.5%) |
| 25 to 34 Years | 2,340 (94.4%) | 2,344 (84.4%) |
| 35 to 44 Years | 1,717 (89.3%) | 1,657 (87.8%) |
| 45 to 54 Years | 1,145 (78.0%) | 1,752 (79.5%) |
| 55 to 64 Years | 1,605 (94.5%) | 1,695 (90.4%) |
| 65 to 74 Years | 1,245 (94.8%) | 1,812 (95.0%) |
| 75 Years and over | 511 (81.0%) | 791 (70.1%) |
| Total | 12,005 (88.0%) | 13,137 (83.3%) |
Income Below Poverty Among Married-Couple Families in Oak Park
The poverty statistics for married-couple families in Oak Park show that 6.9% or 280 of the total 4,061 families live below the poverty line. Families with 3 or 4 children have the highest poverty rate of 26.5%, comprising of 83 families. On the other hand, families with 5 or more children have the lowest poverty rate of 0.0%, which includes 0 families.
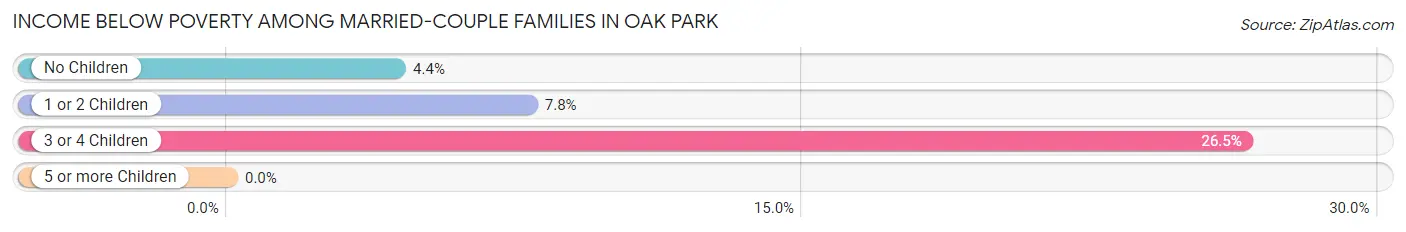
| Children | Above Poverty | Below Poverty |
| No Children | 2,529 (95.6%) | 116 (4.4%) |
| 1 or 2 Children | 953 (92.2%) | 81 (7.8%) |
| 3 or 4 Children | 230 (73.5%) | 83 (26.5%) |
| 5 or more Children | 69 (100.0%) | 0 (0.0%) |
| Total | 3,781 (93.1%) | 280 (6.9%) |
Income Below Poverty Among Single-Parent Households in Oak Park
According to the poverty data in Oak Park, 24.4% or 147 single-father households and 18.1% or 435 single-mother households are living below the poverty line. Among single-father households, those with 3 or 4 children have the highest poverty rate, with 45 households (100.0%) experiencing poverty. Likewise, among single-mother households, those with 3 or 4 children have the highest poverty rate, with 54 households (100.0%) falling below the poverty line.
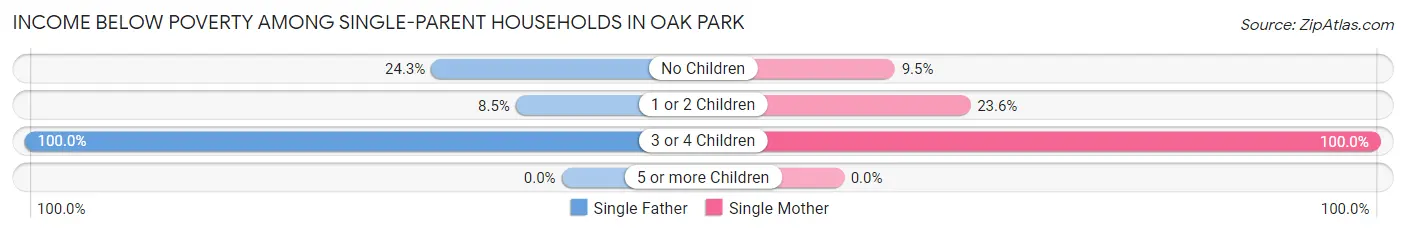
| Children | Single Father | Single Mother |
| No Children | 84 (24.3%) | 117 (9.5%) |
| 1 or 2 Children | 18 (8.5%) | 264 (23.6%) |
| 3 or 4 Children | 45 (100.0%) | 54 (100.0%) |
| 5 or more Children | 0 (0.0%) | 0 (0.0%) |
| Total | 147 (24.4%) | 435 (18.1%) |
Income Below Poverty Among Married-Couple vs Single-Parent Households in Oak Park
The poverty data for Oak Park shows that 280 of the married-couple family households (6.9%) and 582 of the single-parent households (19.4%) are living below the poverty level. Within the married-couple family households, those with 3 or 4 children have the highest poverty rate, with 83 households (26.5%) falling below the poverty line. Among the single-parent households, those with 3 or 4 children have the highest poverty rate, with 99 household (100.0%) living below poverty.
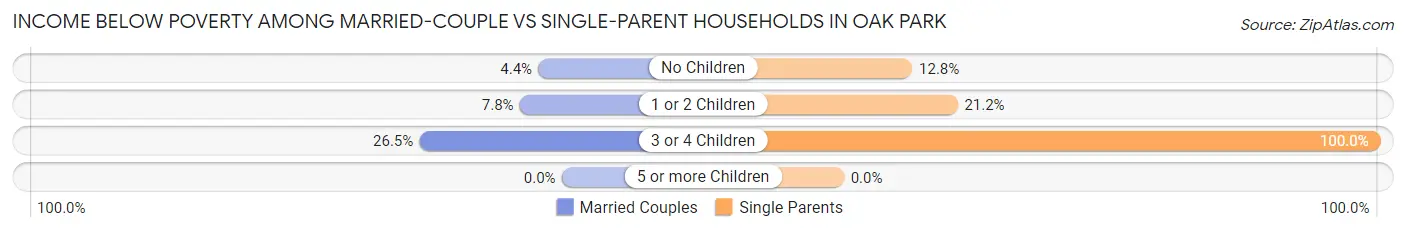
| Children | Married-Couple Families | Single-Parent Households |
| No Children | 116 (4.4%) | 201 (12.8%) |
| 1 or 2 Children | 81 (7.8%) | 282 (21.2%) |
| 3 or 4 Children | 83 (26.5%) | 99 (100.0%) |
| 5 or more Children | 0 (0.0%) | 0 (0.0%) |
| Total | 280 (6.9%) | 582 (19.4%) |
Race in Oak Park
The most populous races in Oak Park are Black / African American (15,715 | 53.3%), White / Caucasian (10,677 | 36.2%), and Two or more Races (1,684 | 5.7%).
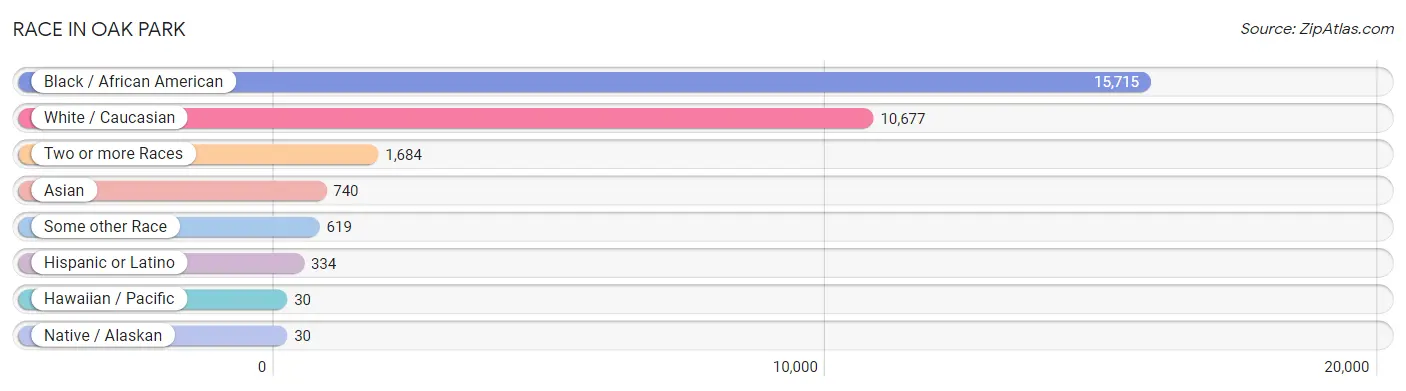
| Race | # Population | % Population |
| Asian | 740 | 2.5% |
| Black / African American | 15,715 | 53.3% |
| Hawaiian / Pacific | 30 | 0.1% |
| Hispanic or Latino | 334 | 1.1% |
| Native / Alaskan | 30 | 0.1% |
| White / Caucasian | 10,677 | 36.2% |
| Two or more Races | 1,684 | 5.7% |
| Some other Race | 619 | 2.1% |
| Total | 29,495 | 100.0% |
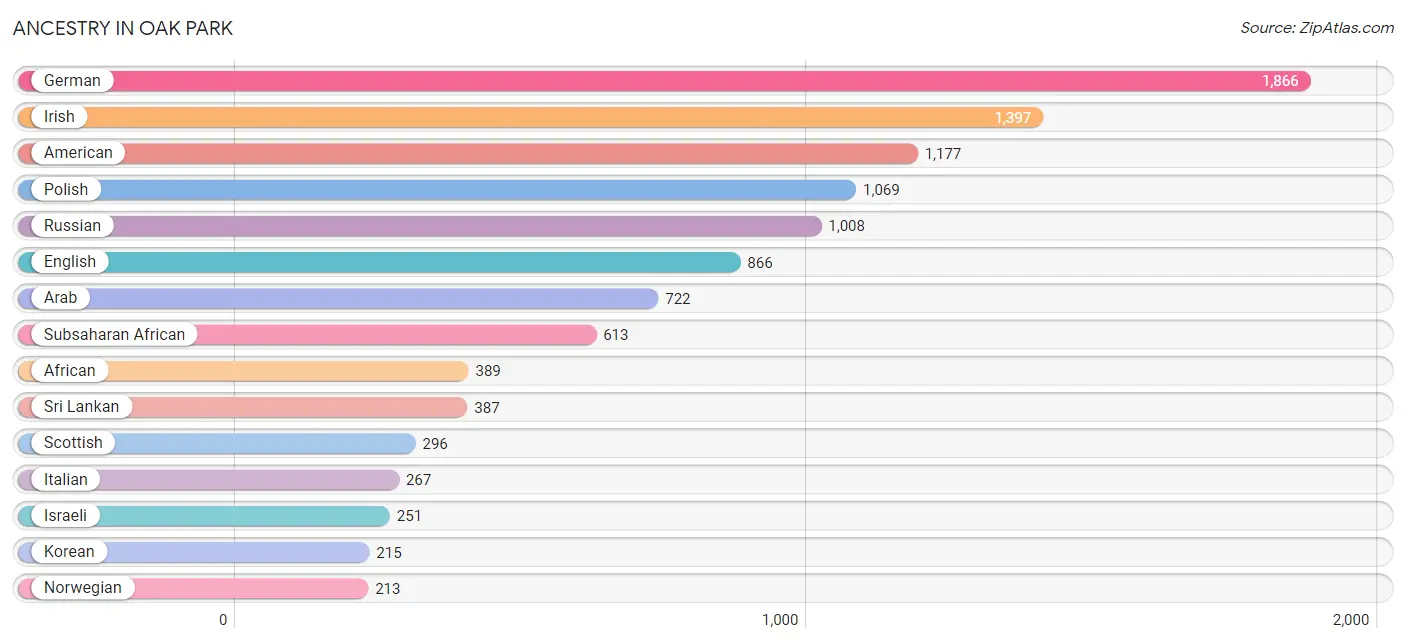
Ancestry in Oak Park
The most populous ancestries reported in Oak Park are German (1,866 | 6.3%), Irish (1,397 | 4.7%), American (1,177 | 4.0%), Polish (1,069 | 3.6%), and Russian (1,008 | 3.4%), together accounting for 22.1% of all Oak Park residents.
| Ancestry | # Population | % Population |
| African | 389 | 1.3% |
| Alaskan Athabascan | 26 | 0.1% |
| American | 1,177 | 4.0% |
| Arab | 722 | 2.5% |
| Armenian | 79 | 0.3% |
| Assyrian / Chaldean / Syriac | 208 | 0.7% |
| Austrian | 3 | 0.0% |
| Bangladeshi | 31 | 0.1% |
| Belgian | 100 | 0.3% |
| Bhutanese | 127 | 0.4% |
| British | 155 | 0.5% |
| British West Indian | 49 | 0.2% |
| Bulgarian | 37 | 0.1% |
| Burmese | 79 | 0.3% |
| Cambodian | 19 | 0.1% |
| Canadian | 31 | 0.1% |
| Central American | 23 | 0.1% |
| Central American Indian | 5 | 0.0% |
| Cherokee | 107 | 0.4% |
| Chippewa | 32 | 0.1% |
| Croatian | 11 | 0.0% |
| Cuban | 4 | 0.0% |
| Czech | 19 | 0.1% |
| Danish | 17 | 0.1% |
| Dominican | 29 | 0.1% |
| Dutch | 158 | 0.5% |
| Eastern European | 166 | 0.6% |
| Ecuadorian | 17 | 0.1% |
| Egyptian | 8 | 0.0% |
| English | 866 | 2.9% |
| European | 171 | 0.6% |
| Finnish | 85 | 0.3% |
| French | 209 | 0.7% |
| French American Indian | 9 | 0.0% |
| French Canadian | 62 | 0.2% |
| German | 1,866 | 6.3% |
| Greek | 124 | 0.4% |
| Guamanian / Chamorro | 22 | 0.1% |
| Hungarian | 186 | 0.6% |
| Icelander | 16 | 0.1% |
| Indian (Asian) | 80 | 0.3% |
| Iranian | 10 | 0.0% |
| Iraqi | 185 | 0.6% |
| Irish | 1,397 | 4.7% |
| Israeli | 251 | 0.9% |
| Italian | 267 | 0.9% |
| Jamaican | 198 | 0.7% |
| Korean | 215 | 0.7% |
| Lebanese | 51 | 0.2% |
| Lithuanian | 63 | 0.2% |
| Maltese | 4 | 0.0% |
| Mexican | 184 | 0.6% |
| Moroccan | 41 | 0.1% |
| Native Hawaiian | 52 | 0.2% |
| Nicaraguan | 23 | 0.1% |
| Nigerian | 90 | 0.3% |
| Norwegian | 213 | 0.7% |
| Ottawa | 4 | 0.0% |
| Pakistani | 9 | 0.0% |
| Polish | 1,069 | 3.6% |
| Portuguese | 68 | 0.2% |
| Potawatomi | 10 | 0.0% |
| Puerto Rican | 52 | 0.2% |
| Romanian | 104 | 0.4% |
| Russian | 1,008 | 3.4% |
| Scandinavian | 17 | 0.1% |
| Scotch-Irish | 57 | 0.2% |
| Scottish | 296 | 1.0% |
| Seminole | 9 | 0.0% |
| Senegalese | 12 | 0.0% |
| Sioux | 50 | 0.2% |
| Slovak | 18 | 0.1% |
| South American | 17 | 0.1% |
| Spaniard | 5 | 0.0% |
| Spanish | 4 | 0.0% |
| Sri Lankan | 387 | 1.3% |
| Subsaharan African | 613 | 2.1% |
| Swedish | 105 | 0.4% |
| Syrian | 164 | 0.6% |
| Thai | 76 | 0.3% |
| Turkish | 15 | 0.1% |
| Ukrainian | 52 | 0.2% |
| Welsh | 32 | 0.1% |
| Yugoslavian | 16 | 0.1% | View All 84 Rows |
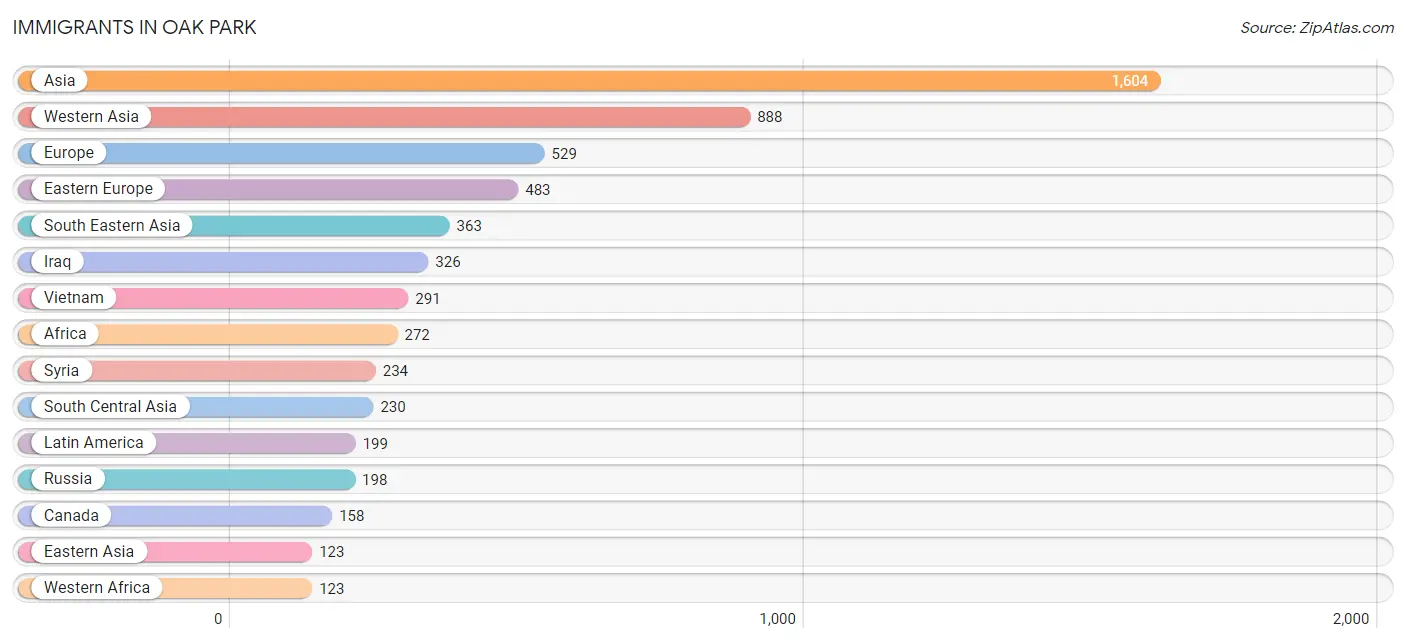
Immigrants in Oak Park
The most numerous immigrant groups reported in Oak Park came from Asia (1,604 | 5.4%), Western Asia (888 | 3.0%), Europe (529 | 1.8%), Eastern Europe (483 | 1.6%), and South Eastern Asia (363 | 1.2%), together accounting for 13.1% of all Oak Park residents.
| Immigration Origin | # Population | % Population |
| Africa | 272 | 0.9% |
| Asia | 1,604 | 5.4% |
| Australia | 11 | 0.0% |
| Bangladesh | 22 | 0.1% |
| Bulgaria | 18 | 0.1% |
| Canada | 158 | 0.5% |
| Caribbean | 85 | 0.3% |
| Central America | 92 | 0.3% |
| Chile | 5 | 0.0% |
| China | 35 | 0.1% |
| Croatia | 16 | 0.1% |
| Dominica | 23 | 0.1% |
| Dominican Republic | 23 | 0.1% |
| Eastern Africa | 73 | 0.3% |
| Eastern Asia | 123 | 0.4% |
| Eastern Europe | 483 | 1.6% |
| Ecuador | 17 | 0.1% |
| Egypt | 8 | 0.0% |
| England | 28 | 0.1% |
| Ethiopia | 73 | 0.3% |
| Europe | 529 | 1.8% |
| Hong Kong | 18 | 0.1% |
| Hungary | 28 | 0.1% |
| India | 88 | 0.3% |
| Iraq | 326 | 1.1% |
| Israel | 93 | 0.3% |
| Jamaica | 39 | 0.1% |
| Japan | 57 | 0.2% |
| Kazakhstan | 95 | 0.3% |
| Korea | 31 | 0.1% |
| Kuwait | 8 | 0.0% |
| Latin America | 199 | 0.7% |
| Lebanon | 41 | 0.1% |
| Malaysia | 12 | 0.0% |
| Mexico | 33 | 0.1% |
| Moldova | 92 | 0.3% |
| Morocco | 20 | 0.1% |
| Netherlands | 10 | 0.0% |
| Nicaragua | 59 | 0.2% |
| Nigeria | 93 | 0.3% |
| Northern Africa | 28 | 0.1% |
| Northern Europe | 36 | 0.1% |
| Oceania | 11 | 0.0% |
| Philippines | 60 | 0.2% |
| Poland | 24 | 0.1% |
| Romania | 31 | 0.1% |
| Russia | 198 | 0.7% |
| Senegal | 12 | 0.0% |
| South America | 22 | 0.1% |
| South Central Asia | 230 | 0.8% |
| South Eastern Asia | 363 | 1.2% |
| Syria | 234 | 0.8% |
| Taiwan | 17 | 0.1% |
| Turkey | 12 | 0.0% |
| Ukraine | 76 | 0.3% |
| Vietnam | 291 | 1.0% |
| Western Africa | 123 | 0.4% |
| Western Asia | 888 | 3.0% |
| Western Europe | 10 | 0.0% | View All 59 Rows |
Sex and Age in Oak Park
Sex and Age in Oak Park
The most populous age groups in Oak Park are 25 to 29 Years (1,358 | 9.9%) for men and 30 to 34 Years (1,536 | 9.7%) for women.
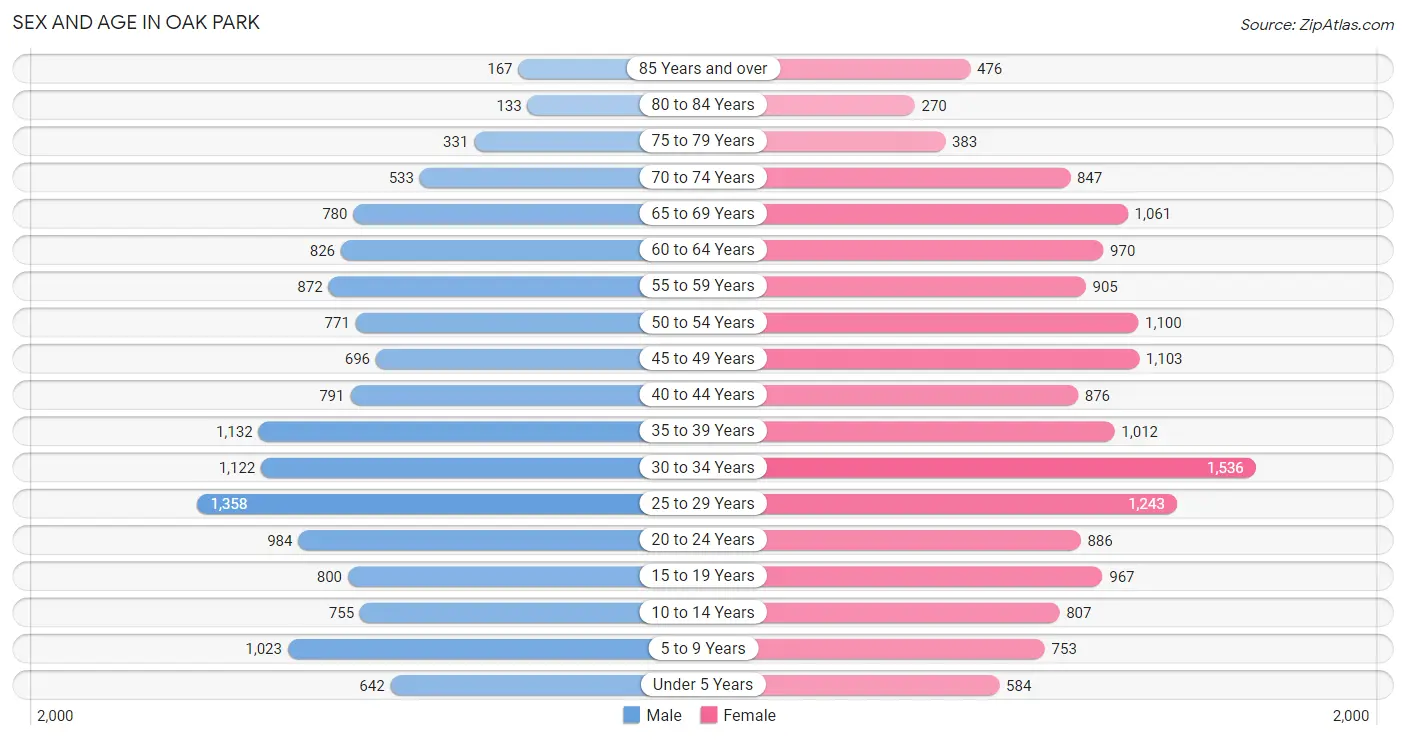
| Age Bracket | Male | Female |
| Under 5 Years | 642 (4.7%) | 584 (3.7%) |
| 5 to 9 Years | 1,023 (7.5%) | 753 (4.8%) |
| 10 to 14 Years | 755 (5.5%) | 807 (5.1%) |
| 15 to 19 Years | 800 (5.8%) | 967 (6.1%) |
| 20 to 24 Years | 984 (7.2%) | 886 (5.6%) |
| 25 to 29 Years | 1,358 (9.9%) | 1,243 (7.9%) |
| 30 to 34 Years | 1,122 (8.2%) | 1,536 (9.7%) |
| 35 to 39 Years | 1,132 (8.3%) | 1,012 (6.4%) |
| 40 to 44 Years | 791 (5.8%) | 876 (5.6%) |
| 45 to 49 Years | 696 (5.1%) | 1,103 (7.0%) |
| 50 to 54 Years | 771 (5.6%) | 1,100 (7.0%) |
| 55 to 59 Years | 872 (6.4%) | 905 (5.7%) |
| 60 to 64 Years | 826 (6.0%) | 970 (6.1%) |
| 65 to 69 Years | 780 (5.7%) | 1,061 (6.7%) |
| 70 to 74 Years | 533 (3.9%) | 847 (5.4%) |
| 75 to 79 Years | 331 (2.4%) | 383 (2.4%) |
| 80 to 84 Years | 133 (1.0%) | 270 (1.7%) |
| 85 Years and over | 167 (1.2%) | 476 (3.0%) |
| Total | 13,716 (100.0%) | 15,779 (100.0%) |
Families and Households in Oak Park
Median Family Size in Oak Park
The median family size in Oak Park is 3.15 persons per family, with single female/mother families (2,404 | 34.0%) accounting for the largest median family size of 3.29 persons per family. On the other hand, single male/father families (602 | 8.5%) represent the smallest median family size with 2.80 persons per family.
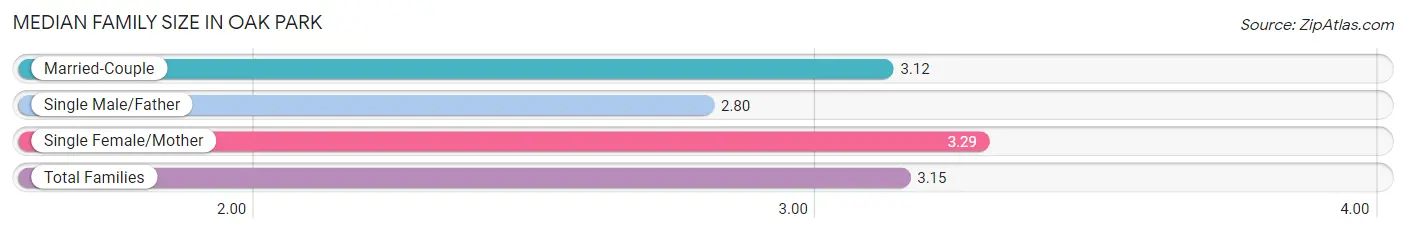
| Family Type | # Families | Family Size |
| Married-Couple | 4,061 (57.5%) | 3.12 |
| Single Male/Father | 602 (8.5%) | 2.80 |
| Single Female/Mother | 2,404 (34.0%) | 3.29 |
| Total Families | 7,067 (100.0%) | 3.15 |
Median Household Size in Oak Park
The median household size in Oak Park is 2.37 persons per household, with single female/mother households (2,404 | 19.3%) accounting for the largest median household size of 3.46 persons per household. non-family households (5,365 | 43.1%) represent the smallest median household size with 1.25 persons per household.
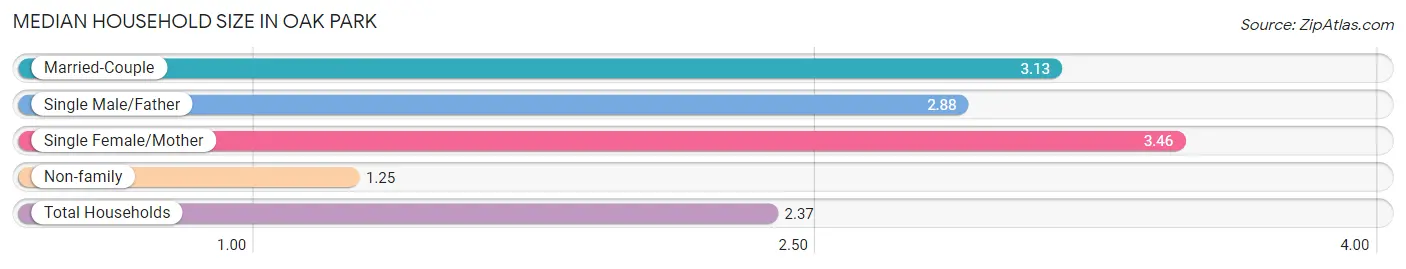
| Household Type | # Households | Household Size |
| Married-Couple | 4,061 (32.7%) | 3.13 |
| Single Male/Father | 602 (4.8%) | 2.88 |
| Single Female/Mother | 2,404 (19.3%) | 3.46 |
| Non-family | 5,365 (43.1%) | 1.25 |
| Total Households | 12,432 (100.0%) | 2.37 |
Household Size by Marriage Status in Oak Park
Out of a total of 12,432 households in Oak Park, 7,067 (56.9%) are family households, while 5,365 (43.1%) are nonfamily households. The most numerous type of family households are 2-person households, comprising 3,503, and the most common type of nonfamily households are 1-person households, comprising 4,184.
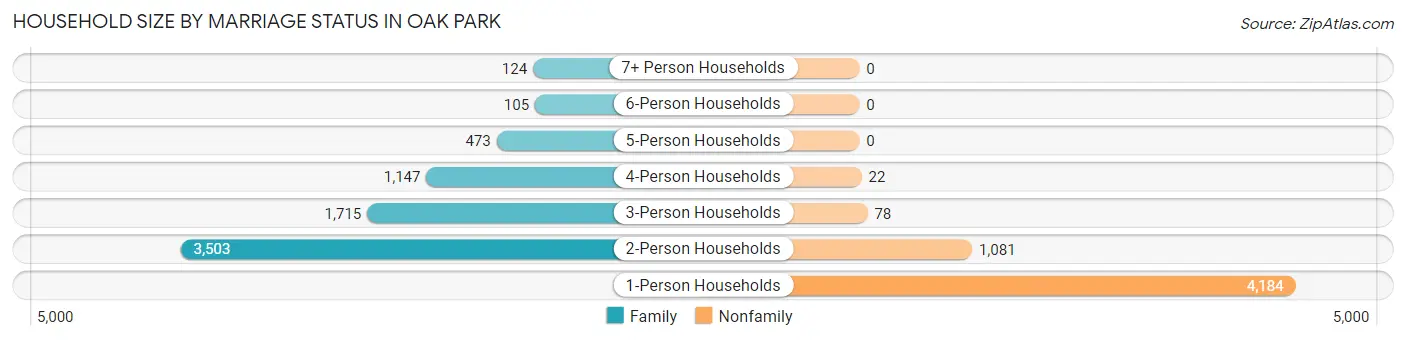
| Household Size | Family Households | Nonfamily Households |
| 1-Person Households | - | 4,184 (33.7%) |
| 2-Person Households | 3,503 (28.2%) | 1,081 (8.7%) |
| 3-Person Households | 1,715 (13.8%) | 78 (0.6%) |
| 4-Person Households | 1,147 (9.2%) | 22 (0.2%) |
| 5-Person Households | 473 (3.8%) | 0 (0.0%) |
| 6-Person Households | 105 (0.8%) | 0 (0.0%) |
| 7+ Person Households | 124 (1.0%) | 0 (0.0%) |
| Total | 7,067 (56.9%) | 5,365 (43.1%) |
Female Fertility in Oak Park
Fertility by Age in Oak Park
Average fertility rate in Oak Park is 29.0 births per 1,000 women. Women in the age bracket of 20 to 34 years have the highest fertility rate with 39.0 births per 1,000 women. Women in the age bracket of 20 to 34 years acount for 64.3% of all women with births.
| Age Bracket | Women with Births | Births / 1,000 Women |
| 15 to 19 years | 0 (0.0%) | 0.0 |
| 20 to 34 years | 144 (64.3%) | 39.0 |
| 35 to 50 years | 80 (35.7%) | 25.0 |
| Total | 224 (100.0%) | 29.0 |
Fertility by Age by Marriage Status in Oak Park
58.9% of women with births (224) in Oak Park are married. The highest percentage of unmarried women with births falls into 35 to 50 years age bracket with 42.5% of them unmarried at the time of birth, while the lowest percentage of unmarried women with births belong to 20 to 34 years age bracket with 40.3% of them unmarried.
| Age Bracket | Married | Unmarried |
| 15 to 19 years | 0 (0.0%) | 0 (0.0%) |
| 20 to 34 years | 86 (59.7%) | 58 (40.3%) |
| 35 to 50 years | 46 (57.5%) | 34 (42.5%) |
| Total | 132 (58.9%) | 92 (41.1%) |
Fertility by Education in Oak Park
| Educational Attainment | Women with Births | Births / 1,000 Women |
| Less than High School | 0 (0.0%) | 0.0 |
| High School Diploma | 58 (25.9%) | 53.0 |
| College or Associate's Degree | 34 (15.2%) | 11.0 |
| Bachelor's Degree | 108 (48.2%) | 54.0 |
| Graduate Degree | 24 (10.7%) | 27.0 |
| Total | 224 (100.0%) | 29.0 |
Fertility by Education by Marriage Status in Oak Park
41.1% of women with births in Oak Park are unmarried. Women with the educational attainment of bachelor's degree are most likely to be married with 100.0% of them married at childbirth, while women with the educational attainment of high school diploma are least likely to be married with 100.0% of them unmarried at childbirth.
| Educational Attainment | Married | Unmarried |
| Less than High School | 0 (0.0%) | 0 (0.0%) |
| High School Diploma | 0 (0.0%) | 58 (100.0%) |
| College or Associate's Degree | 0 (0.0%) | 34 (100.0%) |
| Bachelor's Degree | 108 (100.0%) | 0 (0.0%) |
| Graduate Degree | 24 (100.0%) | 0 (0.0%) |
| Total | 132 (58.9%) | 92 (41.1%) |
Employment Characteristics in Oak Park
Employment by Class of Employer in Oak Park
Among the 14,591 employed individuals in Oak Park, private company employees (10,255 | 70.3%), not-for-profit organizations (1,574 | 10.8%), and self-employed (not incorporated) (950 | 6.5%) make up the most common classes of employment.
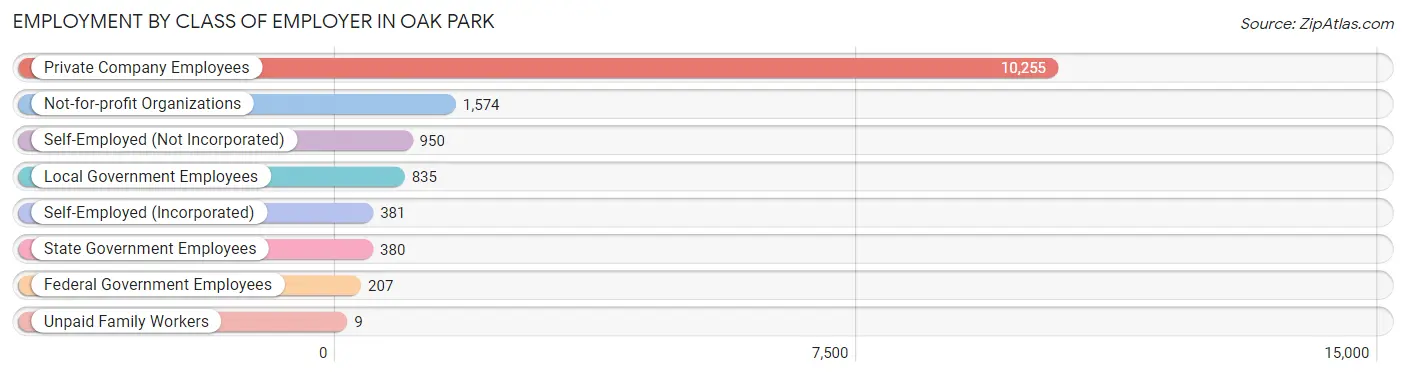
| Employer Class | # Employees | % Employees |
| Private Company Employees | 10,255 | 70.3% |
| Self-Employed (Incorporated) | 381 | 2.6% |
| Self-Employed (Not Incorporated) | 950 | 6.5% |
| Not-for-profit Organizations | 1,574 | 10.8% |
| Local Government Employees | 835 | 5.7% |
| State Government Employees | 380 | 2.6% |
| Federal Government Employees | 207 | 1.4% |
| Unpaid Family Workers | 9 | 0.1% |
| Total | 14,591 | 100.0% |
Employment Status by Age in Oak Park
According to the labor force statistics for Oak Park, out of the total population over 16 years of age (24,660), 67.3% or 16,596 individuals are in the labor force, with 9.9% or 1,643 of them unemployed. The age group with the highest labor force participation rate is 30 to 34 years, with 95.9% or 2,549 individuals in the labor force. Within the labor force, the 65 to 74 years age range has the highest percentage of unemployed individuals, with 40.5% or 368 of them being unemployed.
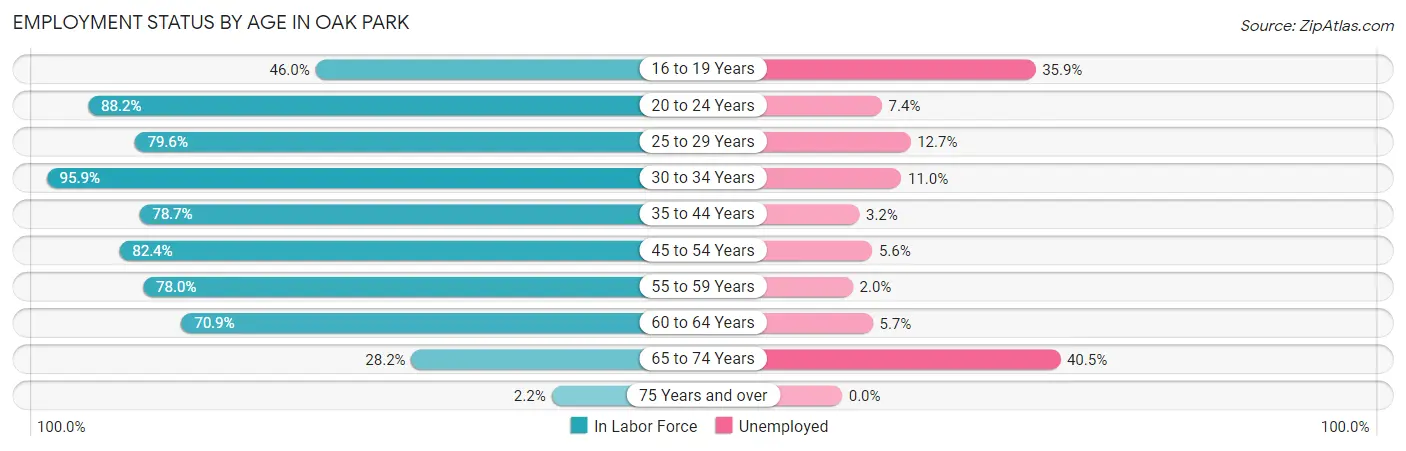
| Age Bracket | In Labor Force | Unemployed |
| 16 to 19 Years | 688 (46.0%) | 247 (35.9%) |
| 20 to 24 Years | 1,649 (88.2%) | 122 (7.4%) |
| 25 to 29 Years | 2,070 (79.6%) | 263 (12.7%) |
| 30 to 34 Years | 2,549 (95.9%) | 280 (11.0%) |
| 35 to 44 Years | 2,999 (78.7%) | 96 (3.2%) |
| 45 to 54 Years | 3,024 (82.4%) | 169 (5.6%) |
| 55 to 59 Years | 1,386 (78.0%) | 28 (2.0%) |
| 60 to 64 Years | 1,273 (70.9%) | 73 (5.7%) |
| 65 to 74 Years | 908 (28.2%) | 368 (40.5%) |
| 75 Years and over | 39 (2.2%) | 0 (0.0%) |
| Total | 16,596 (67.3%) | 1,643 (9.9%) |
Employment Status by Educational Attainment in Oak Park
According to labor force statistics for Oak Park, 81.6% of individuals (13,311) out of the total population between 25 and 64 years of age (16,313) are in the labor force, with 6.8% or 905 of them being unemployed. The group with the highest labor force participation rate are those with the educational attainment of bachelor's degree or higher, with 90.6% or 5,987 individuals in the labor force. Within the labor force, individuals with high school diploma education have the highest percentage of unemployment, with 15.5% or 285 of them being unemployed.
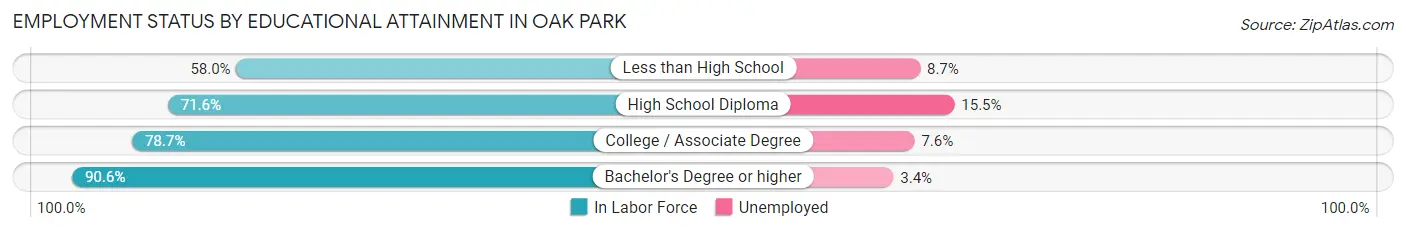
| Educational Attainment | In Labor Force | Unemployed |
| Less than High School | 390 (58.0%) | 58 (8.7%) |
| High School Diploma | 1,837 (71.6%) | 398 (15.5%) |
| College / Associate Degree | 5,090 (78.7%) | 491 (7.6%) |
| Bachelor's Degree or higher | 5,987 (90.6%) | 225 (3.4%) |
| Total | 13,311 (81.6%) | 1,109 (6.8%) |
Employment Occupations by Sex in Oak Park
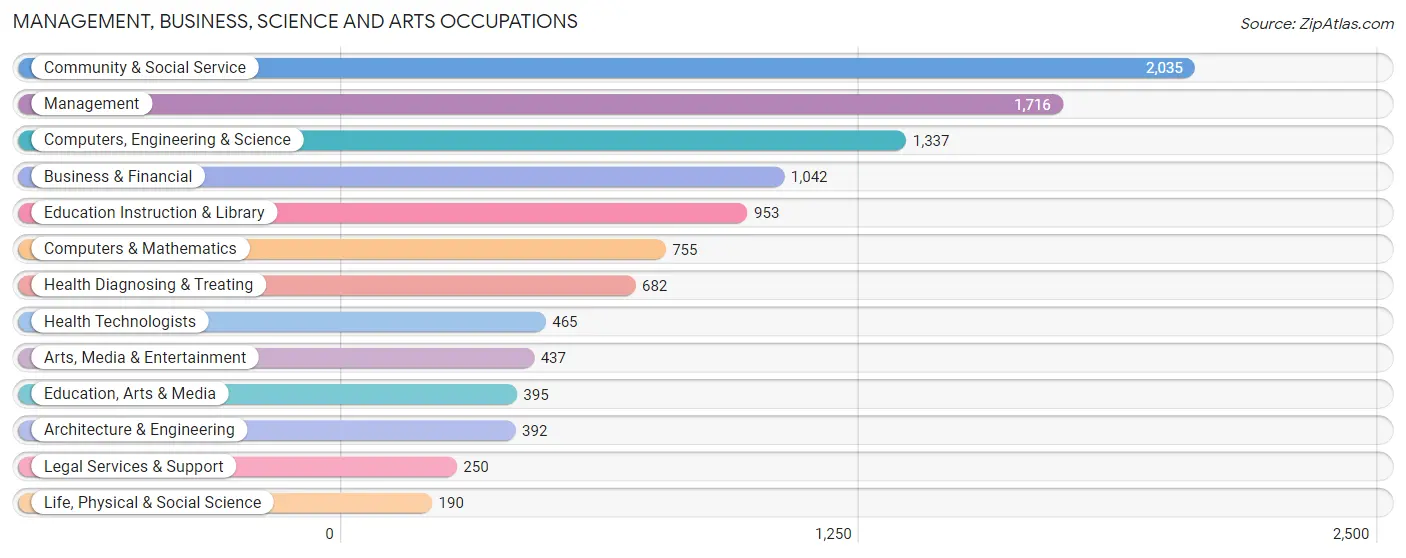
Management, Business, Science and Arts Occupations
The most common Management, Business, Science and Arts occupations in Oak Park are Community & Social Service (2,035 | 13.7%), Management (1,716 | 11.5%), Computers, Engineering & Science (1,337 | 9.0%), Business & Financial (1,042 | 7.0%), and Education Instruction & Library (953 | 6.4%).
Management, Business, Science and Arts Occupations by Sex
Within the Management, Business, Science and Arts occupations in Oak Park, the most male-oriented occupations are Computers & Mathematics (73.1%), Computers, Engineering & Science (66.8%), and Legal Services & Support (66.4%), while the most female-oriented occupations are Education, Arts & Media (92.7%), Education Instruction & Library (76.7%), and Health Diagnosing & Treating (70.7%).
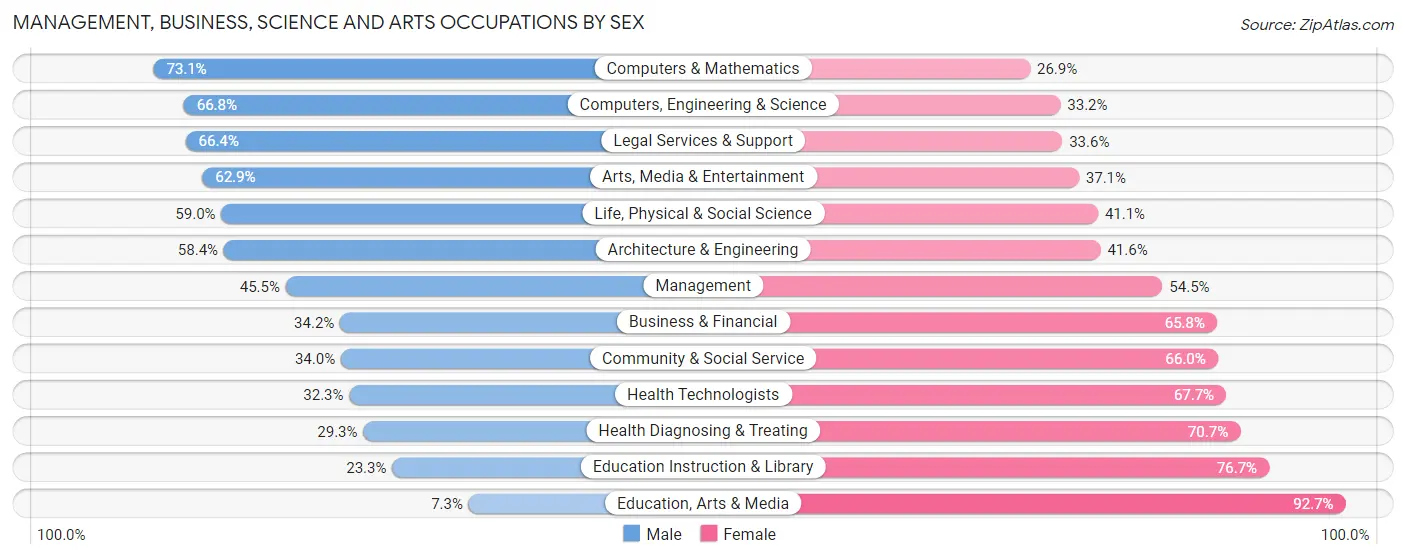
| Occupation | Male | Female |
| Management | 781 (45.5%) | 935 (54.5%) |
| Business & Financial | 356 (34.2%) | 686 (65.8%) |
| Computers, Engineering & Science | 893 (66.8%) | 444 (33.2%) |
| Computers & Mathematics | 552 (73.1%) | 203 (26.9%) |
| Architecture & Engineering | 229 (58.4%) | 163 (41.6%) |
| Life, Physical & Social Science | 112 (59.0%) | 78 (41.0%) |
| Community & Social Service | 692 (34.0%) | 1,343 (66.0%) |
| Education, Arts & Media | 29 (7.3%) | 366 (92.7%) |
| Legal Services & Support | 166 (66.4%) | 84 (33.6%) |
| Education Instruction & Library | 222 (23.3%) | 731 (76.7%) |
| Arts, Media & Entertainment | 275 (62.9%) | 162 (37.1%) |
| Health Diagnosing & Treating | 200 (29.3%) | 482 (70.7%) |
| Health Technologists | 150 (32.3%) | 315 (67.7%) |
| Total (Category) | 2,922 (42.9%) | 3,890 (57.1%) |
| Total (Overall) | 6,873 (46.1%) | 8,036 (53.9%) |
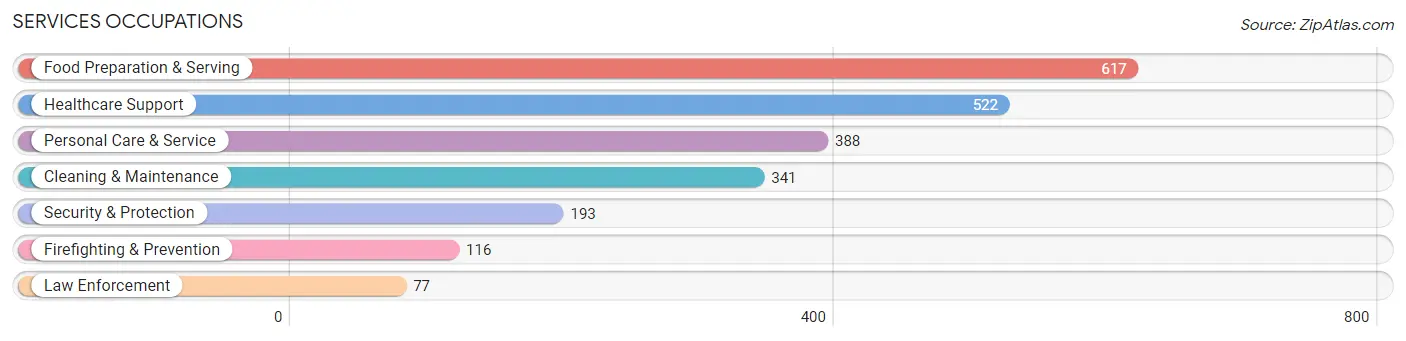
Services Occupations
The most common Services occupations in Oak Park are Food Preparation & Serving (617 | 4.1%), Healthcare Support (522 | 3.5%), Personal Care & Service (388 | 2.6%), Cleaning & Maintenance (341 | 2.3%), and Security & Protection (193 | 1.3%).
Services Occupations by Sex
Within the Services occupations in Oak Park, the most male-oriented occupations are Law Enforcement (89.6%), Security & Protection (75.6%), and Cleaning & Maintenance (68.9%), while the most female-oriented occupations are Healthcare Support (93.5%), Personal Care & Service (78.6%), and Food Preparation & Serving (58.2%).
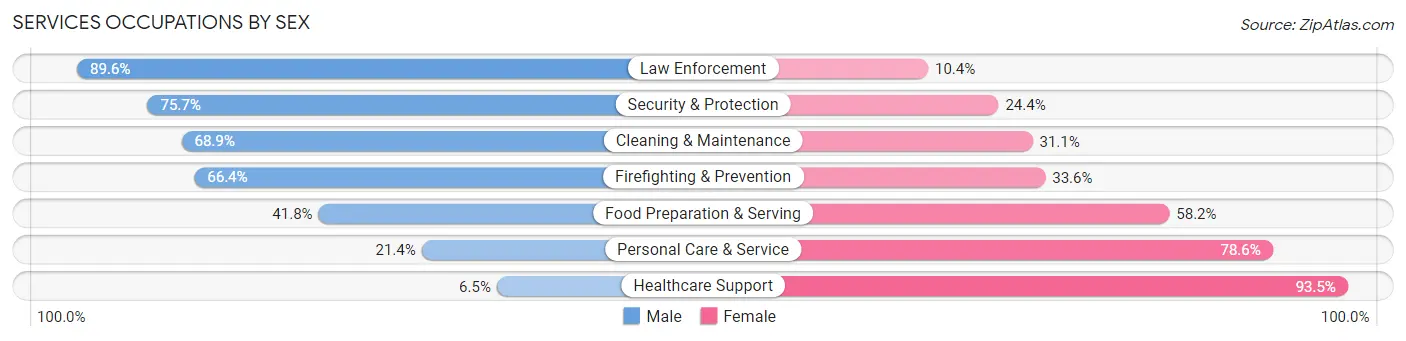
| Occupation | Male | Female |
| Healthcare Support | 34 (6.5%) | 488 (93.5%) |
| Security & Protection | 146 (75.6%) | 47 (24.3%) |
| Firefighting & Prevention | 77 (66.4%) | 39 (33.6%) |
| Law Enforcement | 69 (89.6%) | 8 (10.4%) |
| Food Preparation & Serving | 258 (41.8%) | 359 (58.2%) |
| Cleaning & Maintenance | 235 (68.9%) | 106 (31.1%) |
| Personal Care & Service | 83 (21.4%) | 305 (78.6%) |
| Total (Category) | 756 (36.7%) | 1,305 (63.3%) |
| Total (Overall) | 6,873 (46.1%) | 8,036 (53.9%) |
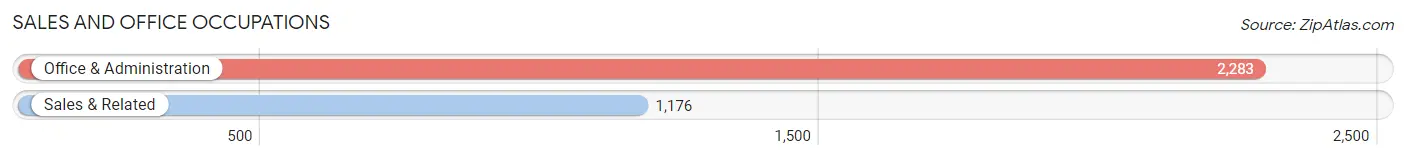
Sales and Office Occupations
The most common Sales and Office occupations in Oak Park are Office & Administration (2,283 | 15.3%), and Sales & Related (1,176 | 7.9%).
Sales and Office Occupations by Sex
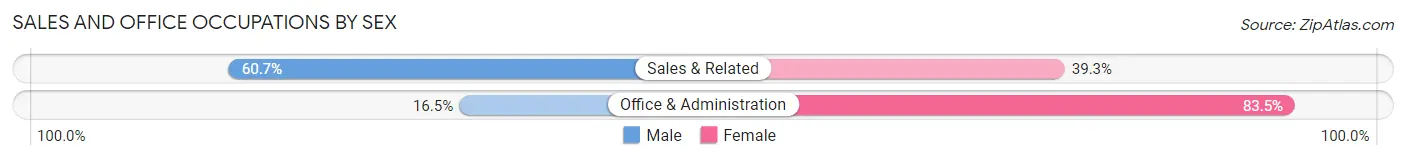
| Occupation | Male | Female |
| Sales & Related | 714 (60.7%) | 462 (39.3%) |
| Office & Administration | 376 (16.5%) | 1,907 (83.5%) |
| Total (Category) | 1,090 (31.5%) | 2,369 (68.5%) |
| Total (Overall) | 6,873 (46.1%) | 8,036 (53.9%) |
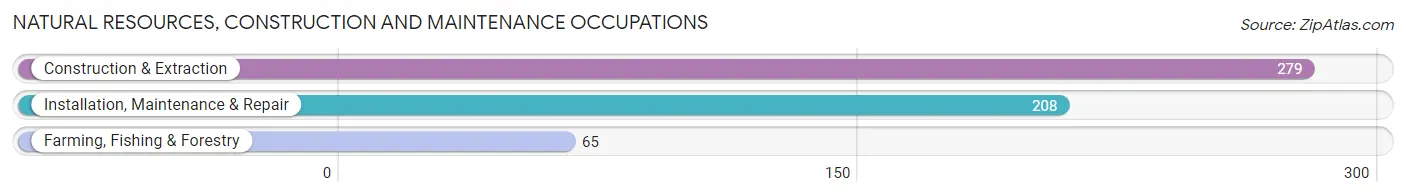
Natural Resources, Construction and Maintenance Occupations
The most common Natural Resources, Construction and Maintenance occupations in Oak Park are Construction & Extraction (279 | 1.9%), Installation, Maintenance & Repair (208 | 1.4%), and Farming, Fishing & Forestry (65 | 0.4%).
Natural Resources, Construction and Maintenance Occupations by Sex
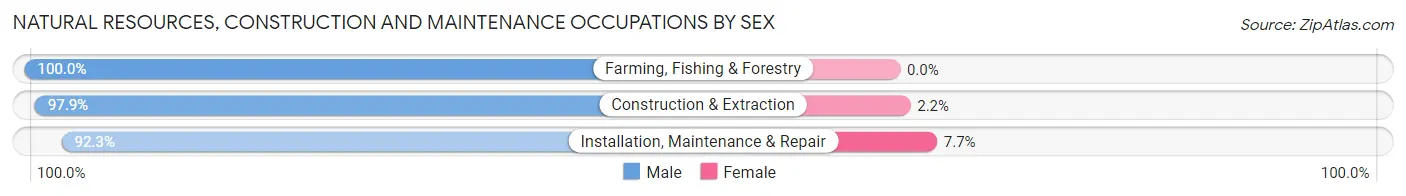
| Occupation | Male | Female |
| Farming, Fishing & Forestry | 65 (100.0%) | 0 (0.0%) |
| Construction & Extraction | 273 (97.9%) | 6 (2.1%) |
| Installation, Maintenance & Repair | 192 (92.3%) | 16 (7.7%) |
| Total (Category) | 530 (96.0%) | 22 (4.0%) |
| Total (Overall) | 6,873 (46.1%) | 8,036 (53.9%) |
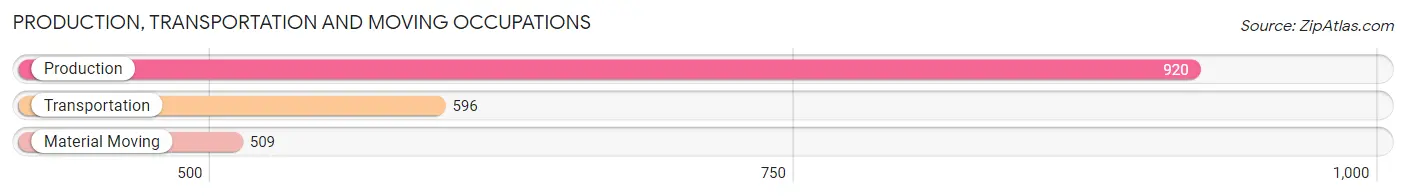
Production, Transportation and Moving Occupations
The most common Production, Transportation and Moving occupations in Oak Park are Production (920 | 6.2%), Transportation (596 | 4.0%), and Material Moving (509 | 3.4%).
Production, Transportation and Moving Occupations by Sex
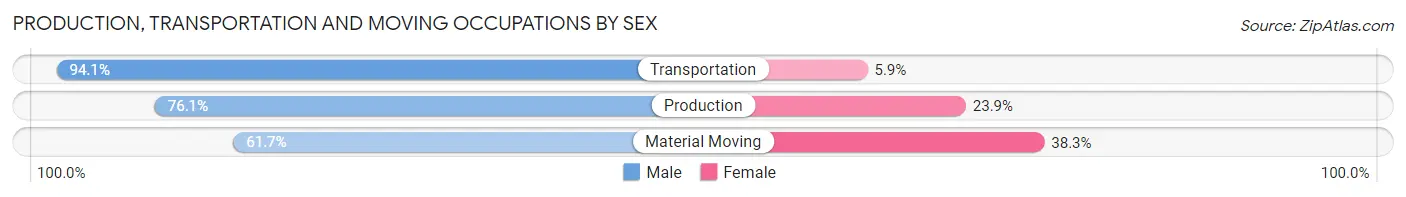
| Occupation | Male | Female |
| Production | 700 (76.1%) | 220 (23.9%) |
| Transportation | 561 (94.1%) | 35 (5.9%) |
| Material Moving | 314 (61.7%) | 195 (38.3%) |
| Total (Category) | 1,575 (77.8%) | 450 (22.2%) |
| Total (Overall) | 6,873 (46.1%) | 8,036 (53.9%) |
Employment Industries by Sex in Oak Park
Employment Industries in Oak Park
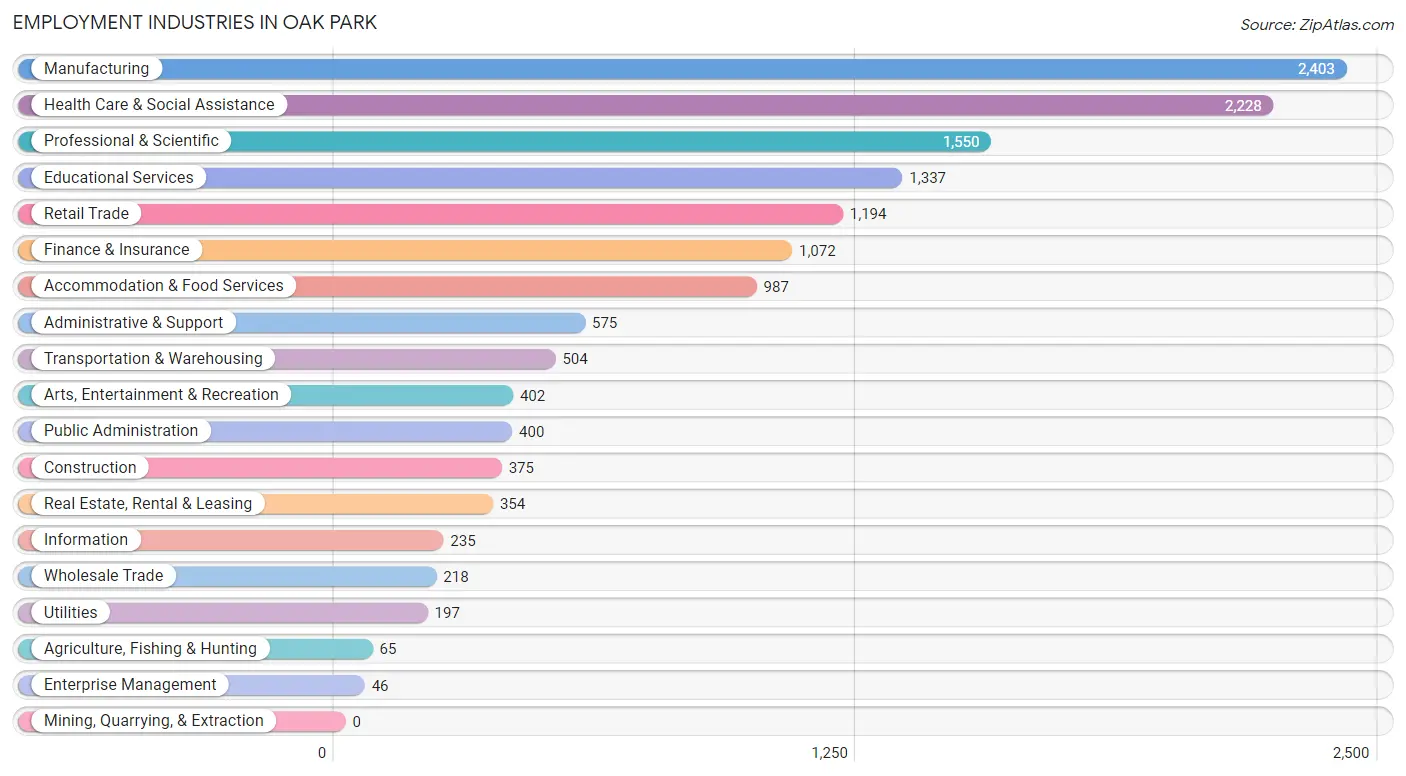
The major employment industries in Oak Park include Manufacturing (2,403 | 16.1%), Health Care & Social Assistance (2,228 | 14.9%), Professional & Scientific (1,550 | 10.4%), Educational Services (1,337 | 9.0%), and Retail Trade (1,194 | 8.0%).
Employment Industries by Sex in Oak Park
The Oak Park industries that see more men than women are Agriculture, Fishing & Hunting (100.0%), Enterprise Management (100.0%), and Construction (89.9%), whereas the industries that tend to have a higher number of women are Finance & Insurance (80.9%), Educational Services (76.2%), and Health Care & Social Assistance (74.9%).
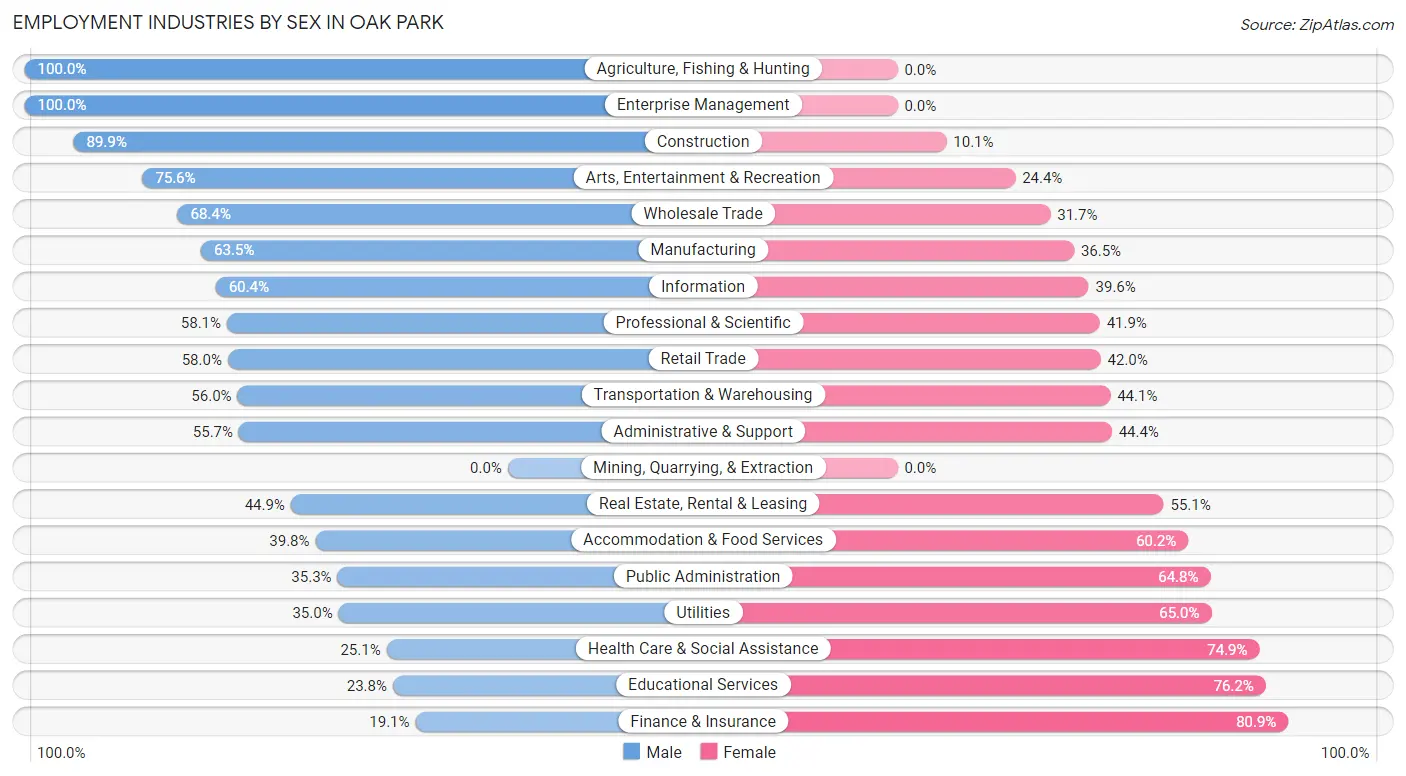
| Industry | Male | Female |
| Agriculture, Fishing & Hunting | 65 (100.0%) | 0 (0.0%) |
| Mining, Quarrying, & Extraction | 0 (0.0%) | 0 (0.0%) |
| Construction | 337 (89.9%) | 38 (10.1%) |
| Manufacturing | 1,525 (63.5%) | 878 (36.5%) |
| Wholesale Trade | 149 (68.3%) | 69 (31.7%) |
| Retail Trade | 692 (58.0%) | 502 (42.0%) |
| Transportation & Warehousing | 282 (55.9%) | 222 (44.1%) |
| Utilities | 69 (35.0%) | 128 (65.0%) |
| Information | 142 (60.4%) | 93 (39.6%) |
| Finance & Insurance | 205 (19.1%) | 867 (80.9%) |
| Real Estate, Rental & Leasing | 159 (44.9%) | 195 (55.1%) |
| Professional & Scientific | 901 (58.1%) | 649 (41.9%) |
| Enterprise Management | 46 (100.0%) | 0 (0.0%) |
| Administrative & Support | 320 (55.6%) | 255 (44.4%) |
| Educational Services | 318 (23.8%) | 1,019 (76.2%) |
| Health Care & Social Assistance | 559 (25.1%) | 1,669 (74.9%) |
| Arts, Entertainment & Recreation | 304 (75.6%) | 98 (24.4%) |
| Accommodation & Food Services | 393 (39.8%) | 594 (60.2%) |
| Public Administration | 141 (35.2%) | 259 (64.7%) |
| Total | 6,873 (46.1%) | 8,036 (53.9%) |
Education in Oak Park
School Enrollment in Oak Park
The most common levels of schooling among the 6,429 students in Oak Park are high school (1,541 | 24.0%), elementary school (1,362 | 21.2%), and college / undergraduate (1,265 | 19.7%).
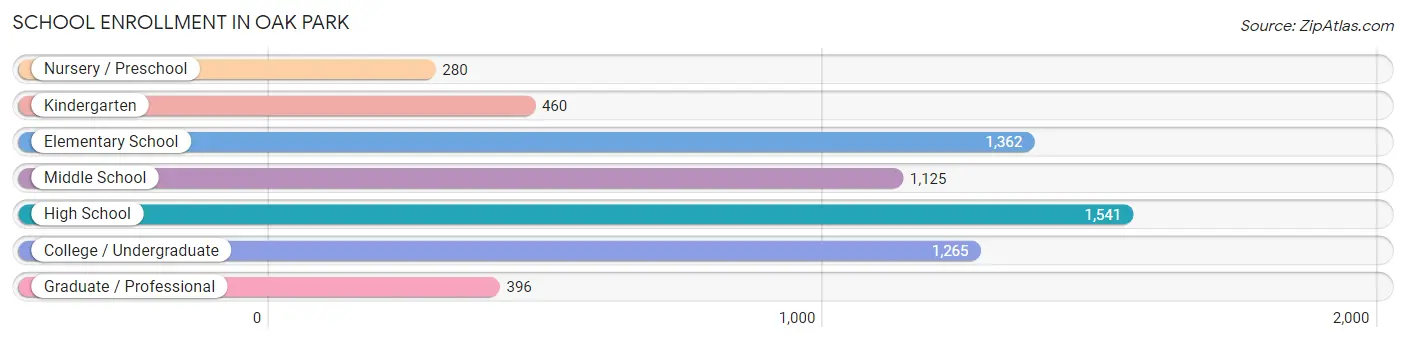
| School Level | # Students | % Students |
| Nursery / Preschool | 280 | 4.4% |
| Kindergarten | 460 | 7.2% |
| Elementary School | 1,362 | 21.2% |
| Middle School | 1,125 | 17.5% |
| High School | 1,541 | 24.0% |
| College / Undergraduate | 1,265 | 19.7% |
| Graduate / Professional | 396 | 6.2% |
| Total | 6,429 | 100.0% |
School Enrollment by Age by Funding Source in Oak Park
Out of a total of 6,429 students who are enrolled in schools in Oak Park, 1,247 (19.4%) attend a private institution, while the remaining 5,182 (80.6%) are enrolled in public schools. The age group of 18 to 19 year olds has the highest likelihood of being enrolled in private schools, with 140 (40.7% in the age bracket) enrolled. Conversely, the age group of 35 years and over has the lowest likelihood of being enrolled in a private school, with 447 (89.8% in the age bracket) attending a public institution.
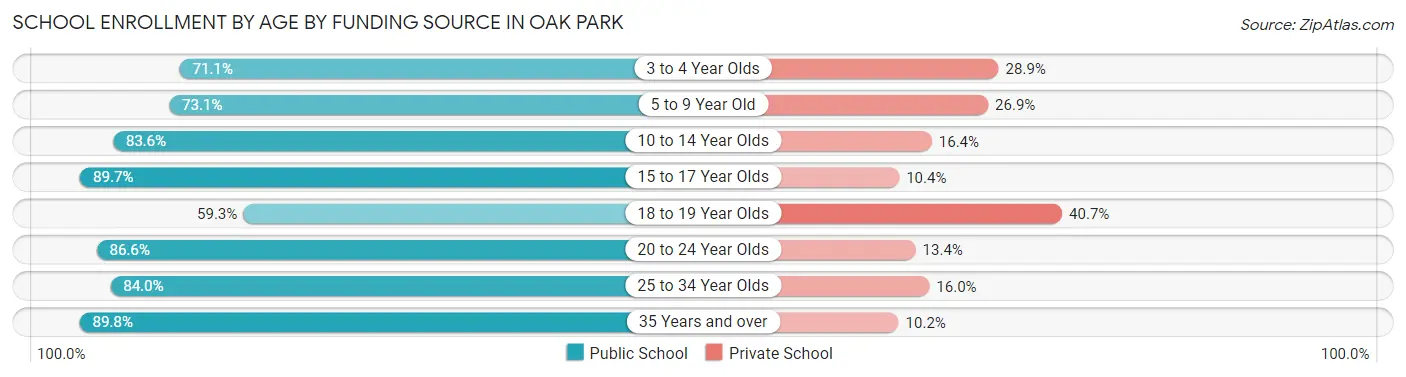
| Age Bracket | Public School | Private School |
| 3 to 4 Year Olds | 239 (71.1%) | 97 (28.9%) |
| 5 to 9 Year Old | 1,247 (73.1%) | 459 (26.9%) |
| 10 to 14 Year Olds | 1,221 (83.6%) | 240 (16.4%) |
| 15 to 17 Year Olds | 927 (89.6%) | 107 (10.3%) |
| 18 to 19 Year Olds | 204 (59.3%) | 140 (40.7%) |
| 20 to 24 Year Olds | 497 (86.6%) | 77 (13.4%) |
| 25 to 34 Year Olds | 400 (84.0%) | 76 (16.0%) |
| 35 Years and over | 447 (89.8%) | 51 (10.2%) |
| Total | 5,182 (80.6%) | 1,247 (19.4%) |
Educational Attainment by Field of Study in Oak Park
Business (1,676 | 18.9%), education (834 | 9.4%), engineering (808 | 9.1%), social sciences (695 | 7.8%), and psychology (671 | 7.5%) are the most common fields of study among 8,884 individuals in Oak Park who have obtained a bachelor's degree or higher.
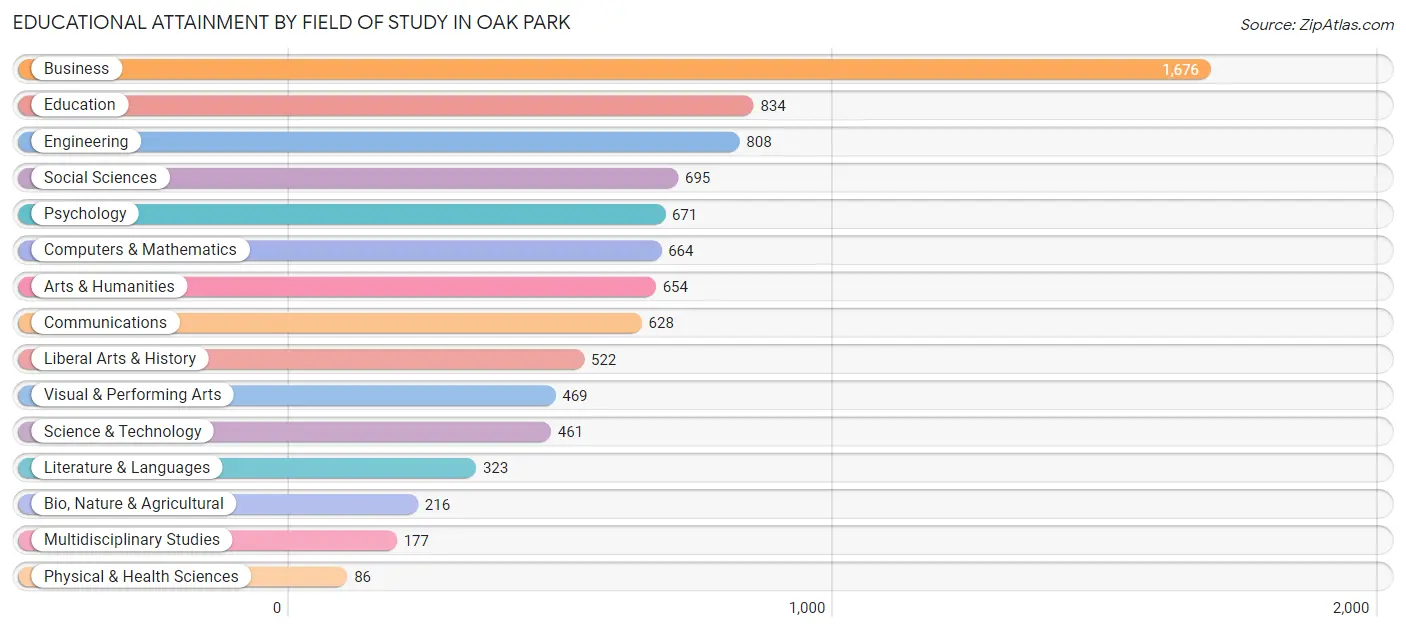
| Field of Study | # Graduates | % Graduates |
| Computers & Mathematics | 664 | 7.5% |
| Bio, Nature & Agricultural | 216 | 2.4% |
| Physical & Health Sciences | 86 | 1.0% |
| Psychology | 671 | 7.5% |
| Social Sciences | 695 | 7.8% |
| Engineering | 808 | 9.1% |
| Multidisciplinary Studies | 177 | 2.0% |
| Science & Technology | 461 | 5.2% |
| Business | 1,676 | 18.9% |
| Education | 834 | 9.4% |
| Literature & Languages | 323 | 3.6% |
| Liberal Arts & History | 522 | 5.9% |
| Visual & Performing Arts | 469 | 5.3% |
| Communications | 628 | 7.1% |
| Arts & Humanities | 654 | 7.4% |
| Total | 8,884 | 100.0% |
Transportation & Commute in Oak Park
Vehicle Availability by Sex in Oak Park
The most prevalent vehicle ownership categories in Oak Park are males with 2 vehicles (3,380, accounting for 49.9%) and females with 2 vehicles (3,558, making up 43.3%).
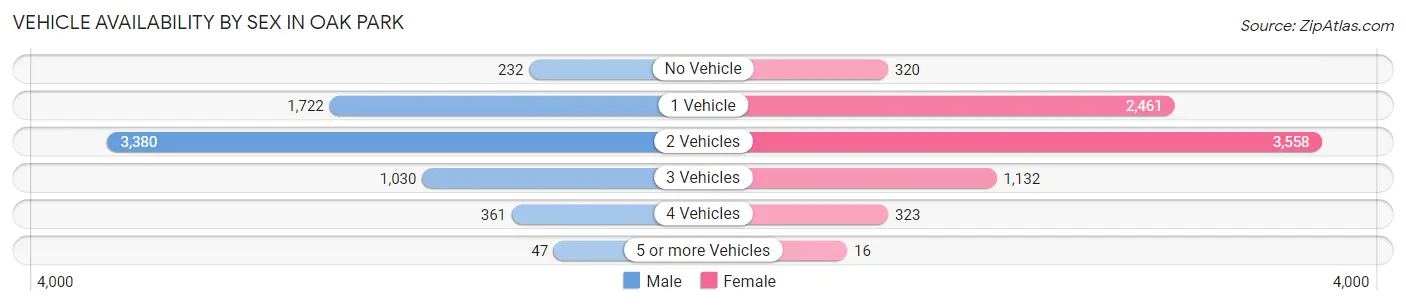
| Vehicles Available | Male | Female |
| No Vehicle | 232 (3.4%) | 320 (4.1%) |
| 1 Vehicle | 1,722 (25.4%) | 2,461 (31.5%) |
| 2 Vehicles | 3,380 (49.9%) | 3,558 (45.6%) |
| 3 Vehicles | 1,030 (15.2%) | 1,132 (14.5%) |
| 4 Vehicles | 361 (5.3%) | 323 (4.1%) |
| 5 or more Vehicles | 47 (0.7%) | 16 (0.2%) |
| Total | 6,772 (100.0%) | 7,810 (100.0%) |
Commute Time in Oak Park
The most frequently occuring commute durations in Oak Park are 20 to 24 minutes (2,270 commuters, 19.4%), 10 to 14 minutes (1,909 commuters, 16.3%), and 15 to 19 minutes (1,726 commuters, 14.7%).
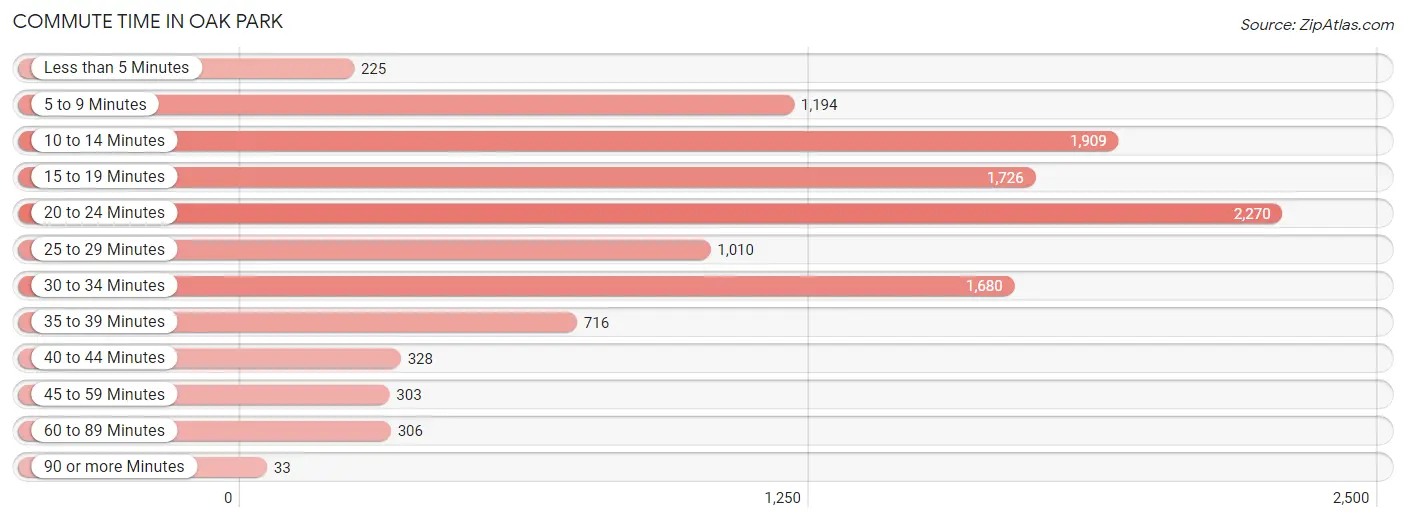
| Commute Time | # Commuters | % Commuters |
| Less than 5 Minutes | 225 | 1.9% |
| 5 to 9 Minutes | 1,194 | 10.2% |
| 10 to 14 Minutes | 1,909 | 16.3% |
| 15 to 19 Minutes | 1,726 | 14.7% |
| 20 to 24 Minutes | 2,270 | 19.4% |
| 25 to 29 Minutes | 1,010 | 8.6% |
| 30 to 34 Minutes | 1,680 | 14.4% |
| 35 to 39 Minutes | 716 | 6.1% |
| 40 to 44 Minutes | 328 | 2.8% |
| 45 to 59 Minutes | 303 | 2.6% |
| 60 to 89 Minutes | 306 | 2.6% |
| 90 or more Minutes | 33 | 0.3% |
Commute Time by Sex in Oak Park
The most common commute times in Oak Park are 20 to 24 minutes (1,070 commuters, 18.3%) for males and 20 to 24 minutes (1,200 commuters, 20.5%) for females.
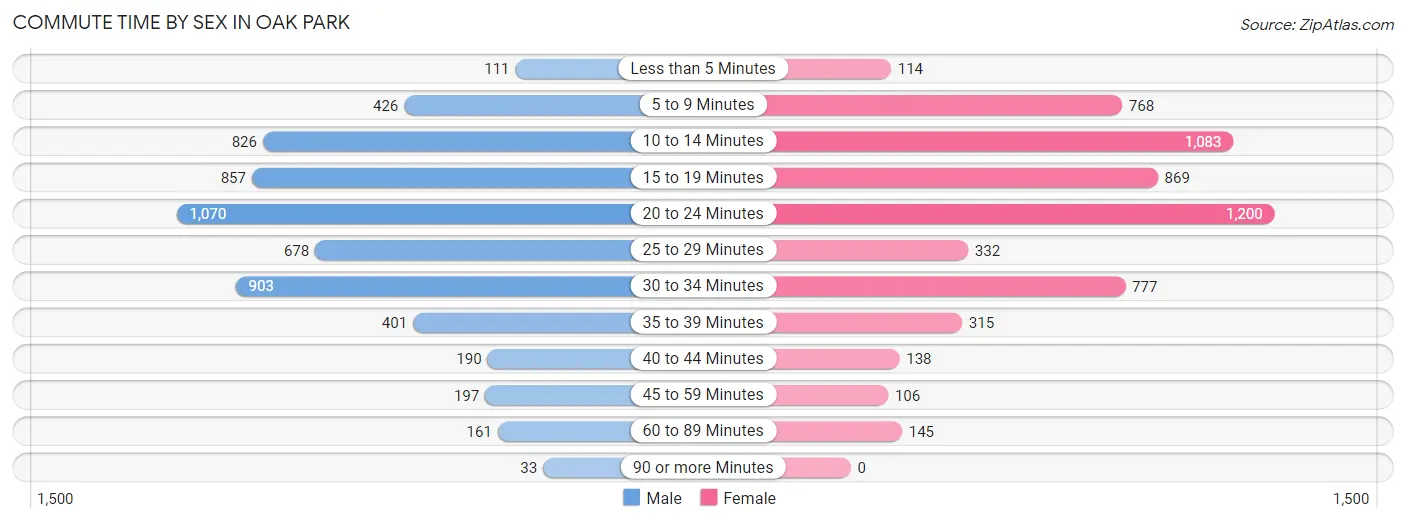
| Commute Time | Male | Female |
| Less than 5 Minutes | 111 (1.9%) | 114 (1.9%) |
| 5 to 9 Minutes | 426 (7.3%) | 768 (13.1%) |
| 10 to 14 Minutes | 826 (14.1%) | 1,083 (18.5%) |
| 15 to 19 Minutes | 857 (14.6%) | 869 (14.9%) |
| 20 to 24 Minutes | 1,070 (18.3%) | 1,200 (20.5%) |
| 25 to 29 Minutes | 678 (11.6%) | 332 (5.7%) |
| 30 to 34 Minutes | 903 (15.4%) | 777 (13.3%) |
| 35 to 39 Minutes | 401 (6.9%) | 315 (5.4%) |
| 40 to 44 Minutes | 190 (3.3%) | 138 (2.4%) |
| 45 to 59 Minutes | 197 (3.4%) | 106 (1.8%) |
| 60 to 89 Minutes | 161 (2.8%) | 145 (2.5%) |
| 90 or more Minutes | 33 (0.6%) | 0 (0.0%) |
Time of Departure to Work by Sex in Oak Park
The most frequent times of departure to work in Oak Park are 7:00 AM to 7:29 AM (713, 12.2%) for males and 8:00 AM to 8:29 AM (829, 14.2%) for females.
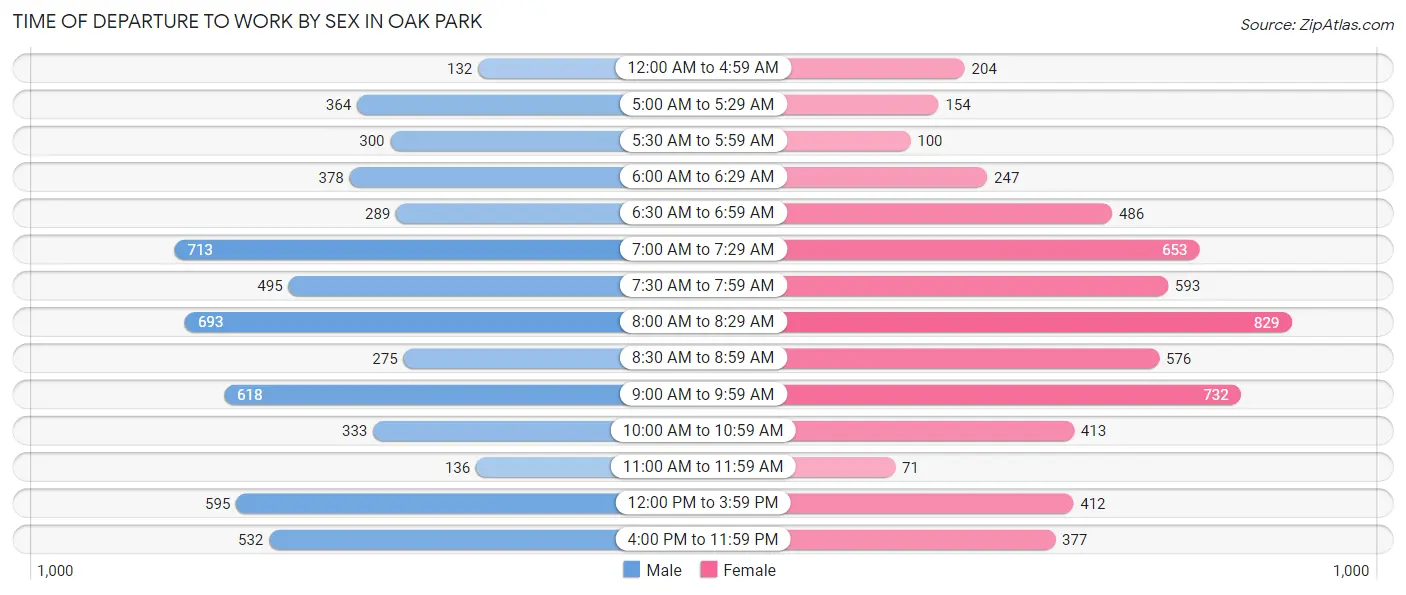
| Time of Departure | Male | Female |
| 12:00 AM to 4:59 AM | 132 (2.3%) | 204 (3.5%) |
| 5:00 AM to 5:29 AM | 364 (6.2%) | 154 (2.6%) |
| 5:30 AM to 5:59 AM | 300 (5.1%) | 100 (1.7%) |
| 6:00 AM to 6:29 AM | 378 (6.5%) | 247 (4.2%) |
| 6:30 AM to 6:59 AM | 289 (4.9%) | 486 (8.3%) |
| 7:00 AM to 7:29 AM | 713 (12.2%) | 653 (11.2%) |
| 7:30 AM to 7:59 AM | 495 (8.5%) | 593 (10.1%) |
| 8:00 AM to 8:29 AM | 693 (11.8%) | 829 (14.2%) |
| 8:30 AM to 8:59 AM | 275 (4.7%) | 576 (9.9%) |
| 9:00 AM to 9:59 AM | 618 (10.6%) | 732 (12.5%) |
| 10:00 AM to 10:59 AM | 333 (5.7%) | 413 (7.1%) |
| 11:00 AM to 11:59 AM | 136 (2.3%) | 71 (1.2%) |
| 12:00 PM to 3:59 PM | 595 (10.2%) | 412 (7.0%) |
| 4:00 PM to 11:59 PM | 532 (9.1%) | 377 (6.5%) |
| Total | 5,853 (100.0%) | 5,847 (100.0%) |
Housing Occupancy in Oak Park
Occupancy by Ownership in Oak Park
Of the total 12,432 dwellings in Oak Park, owner-occupied units account for 7,197 (57.9%), while renter-occupied units make up 5,235 (42.1%).
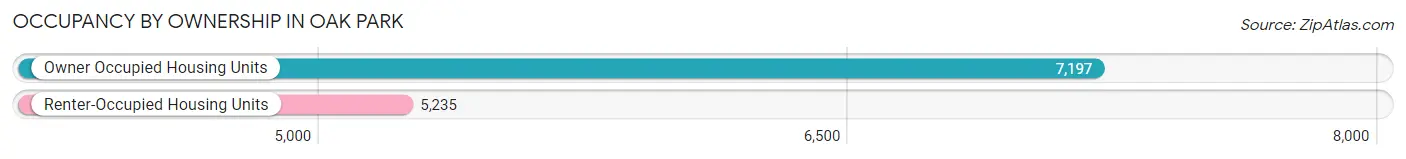
| Occupancy | # Housing Units | % Housing Units |
| Owner Occupied Housing Units | 7,197 | 57.9% |
| Renter-Occupied Housing Units | 5,235 | 42.1% |
| Total Occupied Housing Units | 12,432 | 100.0% |
Occupancy by Household Size in Oak Park
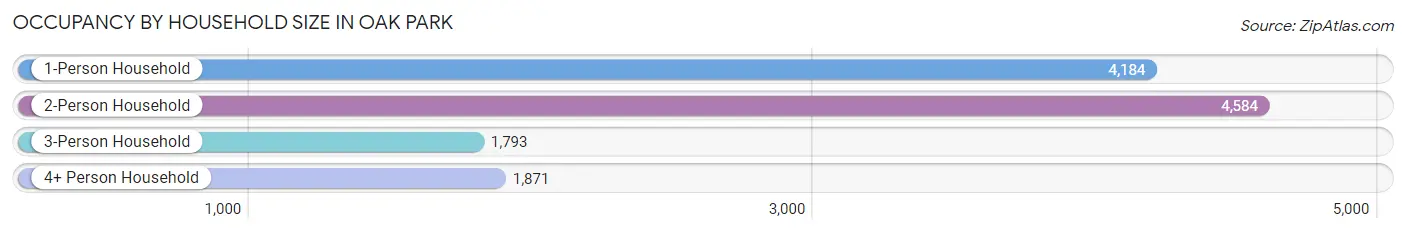
| Household Size | # Housing Units | % Housing Units |
| 1-Person Household | 4,184 | 33.7% |
| 2-Person Household | 4,584 | 36.9% |
| 3-Person Household | 1,793 | 14.4% |
| 4+ Person Household | 1,871 | 15.0% |
| Total Housing Units | 12,432 | 100.0% |
Occupancy by Ownership by Household Size in Oak Park
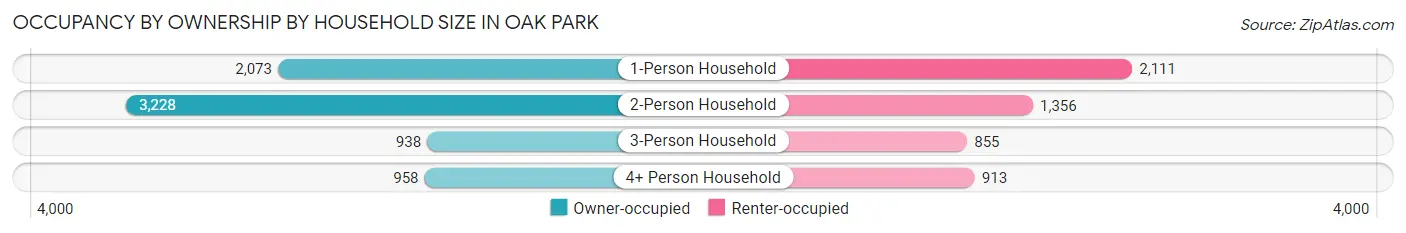
| Household Size | Owner-occupied | Renter-occupied |
| 1-Person Household | 2,073 (49.5%) | 2,111 (50.4%) |
| 2-Person Household | 3,228 (70.4%) | 1,356 (29.6%) |
| 3-Person Household | 938 (52.3%) | 855 (47.7%) |
| 4+ Person Household | 958 (51.2%) | 913 (48.8%) |
| Total Housing Units | 7,197 (57.9%) | 5,235 (42.1%) |
Occupancy by Educational Attainment in Oak Park
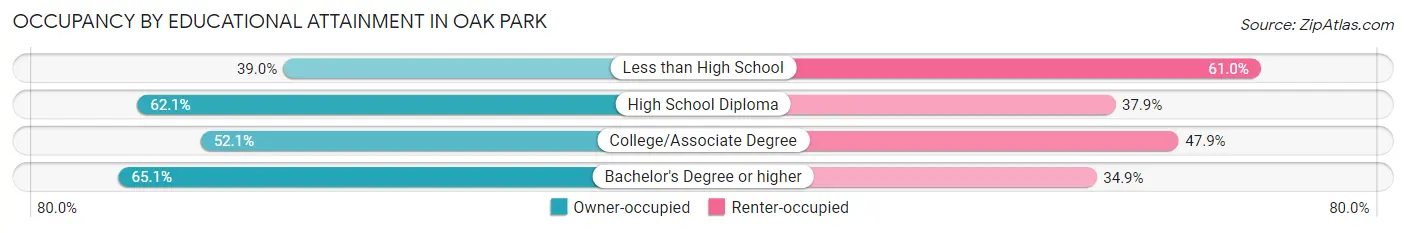
| Household Size | Owner-occupied | Renter-occupied |
| Less than High School | 343 (39.0%) | 536 (61.0%) |
| High School Diploma | 1,167 (62.1%) | 712 (37.9%) |
| College/Associate Degree | 2,435 (52.1%) | 2,242 (47.9%) |
| Bachelor's Degree or higher | 3,252 (65.1%) | 1,745 (34.9%) |
Occupancy by Age of Householder in Oak Park
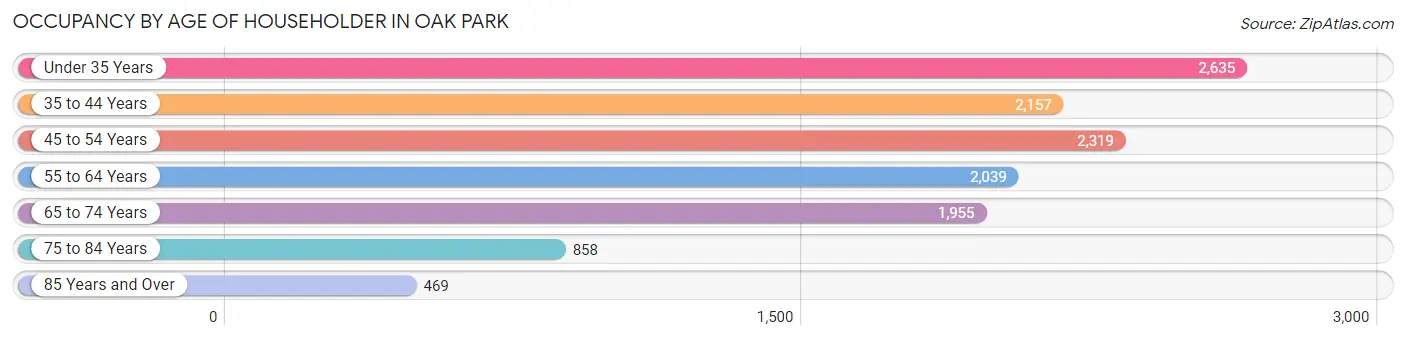
| Age Bracket | # Households | % Households |
| Under 35 Years | 2,635 | 21.2% |
| 35 to 44 Years | 2,157 | 17.3% |
| 45 to 54 Years | 2,319 | 18.6% |
| 55 to 64 Years | 2,039 | 16.4% |
| 65 to 74 Years | 1,955 | 15.7% |
| 75 to 84 Years | 858 | 6.9% |
| 85 Years and Over | 469 | 3.8% |
| Total | 12,432 | 100.0% |
Housing Finances in Oak Park
Median Income by Occupancy in Oak Park
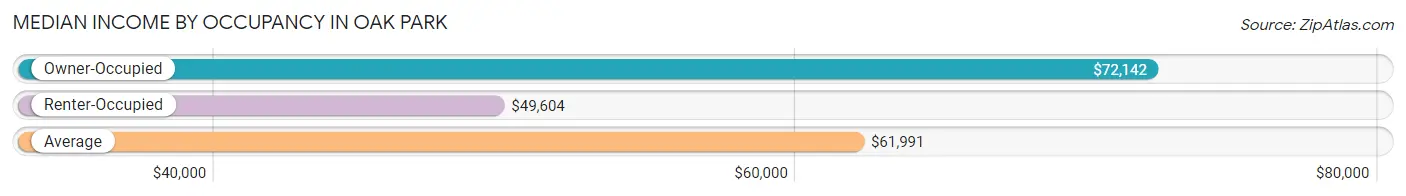
| Occupancy Type | # Households | Median Income |
| Owner-Occupied | 7,197 (57.9%) | $72,142 |
| Renter-Occupied | 5,235 (42.1%) | $49,604 |
| Average | 12,432 (100.0%) | $61,991 |
Occupancy by Householder Income Bracket in Oak Park
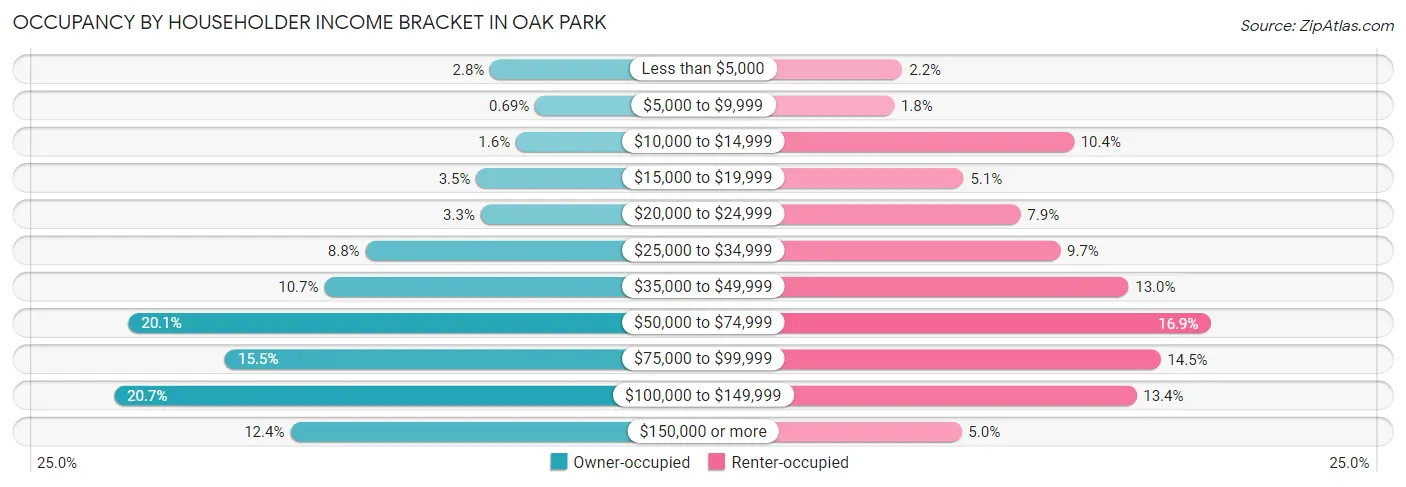
| Income Bracket | Owner-occupied | Renter-occupied |
| Less than $5,000 | 204 (2.8%) | 117 (2.2%) |
| $5,000 to $9,999 | 50 (0.7%) | 96 (1.8%) |
| $10,000 to $14,999 | 115 (1.6%) | 544 (10.4%) |
| $15,000 to $19,999 | 251 (3.5%) | 269 (5.1%) |
| $20,000 to $24,999 | 236 (3.3%) | 411 (7.9%) |
| $25,000 to $34,999 | 631 (8.8%) | 510 (9.7%) |
| $35,000 to $49,999 | 772 (10.7%) | 680 (13.0%) |
| $50,000 to $74,999 | 1,444 (20.1%) | 884 (16.9%) |
| $75,000 to $99,999 | 1,112 (15.4%) | 760 (14.5%) |
| $100,000 to $149,999 | 1,493 (20.7%) | 700 (13.4%) |
| $150,000 or more | 889 (12.3%) | 264 (5.0%) |
| Total | 7,197 (100.0%) | 5,235 (100.0%) |
Monthly Housing Cost Tiers in Oak Park
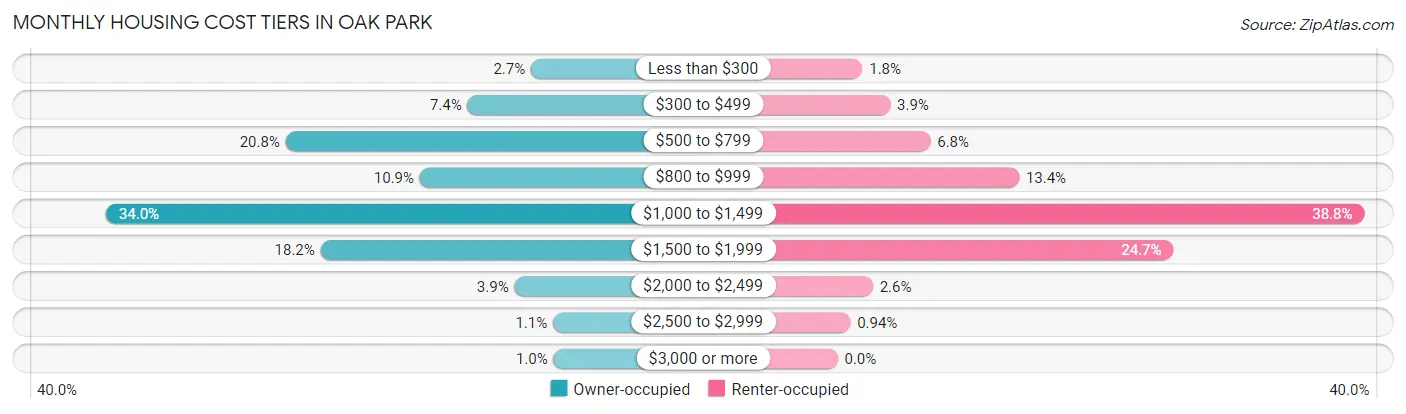
| Monthly Cost | Owner-occupied | Renter-occupied |
| Less than $300 | 194 (2.7%) | 96 (1.8%) |
| $300 to $499 | 531 (7.4%) | 203 (3.9%) |
| $500 to $799 | 1,495 (20.8%) | 358 (6.8%) |
| $800 to $999 | 784 (10.9%) | 700 (13.4%) |
| $1,000 to $1,499 | 2,448 (34.0%) | 2,031 (38.8%) |
| $1,500 to $1,999 | 1,310 (18.2%) | 1,295 (24.7%) |
| $2,000 to $2,499 | 282 (3.9%) | 136 (2.6%) |
| $2,500 to $2,999 | 78 (1.1%) | 49 (0.9%) |
| $3,000 or more | 75 (1.0%) | 0 (0.0%) |
| Total | 7,197 (100.0%) | 5,235 (100.0%) |
Physical Housing Characteristics in Oak Park
Housing Structures in Oak Park
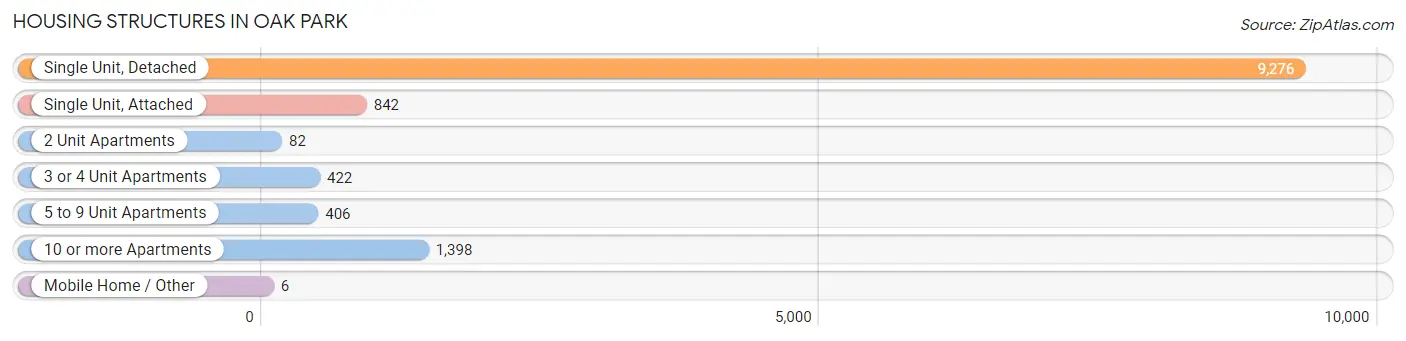
| Structure Type | # Housing Units | % Housing Units |
| Single Unit, Detached | 9,276 | 74.6% |
| Single Unit, Attached | 842 | 6.8% |
| 2 Unit Apartments | 82 | 0.7% |
| 3 or 4 Unit Apartments | 422 | 3.4% |
| 5 to 9 Unit Apartments | 406 | 3.3% |
| 10 or more Apartments | 1,398 | 11.3% |
| Mobile Home / Other | 6 | 0.1% |
| Total | 12,432 | 100.0% |
Housing Structures by Occupancy in Oak Park
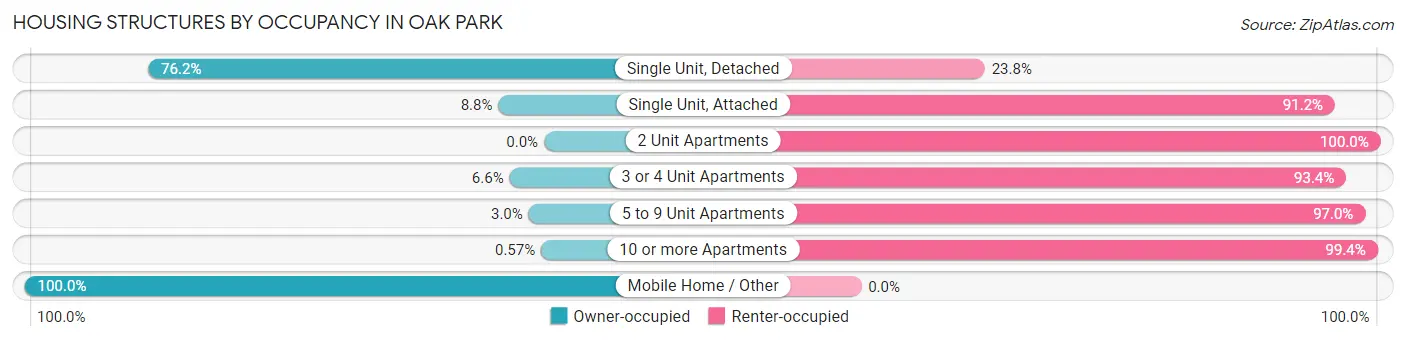
| Structure Type | Owner-occupied | Renter-occupied |
| Single Unit, Detached | 7,069 (76.2%) | 2,207 (23.8%) |
| Single Unit, Attached | 74 (8.8%) | 768 (91.2%) |
| 2 Unit Apartments | 0 (0.0%) | 82 (100.0%) |
| 3 or 4 Unit Apartments | 28 (6.6%) | 394 (93.4%) |
| 5 to 9 Unit Apartments | 12 (3.0%) | 394 (97.0%) |
| 10 or more Apartments | 8 (0.6%) | 1,390 (99.4%) |
| Mobile Home / Other | 6 (100.0%) | 0 (0.0%) |
| Total | 7,197 (57.9%) | 5,235 (42.1%) |
Housing Structures by Number of Rooms in Oak Park
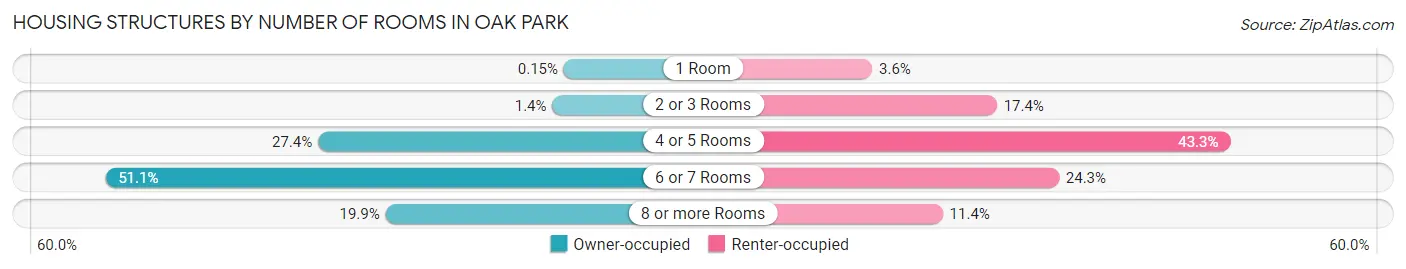
| Number of Rooms | Owner-occupied | Renter-occupied |
| 1 Room | 11 (0.2%) | 187 (3.6%) |
| 2 or 3 Rooms | 103 (1.4%) | 911 (17.4%) |
| 4 or 5 Rooms | 1,974 (27.4%) | 2,268 (43.3%) |
| 6 or 7 Rooms | 3,674 (51.0%) | 1,272 (24.3%) |
| 8 or more Rooms | 1,435 (19.9%) | 597 (11.4%) |
| Total | 7,197 (100.0%) | 5,235 (100.0%) |
Housing Structure by Heating Type in Oak Park
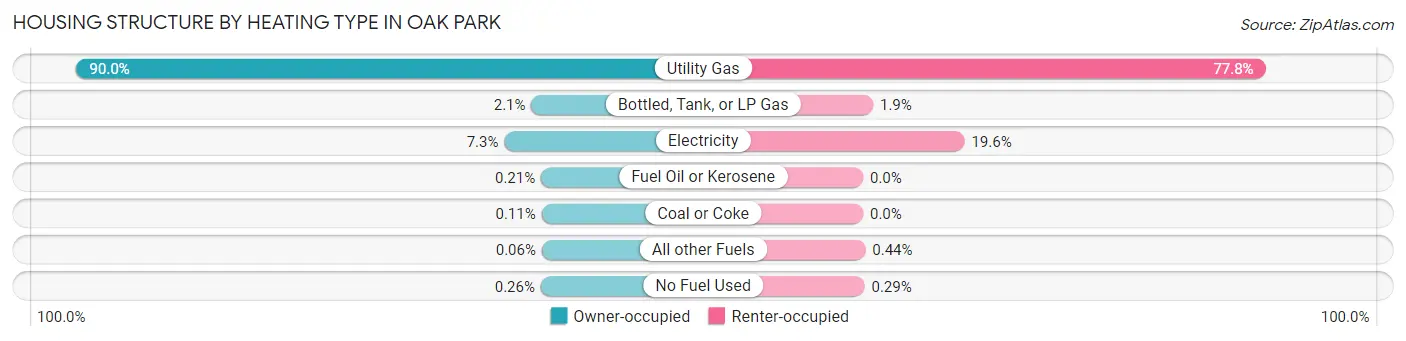
| Heating Type | Owner-occupied | Renter-occupied |
| Utility Gas | 6,476 (90.0%) | 4,070 (77.7%) |
| Bottled, Tank, or LP Gas | 149 (2.1%) | 101 (1.9%) |
| Electricity | 526 (7.3%) | 1,026 (19.6%) |
| Fuel Oil or Kerosene | 15 (0.2%) | 0 (0.0%) |
| Coal or Coke | 8 (0.1%) | 0 (0.0%) |
| All other Fuels | 4 (0.1%) | 23 (0.4%) |
| No Fuel Used | 19 (0.3%) | 15 (0.3%) |
| Total | 7,197 (100.0%) | 5,235 (100.0%) |
Household Vehicle Usage in Oak Park
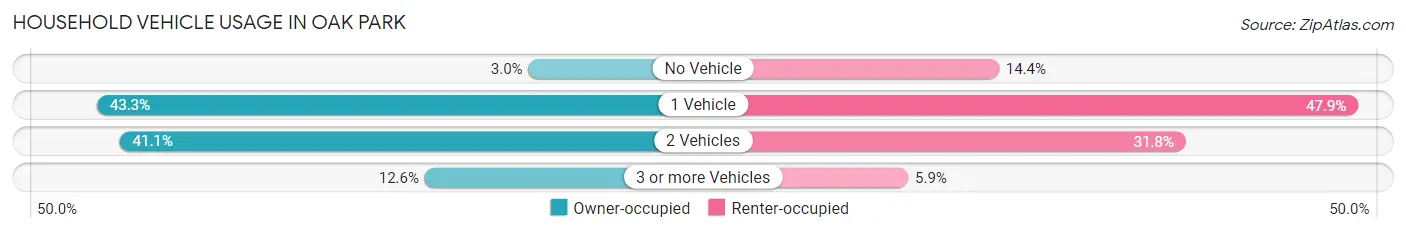
| Vehicles per Household | Owner-occupied | Renter-occupied |
| No Vehicle | 214 (3.0%) | 752 (14.4%) |
| 1 Vehicle | 3,113 (43.2%) | 2,508 (47.9%) |
| 2 Vehicles | 2,960 (41.1%) | 1,666 (31.8%) |
| 3 or more Vehicles | 910 (12.6%) | 309 (5.9%) |
| Total | 7,197 (100.0%) | 5,235 (100.0%) |
Real Estate & Mortgages in Oak Park
Real Estate and Mortgage Overview in Oak Park
| Characteristic | Without Mortgage | With Mortgage |
| Housing Units | 2,274 | 4,923 |
| Median Property Value | $160,800 | $183,400 |
| Median Household Income | $54,605 | $639 |
| Monthly Housing Costs | $586 | $75 |
| Real Estate Taxes | $2,418 | $83 |
Property Value by Mortgage Status in Oak Park
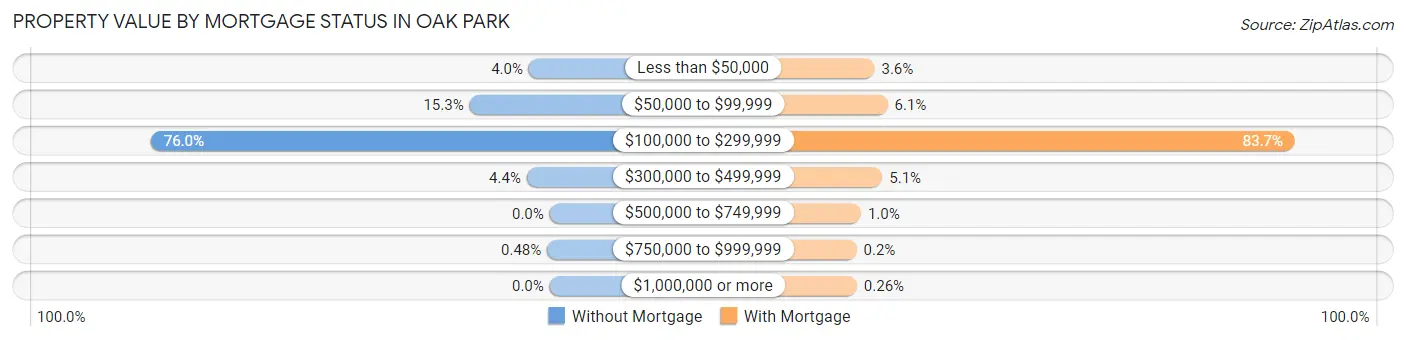
| Property Value | Without Mortgage | With Mortgage |
| Less than $50,000 | 90 (4.0%) | 178 (3.6%) |
| $50,000 to $99,999 | 347 (15.3%) | 301 (6.1%) |
| $100,000 to $299,999 | 1,727 (75.9%) | 4,119 (83.7%) |
| $300,000 to $499,999 | 99 (4.3%) | 251 (5.1%) |
| $500,000 to $749,999 | 0 (0.0%) | 51 (1.0%) |
| $750,000 to $999,999 | 11 (0.5%) | 10 (0.2%) |
| $1,000,000 or more | 0 (0.0%) | 13 (0.3%) |
| Total | 2,274 (100.0%) | 4,923 (100.0%) |
Household Income by Mortgage Status in Oak Park
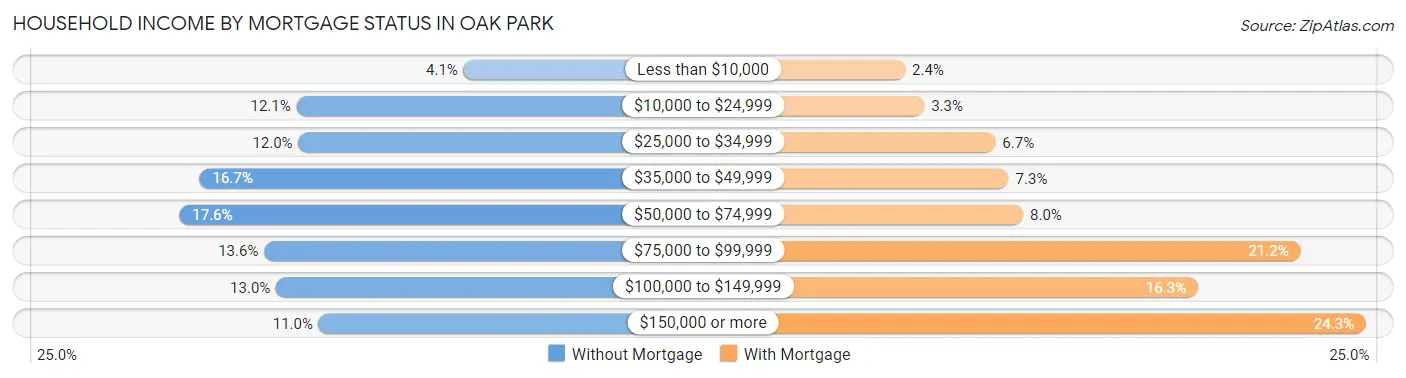
| Household Income | Without Mortgage | With Mortgage |
| Less than $10,000 | 93 (4.1%) | 116 (2.4%) |
| $10,000 to $24,999 | 274 (12.0%) | 161 (3.3%) |
| $25,000 to $34,999 | 272 (12.0%) | 328 (6.7%) |
| $35,000 to $49,999 | 379 (16.7%) | 359 (7.3%) |
| $50,000 to $74,999 | 401 (17.6%) | 393 (8.0%) |
| $75,000 to $99,999 | 309 (13.6%) | 1,043 (21.2%) |
| $100,000 to $149,999 | 296 (13.0%) | 803 (16.3%) |
| $150,000 or more | 250 (11.0%) | 1,197 (24.3%) |
| Total | 2,274 (100.0%) | 4,923 (100.0%) |
Property Value to Household Income Ratio in Oak Park
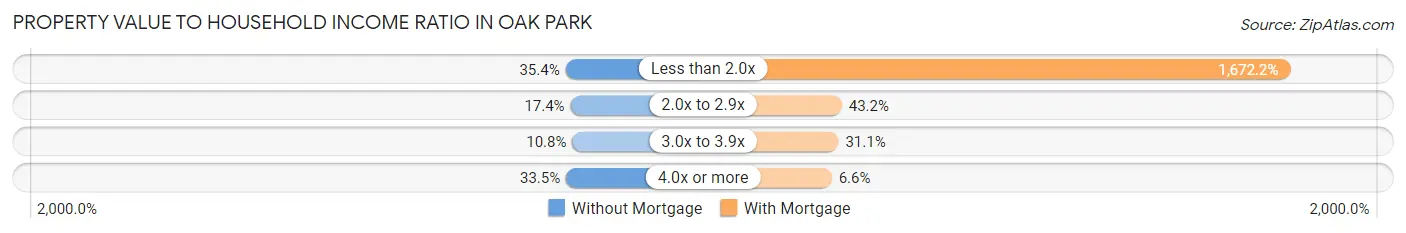
| Value-to-Income Ratio | Without Mortgage | With Mortgage |
| Less than 2.0x | 805 (35.4%) | 82,321 (1,672.2%) |
| 2.0x to 2.9x | 395 (17.4%) | 2,127 (43.2%) |
| 3.0x to 3.9x | 245 (10.8%) | 1,530 (31.1%) |
| 4.0x or more | 761 (33.5%) | 326 (6.6%) |
| Total | 2,274 (100.0%) | 4,923 (100.0%) |
Real Estate Taxes by Mortgage Status in Oak Park
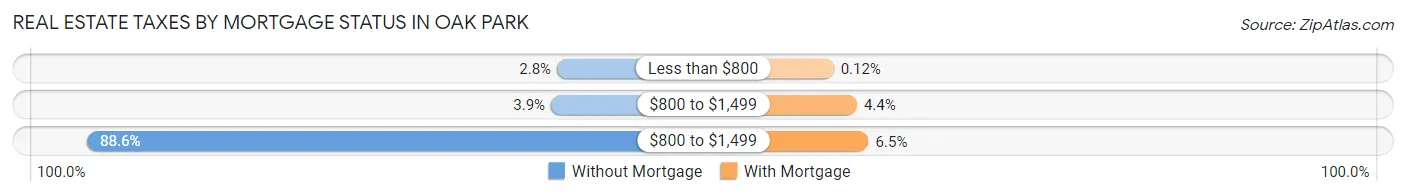
| Property Taxes | Without Mortgage | With Mortgage |
| Less than $800 | 63 (2.8%) | 6 (0.1%) |
| $800 to $1,499 | 88 (3.9%) | 215 (4.4%) |
| $800 to $1,499 | 2,014 (88.6%) | 320 (6.5%) |
| Total | 2,274 (100.0%) | 4,923 (100.0%) |
Health & Disability in Oak Park
Health Insurance Coverage by Age in Oak Park
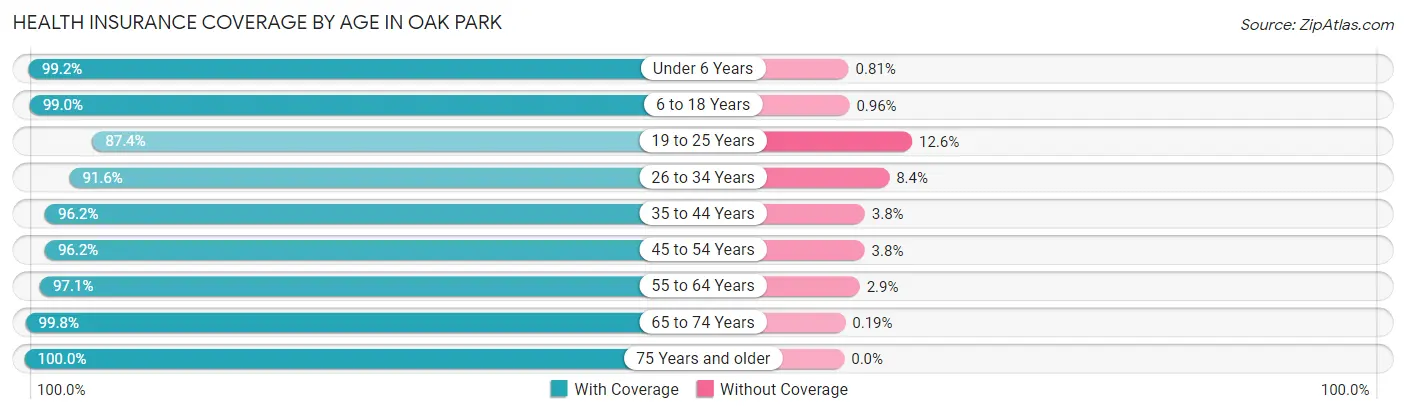
| Age Bracket | With Coverage | Without Coverage |
| Under 6 Years | 1,476 (99.2%) | 12 (0.8%) |
| 6 to 18 Years | 4,349 (99.0%) | 42 (1.0%) |
| 19 to 25 Years | 2,509 (87.4%) | 363 (12.6%) |
| 26 to 34 Years | 4,292 (91.6%) | 392 (8.4%) |
| 35 to 44 Years | 3,665 (96.2%) | 146 (3.8%) |
| 45 to 54 Years | 3,522 (96.2%) | 139 (3.8%) |
| 55 to 64 Years | 3,470 (97.1%) | 103 (2.9%) |
| 65 to 74 Years | 3,215 (99.8%) | 6 (0.2%) |
| 75 Years and older | 1,760 (100.0%) | 0 (0.0%) |
| Total | 28,258 (95.9%) | 1,203 (4.1%) |
Health Insurance Coverage by Citizenship Status in Oak Park
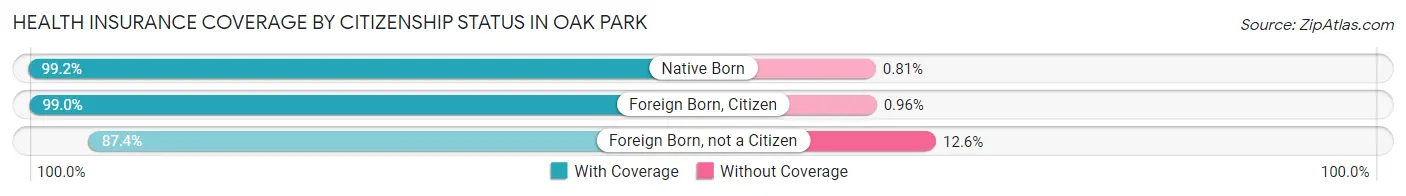
| Citizenship Status | With Coverage | Without Coverage |
| Native Born | 1,476 (99.2%) | 12 (0.8%) |
| Foreign Born, Citizen | 4,349 (99.0%) | 42 (1.0%) |
| Foreign Born, not a Citizen | 2,509 (87.4%) | 363 (12.6%) |
Health Insurance Coverage by Household Income in Oak Park
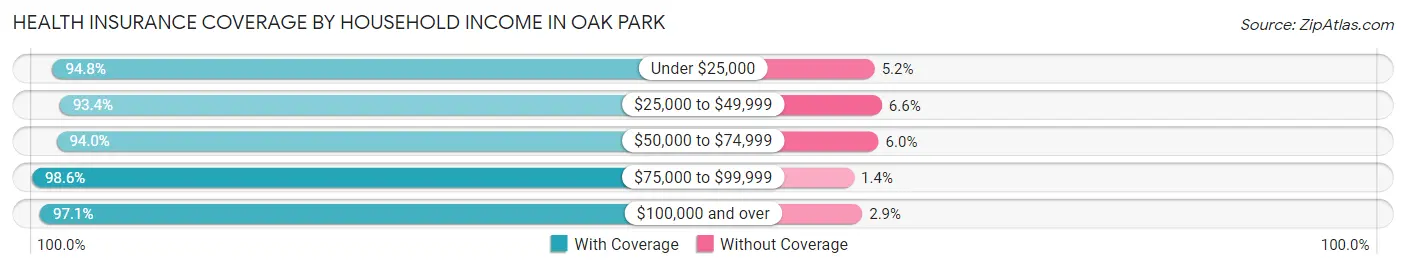
| Household Income | With Coverage | Without Coverage |
| Under $25,000 | 4,090 (94.8%) | 226 (5.2%) |
| $25,000 to $49,999 | 4,487 (93.4%) | 316 (6.6%) |
| $50,000 to $74,999 | 4,679 (94.0%) | 297 (6.0%) |
| $75,000 to $99,999 | 5,283 (98.6%) | 74 (1.4%) |
| $100,000 and over | 9,681 (97.1%) | 289 (2.9%) |
Public vs Private Health Insurance Coverage by Age in Oak Park
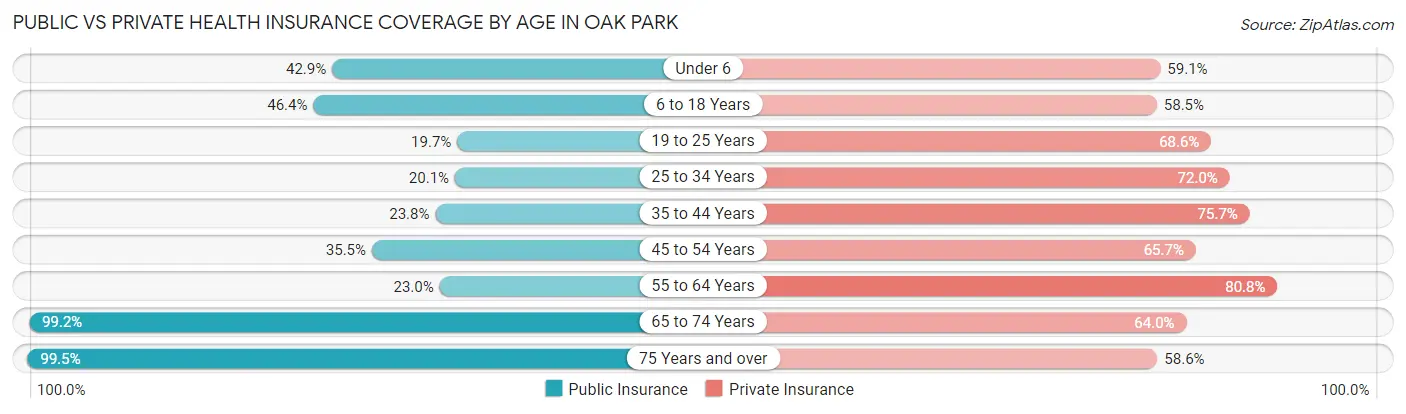
| Age Bracket | Public Insurance | Private Insurance |
| Under 6 | 639 (42.9%) | 880 (59.1%) |
| 6 to 18 Years | 2,038 (46.4%) | 2,568 (58.5%) |
| 19 to 25 Years | 566 (19.7%) | 1,969 (68.6%) |
| 25 to 34 Years | 943 (20.1%) | 3,372 (72.0%) |
| 35 to 44 Years | 906 (23.8%) | 2,885 (75.7%) |
| 45 to 54 Years | 1,301 (35.5%) | 2,405 (65.7%) |
| 55 to 64 Years | 821 (23.0%) | 2,888 (80.8%) |
| 65 to 74 Years | 3,195 (99.2%) | 2,060 (64.0%) |
| 75 Years and over | 1,751 (99.5%) | 1,031 (58.6%) |
| Total | 12,160 (41.3%) | 20,058 (68.1%) |
Disability Status by Sex by Age in Oak Park
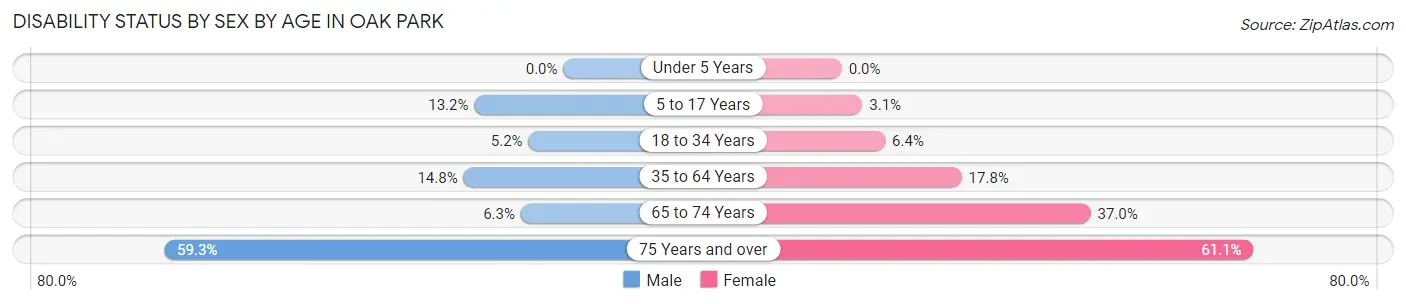
| Age Bracket | Male | Female |
| Under 5 Years | 0 (0.0%) | 0 (0.0%) |
| 5 to 17 Years | 299 (13.2%) | 65 (3.0%) |
| 18 to 34 Years | 195 (5.2%) | 261 (6.4%) |
| 35 to 64 Years | 753 (14.8%) | 1,062 (17.8%) |
| 65 to 74 Years | 83 (6.3%) | 705 (36.9%) |
| 75 Years and over | 374 (59.3%) | 690 (61.1%) |
Disability Class by Sex by Age in Oak Park
Disability Class: Hearing Difficulty
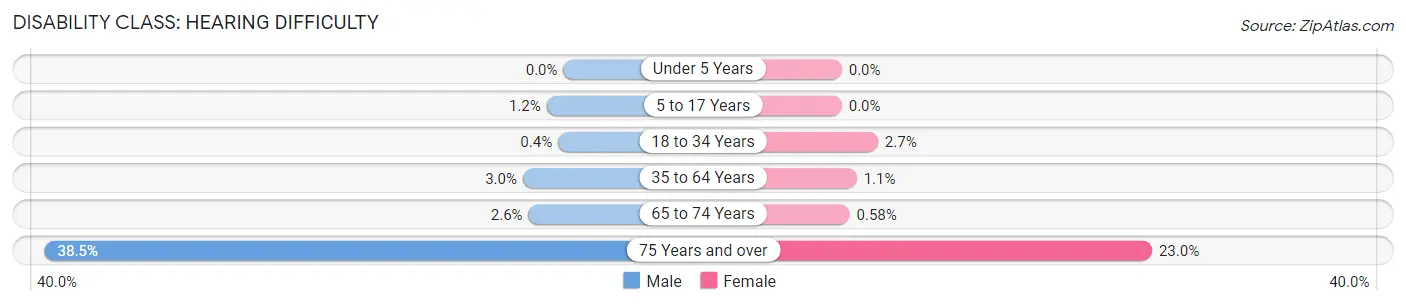
| Age Bracket | Male | Female |
| Under 5 Years | 0 (0.0%) | 0 (0.0%) |
| 5 to 17 Years | 28 (1.2%) | 0 (0.0%) |
| 18 to 34 Years | 15 (0.4%) | 109 (2.7%) |
| 35 to 64 Years | 153 (3.0%) | 66 (1.1%) |
| 65 to 74 Years | 34 (2.6%) | 11 (0.6%) |
| 75 Years and over | 243 (38.5%) | 260 (23.0%) |
Disability Class: Vision Difficulty
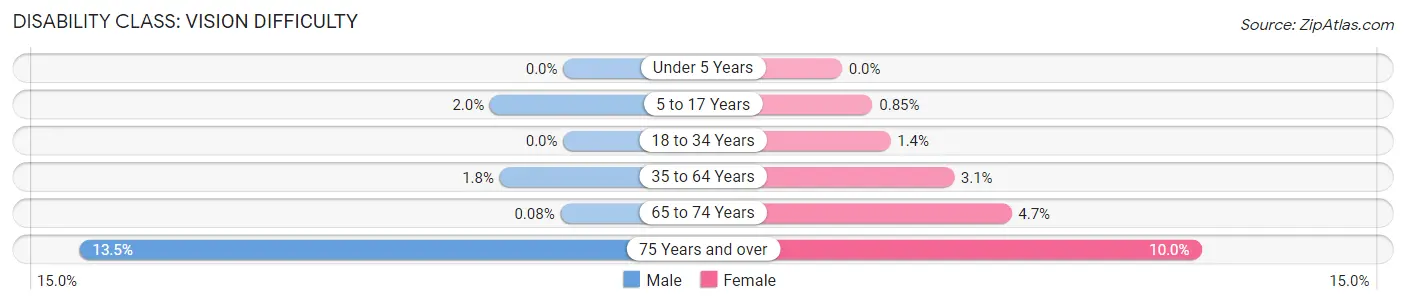
| Age Bracket | Male | Female |
| Under 5 Years | 0 (0.0%) | 0 (0.0%) |
| 5 to 17 Years | 46 (2.0%) | 18 (0.9%) |
| 18 to 34 Years | 0 (0.0%) | 55 (1.3%) |
| 35 to 64 Years | 90 (1.8%) | 186 (3.1%) |
| 65 to 74 Years | 1 (0.1%) | 90 (4.7%) |
| 75 Years and over | 85 (13.5%) | 113 (10.0%) |
Disability Class: Cognitive Difficulty
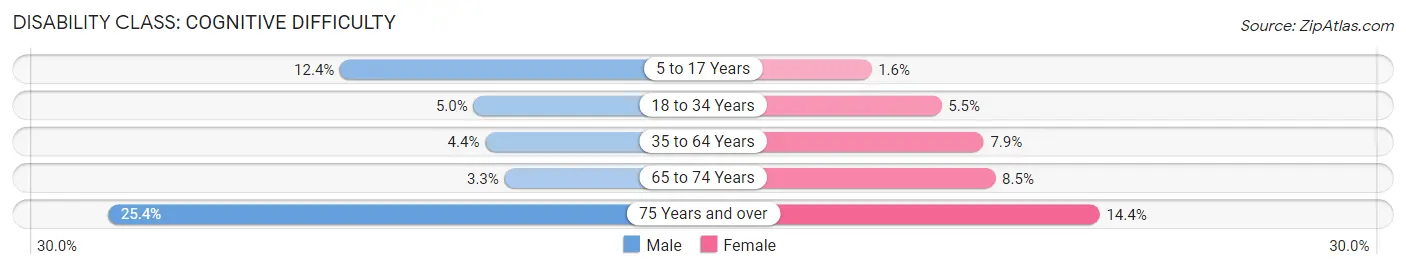
| Age Bracket | Male | Female |
| 5 to 17 Years | 281 (12.4%) | 35 (1.6%) |
| 18 to 34 Years | 188 (5.0%) | 225 (5.5%) |
| 35 to 64 Years | 221 (4.3%) | 471 (7.9%) |
| 65 to 74 Years | 43 (3.3%) | 163 (8.5%) |
| 75 Years and over | 160 (25.4%) | 162 (14.3%) |
Disability Class: Ambulatory Difficulty
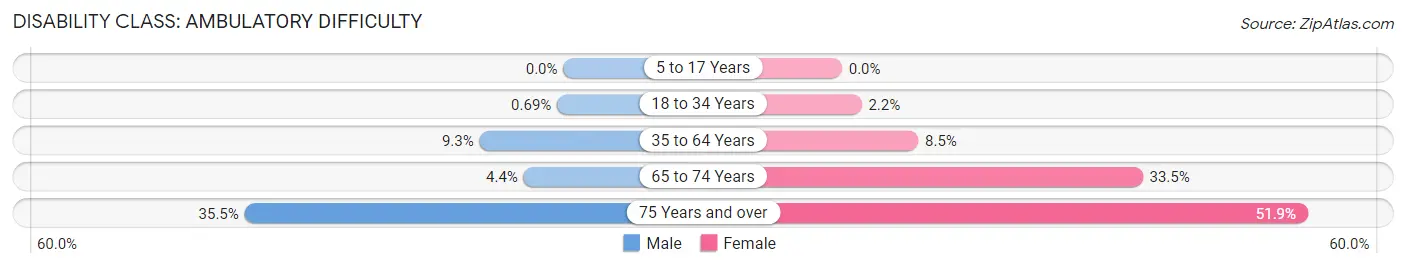
| Age Bracket | Male | Female |
| 5 to 17 Years | 0 (0.0%) | 0 (0.0%) |
| 18 to 34 Years | 26 (0.7%) | 89 (2.2%) |
| 35 to 64 Years | 474 (9.3%) | 507 (8.5%) |
| 65 to 74 Years | 58 (4.4%) | 639 (33.5%) |
| 75 Years and over | 224 (35.5%) | 586 (51.9%) |
Disability Class: Self-Care Difficulty
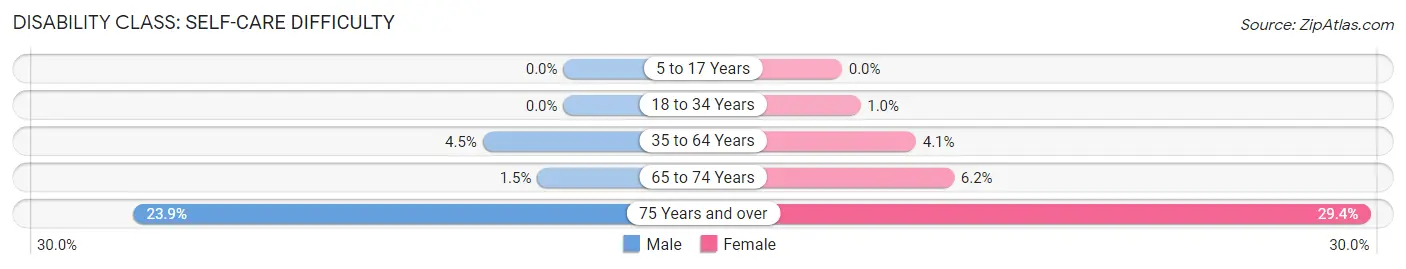
| Age Bracket | Male | Female |
| 5 to 17 Years | 0 (0.0%) | 0 (0.0%) |
| 18 to 34 Years | 0 (0.0%) | 42 (1.0%) |
| 35 to 64 Years | 228 (4.5%) | 246 (4.1%) |
| 65 to 74 Years | 19 (1.5%) | 119 (6.2%) |
| 75 Years and over | 151 (23.9%) | 332 (29.4%) |
Technology Access in Oak Park
Computing Device Access in Oak Park
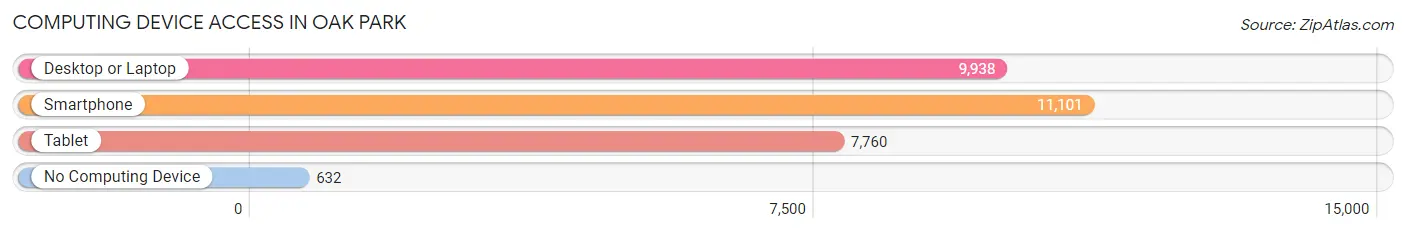
| Device Type | # Households | % Households |
| Desktop or Laptop | 9,938 | 79.9% |
| Smartphone | 11,101 | 89.3% |
| Tablet | 7,760 | 62.4% |
| No Computing Device | 632 | 5.1% |
| Total | 12,432 | 100.0% |
Internet Access in Oak Park
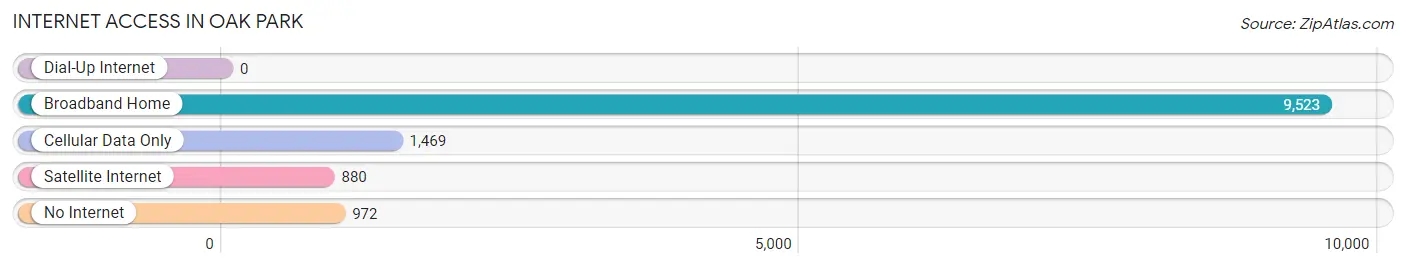
| Internet Type | # Households | % Households |
| Dial-Up Internet | 0 | 0.0% |
| Broadband Home | 9,523 | 76.6% |
| Cellular Data Only | 1,469 | 11.8% |
| Satellite Internet | 880 | 7.1% |
| No Internet | 972 | 7.8% |
| Total | 12,432 | 100.0% |
Oak Park Summary
Oak Park is a city located in Oakland County, Michigan, United States. It is a suburb of Detroit and is part of the Metro Detroit area. As of the 2010 census, the city had a population of 29,319.
History
Oak Park was first settled in 1834 by a group of settlers from New York. The area was originally known as Oak Ridge, and was later renamed Oak Park in 1867. The city was incorporated in 1927.
Oak Park was originally a farming community, but in the early 20th century, it began to develop into a residential suburb of Detroit. The city experienced a population boom in the 1950s and 1960s, as many people moved to the area from Detroit.
Geography
Oak Park is located in southeastern Michigan, about 10 miles (16 km) north of Detroit. It is bordered by the cities of Southfield to the north, Royal Oak to the east, and Ferndale to the south. The city covers an area of 4.2 square miles (10.9 km2).
The city is situated on the Rouge River, which flows through the city from north to south. The city is also home to several parks, including Oak Park Community Park, which features a playground, picnic area, and walking trails.
Economy
Oak Park’s economy is largely based on the service industry. The city is home to several large employers, including Beaumont Health, which is the largest employer in the city. Other major employers include the City of Oak Park, Oakland County, and the Oak Park Public Schools.
The city also has a vibrant retail sector, with several shopping centers and malls located in the city. The largest shopping center in the city is the Oak Park Shopping Center, which features over 100 stores and restaurants.
Demographics
As of the 2010 census, there were 29,319 people, 11,845 households, and 7,717 families living in the city. The population density was 6,976.3 people per square mile (2,689.2/km2). The racial makeup of the city was 68.2% White, 24.3% African American, 0.4% Native American, 2.3% Asian, 0.1% Pacific Islander, 1.7% from other races, and 2.9% from two or more races. Hispanic or Latino of any race were 4.7% of the population.
The median income for a household in the city was $45,945, and the median income for a family was $54,945. The per capita income for the city was $22,945. About 11.2% of families and 14.2% of the population were below the poverty line, including 20.2% of those under age 18 and 8.2% of those age 65 or over.
Common Questions
What is Per Capita Income in Oak Park?
Per Capita income in Oak Park is $34,974.
What is the Median Family Income in Oak Park?
Median Family Income in Oak Park is $72,666.
What is the Median Household income in Oak Park?
Median Household Income in Oak Park is $61,991.
What is Income or Wage Gap in Oak Park?
Income or Wage Gap in Oak Park is 8.0%.
Women in Oak Park earn 92.0 cents for every dollar earned by a man.
What is Family Income Deficit in Oak Park?
Family Income Deficit in Oak Park is $9,776.
Families that are below poverty line in Oak Park earn $9,776 less on average than the poverty threshold level.
What is Inequality or Gini Index in Oak Park?
Inequality or Gini Index in Oak Park is 0.43.
What is the Total Population of Oak Park?
Total Population of Oak Park is 29,495.
What is the Total Male Population of Oak Park?
Total Male Population of Oak Park is 13,716.
What is the Total Female Population of Oak Park?
Total Female Population of Oak Park is 15,779.
What is the Ratio of Males per 100 Females in Oak Park?
There are 86.93 Males per 100 Females in Oak Park.
What is the Ratio of Females per 100 Males in Oak Park?
There are 115.04 Females per 100 Males in Oak Park.
What is the Median Population Age in Oak Park?
Median Population Age in Oak Park is 37.9 Years.
What is the Average Family Size in Oak Park
Average Family Size in Oak Park is 3.1 People.
What is the Average Household Size in Oak Park
Average Household Size in Oak Park is 2.4 People.
How Large is the Labor Force in Oak Park?
There are 16,596 People in the Labor Forcein in Oak Park.
What is the Percentage of People in the Labor Force in Oak Park?
67.3% of People are in the Labor Force in Oak Park.
What is the Unemployment Rate in Oak Park?
Unemployment Rate in Oak Park is 9.9%.