Comstock Northwest, MI Map & Demographics
Comstock Northwest Map
Comstock Northwest Overview
$41,348
PER CAPITA INCOME
$88,691
AVG FAMILY INCOME
$70,723
AVG HOUSEHOLD INCOME
28.0%
WAGE / INCOME GAP [ % ]
72.0¢/ $1
WAGE / INCOME GAP [ $ ]
0.37
INEQUALITY / GINI INDEX
5,131
TOTAL POPULATION
2,506
MALE POPULATION
2,625
FEMALE POPULATION
95.47
MALES / 100 FEMALES
104.75
FEMALES / 100 MALES
38.2
MEDIAN AGE
2.9
AVG FAMILY SIZE
2.0
AVG HOUSEHOLD SIZE
3,065
LABOR FORCE [ PEOPLE ]
69.6%
PERCENT IN LABOR FORCE
3.0%
UNEMPLOYMENT RATE
Income in Comstock Northwest
Income Overview in Comstock Northwest
Per Capita Income in Comstock Northwest is $41,348, while median incomes of families and households are $88,691 and $70,723 respectively.
| Characteristic | Number | Measure |
| Per Capita Income | 5,131 | $41,348 |
| Median Family Income | 1,001 | $88,691 |
| Mean Family Income | 1,001 | $92,916 |
| Median Household Income | 2,612 | $70,723 |
| Mean Household Income | 2,612 | $81,484 |
| Income Deficit | 1,001 | $0 |
| Wage / Income Gap (%) | 5,131 | 27.98% |
| Wage / Income Gap ($) | 5,131 | 72.02¢ per $1 |
| Gini / Inequality Index | 5,131 | 0.37 |
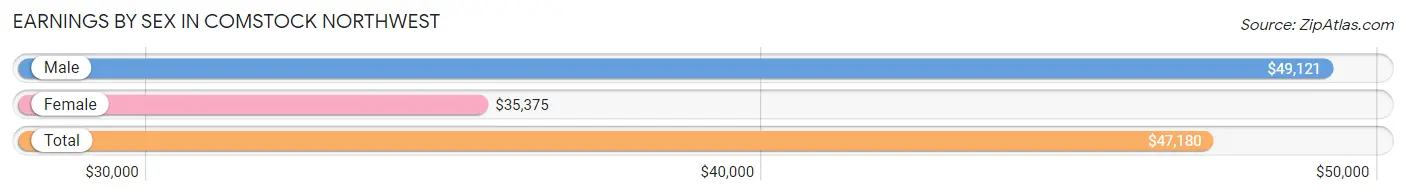
Earnings by Sex in Comstock Northwest
Average Earnings in Comstock Northwest are $47,180, $49,121 for men and $35,375 for women, a difference of 28.0%.
| Sex | Number | Average Earnings |
| Male | 1,790 (55.8%) | $49,121 |
| Female | 1,416 (44.2%) | $35,375 |
| Total | 3,206 (100.0%) | $47,180 |
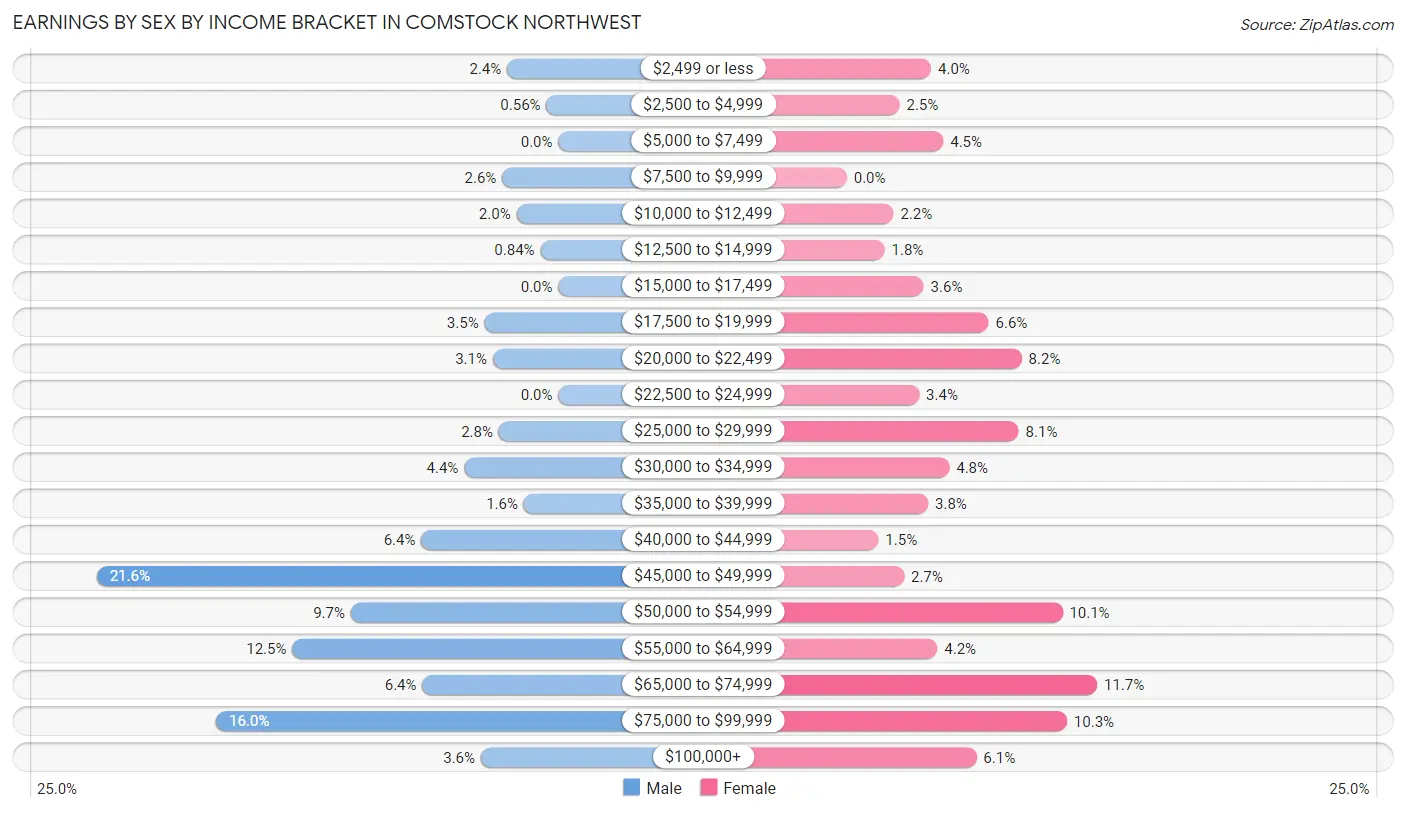
Earnings by Sex by Income Bracket in Comstock Northwest
The most common earnings brackets in Comstock Northwest are $45,000 to $49,999 for men (387 | 21.6%) and $65,000 to $74,999 for women (166 | 11.7%).
| Income | Male | Female |
| $2,499 or less | 43 (2.4%) | 56 (4.0%) |
| $2,500 to $4,999 | 10 (0.6%) | 35 (2.5%) |
| $5,000 to $7,499 | 0 (0.0%) | 64 (4.5%) |
| $7,500 to $9,999 | 47 (2.6%) | 0 (0.0%) |
| $10,000 to $12,499 | 35 (2.0%) | 31 (2.2%) |
| $12,500 to $14,999 | 15 (0.8%) | 25 (1.8%) |
| $15,000 to $17,499 | 0 (0.0%) | 51 (3.6%) |
| $17,500 to $19,999 | 62 (3.5%) | 94 (6.6%) |
| $20,000 to $22,499 | 55 (3.1%) | 116 (8.2%) |
| $22,500 to $24,999 | 0 (0.0%) | 48 (3.4%) |
| $25,000 to $29,999 | 50 (2.8%) | 114 (8.1%) |
| $30,000 to $34,999 | 79 (4.4%) | 68 (4.8%) |
| $35,000 to $39,999 | 29 (1.6%) | 54 (3.8%) |
| $40,000 to $44,999 | 115 (6.4%) | 21 (1.5%) |
| $45,000 to $49,999 | 387 (21.6%) | 38 (2.7%) |
| $50,000 to $54,999 | 174 (9.7%) | 143 (10.1%) |
| $55,000 to $64,999 | 223 (12.5%) | 60 (4.2%) |
| $65,000 to $74,999 | 114 (6.4%) | 166 (11.7%) |
| $75,000 to $99,999 | 287 (16.0%) | 146 (10.3%) |
| $100,000+ | 65 (3.6%) | 86 (6.1%) |
| Total | 1,790 (100.0%) | 1,416 (100.0%) |
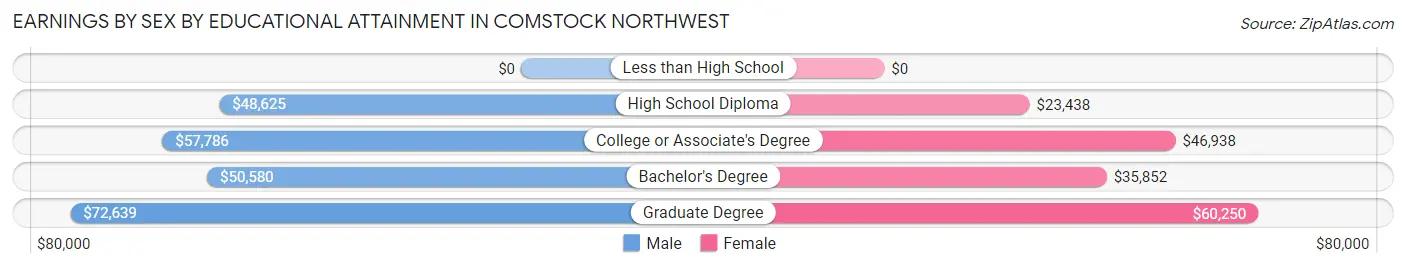
Earnings by Sex by Educational Attainment in Comstock Northwest
Average earnings in Comstock Northwest are $51,931 for men and $36,761 for women, a difference of 29.2%. Men with an educational attainment of graduate degree enjoy the highest average annual earnings of $72,639, while those with high school diploma education earn the least with $48,625. Women with an educational attainment of graduate degree earn the most with the average annual earnings of $60,250, while those with high school diploma education have the smallest earnings of $23,438.
| Educational Attainment | Male Income | Female Income |
| Less than High School | - | - |
| High School Diploma | $48,625 | $23,438 |
| College or Associate's Degree | $57,786 | $46,938 |
| Bachelor's Degree | $50,580 | $35,852 |
| Graduate Degree | $72,639 | $60,250 |
| Total | $51,931 | $36,761 |
Family Income in Comstock Northwest
Family Income Brackets in Comstock Northwest
According to the Comstock Northwest family income data, there are 228 families falling into the $75,000 to $99,999 income range, which is the most common income bracket and makes up 22.8% of all families.
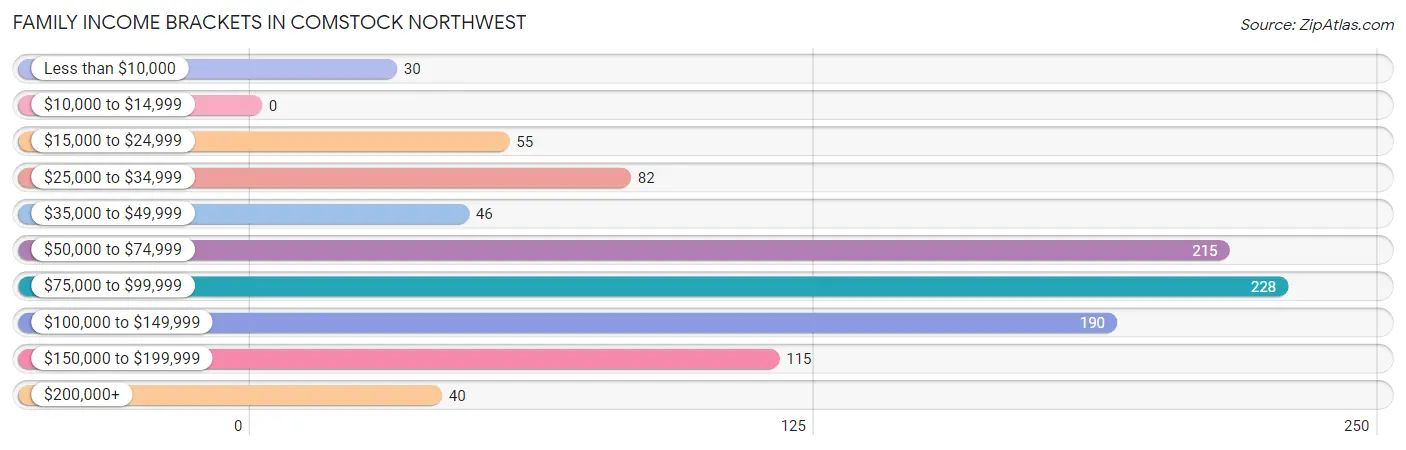
| Income Bracket | # Families | % Families |
| Less than $10,000 | 30 | 3.0% |
| $10,000 to $14,999 | 0 | 0.0% |
| $15,000 to $24,999 | 55 | 5.5% |
| $25,000 to $34,999 | 82 | 8.2% |
| $35,000 to $49,999 | 46 | 4.6% |
| $50,000 to $74,999 | 215 | 21.5% |
| $75,000 to $99,999 | 228 | 22.8% |
| $100,000 to $149,999 | 190 | 19.0% |
| $150,000 to $199,999 | 115 | 11.5% |
| $200,000+ | 40 | 4.0% |
Family Income by Famaliy Size in Comstock Northwest
4-person families (87 | 8.7%) account for the highest median family income in Comstock Northwest with $158,403 per family, while 4-person families (87 | 8.7%) have the highest median income of $39,601 per family member.
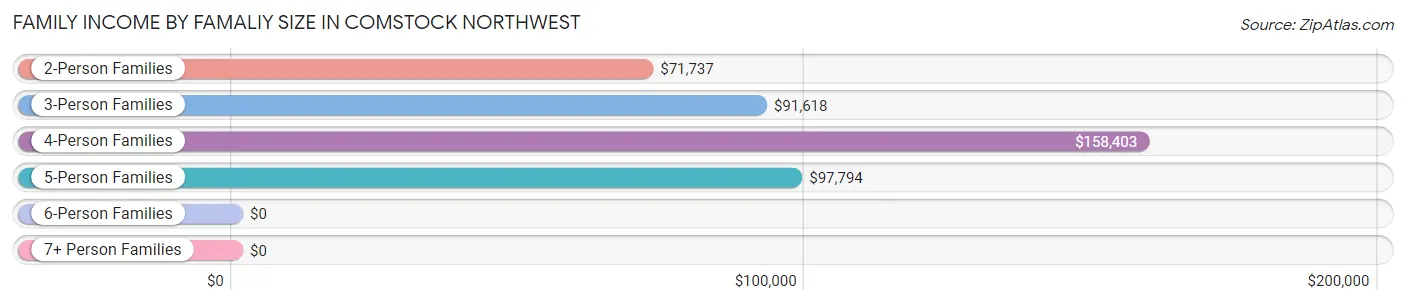
| Income Bracket | # Families | Median Income |
| 2-Person Families | 574 (57.3%) | $71,737 |
| 3-Person Families | 202 (20.2%) | $91,618 |
| 4-Person Families | 87 (8.7%) | $158,403 |
| 5-Person Families | 126 (12.6%) | $97,794 |
| 6-Person Families | 0 (0.0%) | $0 |
| 7+ Person Families | 12 (1.2%) | $0 |
| Total | 1,001 (100.0%) | $88,691 |
Family Income by Number of Earners in Comstock Northwest
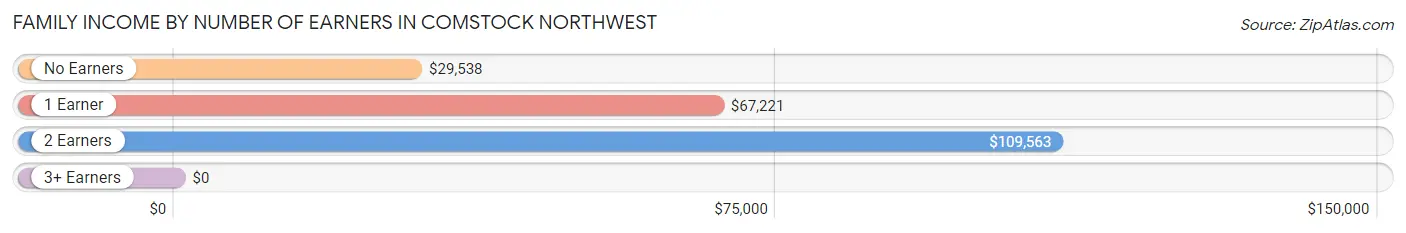
| Number of Earners | # Families | Median Income |
| No Earners | 183 (18.3%) | $29,538 |
| 1 Earner | 273 (27.3%) | $67,221 |
| 2 Earners | 395 (39.5%) | $109,563 |
| 3+ Earners | 150 (15.0%) | $0 |
| Total | 1,001 (100.0%) | $88,691 |
Household Income in Comstock Northwest
Household Income Brackets in Comstock Northwest
With 598 households falling in the category, the $75,000 to $99,999 income range is the most frequent in Comstock Northwest, accounting for 22.9% of all households. In contrast, only 50 households (1.9%) fall into the less than $10,000 income bracket, making it the least populous group.
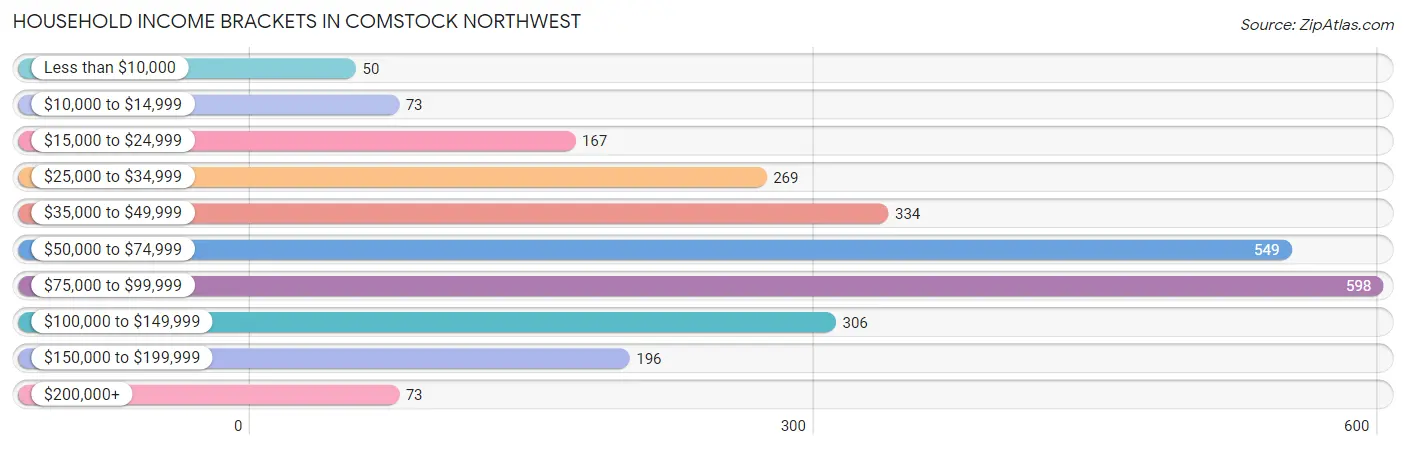
| Income Bracket | # Households | % Households |
| Less than $10,000 | 50 | 1.9% |
| $10,000 to $14,999 | 73 | 2.8% |
| $15,000 to $24,999 | 167 | 6.4% |
| $25,000 to $34,999 | 269 | 10.3% |
| $35,000 to $49,999 | 334 | 12.8% |
| $50,000 to $74,999 | 549 | 21.0% |
| $75,000 to $99,999 | 598 | 22.9% |
| $100,000 to $149,999 | 306 | 11.7% |
| $150,000 to $199,999 | 196 | 7.5% |
| $200,000+ | 73 | 2.8% |
Household Income by Householder Age in Comstock Northwest
The median household income in Comstock Northwest is $70,723, with the highest median household income of $95,994 found in the 15 to 24 years age bracket for the primary householder. A total of 272 households (10.4%) fall into this category. Meanwhile, the 65+ years age bracket for the primary householder has the lowest median household income of $39,215, with 723 households (27.7%) in this group.
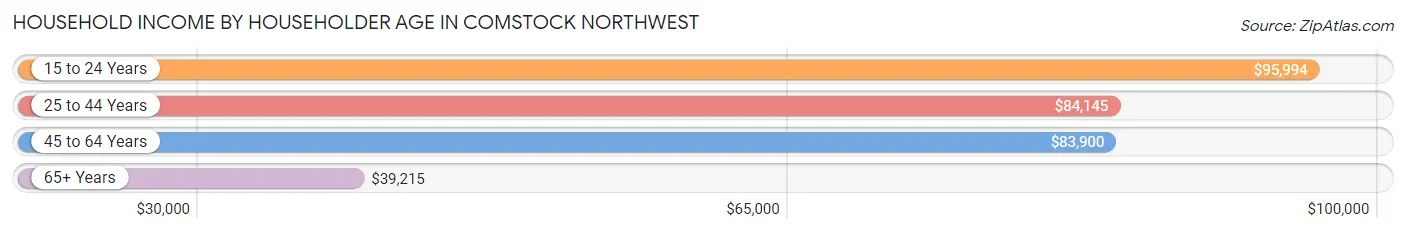
| Income Bracket | # Households | Median Income |
| 15 to 24 Years | 272 (10.4%) | $95,994 |
| 25 to 44 Years | 867 (33.2%) | $84,145 |
| 45 to 64 Years | 750 (28.7%) | $83,900 |
| 65+ Years | 723 (27.7%) | $39,215 |
| Total | 2,612 (100.0%) | $70,723 |
Poverty in Comstock Northwest
Income Below Poverty by Sex and Age in Comstock Northwest
With 2.9% poverty level for males and 6.7% for females among the residents of Comstock Northwest, 16 and 17 year old males and 15 year old females are the most vulnerable to poverty, with 15 males (100.0%) and 13 females (38.2%) in their respective age groups living below the poverty level.
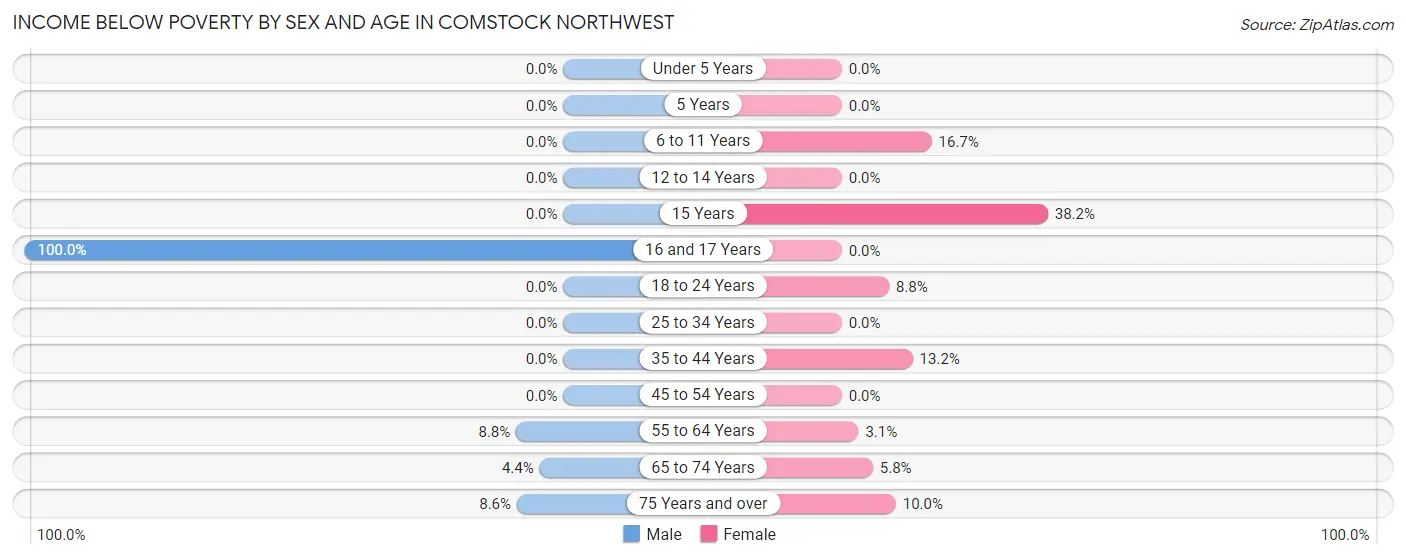
| Age Bracket | Male | Female |
| Under 5 Years | 0 (0.0%) | 0 (0.0%) |
| 5 Years | 0 (0.0%) | 0 (0.0%) |
| 6 to 11 Years | 0 (0.0%) | 29 (16.7%) |
| 12 to 14 Years | 0 (0.0%) | 0 (0.0%) |
| 15 Years | 0 (0.0%) | 13 (38.2%) |
| 16 and 17 Years | 15 (100.0%) | 0 (0.0%) |
| 18 to 24 Years | 0 (0.0%) | 25 (8.8%) |
| 25 to 34 Years | 0 (0.0%) | 0 (0.0%) |
| 35 to 44 Years | 0 (0.0%) | 43 (13.2%) |
| 45 to 54 Years | 0 (0.0%) | 0 (0.0%) |
| 55 to 64 Years | 35 (8.8%) | 14 (3.1%) |
| 65 to 74 Years | 10 (4.4%) | 22 (5.8%) |
| 75 Years and over | 12 (8.6%) | 31 (10.0%) |
| Total | 72 (2.9%) | 177 (6.7%) |
Income Above Poverty by Sex and Age in Comstock Northwest
According to the poverty statistics in Comstock Northwest, males aged under 5 years and females aged under 5 years are the age groups that are most secure financially, with 100.0% of males and 100.0% of females in these age groups living above the poverty line.
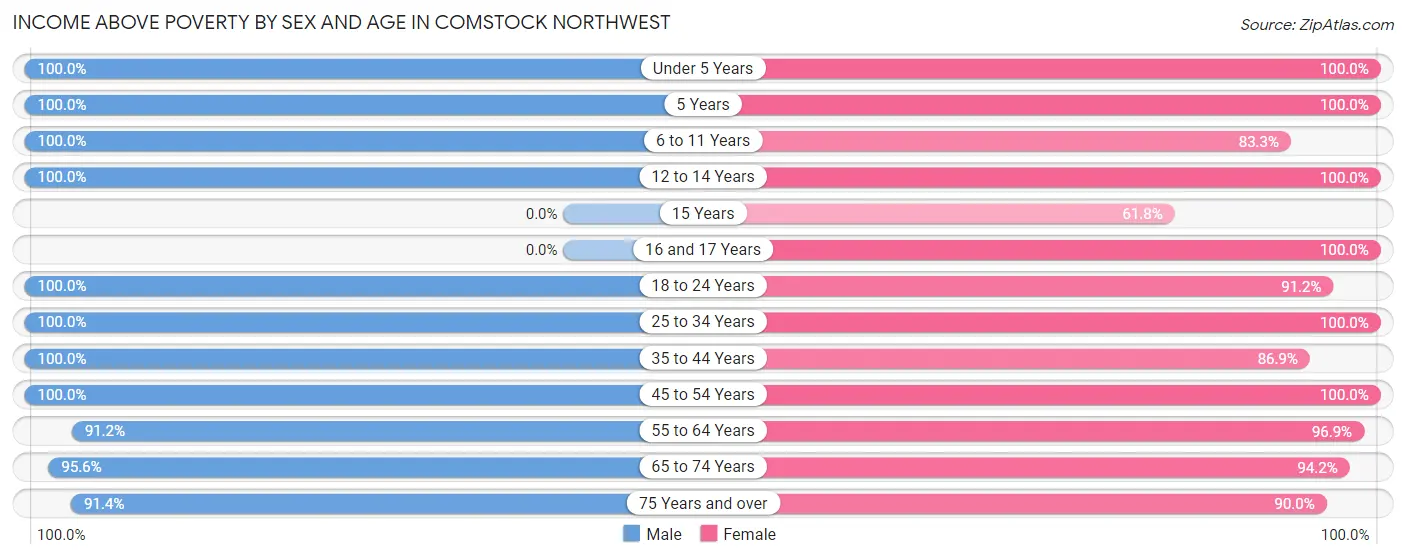
| Age Bracket | Male | Female |
| Under 5 Years | 173 (100.0%) | 94 (100.0%) |
| 5 Years | 30 (100.0%) | 39 (100.0%) |
| 6 to 11 Years | 70 (100.0%) | 145 (83.3%) |
| 12 to 14 Years | 18 (100.0%) | 95 (100.0%) |
| 15 Years | 0 (0.0%) | 21 (61.8%) |
| 16 and 17 Years | 0 (0.0%) | 16 (100.0%) |
| 18 to 24 Years | 254 (100.0%) | 260 (91.2%) |
| 25 to 34 Years | 594 (100.0%) | 320 (100.0%) |
| 35 to 44 Years | 446 (100.0%) | 284 (86.9%) |
| 45 to 54 Years | 142 (100.0%) | 97 (100.0%) |
| 55 to 64 Years | 364 (91.2%) | 439 (96.9%) |
| 65 to 74 Years | 216 (95.6%) | 360 (94.2%) |
| 75 Years and over | 127 (91.4%) | 278 (90.0%) |
| Total | 2,434 (97.1%) | 2,448 (93.3%) |
Income Below Poverty Among Married-Couple Families in Comstock Northwest
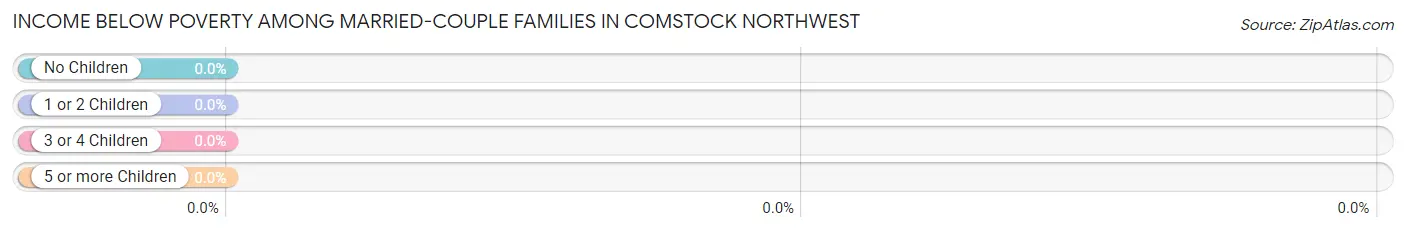
| Children | Above Poverty | Below Poverty |
| No Children | 484 (100.0%) | 0 (0.0%) |
| 1 or 2 Children | 176 (100.0%) | 0 (0.0%) |
| 3 or 4 Children | 90 (100.0%) | 0 (0.0%) |
| 5 or more Children | 0 (0.0%) | 0 (0.0%) |
| Total | 750 (100.0%) | 0 (0.0%) |
Income Below Poverty Among Single-Parent Households in Comstock Northwest
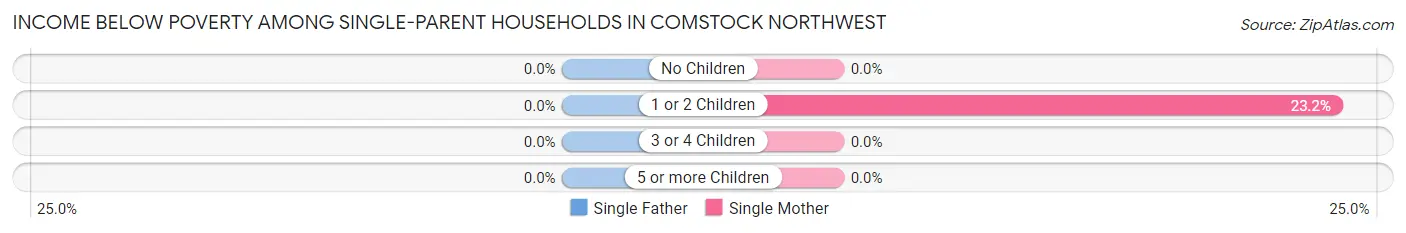
| Children | Single Father | Single Mother |
| No Children | 0 (0.0%) | 0 (0.0%) |
| 1 or 2 Children | 0 (0.0%) | 43 (23.2%) |
| 3 or 4 Children | 0 (0.0%) | 0 (0.0%) |
| 5 or more Children | 0 (0.0%) | 0 (0.0%) |
| Total | 0 (0.0%) | 43 (18.3%) |
Income Below Poverty Among Married-Couple vs Single-Parent Households in Comstock Northwest
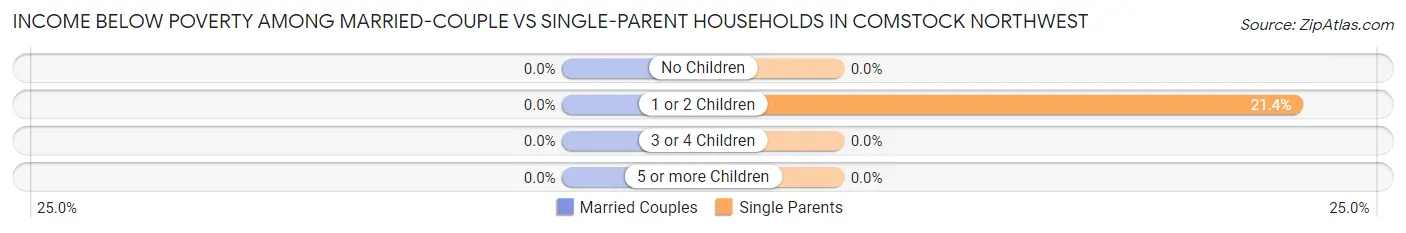
| Children | Married-Couple Families | Single-Parent Households |
| No Children | 0 (0.0%) | 0 (0.0%) |
| 1 or 2 Children | 0 (0.0%) | 43 (21.4%) |
| 3 or 4 Children | 0 (0.0%) | 0 (0.0%) |
| 5 or more Children | 0 (0.0%) | 0 (0.0%) |
| Total | 0 (0.0%) | 43 (17.1%) |
Race in Comstock Northwest
The most populous races in Comstock Northwest are White / Caucasian (3,823 | 74.5%), Black / African American (917 | 17.9%), and Asian (186 | 3.6%).
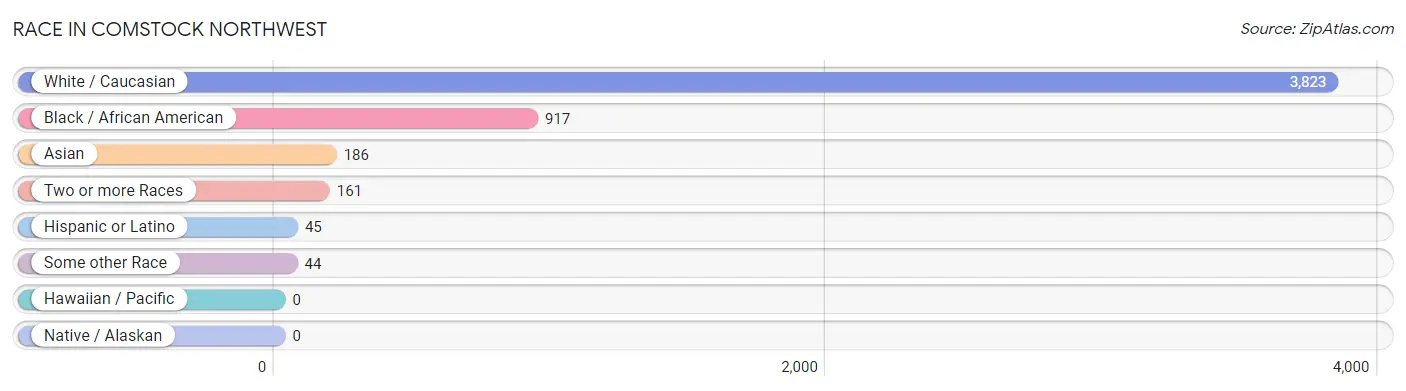
| Race | # Population | % Population |
| Asian | 186 | 3.6% |
| Black / African American | 917 | 17.9% |
| Hawaiian / Pacific | 0 | 0.0% |
| Hispanic or Latino | 45 | 0.9% |
| Native / Alaskan | 0 | 0.0% |
| White / Caucasian | 3,823 | 74.5% |
| Two or more Races | 161 | 3.1% |
| Some other Race | 44 | 0.9% |
| Total | 5,131 | 100.0% |
Ancestry in Comstock Northwest
The most populous ancestries reported in Comstock Northwest are German (962 | 18.8%), English (673 | 13.1%), Polish (563 | 11.0%), Irish (488 | 9.5%), and Dutch (316 | 6.2%), together accounting for 58.5% of all Comstock Northwest residents.
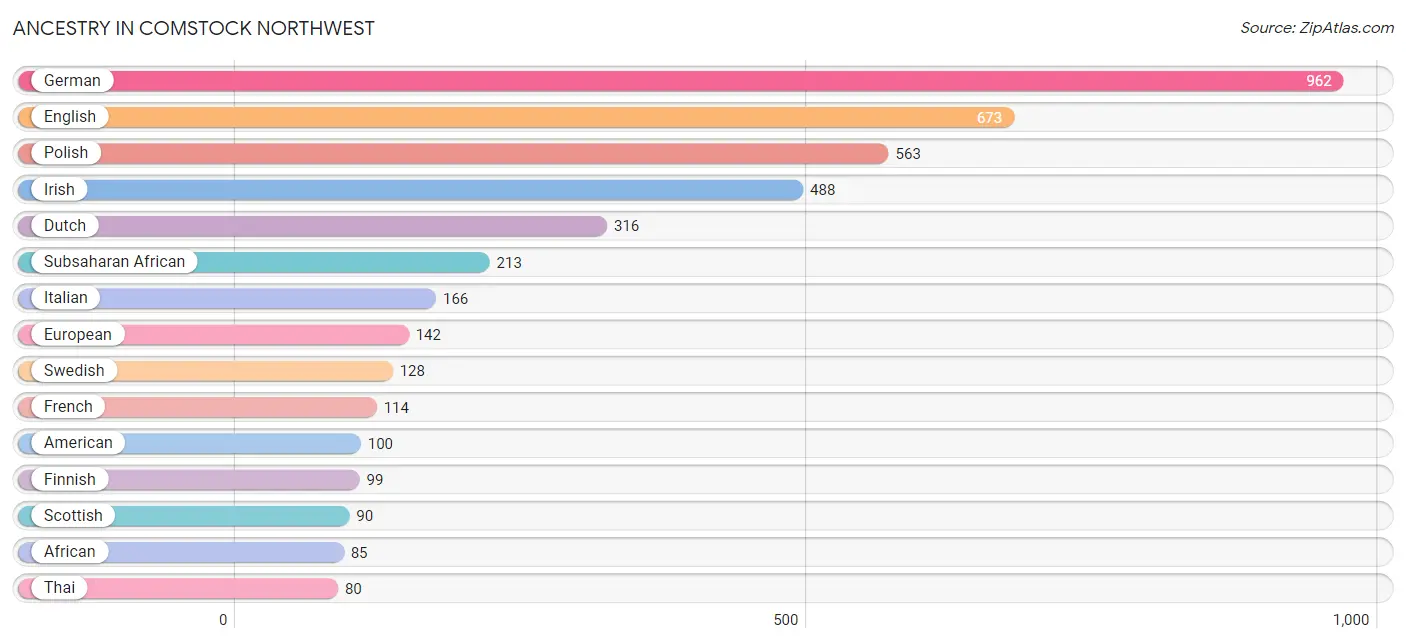
| Ancestry | # Population | % Population |
| African | 85 | 1.7% |
| American | 100 | 1.9% |
| Arab | 17 | 0.3% |
| Croatian | 12 | 0.2% |
| Czech | 33 | 0.6% |
| Danish | 23 | 0.4% |
| Dominican | 9 | 0.2% |
| Dutch | 316 | 6.2% |
| English | 673 | 13.1% |
| European | 142 | 2.8% |
| Finnish | 99 | 1.9% |
| French | 114 | 2.2% |
| French American Indian | 9 | 0.2% |
| French Canadian | 12 | 0.2% |
| German | 962 | 18.8% |
| Greek | 53 | 1.0% |
| Hungarian | 7 | 0.1% |
| Irish | 488 | 9.5% |
| Italian | 166 | 3.2% |
| Lebanese | 17 | 0.3% |
| Mexican | 36 | 0.7% |
| Mexican American Indian | 3 | 0.1% |
| Nigerian | 61 | 1.2% |
| Norwegian | 14 | 0.3% |
| Polish | 563 | 11.0% |
| Portuguese | 70 | 1.4% |
| Scandinavian | 58 | 1.1% |
| Scotch-Irish | 33 | 0.6% |
| Scottish | 90 | 1.8% |
| Sri Lankan | 61 | 1.2% |
| Subsaharan African | 213 | 4.2% |
| Swedish | 128 | 2.5% |
| Thai | 80 | 1.6% | View All 33 Rows |
Immigrants in Comstock Northwest
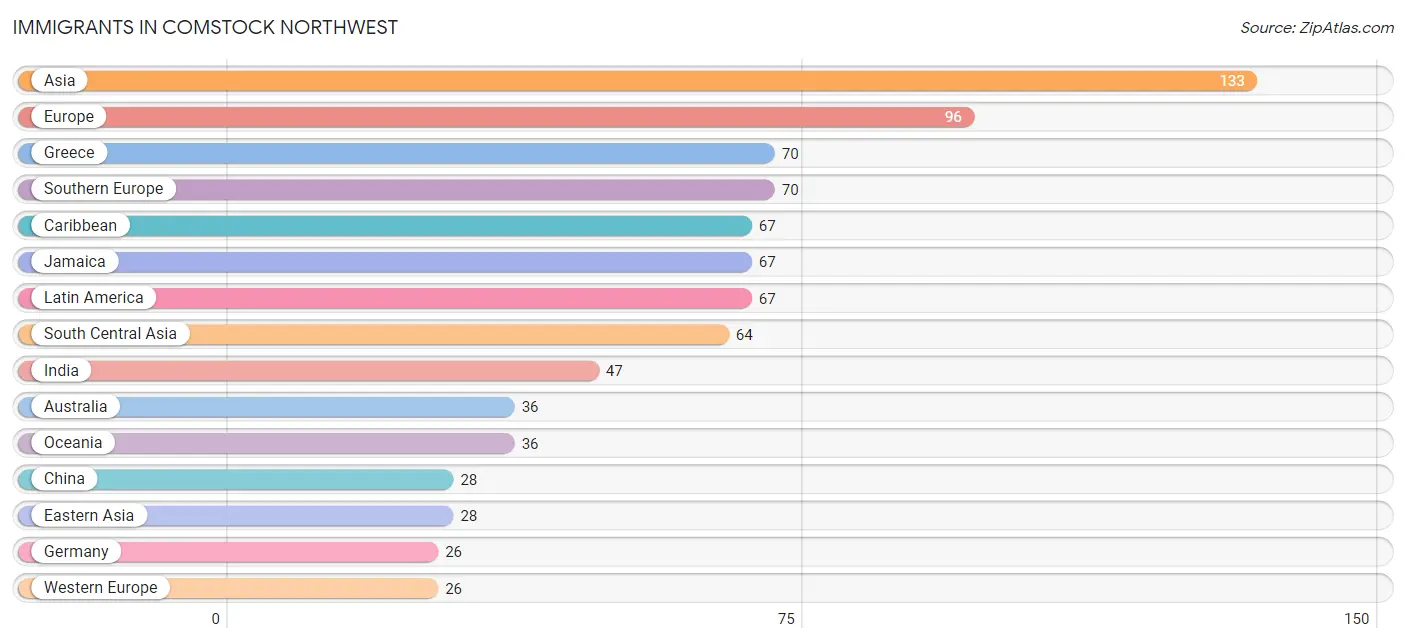
The most numerous immigrant groups reported in Comstock Northwest came from Asia (133 | 2.6%), Europe (96 | 1.9%), Greece (70 | 1.4%), Southern Europe (70 | 1.4%), and Caribbean (67 | 1.3%), together accounting for 8.5% of all Comstock Northwest residents.
| Immigration Origin | # Population | % Population |
| Asia | 133 | 2.6% |
| Australia | 36 | 0.7% |
| Caribbean | 67 | 1.3% |
| China | 28 | 0.5% |
| Eastern Asia | 28 | 0.5% |
| Europe | 96 | 1.9% |
| Germany | 26 | 0.5% |
| Greece | 70 | 1.4% |
| India | 47 | 0.9% |
| Jamaica | 67 | 1.3% |
| Latin America | 67 | 1.3% |
| Lebanon | 17 | 0.3% |
| Oceania | 36 | 0.7% |
| Pakistan | 17 | 0.3% |
| South Central Asia | 64 | 1.3% |
| South Eastern Asia | 24 | 0.5% |
| Southern Europe | 70 | 1.4% |
| Vietnam | 24 | 0.5% |
| Western Asia | 17 | 0.3% |
| Western Europe | 26 | 0.5% | View All 20 Rows |
Sex and Age in Comstock Northwest
Sex and Age in Comstock Northwest
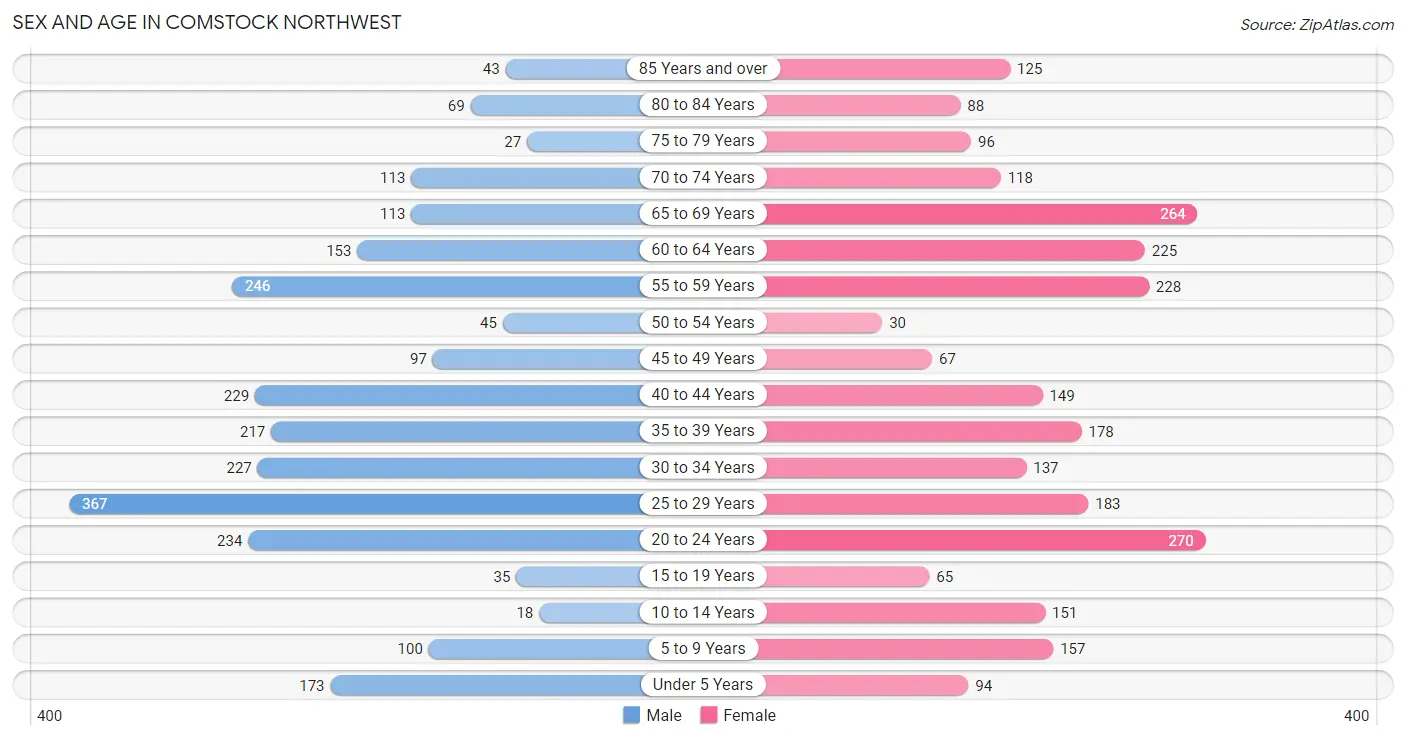
The most populous age groups in Comstock Northwest are 25 to 29 Years (367 | 14.6%) for men and 20 to 24 Years (270 | 10.3%) for women.
| Age Bracket | Male | Female |
| Under 5 Years | 173 (6.9%) | 94 (3.6%) |
| 5 to 9 Years | 100 (4.0%) | 157 (6.0%) |
| 10 to 14 Years | 18 (0.7%) | 151 (5.8%) |
| 15 to 19 Years | 35 (1.4%) | 65 (2.5%) |
| 20 to 24 Years | 234 (9.3%) | 270 (10.3%) |
| 25 to 29 Years | 367 (14.6%) | 183 (7.0%) |
| 30 to 34 Years | 227 (9.1%) | 137 (5.2%) |
| 35 to 39 Years | 217 (8.7%) | 178 (6.8%) |
| 40 to 44 Years | 229 (9.1%) | 149 (5.7%) |
| 45 to 49 Years | 97 (3.9%) | 67 (2.5%) |
| 50 to 54 Years | 45 (1.8%) | 30 (1.1%) |
| 55 to 59 Years | 246 (9.8%) | 228 (8.7%) |
| 60 to 64 Years | 153 (6.1%) | 225 (8.6%) |
| 65 to 69 Years | 113 (4.5%) | 264 (10.1%) |
| 70 to 74 Years | 113 (4.5%) | 118 (4.5%) |
| 75 to 79 Years | 27 (1.1%) | 96 (3.7%) |
| 80 to 84 Years | 69 (2.8%) | 88 (3.4%) |
| 85 Years and over | 43 (1.7%) | 125 (4.8%) |
| Total | 2,506 (100.0%) | 2,625 (100.0%) |
Families and Households in Comstock Northwest
Median Family Size in Comstock Northwest
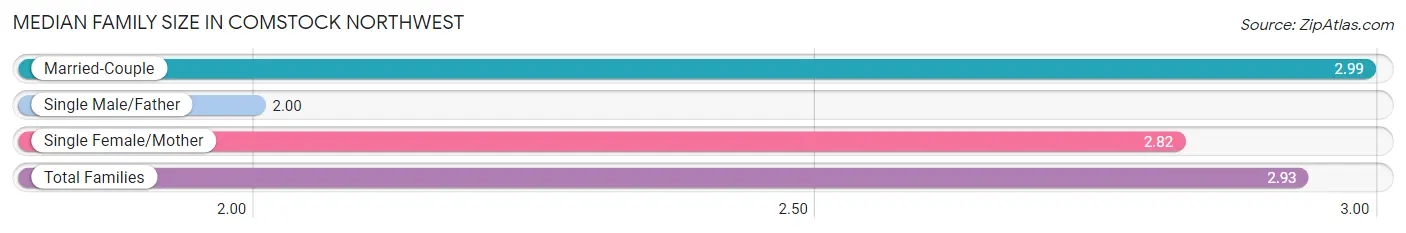
The median family size in Comstock Northwest is 2.93 persons per family, with married-couple families (750 | 74.9%) accounting for the largest median family size of 2.99 persons per family. On the other hand, single male/father families (16 | 1.6%) represent the smallest median family size with 2.00 persons per family.
| Family Type | # Families | Family Size |
| Married-Couple | 750 (74.9%) | 2.99 |
| Single Male/Father | 16 (1.6%) | 2.00 |
| Single Female/Mother | 235 (23.5%) | 2.82 |
| Total Families | 1,001 (100.0%) | 2.93 |
Median Household Size in Comstock Northwest
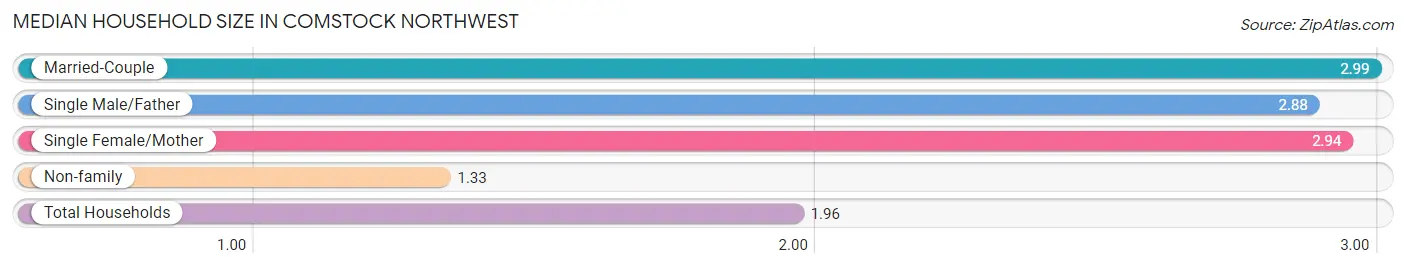
The median household size in Comstock Northwest is 1.96 persons per household, with married-couple households (750 | 28.7%) accounting for the largest median household size of 2.99 persons per household. non-family households (1,611 | 61.7%) represent the smallest median household size with 1.33 persons per household.
| Household Type | # Households | Household Size |
| Married-Couple | 750 (28.7%) | 2.99 |
| Single Male/Father | 16 (0.6%) | 2.88 |
| Single Female/Mother | 235 (9.0%) | 2.94 |
| Non-family | 1,611 (61.7%) | 1.33 |
| Total Households | 2,612 (100.0%) | 1.96 |
Household Size by Marriage Status in Comstock Northwest
Out of a total of 2,612 households in Comstock Northwest, 1,001 (38.3%) are family households, while 1,611 (61.7%) are nonfamily households. The most numerous type of family households are 2-person households, comprising 528, and the most common type of nonfamily households are 1-person households, comprising 1,089.
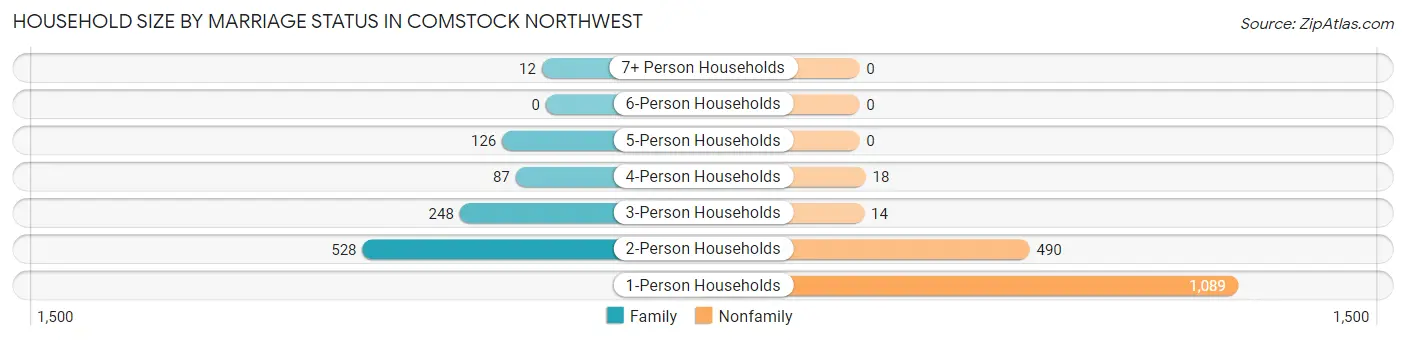
| Household Size | Family Households | Nonfamily Households |
| 1-Person Households | - | 1,089 (41.7%) |
| 2-Person Households | 528 (20.2%) | 490 (18.8%) |
| 3-Person Households | 248 (9.5%) | 14 (0.5%) |
| 4-Person Households | 87 (3.3%) | 18 (0.7%) |
| 5-Person Households | 126 (4.8%) | 0 (0.0%) |
| 6-Person Households | 0 (0.0%) | 0 (0.0%) |
| 7+ Person Households | 12 (0.5%) | 0 (0.0%) |
| Total | 1,001 (38.3%) | 1,611 (61.7%) |
Female Fertility in Comstock Northwest
Fertility by Age in Comstock Northwest
Average fertility rate in Comstock Northwest is 86.0 births per 1,000 women. Women in the age bracket of 20 to 34 years have the highest fertility rate with 127.0 births per 1,000 women. Women in the age bracket of 20 to 34 years acount for 83.3% of all women with births.
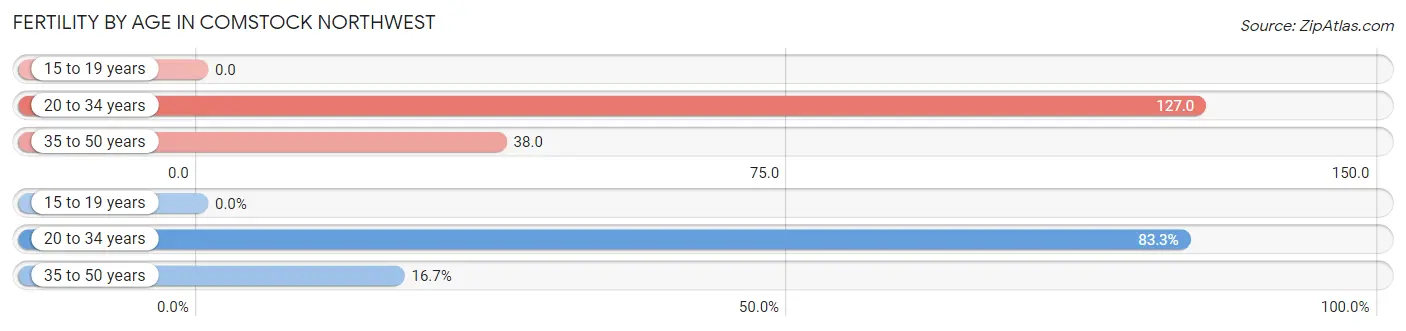
| Age Bracket | Women with Births | Births / 1,000 Women |
| 15 to 19 years | 0 (0.0%) | 0.0 |
| 20 to 34 years | 75 (83.3%) | 127.0 |
| 35 to 50 years | 15 (16.7%) | 38.0 |
| Total | 90 (100.0%) | 86.0 |
Fertility by Age by Marriage Status in Comstock Northwest
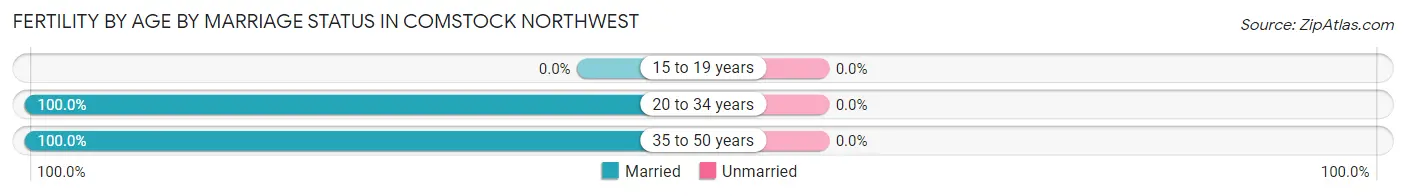
| Age Bracket | Married | Unmarried |
| 15 to 19 years | 0 (0.0%) | 0 (0.0%) |
| 20 to 34 years | 75 (100.0%) | 0 (0.0%) |
| 35 to 50 years | 15 (100.0%) | 0 (0.0%) |
| Total | 90 (100.0%) | 0 (0.0%) |
Fertility by Education in Comstock Northwest
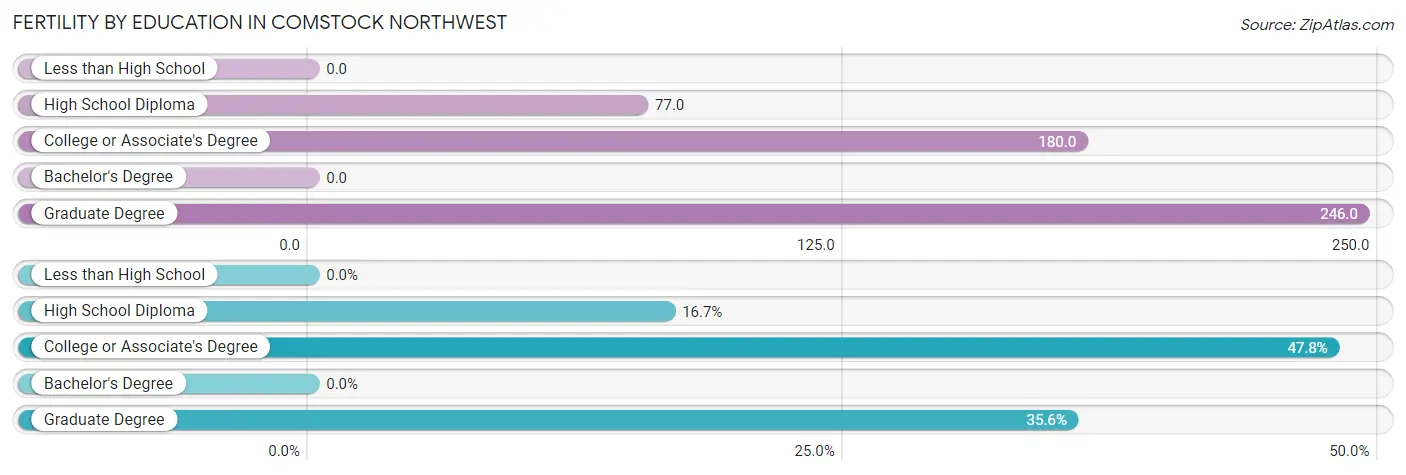
| Educational Attainment | Women with Births | Births / 1,000 Women |
| Less than High School | 0 (0.0%) | 0.0 |
| High School Diploma | 15 (16.7%) | 77.0 |
| College or Associate's Degree | 43 (47.8%) | 180.0 |
| Bachelor's Degree | 0 (0.0%) | 0.0 |
| Graduate Degree | 32 (35.6%) | 246.0 |
| Total | 90 (100.0%) | 86.0 |
Fertility by Education by Marriage Status in Comstock Northwest
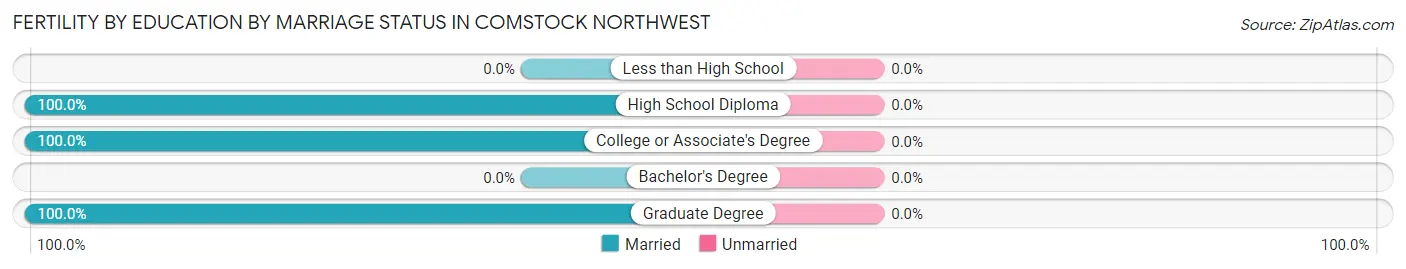
| Educational Attainment | Married | Unmarried |
| Less than High School | 0 (0.0%) | 0 (0.0%) |
| High School Diploma | 15 (100.0%) | 0 (0.0%) |
| College or Associate's Degree | 43 (100.0%) | 0 (0.0%) |
| Bachelor's Degree | 0 (0.0%) | 0 (0.0%) |
| Graduate Degree | 32 (100.0%) | 0 (0.0%) |
| Total | 90 (100.0%) | 0 (0.0%) |
Employment Characteristics in Comstock Northwest
Employment by Class of Employer in Comstock Northwest
Among the 2,890 employed individuals in Comstock Northwest, private company employees (2,112 | 73.1%), not-for-profit organizations (293 | 10.1%), and local government employees (257 | 8.9%) make up the most common classes of employment.
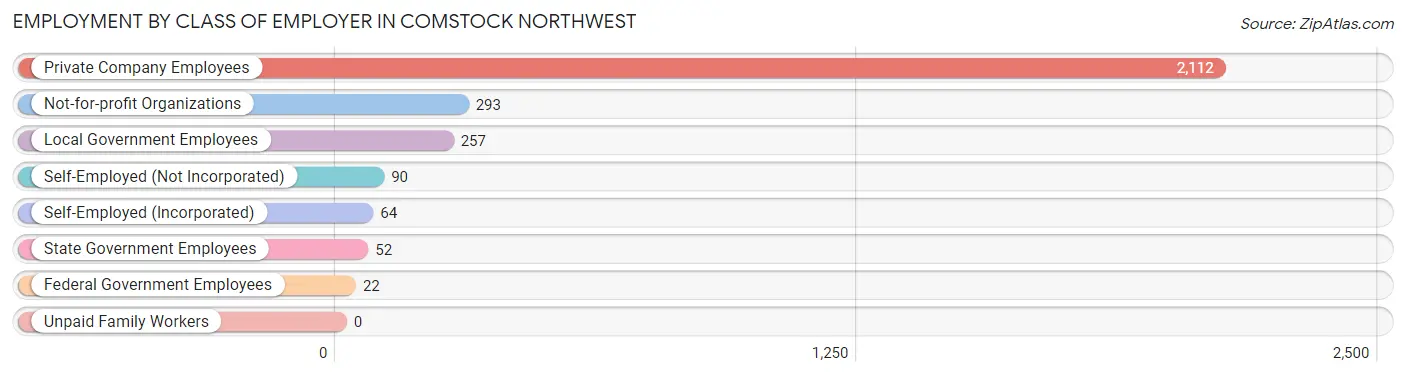
| Employer Class | # Employees | % Employees |
| Private Company Employees | 2,112 | 73.1% |
| Self-Employed (Incorporated) | 64 | 2.2% |
| Self-Employed (Not Incorporated) | 90 | 3.1% |
| Not-for-profit Organizations | 293 | 10.1% |
| Local Government Employees | 257 | 8.9% |
| State Government Employees | 52 | 1.8% |
| Federal Government Employees | 22 | 0.8% |
| Unpaid Family Workers | 0 | 0.0% |
| Total | 2,890 | 100.0% |
Employment Status by Age in Comstock Northwest
According to the labor force statistics for Comstock Northwest, out of the total population over 16 years of age (4,404), 69.6% or 3,065 individuals are in the labor force, with 3.0% or 92 of them unemployed. The age group with the highest labor force participation rate is 30 to 34 years, with 96.2% or 350 individuals in the labor force. Within the labor force, the 16 to 19 years age range has the highest percentage of unemployed individuals, with 31.4% or 16 of them being unemployed.
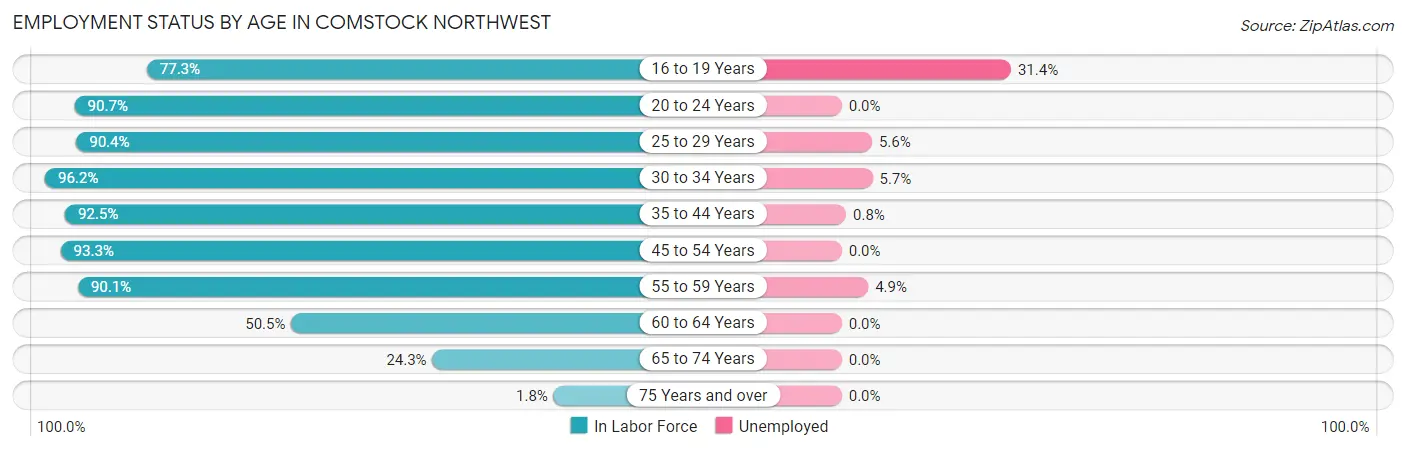
| Age Bracket | In Labor Force | Unemployed |
| 16 to 19 Years | 51 (77.3%) | 16 (31.4%) |
| 20 to 24 Years | 457 (90.7%) | 0 (0.0%) |
| 25 to 29 Years | 497 (90.4%) | 28 (5.6%) |
| 30 to 34 Years | 350 (96.2%) | 20 (5.7%) |
| 35 to 44 Years | 715 (92.5%) | 6 (0.8%) |
| 45 to 54 Years | 223 (93.3%) | 0 (0.0%) |
| 55 to 59 Years | 427 (90.1%) | 21 (4.9%) |
| 60 to 64 Years | 191 (50.5%) | 0 (0.0%) |
| 65 to 74 Years | 148 (24.3%) | 0 (0.0%) |
| 75 Years and over | 8 (1.8%) | 0 (0.0%) |
| Total | 3,065 (69.6%) | 92 (3.0%) |
Employment Status by Educational Attainment in Comstock Northwest
According to labor force statistics for Comstock Northwest, 86.5% of individuals (2,403) out of the total population between 25 and 64 years of age (2,778) are in the labor force, with 3.1% or 74 of them being unemployed. The group with the highest labor force participation rate are those with the educational attainment of bachelor's degree or higher, with 93.0% or 910 individuals in the labor force. Within the labor force, individuals with high school diploma education have the highest percentage of unemployment, with 8.8% or 47 of them being unemployed.
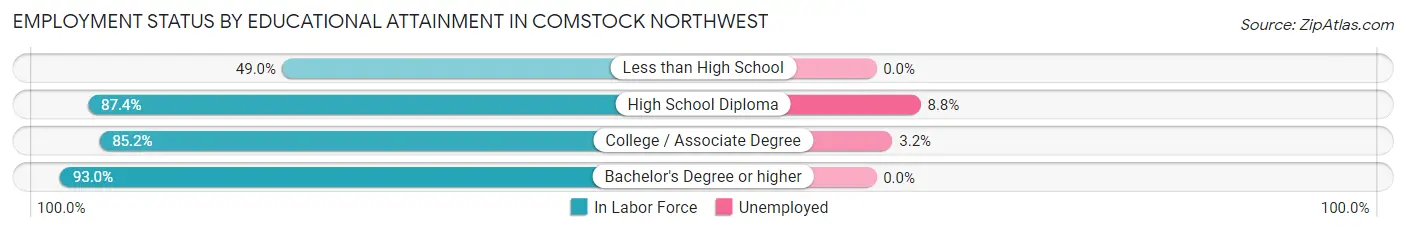
| Educational Attainment | In Labor Force | Unemployed |
| Less than High School | 72 (49.0%) | 0 (0.0%) |
| High School Diploma | 535 (87.4%) | 54 (8.8%) |
| College / Associate Degree | 886 (85.2%) | 33 (3.2%) |
| Bachelor's Degree or higher | 910 (93.0%) | 0 (0.0%) |
| Total | 2,403 (86.5%) | 86 (3.1%) |
Employment Occupations by Sex in Comstock Northwest
Management, Business, Science and Arts Occupations
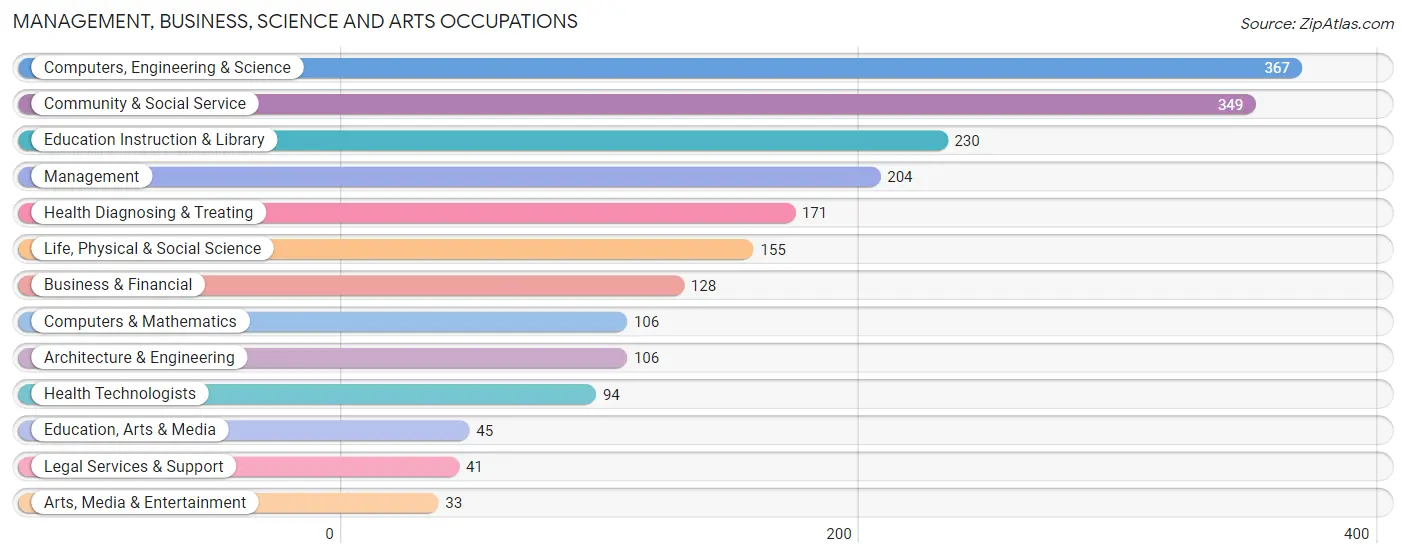
The most common Management, Business, Science and Arts occupations in Comstock Northwest are Computers, Engineering & Science (367 | 12.3%), Community & Social Service (349 | 11.7%), Education Instruction & Library (230 | 7.7%), Management (204 | 6.9%), and Health Diagnosing & Treating (171 | 5.8%).
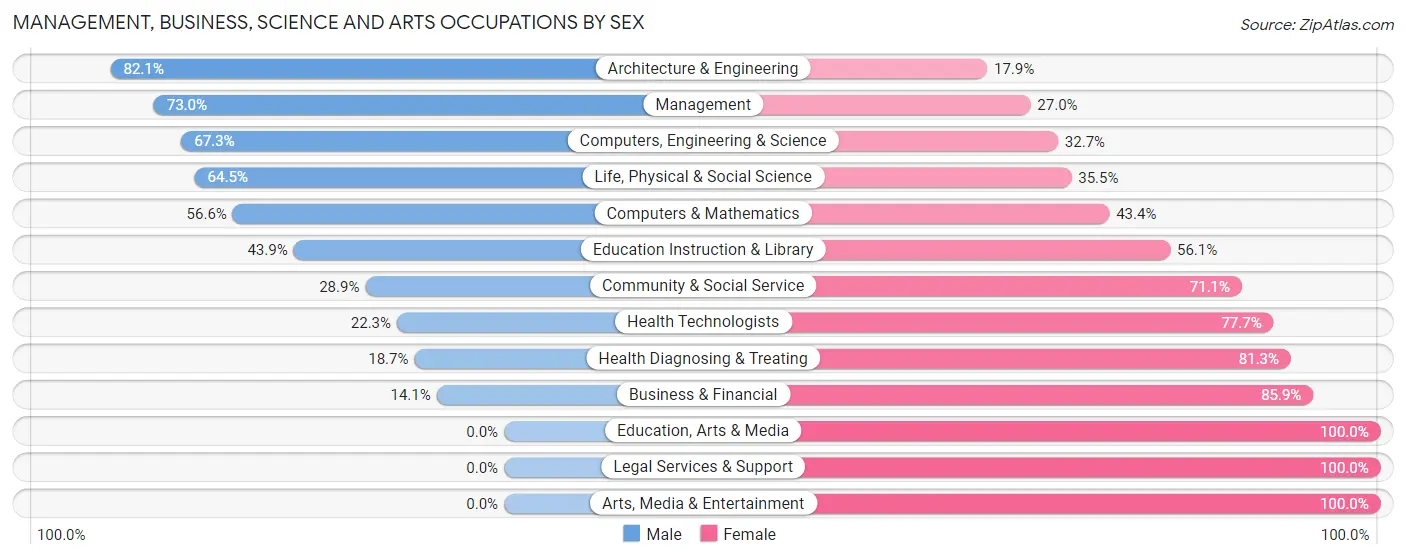
Management, Business, Science and Arts Occupations by Sex
Within the Management, Business, Science and Arts occupations in Comstock Northwest, the most male-oriented occupations are Architecture & Engineering (82.1%), Management (73.0%), and Computers, Engineering & Science (67.3%), while the most female-oriented occupations are Education, Arts & Media (100.0%), Legal Services & Support (100.0%), and Arts, Media & Entertainment (100.0%).
| Occupation | Male | Female |
| Management | 149 (73.0%) | 55 (27.0%) |
| Business & Financial | 18 (14.1%) | 110 (85.9%) |
| Computers, Engineering & Science | 247 (67.3%) | 120 (32.7%) |
| Computers & Mathematics | 60 (56.6%) | 46 (43.4%) |
| Architecture & Engineering | 87 (82.1%) | 19 (17.9%) |
| Life, Physical & Social Science | 100 (64.5%) | 55 (35.5%) |
| Community & Social Service | 101 (28.9%) | 248 (71.1%) |
| Education, Arts & Media | 0 (0.0%) | 45 (100.0%) |
| Legal Services & Support | 0 (0.0%) | 41 (100.0%) |
| Education Instruction & Library | 101 (43.9%) | 129 (56.1%) |
| Arts, Media & Entertainment | 0 (0.0%) | 33 (100.0%) |
| Health Diagnosing & Treating | 32 (18.7%) | 139 (81.3%) |
| Health Technologists | 21 (22.3%) | 73 (77.7%) |
| Total (Category) | 547 (44.9%) | 672 (55.1%) |
| Total (Overall) | 1,696 (57.0%) | 1,280 (43.0%) |
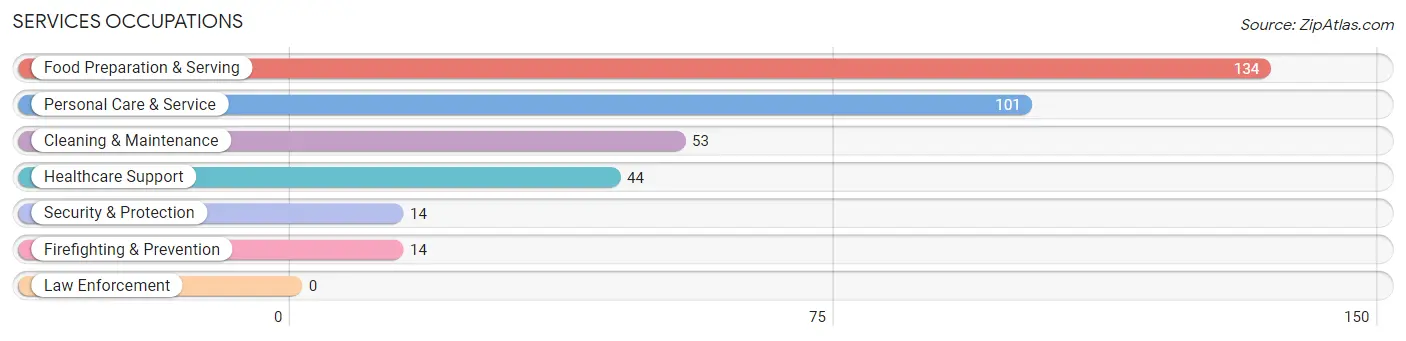
Services Occupations
The most common Services occupations in Comstock Northwest are Food Preparation & Serving (134 | 4.5%), Personal Care & Service (101 | 3.4%), Cleaning & Maintenance (53 | 1.8%), Healthcare Support (44 | 1.5%), and Security & Protection (14 | 0.5%).
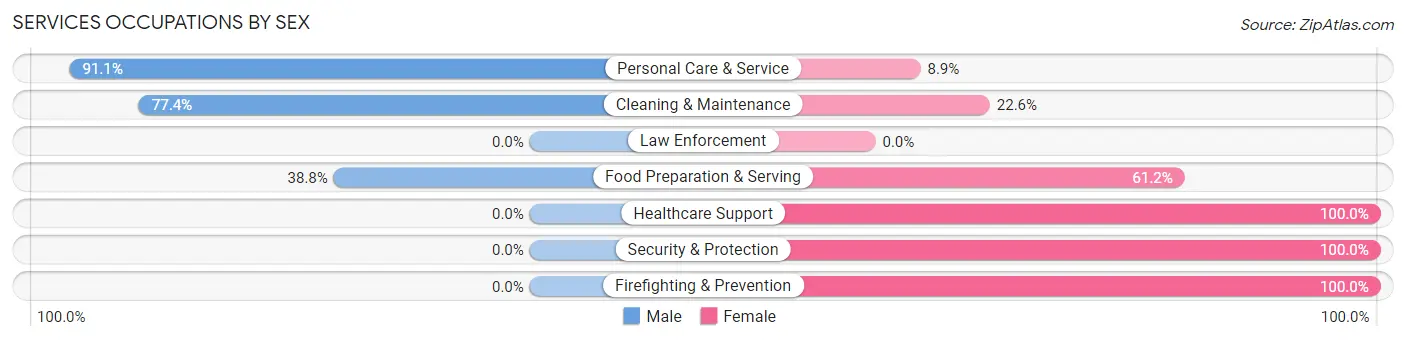
Services Occupations by Sex
Within the Services occupations in Comstock Northwest, the most male-oriented occupations are Personal Care & Service (91.1%), Cleaning & Maintenance (77.4%), and Food Preparation & Serving (38.8%), while the most female-oriented occupations are Healthcare Support (100.0%), Security & Protection (100.0%), and Firefighting & Prevention (100.0%).
| Occupation | Male | Female |
| Healthcare Support | 0 (0.0%) | 44 (100.0%) |
| Security & Protection | 0 (0.0%) | 14 (100.0%) |
| Firefighting & Prevention | 0 (0.0%) | 14 (100.0%) |
| Law Enforcement | 0 (0.0%) | 0 (0.0%) |
| Food Preparation & Serving | 52 (38.8%) | 82 (61.2%) |
| Cleaning & Maintenance | 41 (77.4%) | 12 (22.6%) |
| Personal Care & Service | 92 (91.1%) | 9 (8.9%) |
| Total (Category) | 185 (53.5%) | 161 (46.5%) |
| Total (Overall) | 1,696 (57.0%) | 1,280 (43.0%) |
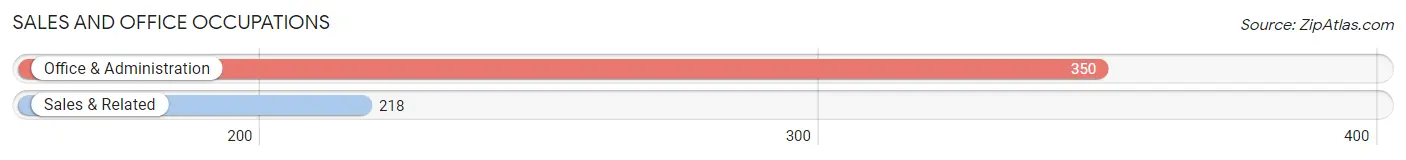
Sales and Office Occupations
The most common Sales and Office occupations in Comstock Northwest are Office & Administration (350 | 11.8%), and Sales & Related (218 | 7.3%).
Sales and Office Occupations by Sex
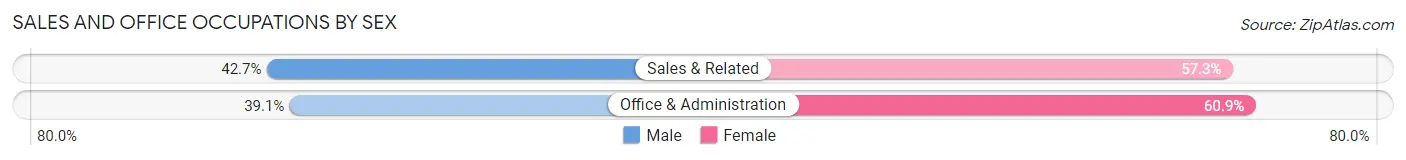
| Occupation | Male | Female |
| Sales & Related | 93 (42.7%) | 125 (57.3%) |
| Office & Administration | 137 (39.1%) | 213 (60.9%) |
| Total (Category) | 230 (40.5%) | 338 (59.5%) |
| Total (Overall) | 1,696 (57.0%) | 1,280 (43.0%) |
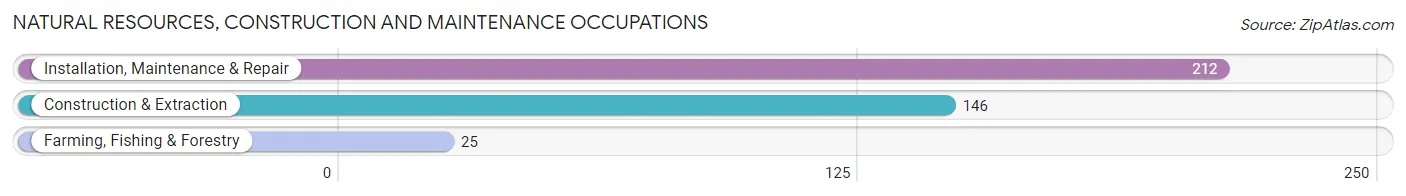
Natural Resources, Construction and Maintenance Occupations
The most common Natural Resources, Construction and Maintenance occupations in Comstock Northwest are Installation, Maintenance & Repair (212 | 7.1%), Construction & Extraction (146 | 4.9%), and Farming, Fishing & Forestry (25 | 0.8%).
Natural Resources, Construction and Maintenance Occupations by Sex
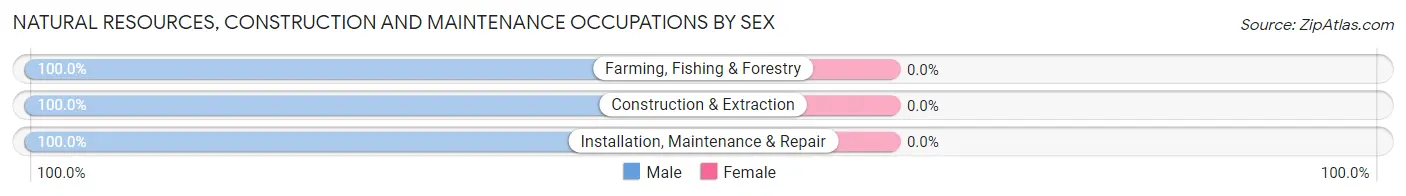
| Occupation | Male | Female |
| Farming, Fishing & Forestry | 25 (100.0%) | 0 (0.0%) |
| Construction & Extraction | 146 (100.0%) | 0 (0.0%) |
| Installation, Maintenance & Repair | 212 (100.0%) | 0 (0.0%) |
| Total (Category) | 383 (100.0%) | 0 (0.0%) |
| Total (Overall) | 1,696 (57.0%) | 1,280 (43.0%) |
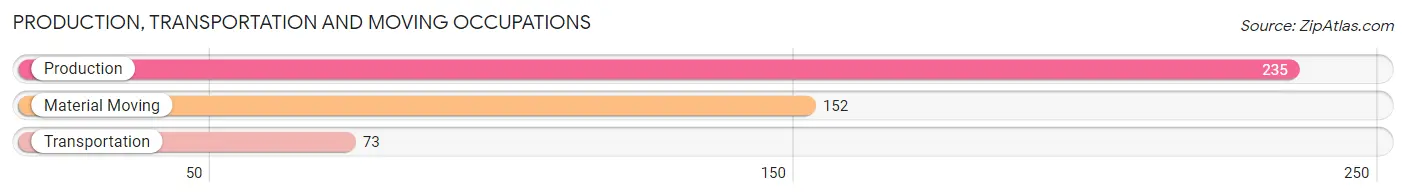
Production, Transportation and Moving Occupations
The most common Production, Transportation and Moving occupations in Comstock Northwest are Production (235 | 7.9%), Material Moving (152 | 5.1%), and Transportation (73 | 2.5%).
Production, Transportation and Moving Occupations by Sex
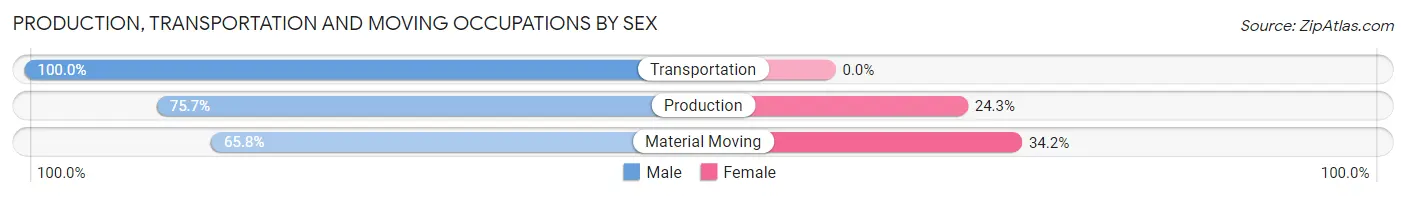
| Occupation | Male | Female |
| Production | 178 (75.7%) | 57 (24.3%) |
| Transportation | 73 (100.0%) | 0 (0.0%) |
| Material Moving | 100 (65.8%) | 52 (34.2%) |
| Total (Category) | 351 (76.3%) | 109 (23.7%) |
| Total (Overall) | 1,696 (57.0%) | 1,280 (43.0%) |
Employment Industries by Sex in Comstock Northwest
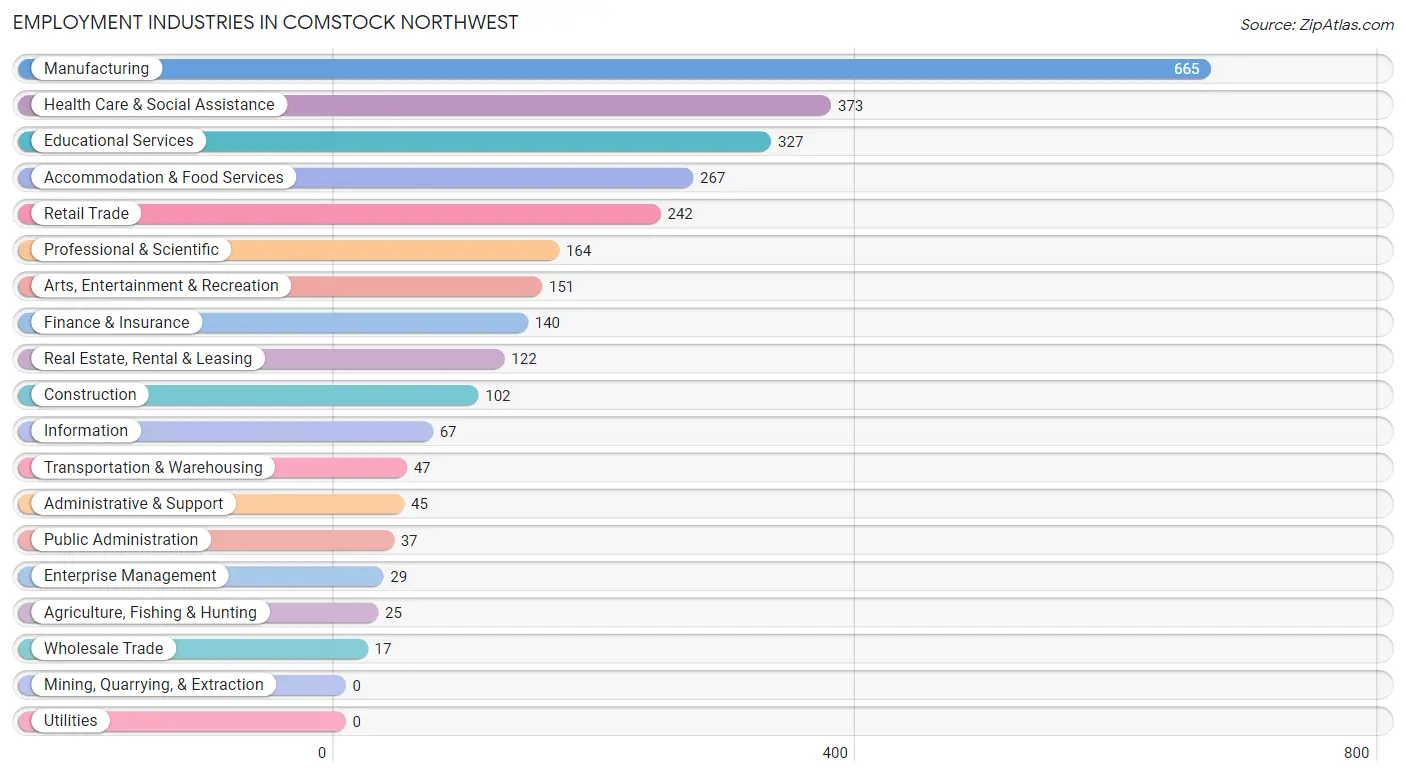
Employment Industries in Comstock Northwest
The major employment industries in Comstock Northwest include Manufacturing (665 | 22.4%), Health Care & Social Assistance (373 | 12.5%), Educational Services (327 | 11.0%), Accommodation & Food Services (267 | 9.0%), and Retail Trade (242 | 8.1%).
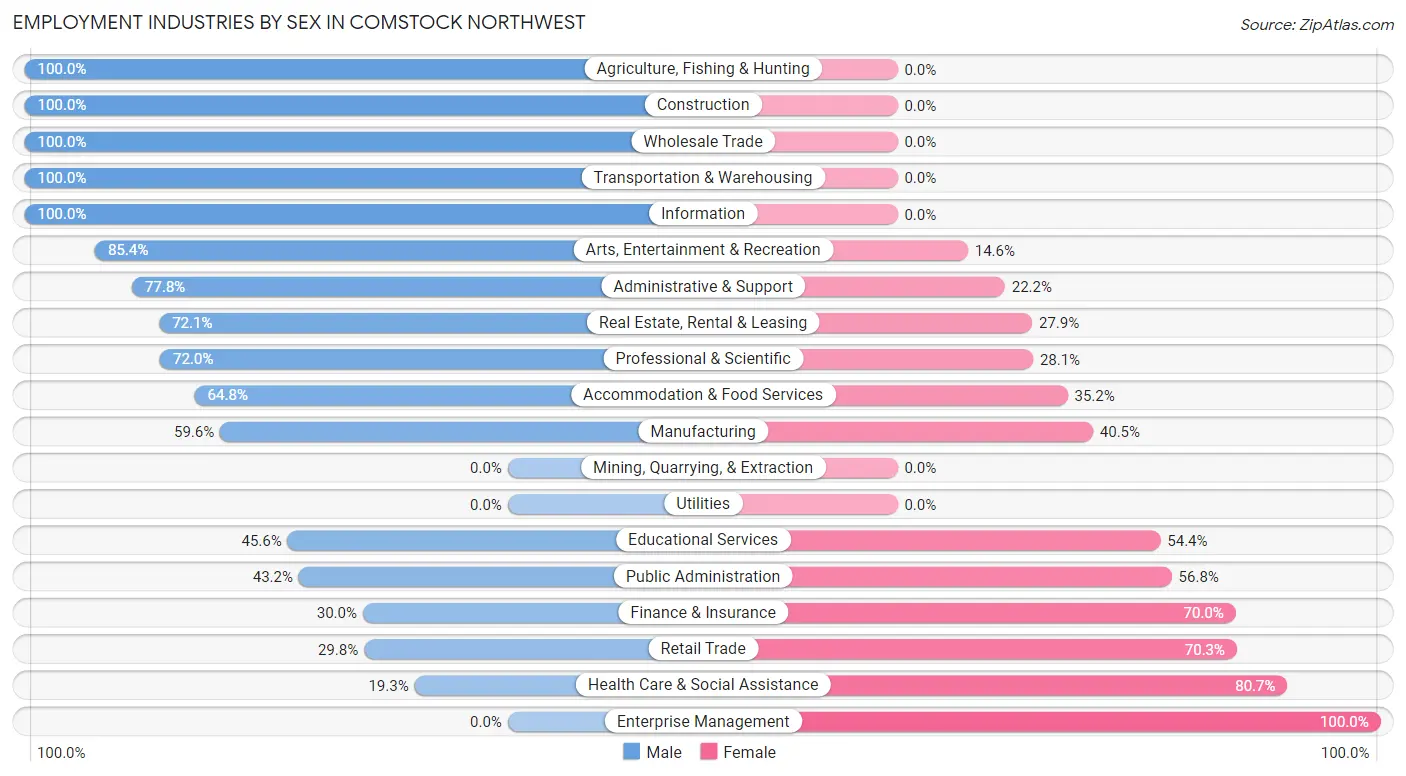
Employment Industries by Sex in Comstock Northwest
The Comstock Northwest industries that see more men than women are Agriculture, Fishing & Hunting (100.0%), Construction (100.0%), and Wholesale Trade (100.0%), whereas the industries that tend to have a higher number of women are Enterprise Management (100.0%), Health Care & Social Assistance (80.7%), and Retail Trade (70.3%).
| Industry | Male | Female |
| Agriculture, Fishing & Hunting | 25 (100.0%) | 0 (0.0%) |
| Mining, Quarrying, & Extraction | 0 (0.0%) | 0 (0.0%) |
| Construction | 102 (100.0%) | 0 (0.0%) |
| Manufacturing | 396 (59.6%) | 269 (40.5%) |
| Wholesale Trade | 17 (100.0%) | 0 (0.0%) |
| Retail Trade | 72 (29.7%) | 170 (70.3%) |
| Transportation & Warehousing | 47 (100.0%) | 0 (0.0%) |
| Utilities | 0 (0.0%) | 0 (0.0%) |
| Information | 67 (100.0%) | 0 (0.0%) |
| Finance & Insurance | 42 (30.0%) | 98 (70.0%) |
| Real Estate, Rental & Leasing | 88 (72.1%) | 34 (27.9%) |
| Professional & Scientific | 118 (72.0%) | 46 (28.1%) |
| Enterprise Management | 0 (0.0%) | 29 (100.0%) |
| Administrative & Support | 35 (77.8%) | 10 (22.2%) |
| Educational Services | 149 (45.6%) | 178 (54.4%) |
| Health Care & Social Assistance | 72 (19.3%) | 301 (80.7%) |
| Arts, Entertainment & Recreation | 129 (85.4%) | 22 (14.6%) |
| Accommodation & Food Services | 173 (64.8%) | 94 (35.2%) |
| Public Administration | 16 (43.2%) | 21 (56.8%) |
| Total | 1,696 (57.0%) | 1,280 (43.0%) |
Education in Comstock Northwest
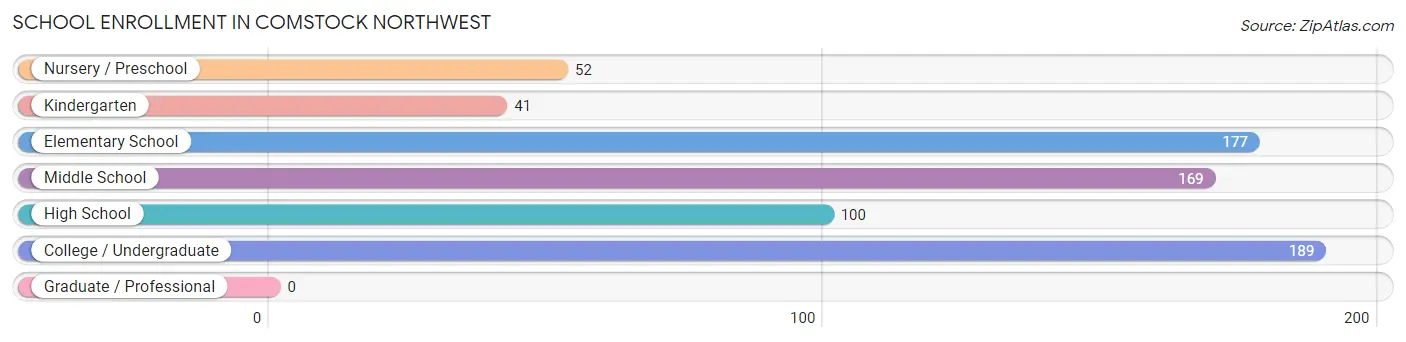
School Enrollment in Comstock Northwest
The most common levels of schooling among the 728 students in Comstock Northwest are college / undergraduate (189 | 26.0%), elementary school (177 | 24.3%), and middle school (169 | 23.2%).
| School Level | # Students | % Students |
| Nursery / Preschool | 52 | 7.1% |
| Kindergarten | 41 | 5.6% |
| Elementary School | 177 | 24.3% |
| Middle School | 169 | 23.2% |
| High School | 100 | 13.7% |
| College / Undergraduate | 189 | 26.0% |
| Graduate / Professional | 0 | 0.0% |
| Total | 728 | 100.0% |
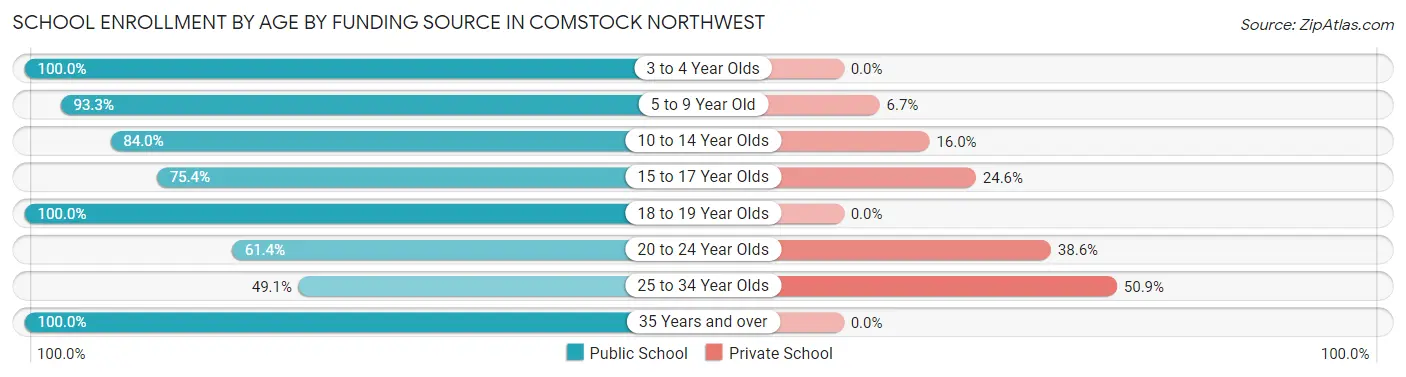
School Enrollment by Age by Funding Source in Comstock Northwest
Out of a total of 728 students who are enrolled in schools in Comstock Northwest, 138 (19.0%) attend a private institution, while the remaining 590 (81.0%) are enrolled in public schools. The age group of 25 to 34 year olds has the highest likelihood of being enrolled in private schools, with 57 (50.9% in the age bracket) enrolled. Conversely, the age group of 3 to 4 year olds has the lowest likelihood of being enrolled in a private school, with 31 (100.0% in the age bracket) attending a public institution.
| Age Bracket | Public School | Private School |
| 3 to 4 Year Olds | 31 (100.0%) | 0 (0.0%) |
| 5 to 9 Year Old | 223 (93.3%) | 16 (6.7%) |
| 10 to 14 Year Olds | 142 (84.0%) | 27 (16.0%) |
| 15 to 17 Year Olds | 49 (75.4%) | 16 (24.6%) |
| 18 to 19 Year Olds | 35 (100.0%) | 0 (0.0%) |
| 20 to 24 Year Olds | 35 (61.4%) | 22 (38.6%) |
| 25 to 34 Year Olds | 55 (49.1%) | 57 (50.9%) |
| 35 Years and over | 20 (100.0%) | 0 (0.0%) |
| Total | 590 (81.0%) | 138 (19.0%) |
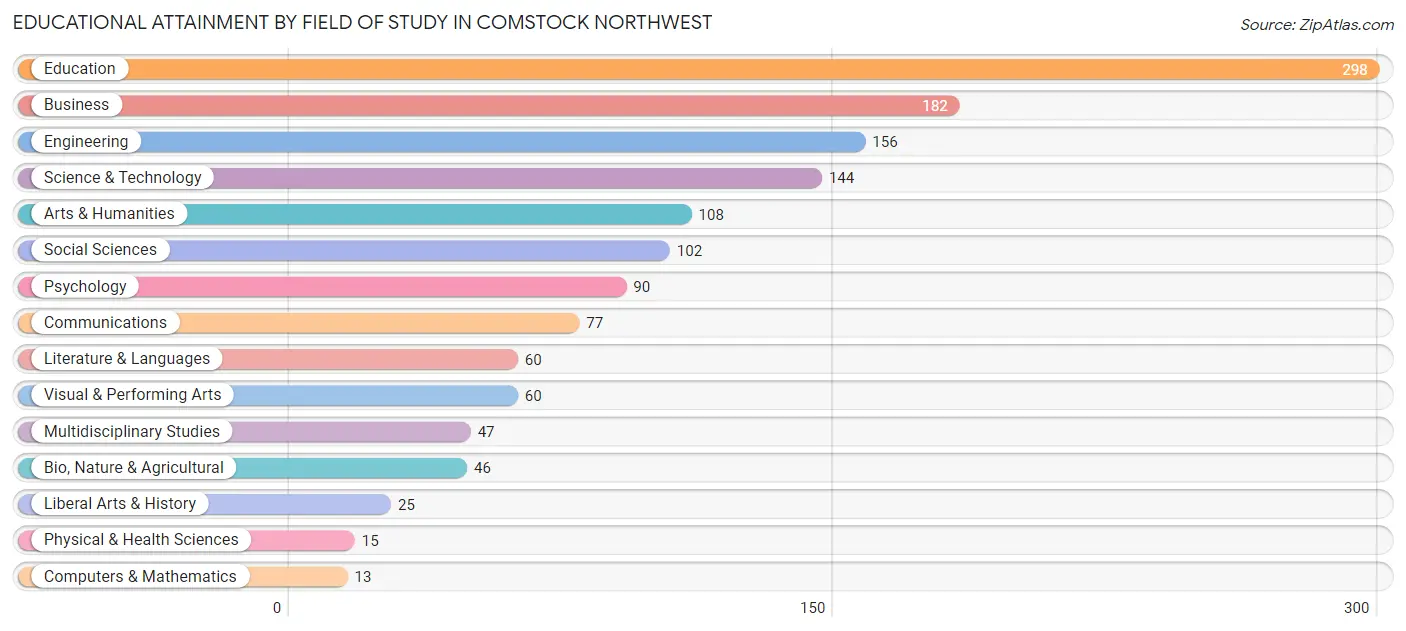
Educational Attainment by Field of Study in Comstock Northwest
Education (298 | 20.9%), business (182 | 12.8%), engineering (156 | 11.0%), science & technology (144 | 10.1%), and arts & humanities (108 | 7.6%) are the most common fields of study among 1,423 individuals in Comstock Northwest who have obtained a bachelor's degree or higher.
| Field of Study | # Graduates | % Graduates |
| Computers & Mathematics | 13 | 0.9% |
| Bio, Nature & Agricultural | 46 | 3.2% |
| Physical & Health Sciences | 15 | 1.1% |
| Psychology | 90 | 6.3% |
| Social Sciences | 102 | 7.2% |
| Engineering | 156 | 11.0% |
| Multidisciplinary Studies | 47 | 3.3% |
| Science & Technology | 144 | 10.1% |
| Business | 182 | 12.8% |
| Education | 298 | 20.9% |
| Literature & Languages | 60 | 4.2% |
| Liberal Arts & History | 25 | 1.8% |
| Visual & Performing Arts | 60 | 4.2% |
| Communications | 77 | 5.4% |
| Arts & Humanities | 108 | 7.6% |
| Total | 1,423 | 100.0% |
Transportation & Commute in Comstock Northwest
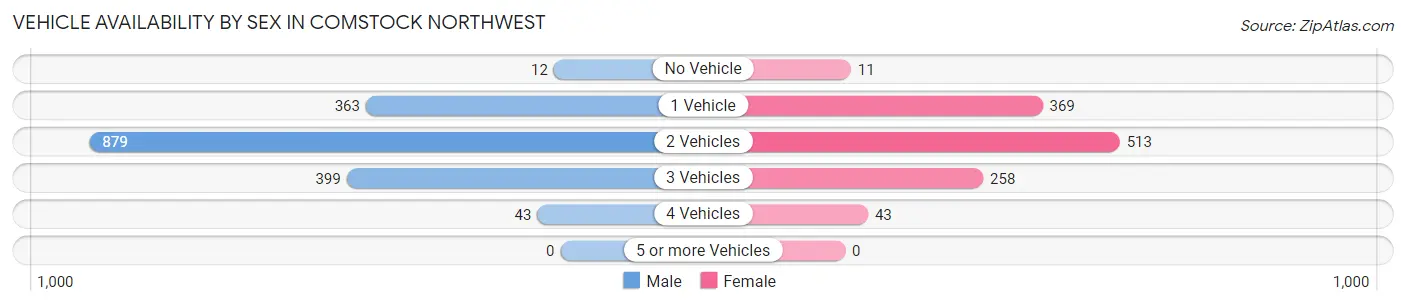
Vehicle Availability by Sex in Comstock Northwest
The most prevalent vehicle ownership categories in Comstock Northwest are males with 2 vehicles (879, accounting for 51.8%) and females with 2 vehicles (513, making up 73.6%).
| Vehicles Available | Male | Female |
| No Vehicle | 12 (0.7%) | 11 (0.9%) |
| 1 Vehicle | 363 (21.4%) | 369 (30.9%) |
| 2 Vehicles | 879 (51.8%) | 513 (43.0%) |
| 3 Vehicles | 399 (23.5%) | 258 (21.6%) |
| 4 Vehicles | 43 (2.5%) | 43 (3.6%) |
| 5 or more Vehicles | 0 (0.0%) | 0 (0.0%) |
| Total | 1,696 (100.0%) | 1,194 (100.0%) |
Commute Time in Comstock Northwest
The most frequently occuring commute durations in Comstock Northwest are 15 to 19 minutes (688 commuters, 25.9%), 10 to 14 minutes (500 commuters, 18.8%), and 20 to 24 minutes (433 commuters, 16.3%).
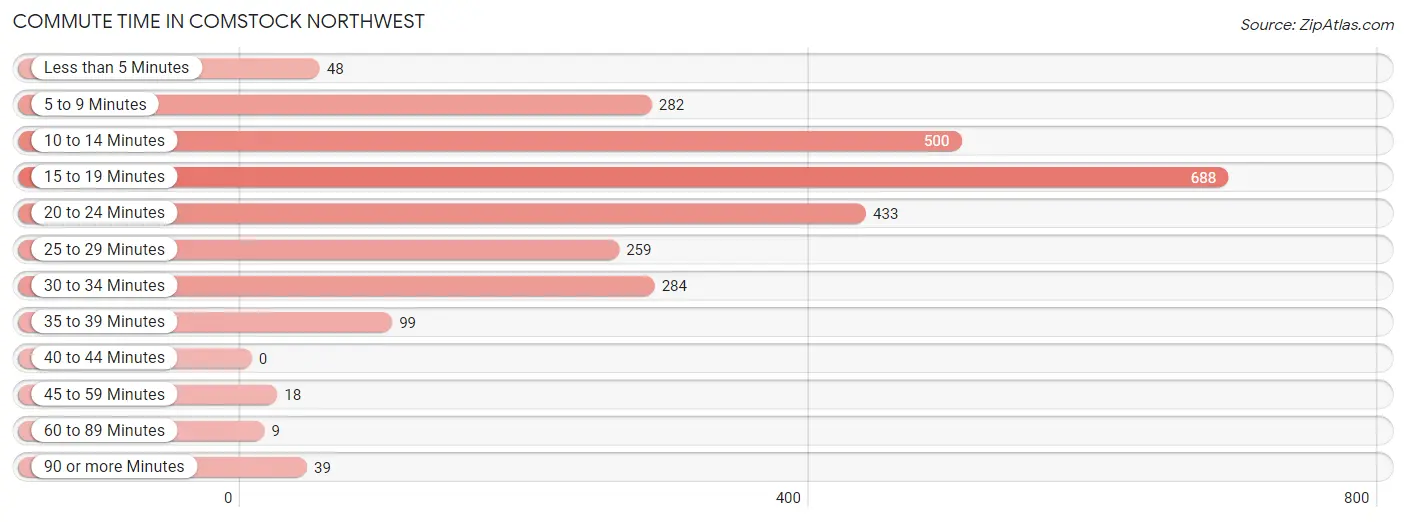
| Commute Time | # Commuters | % Commuters |
| Less than 5 Minutes | 48 | 1.8% |
| 5 to 9 Minutes | 282 | 10.6% |
| 10 to 14 Minutes | 500 | 18.8% |
| 15 to 19 Minutes | 688 | 25.9% |
| 20 to 24 Minutes | 433 | 16.3% |
| 25 to 29 Minutes | 259 | 9.7% |
| 30 to 34 Minutes | 284 | 10.7% |
| 35 to 39 Minutes | 99 | 3.7% |
| 40 to 44 Minutes | 0 | 0.0% |
| 45 to 59 Minutes | 18 | 0.7% |
| 60 to 89 Minutes | 9 | 0.3% |
| 90 or more Minutes | 39 | 1.5% |
Commute Time by Sex in Comstock Northwest
The most common commute times in Comstock Northwest are 15 to 19 minutes (458 commuters, 28.7%) for males and 20 to 24 minutes (272 commuters, 25.6%) for females.
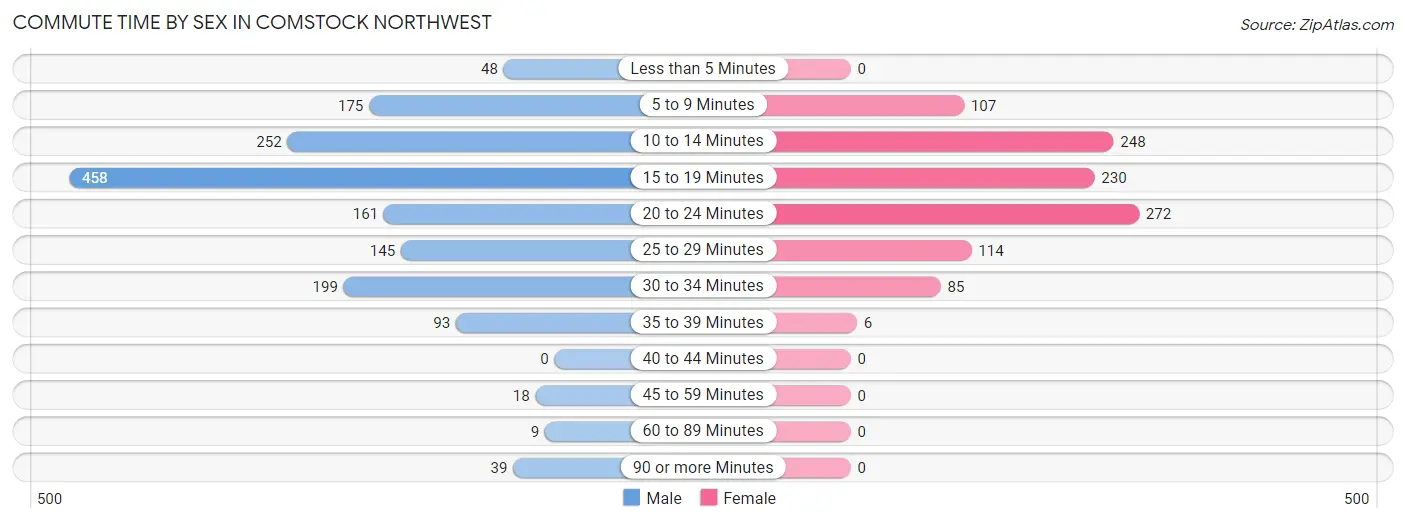
| Commute Time | Male | Female |
| Less than 5 Minutes | 48 (3.0%) | 0 (0.0%) |
| 5 to 9 Minutes | 175 (11.0%) | 107 (10.1%) |
| 10 to 14 Minutes | 252 (15.8%) | 248 (23.4%) |
| 15 to 19 Minutes | 458 (28.7%) | 230 (21.7%) |
| 20 to 24 Minutes | 161 (10.1%) | 272 (25.6%) |
| 25 to 29 Minutes | 145 (9.1%) | 114 (10.7%) |
| 30 to 34 Minutes | 199 (12.5%) | 85 (8.0%) |
| 35 to 39 Minutes | 93 (5.8%) | 6 (0.6%) |
| 40 to 44 Minutes | 0 (0.0%) | 0 (0.0%) |
| 45 to 59 Minutes | 18 (1.1%) | 0 (0.0%) |
| 60 to 89 Minutes | 9 (0.6%) | 0 (0.0%) |
| 90 or more Minutes | 39 (2.4%) | 0 (0.0%) |
Time of Departure to Work by Sex in Comstock Northwest
The most frequent times of departure to work in Comstock Northwest are 7:30 AM to 7:59 AM (297, 18.6%) for males and 7:30 AM to 7:59 AM (353, 33.2%) for females.
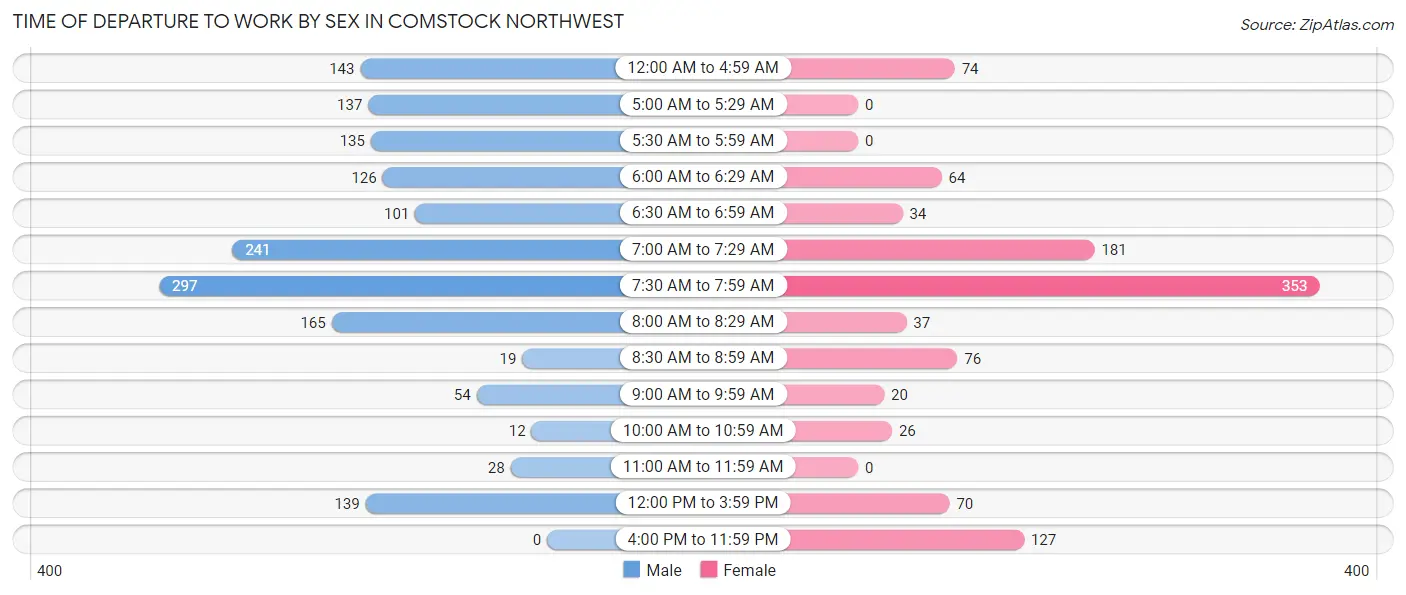
| Time of Departure | Male | Female |
| 12:00 AM to 4:59 AM | 143 (8.9%) | 74 (7.0%) |
| 5:00 AM to 5:29 AM | 137 (8.6%) | 0 (0.0%) |
| 5:30 AM to 5:59 AM | 135 (8.5%) | 0 (0.0%) |
| 6:00 AM to 6:29 AM | 126 (7.9%) | 64 (6.0%) |
| 6:30 AM to 6:59 AM | 101 (6.3%) | 34 (3.2%) |
| 7:00 AM to 7:29 AM | 241 (15.1%) | 181 (17.0%) |
| 7:30 AM to 7:59 AM | 297 (18.6%) | 353 (33.2%) |
| 8:00 AM to 8:29 AM | 165 (10.3%) | 37 (3.5%) |
| 8:30 AM to 8:59 AM | 19 (1.2%) | 76 (7.2%) |
| 9:00 AM to 9:59 AM | 54 (3.4%) | 20 (1.9%) |
| 10:00 AM to 10:59 AM | 12 (0.7%) | 26 (2.5%) |
| 11:00 AM to 11:59 AM | 28 (1.8%) | 0 (0.0%) |
| 12:00 PM to 3:59 PM | 139 (8.7%) | 70 (6.6%) |
| 4:00 PM to 11:59 PM | 0 (0.0%) | 127 (12.0%) |
| Total | 1,597 (100.0%) | 1,062 (100.0%) |
Housing Occupancy in Comstock Northwest
Occupancy by Ownership in Comstock Northwest
Of the total 2,612 dwellings in Comstock Northwest, owner-occupied units account for 1,135 (43.4%), while renter-occupied units make up 1,477 (56.6%).
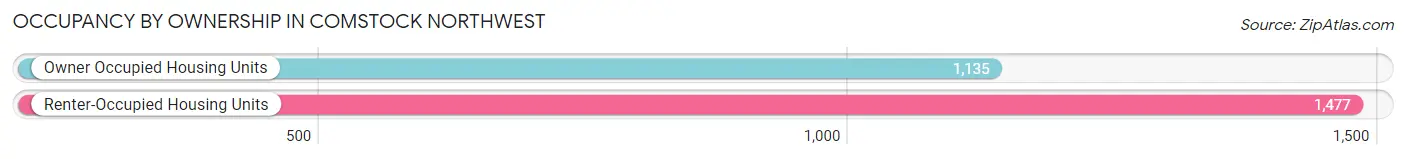
| Occupancy | # Housing Units | % Housing Units |
| Owner Occupied Housing Units | 1,135 | 43.4% |
| Renter-Occupied Housing Units | 1,477 | 56.6% |
| Total Occupied Housing Units | 2,612 | 100.0% |
Occupancy by Household Size in Comstock Northwest
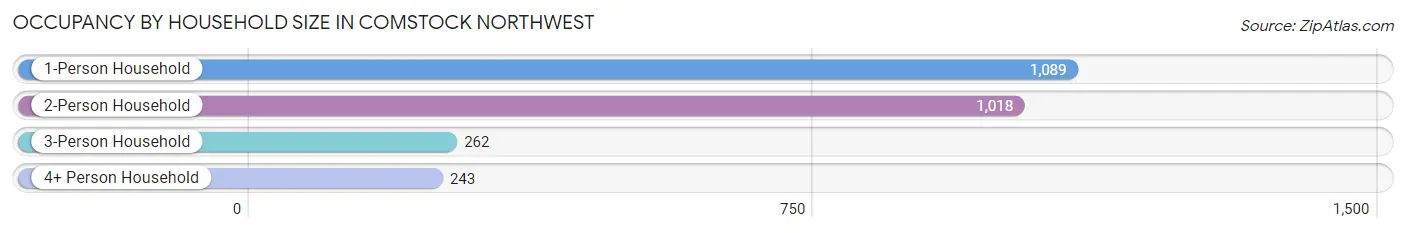
| Household Size | # Housing Units | % Housing Units |
| 1-Person Household | 1,089 | 41.7% |
| 2-Person Household | 1,018 | 39.0% |
| 3-Person Household | 262 | 10.0% |
| 4+ Person Household | 243 | 9.3% |
| Total Housing Units | 2,612 | 100.0% |
Occupancy by Ownership by Household Size in Comstock Northwest
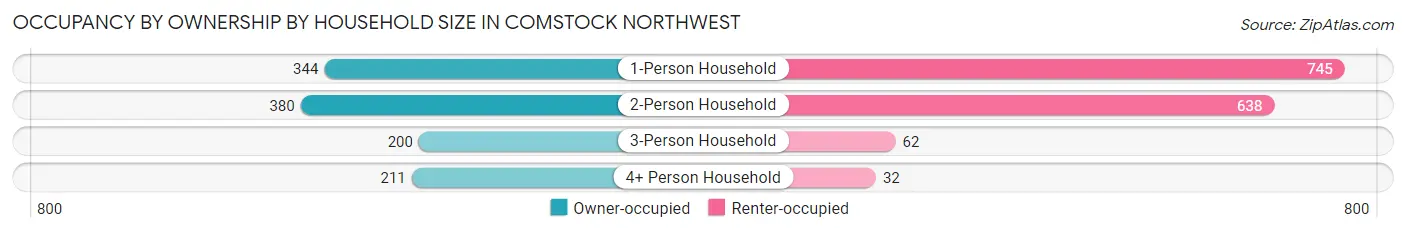
| Household Size | Owner-occupied | Renter-occupied |
| 1-Person Household | 344 (31.6%) | 745 (68.4%) |
| 2-Person Household | 380 (37.3%) | 638 (62.7%) |
| 3-Person Household | 200 (76.3%) | 62 (23.7%) |
| 4+ Person Household | 211 (86.8%) | 32 (13.2%) |
| Total Housing Units | 1,135 (43.4%) | 1,477 (56.6%) |
Occupancy by Educational Attainment in Comstock Northwest
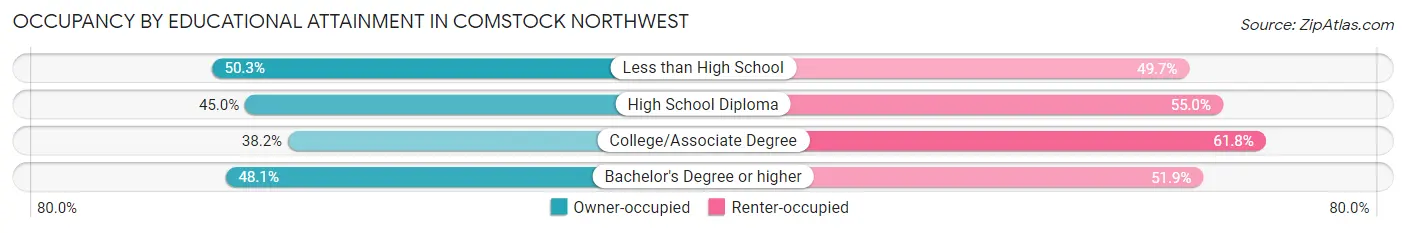
| Household Size | Owner-occupied | Renter-occupied |
| Less than High School | 74 (50.3%) | 73 (49.7%) |
| High School Diploma | 240 (45.0%) | 293 (55.0%) |
| College/Associate Degree | 421 (38.2%) | 680 (61.8%) |
| Bachelor's Degree or higher | 400 (48.1%) | 431 (51.9%) |
Occupancy by Age of Householder in Comstock Northwest
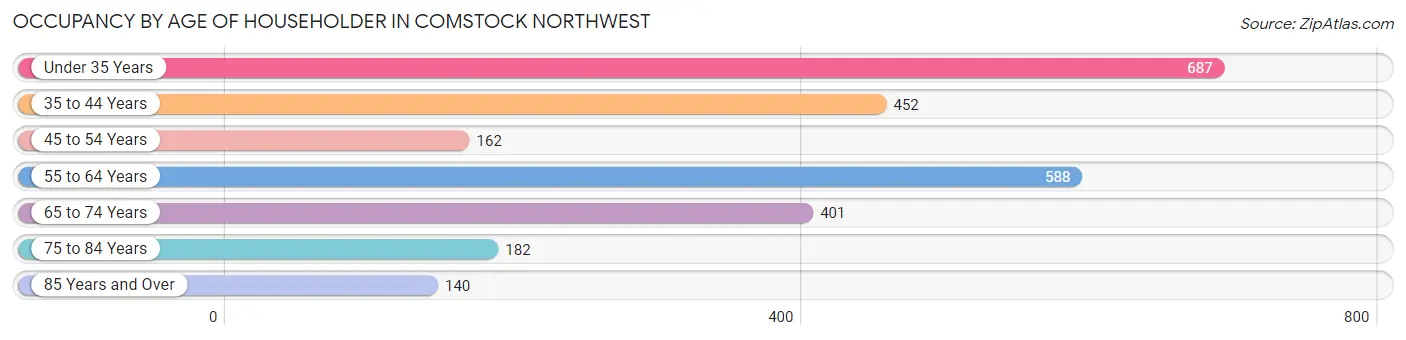
| Age Bracket | # Households | % Households |
| Under 35 Years | 687 | 26.3% |
| 35 to 44 Years | 452 | 17.3% |
| 45 to 54 Years | 162 | 6.2% |
| 55 to 64 Years | 588 | 22.5% |
| 65 to 74 Years | 401 | 15.3% |
| 75 to 84 Years | 182 | 7.0% |
| 85 Years and Over | 140 | 5.4% |
| Total | 2,612 | 100.0% |
Housing Finances in Comstock Northwest
Median Income by Occupancy in Comstock Northwest
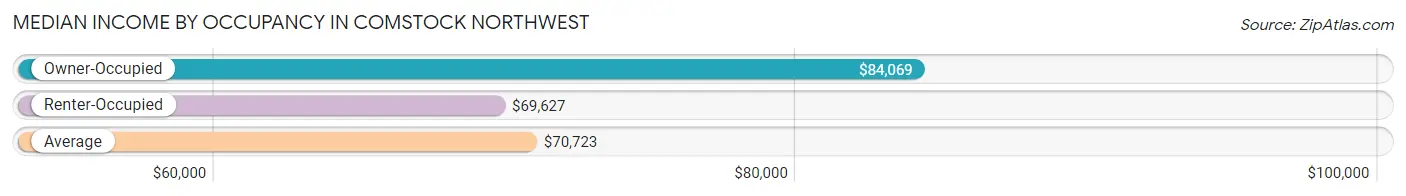
| Occupancy Type | # Households | Median Income |
| Owner-Occupied | 1,135 (43.4%) | $84,069 |
| Renter-Occupied | 1,477 (56.6%) | $69,627 |
| Average | 2,612 (100.0%) | $70,723 |
Occupancy by Householder Income Bracket in Comstock Northwest
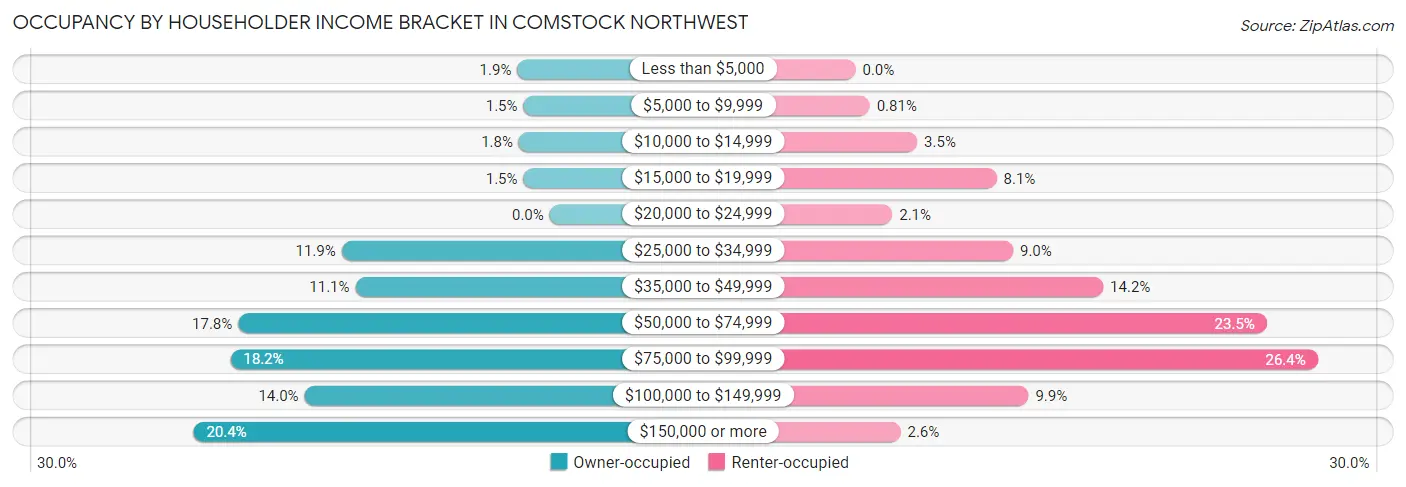
| Income Bracket | Owner-occupied | Renter-occupied |
| Less than $5,000 | 21 (1.8%) | 0 (0.0%) |
| $5,000 to $9,999 | 17 (1.5%) | 12 (0.8%) |
| $10,000 to $14,999 | 20 (1.8%) | 52 (3.5%) |
| $15,000 to $19,999 | 17 (1.5%) | 119 (8.1%) |
| $20,000 to $24,999 | 0 (0.0%) | 31 (2.1%) |
| $25,000 to $34,999 | 135 (11.9%) | 133 (9.0%) |
| $35,000 to $49,999 | 126 (11.1%) | 209 (14.1%) |
| $50,000 to $74,999 | 202 (17.8%) | 347 (23.5%) |
| $75,000 to $99,999 | 207 (18.2%) | 390 (26.4%) |
| $100,000 to $149,999 | 159 (14.0%) | 146 (9.9%) |
| $150,000 or more | 231 (20.3%) | 38 (2.6%) |
| Total | 1,135 (100.0%) | 1,477 (100.0%) |
Monthly Housing Cost Tiers in Comstock Northwest
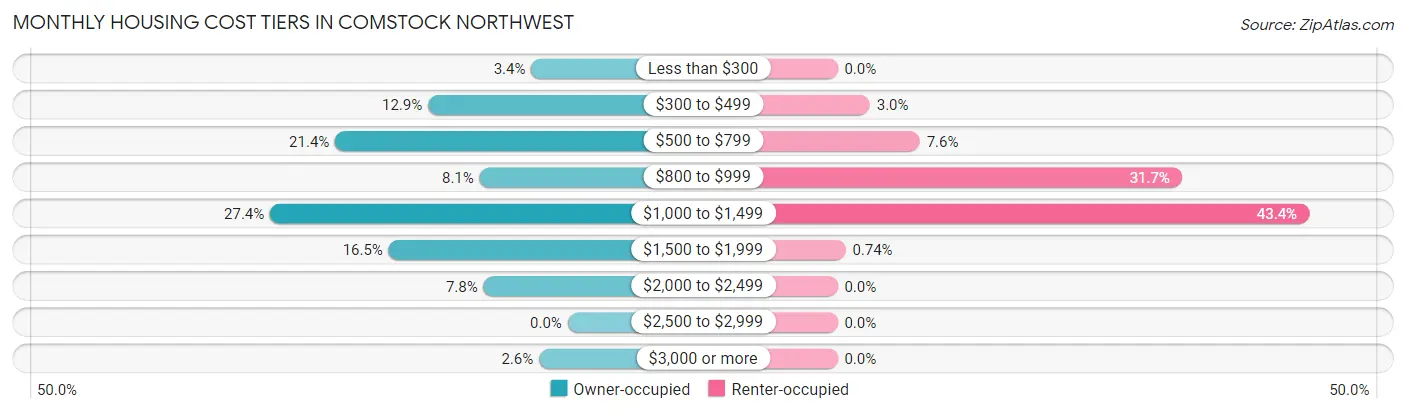
| Monthly Cost | Owner-occupied | Renter-occupied |
| Less than $300 | 38 (3.4%) | 0 (0.0%) |
| $300 to $499 | 146 (12.9%) | 44 (3.0%) |
| $500 to $799 | 243 (21.4%) | 112 (7.6%) |
| $800 to $999 | 92 (8.1%) | 468 (31.7%) |
| $1,000 to $1,499 | 311 (27.4%) | 641 (43.4%) |
| $1,500 to $1,999 | 187 (16.5%) | 11 (0.7%) |
| $2,000 to $2,499 | 88 (7.7%) | 0 (0.0%) |
| $2,500 to $2,999 | 0 (0.0%) | 0 (0.0%) |
| $3,000 or more | 30 (2.6%) | 0 (0.0%) |
| Total | 1,135 (100.0%) | 1,477 (100.0%) |
Physical Housing Characteristics in Comstock Northwest
Housing Structures in Comstock Northwest
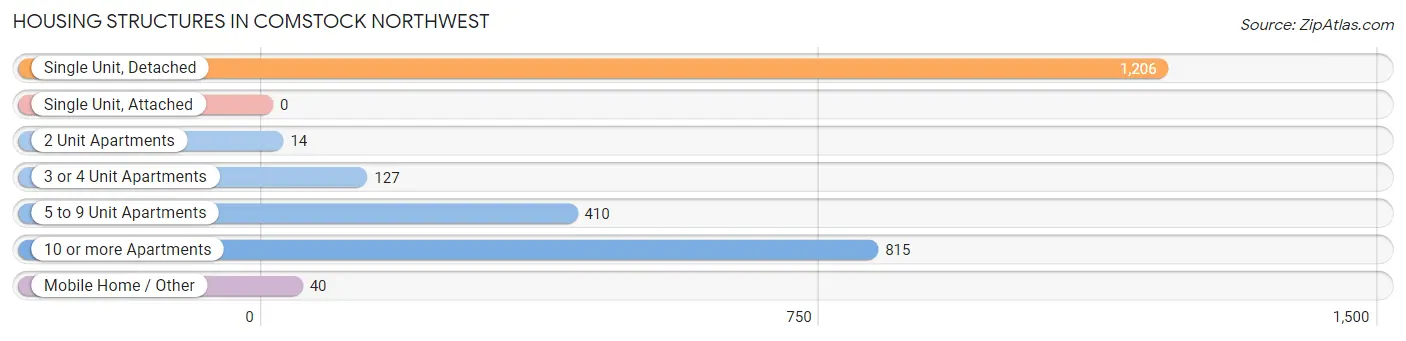
| Structure Type | # Housing Units | % Housing Units |
| Single Unit, Detached | 1,206 | 46.2% |
| Single Unit, Attached | 0 | 0.0% |
| 2 Unit Apartments | 14 | 0.5% |
| 3 or 4 Unit Apartments | 127 | 4.9% |
| 5 to 9 Unit Apartments | 410 | 15.7% |
| 10 or more Apartments | 815 | 31.2% |
| Mobile Home / Other | 40 | 1.5% |
| Total | 2,612 | 100.0% |
Housing Structures by Occupancy in Comstock Northwest
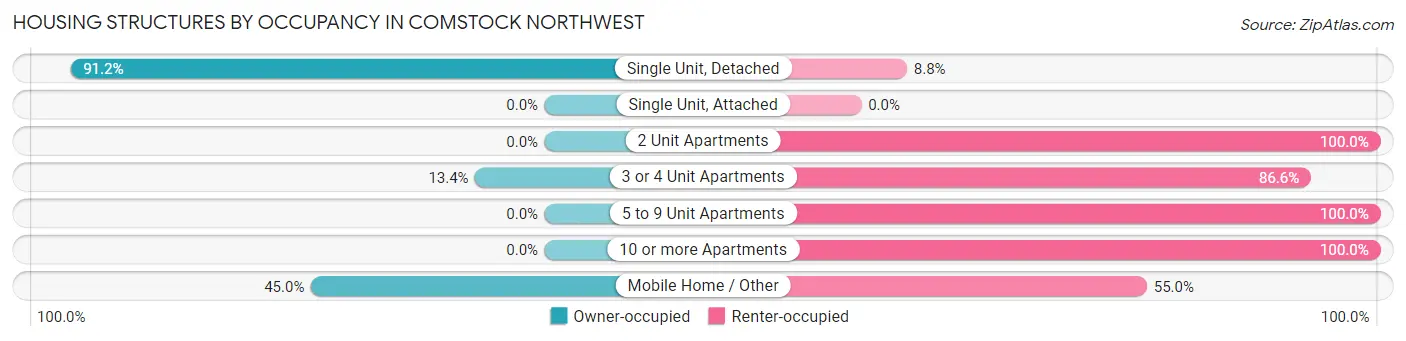
| Structure Type | Owner-occupied | Renter-occupied |
| Single Unit, Detached | 1,100 (91.2%) | 106 (8.8%) |
| Single Unit, Attached | 0 (0.0%) | 0 (0.0%) |
| 2 Unit Apartments | 0 (0.0%) | 14 (100.0%) |
| 3 or 4 Unit Apartments | 17 (13.4%) | 110 (86.6%) |
| 5 to 9 Unit Apartments | 0 (0.0%) | 410 (100.0%) |
| 10 or more Apartments | 0 (0.0%) | 815 (100.0%) |
| Mobile Home / Other | 18 (45.0%) | 22 (55.0%) |
| Total | 1,135 (43.4%) | 1,477 (56.6%) |
Housing Structures by Number of Rooms in Comstock Northwest
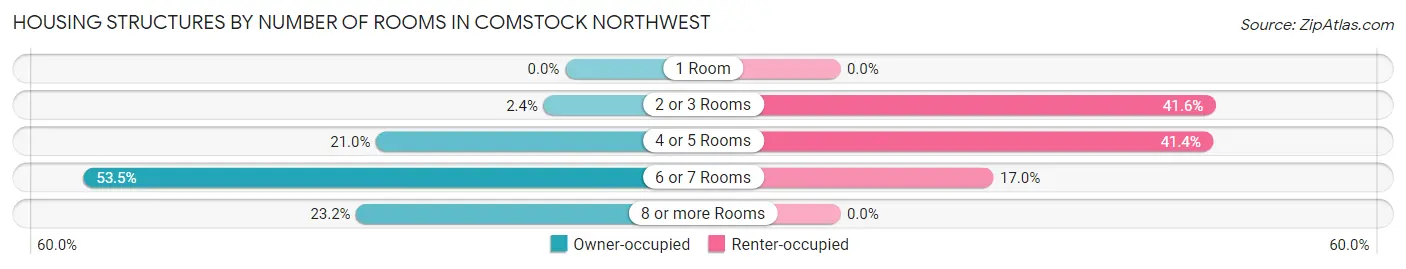
| Number of Rooms | Owner-occupied | Renter-occupied |
| 1 Room | 0 (0.0%) | 0 (0.0%) |
| 2 or 3 Rooms | 27 (2.4%) | 615 (41.6%) |
| 4 or 5 Rooms | 238 (21.0%) | 611 (41.4%) |
| 6 or 7 Rooms | 607 (53.5%) | 251 (17.0%) |
| 8 or more Rooms | 263 (23.2%) | 0 (0.0%) |
| Total | 1,135 (100.0%) | 1,477 (100.0%) |
Housing Structure by Heating Type in Comstock Northwest

| Heating Type | Owner-occupied | Renter-occupied |
| Utility Gas | 1,055 (92.9%) | 1,039 (70.4%) |
| Bottled, Tank, or LP Gas | 0 (0.0%) | 32 (2.2%) |
| Electricity | 80 (7.0%) | 307 (20.8%) |
| Fuel Oil or Kerosene | 0 (0.0%) | 99 (6.7%) |
| Coal or Coke | 0 (0.0%) | 0 (0.0%) |
| All other Fuels | 0 (0.0%) | 0 (0.0%) |
| No Fuel Used | 0 (0.0%) | 0 (0.0%) |
| Total | 1,135 (100.0%) | 1,477 (100.0%) |
Household Vehicle Usage in Comstock Northwest
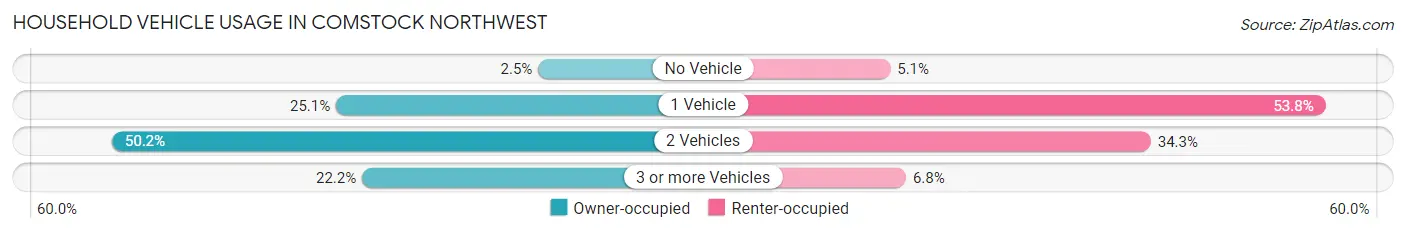
| Vehicles per Household | Owner-occupied | Renter-occupied |
| No Vehicle | 28 (2.5%) | 75 (5.1%) |
| 1 Vehicle | 285 (25.1%) | 795 (53.8%) |
| 2 Vehicles | 570 (50.2%) | 506 (34.3%) |
| 3 or more Vehicles | 252 (22.2%) | 101 (6.8%) |
| Total | 1,135 (100.0%) | 1,477 (100.0%) |
Real Estate & Mortgages in Comstock Northwest
Real Estate and Mortgage Overview in Comstock Northwest
| Characteristic | Without Mortgage | With Mortgage |
| Housing Units | 435 | 700 |
| Median Property Value | $190,700 | $217,400 |
| Median Household Income | $42,096 | $178 |
| Monthly Housing Costs | $540 | $30 |
| Real Estate Taxes | $3,048 | $20 |
Property Value by Mortgage Status in Comstock Northwest
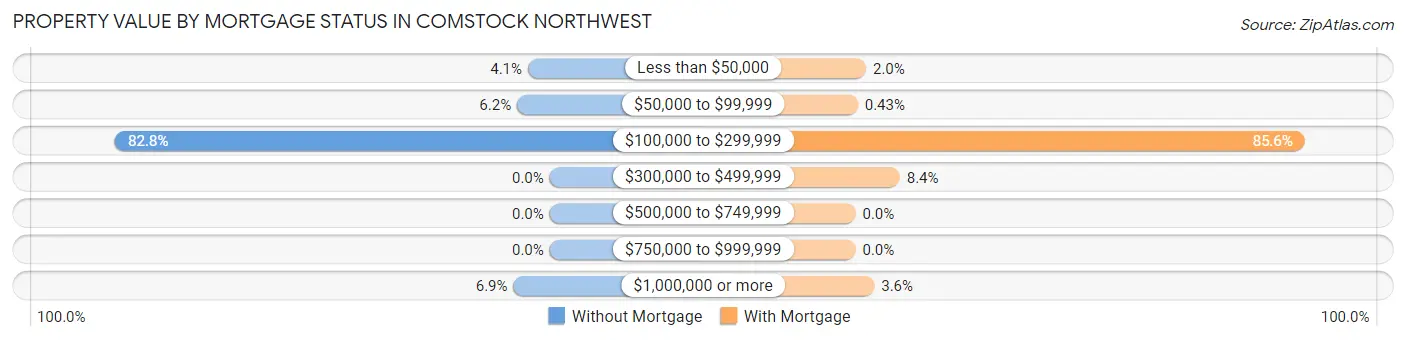
| Property Value | Without Mortgage | With Mortgage |
| Less than $50,000 | 18 (4.1%) | 14 (2.0%) |
| $50,000 to $99,999 | 27 (6.2%) | 3 (0.4%) |
| $100,000 to $299,999 | 360 (82.8%) | 599 (85.6%) |
| $300,000 to $499,999 | 0 (0.0%) | 59 (8.4%) |
| $500,000 to $749,999 | 0 (0.0%) | 0 (0.0%) |
| $750,000 to $999,999 | 0 (0.0%) | 0 (0.0%) |
| $1,000,000 or more | 30 (6.9%) | 25 (3.6%) |
| Total | 435 (100.0%) | 700 (100.0%) |
Household Income by Mortgage Status in Comstock Northwest
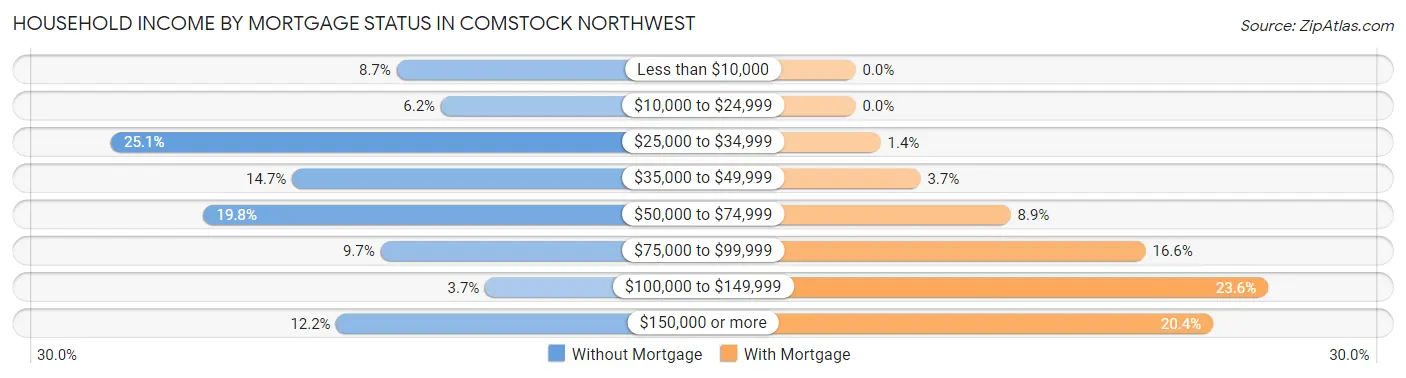
| Household Income | Without Mortgage | With Mortgage |
| Less than $10,000 | 38 (8.7%) | 0 (0.0%) |
| $10,000 to $24,999 | 27 (6.2%) | 0 (0.0%) |
| $25,000 to $34,999 | 109 (25.1%) | 10 (1.4%) |
| $35,000 to $49,999 | 64 (14.7%) | 26 (3.7%) |
| $50,000 to $74,999 | 86 (19.8%) | 62 (8.9%) |
| $75,000 to $99,999 | 42 (9.7%) | 116 (16.6%) |
| $100,000 to $149,999 | 16 (3.7%) | 165 (23.6%) |
| $150,000 or more | 53 (12.2%) | 143 (20.4%) |
| Total | 435 (100.0%) | 700 (100.0%) |
Property Value to Household Income Ratio in Comstock Northwest
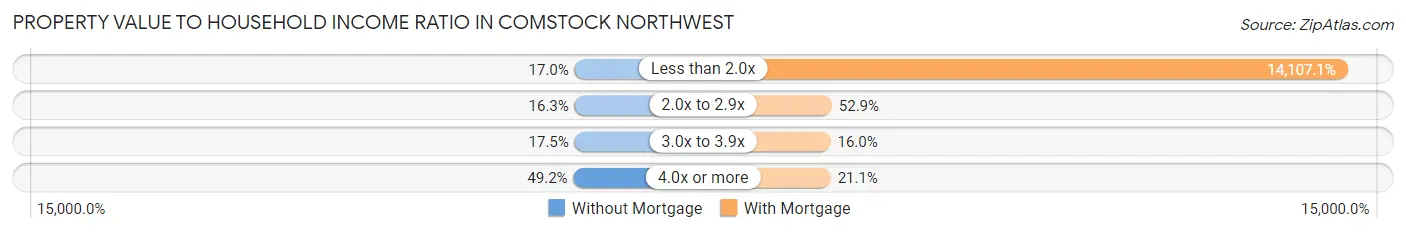
| Value-to-Income Ratio | Without Mortgage | With Mortgage |
| Less than 2.0x | 74 (17.0%) | 98,750 (14,107.1%) |
| 2.0x to 2.9x | 71 (16.3%) | 370 (52.9%) |
| 3.0x to 3.9x | 76 (17.5%) | 112 (16.0%) |
| 4.0x or more | 214 (49.2%) | 148 (21.1%) |
| Total | 435 (100.0%) | 700 (100.0%) |
Real Estate Taxes by Mortgage Status in Comstock Northwest
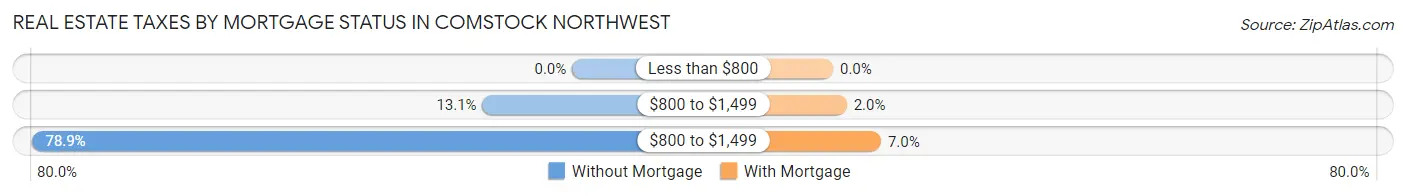
| Property Taxes | Without Mortgage | With Mortgage |
| Less than $800 | 0 (0.0%) | 0 (0.0%) |
| $800 to $1,499 | 57 (13.1%) | 14 (2.0%) |
| $800 to $1,499 | 343 (78.8%) | 49 (7.0%) |
| Total | 435 (100.0%) | 700 (100.0%) |
Health & Disability in Comstock Northwest
Health Insurance Coverage by Age in Comstock Northwest
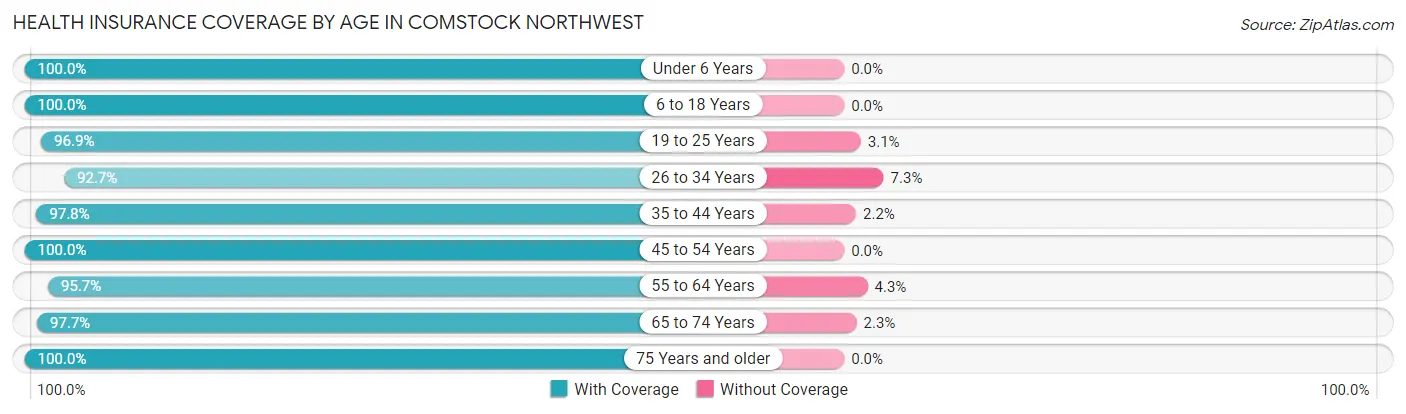
| Age Bracket | With Coverage | Without Coverage |
| Under 6 Years | 336 (100.0%) | 0 (0.0%) |
| 6 to 18 Years | 437 (100.0%) | 0 (0.0%) |
| 19 to 25 Years | 628 (96.9%) | 20 (3.1%) |
| 26 to 34 Years | 732 (92.7%) | 58 (7.3%) |
| 35 to 44 Years | 756 (97.8%) | 17 (2.2%) |
| 45 to 54 Years | 239 (100.0%) | 0 (0.0%) |
| 55 to 64 Years | 815 (95.7%) | 37 (4.3%) |
| 65 to 74 Years | 594 (97.7%) | 14 (2.3%) |
| 75 Years and older | 448 (100.0%) | 0 (0.0%) |
| Total | 4,985 (97.2%) | 146 (2.9%) |
Health Insurance Coverage by Citizenship Status in Comstock Northwest
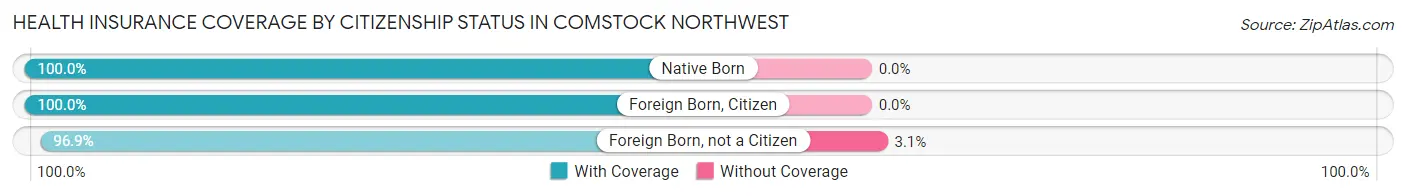
| Citizenship Status | With Coverage | Without Coverage |
| Native Born | 336 (100.0%) | 0 (0.0%) |
| Foreign Born, Citizen | 437 (100.0%) | 0 (0.0%) |
| Foreign Born, not a Citizen | 628 (96.9%) | 20 (3.1%) |
Health Insurance Coverage by Household Income in Comstock Northwest
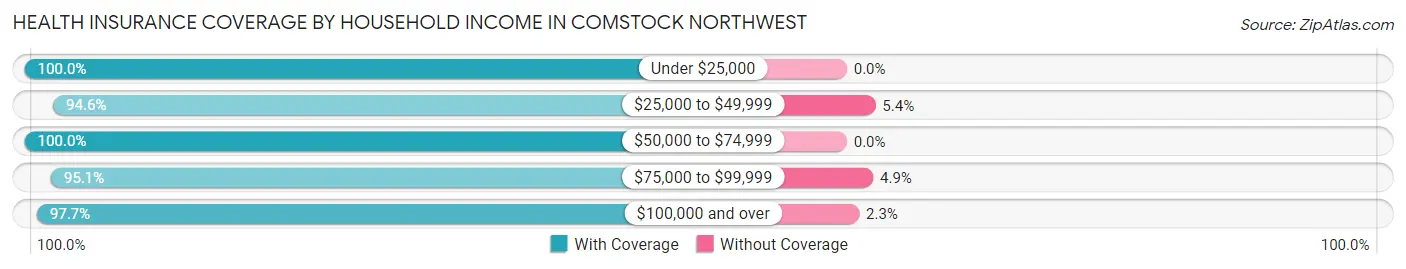
| Household Income | With Coverage | Without Coverage |
| Under $25,000 | 350 (100.0%) | 0 (0.0%) |
| $25,000 to $49,999 | 794 (94.6%) | 45 (5.4%) |
| $50,000 to $74,999 | 1,043 (100.0%) | 0 (0.0%) |
| $75,000 to $99,999 | 1,254 (95.1%) | 65 (4.9%) |
| $100,000 and over | 1,530 (97.7%) | 36 (2.3%) |
Public vs Private Health Insurance Coverage by Age in Comstock Northwest
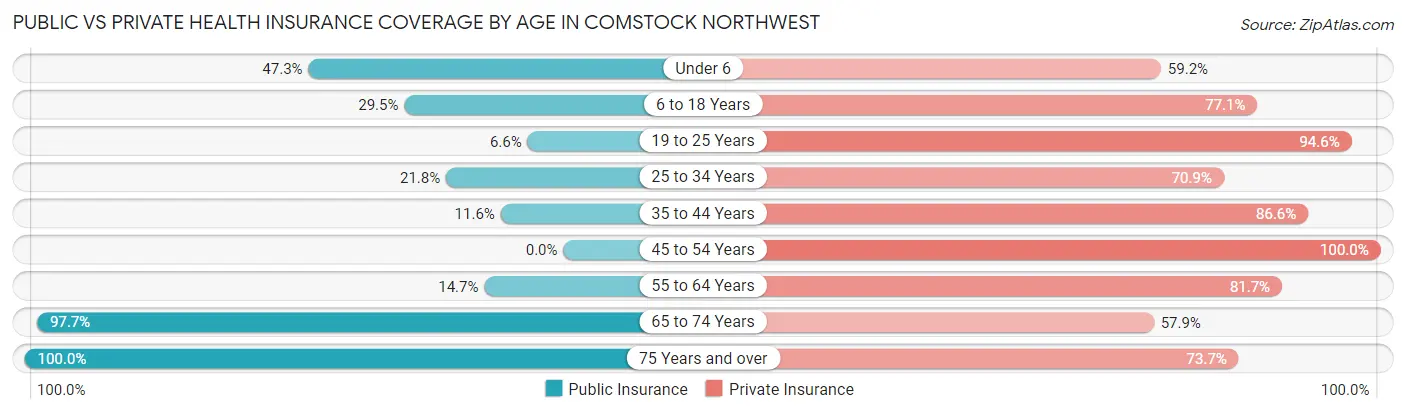
| Age Bracket | Public Insurance | Private Insurance |
| Under 6 | 159 (47.3%) | 199 (59.2%) |
| 6 to 18 Years | 129 (29.5%) | 337 (77.1%) |
| 19 to 25 Years | 43 (6.6%) | 613 (94.6%) |
| 25 to 34 Years | 172 (21.8%) | 560 (70.9%) |
| 35 to 44 Years | 90 (11.6%) | 669 (86.6%) |
| 45 to 54 Years | 0 (0.0%) | 239 (100.0%) |
| 55 to 64 Years | 125 (14.7%) | 696 (81.7%) |
| 65 to 74 Years | 594 (97.7%) | 352 (57.9%) |
| 75 Years and over | 448 (100.0%) | 330 (73.7%) |
| Total | 1,760 (34.3%) | 3,995 (77.9%) |
Disability Status by Sex by Age in Comstock Northwest
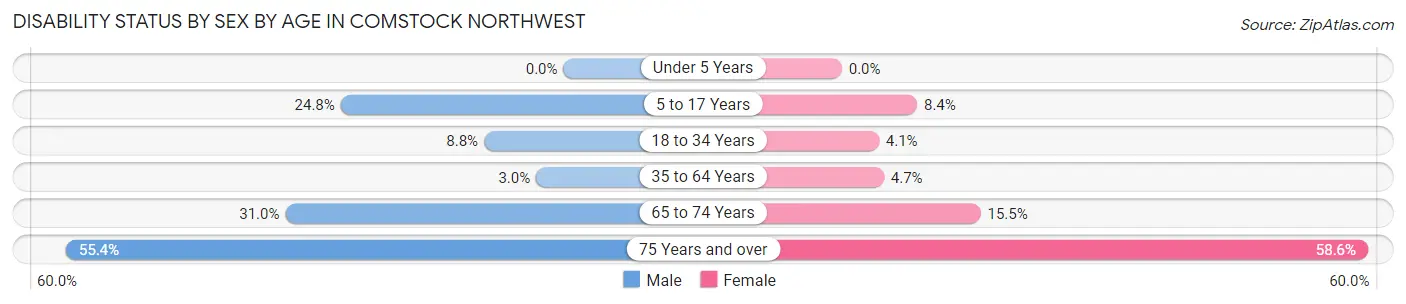
| Age Bracket | Male | Female |
| Under 5 Years | 0 (0.0%) | 0 (0.0%) |
| 5 to 17 Years | 33 (24.8%) | 30 (8.4%) |
| 18 to 34 Years | 75 (8.8%) | 25 (4.1%) |
| 35 to 64 Years | 30 (3.0%) | 41 (4.7%) |
| 65 to 74 Years | 70 (31.0%) | 59 (15.4%) |
| 75 Years and over | 77 (55.4%) | 181 (58.6%) |
Disability Class by Sex by Age in Comstock Northwest
Disability Class: Hearing Difficulty
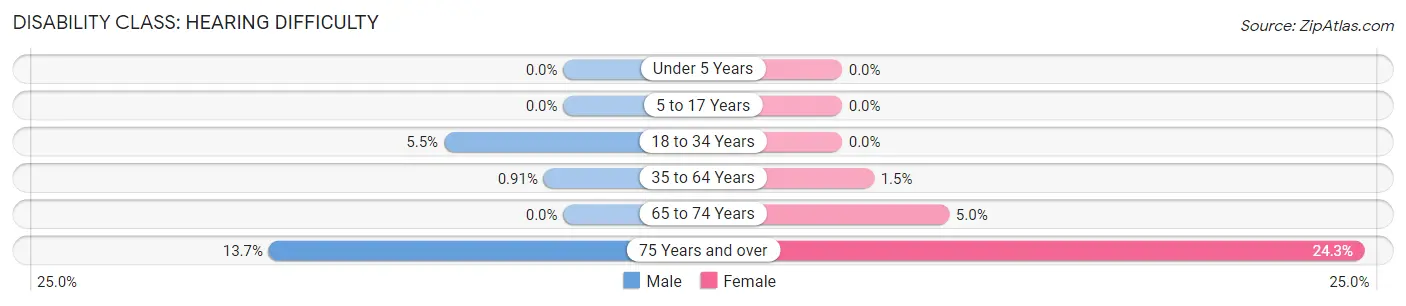
| Age Bracket | Male | Female |
| Under 5 Years | 0 (0.0%) | 0 (0.0%) |
| 5 to 17 Years | 0 (0.0%) | 0 (0.0%) |
| 18 to 34 Years | 47 (5.5%) | 0 (0.0%) |
| 35 to 64 Years | 9 (0.9%) | 13 (1.5%) |
| 65 to 74 Years | 0 (0.0%) | 19 (5.0%) |
| 75 Years and over | 19 (13.7%) | 75 (24.3%) |
Disability Class: Vision Difficulty
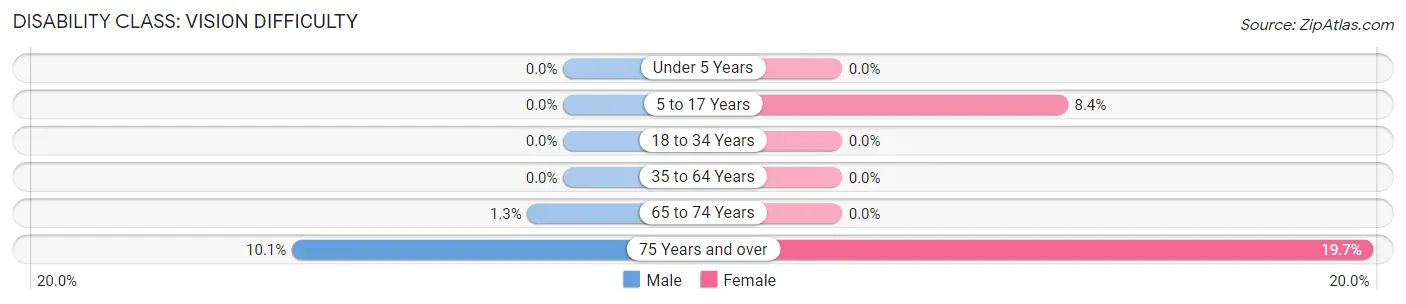
| Age Bracket | Male | Female |
| Under 5 Years | 0 (0.0%) | 0 (0.0%) |
| 5 to 17 Years | 0 (0.0%) | 30 (8.4%) |
| 18 to 34 Years | 0 (0.0%) | 0 (0.0%) |
| 35 to 64 Years | 0 (0.0%) | 0 (0.0%) |
| 65 to 74 Years | 3 (1.3%) | 0 (0.0%) |
| 75 Years and over | 14 (10.1%) | 61 (19.7%) |
Disability Class: Cognitive Difficulty
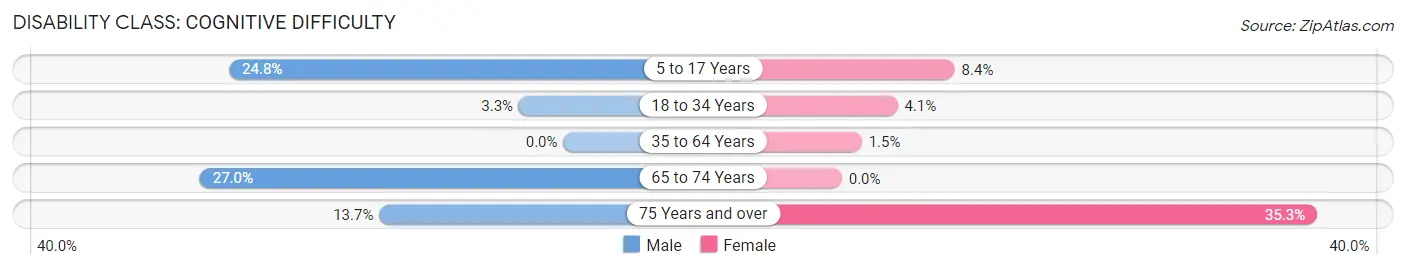
| Age Bracket | Male | Female |
| 5 to 17 Years | 33 (24.8%) | 30 (8.4%) |
| 18 to 34 Years | 28 (3.3%) | 25 (4.1%) |
| 35 to 64 Years | 0 (0.0%) | 13 (1.5%) |
| 65 to 74 Years | 61 (27.0%) | 0 (0.0%) |
| 75 Years and over | 19 (13.7%) | 109 (35.3%) |
Disability Class: Ambulatory Difficulty
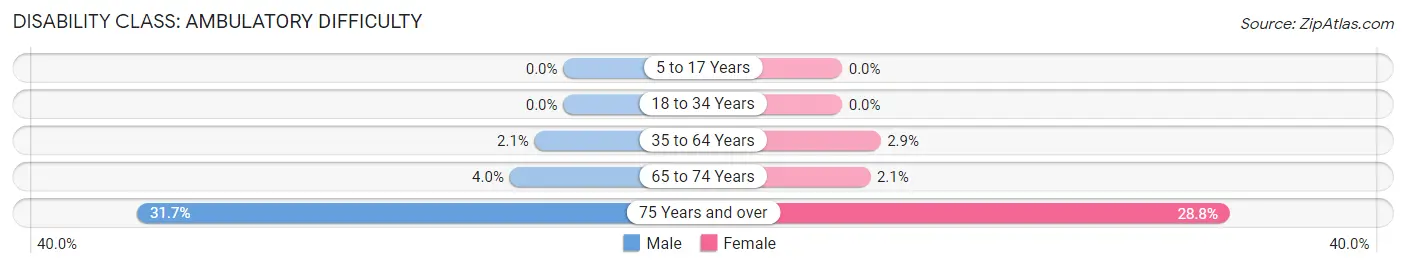
| Age Bracket | Male | Female |
| 5 to 17 Years | 0 (0.0%) | 0 (0.0%) |
| 18 to 34 Years | 0 (0.0%) | 0 (0.0%) |
| 35 to 64 Years | 21 (2.1%) | 25 (2.9%) |
| 65 to 74 Years | 9 (4.0%) | 8 (2.1%) |
| 75 Years and over | 44 (31.7%) | 89 (28.8%) |
Disability Class: Self-Care Difficulty
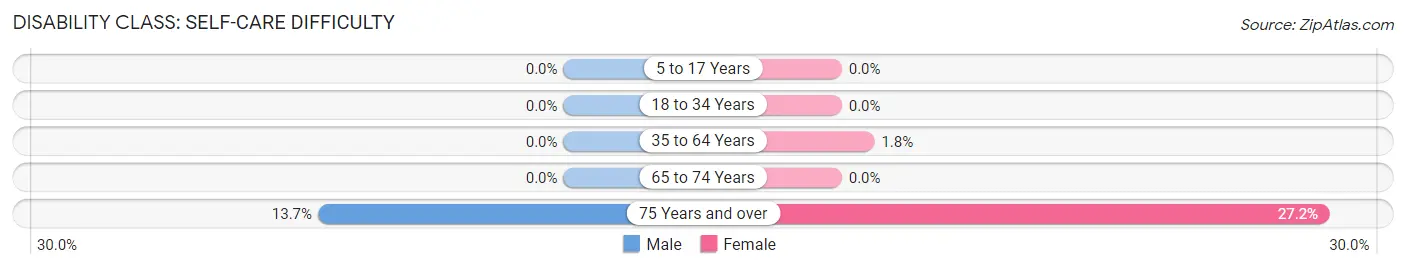
| Age Bracket | Male | Female |
| 5 to 17 Years | 0 (0.0%) | 0 (0.0%) |
| 18 to 34 Years | 0 (0.0%) | 0 (0.0%) |
| 35 to 64 Years | 0 (0.0%) | 16 (1.8%) |
| 65 to 74 Years | 0 (0.0%) | 0 (0.0%) |
| 75 Years and over | 19 (13.7%) | 84 (27.2%) |
Technology Access in Comstock Northwest
Computing Device Access in Comstock Northwest
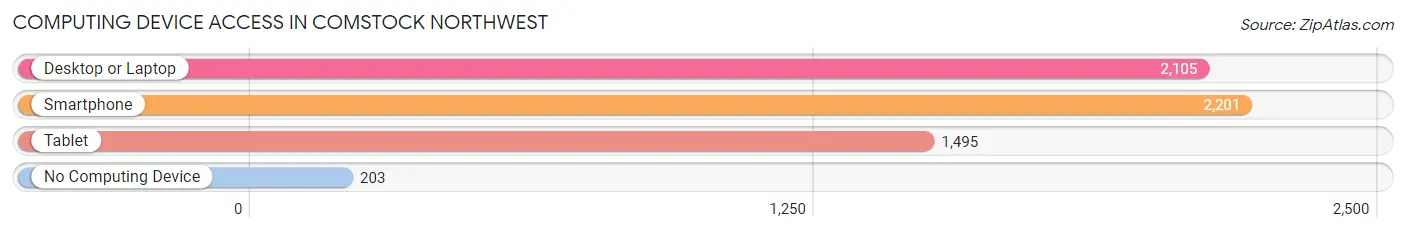
| Device Type | # Households | % Households |
| Desktop or Laptop | 2,105 | 80.6% |
| Smartphone | 2,201 | 84.3% |
| Tablet | 1,495 | 57.2% |
| No Computing Device | 203 | 7.8% |
| Total | 2,612 | 100.0% |
Internet Access in Comstock Northwest
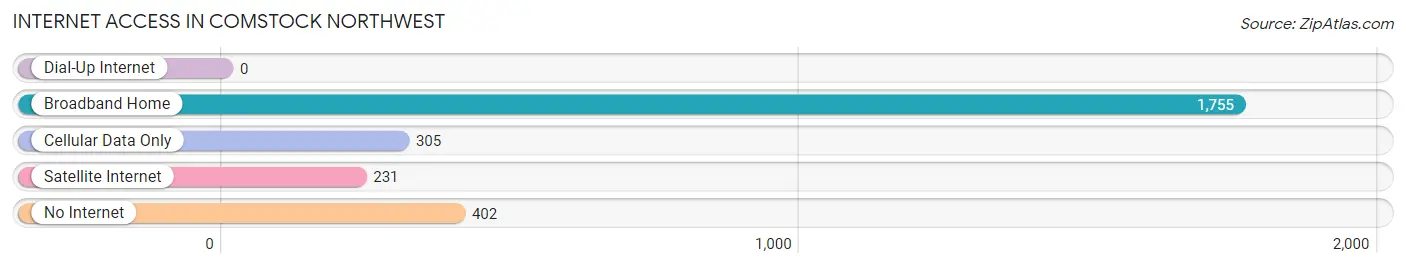
| Internet Type | # Households | % Households |
| Dial-Up Internet | 0 | 0.0% |
| Broadband Home | 1,755 | 67.2% |
| Cellular Data Only | 305 | 11.7% |
| Satellite Internet | 231 | 8.8% |
| No Internet | 402 | 15.4% |
| Total | 2,612 | 100.0% |
Comstock Northwest Summary
Comstock Northwest is a small unincorporated community located in Kalamazoo County, Michigan. It is situated in the southwestern corner of the county, just north of the city of Kalamazoo. The community is bordered by the cities of Kalamazoo, Portage, and Galesburg. Comstock Northwest is a rural area with a population of approximately 1,500 people.
History
Comstock Northwest was first settled in the early 1800s by settlers from New York and New England. The area was originally known as “Comstock’s Corners” after the first settler, John Comstock. The area was primarily agricultural, with many of the settlers growing corn, wheat, and other crops. In 1837, the area was officially incorporated as the Township of Comstock.
In the late 1800s, the area began to experience a period of growth and development. The railroad was extended to the area, and several businesses were established. The area also saw the construction of several churches, schools, and other public buildings.
In the early 1900s, Comstock Northwest experienced a period of decline. The railroad was abandoned, and many of the businesses closed. The population began to decline, and the area became increasingly rural.
Geography
Comstock Northwest is located in southwestern Kalamazoo County, Michigan. It is situated just north of the city of Kalamazoo. The area is bordered by the cities of Kalamazoo, Portage, and Galesburg.
The area is primarily rural, with rolling hills and open fields. The terrain is mostly flat, with some areas of higher elevation. The area is drained by several small creeks and streams, which flow into the Kalamazoo River.
Economy
Comstock Northwest is a primarily agricultural area. The area is home to several farms, which produce a variety of crops, including corn, wheat, and soybeans. The area also has several small businesses, including a few restaurants, a gas station, and a grocery store.
The area is also home to several manufacturing companies, including a plastics manufacturer and a metal fabrication company. The area is also home to several small businesses, including a few restaurants, a gas station, and a grocery store.
Demographics
As of the 2010 census, Comstock Northwest had a population of 1,500 people. The population is primarily white (94.7%), with a small percentage of African Americans (2.7%) and Hispanics (1.3%). The median household income is $45,000, and the median home value is $150,000.
Conclusion
Comstock Northwest is a small unincorporated community located in Kalamazoo County, Michigan. It is situated in the southwestern corner of the county, just north of the city of Kalamazoo. The area was first settled in the early 1800s, and has since become a primarily agricultural area. The population is primarily white, with a median household income of $45,000 and a median home value of $150,000. The area is home to several small businesses, including a few restaurants, a gas station, and a grocery store. The area is also home to several manufacturing companies, including a plastics manufacturer and a metal fabrication company.
Common Questions
What is Per Capita Income in Comstock Northwest?
Per Capita income in Comstock Northwest is $41,348.
What is the Median Family Income in Comstock Northwest?
Median Family Income in Comstock Northwest is $88,691.
What is the Median Household income in Comstock Northwest?
Median Household Income in Comstock Northwest is $70,723.
What is Income or Wage Gap in Comstock Northwest?
Income or Wage Gap in Comstock Northwest is 28.0%.
Women in Comstock Northwest earn 72.0 cents for every dollar earned by a man.
What is Inequality or Gini Index in Comstock Northwest?
Inequality or Gini Index in Comstock Northwest is 0.37.
What is the Total Population of Comstock Northwest?
Total Population of Comstock Northwest is 5,131.
What is the Total Male Population of Comstock Northwest?
Total Male Population of Comstock Northwest is 2,506.
What is the Total Female Population of Comstock Northwest?
Total Female Population of Comstock Northwest is 2,625.
What is the Ratio of Males per 100 Females in Comstock Northwest?
There are 95.47 Males per 100 Females in Comstock Northwest.
What is the Ratio of Females per 100 Males in Comstock Northwest?
There are 104.75 Females per 100 Males in Comstock Northwest.
What is the Median Population Age in Comstock Northwest?
Median Population Age in Comstock Northwest is 38.2 Years.
What is the Average Family Size in Comstock Northwest
Average Family Size in Comstock Northwest is 2.9 People.
What is the Average Household Size in Comstock Northwest
Average Household Size in Comstock Northwest is 2.0 People.
How Large is the Labor Force in Comstock Northwest?
There are 3,065 People in the Labor Forcein in Comstock Northwest.
What is the Percentage of People in the Labor Force in Comstock Northwest?
69.6% of People are in the Labor Force in Comstock Northwest.
What is the Unemployment Rate in Comstock Northwest?
Unemployment Rate in Comstock Northwest is 3.0%.