Zip Codes with the Highest Percentage of Population with a Degree in Literature and Languages in Connecticut
RELATED REPORTS & OPTIONS
Literature and Languages
Connecticut
Compare Zip Codes
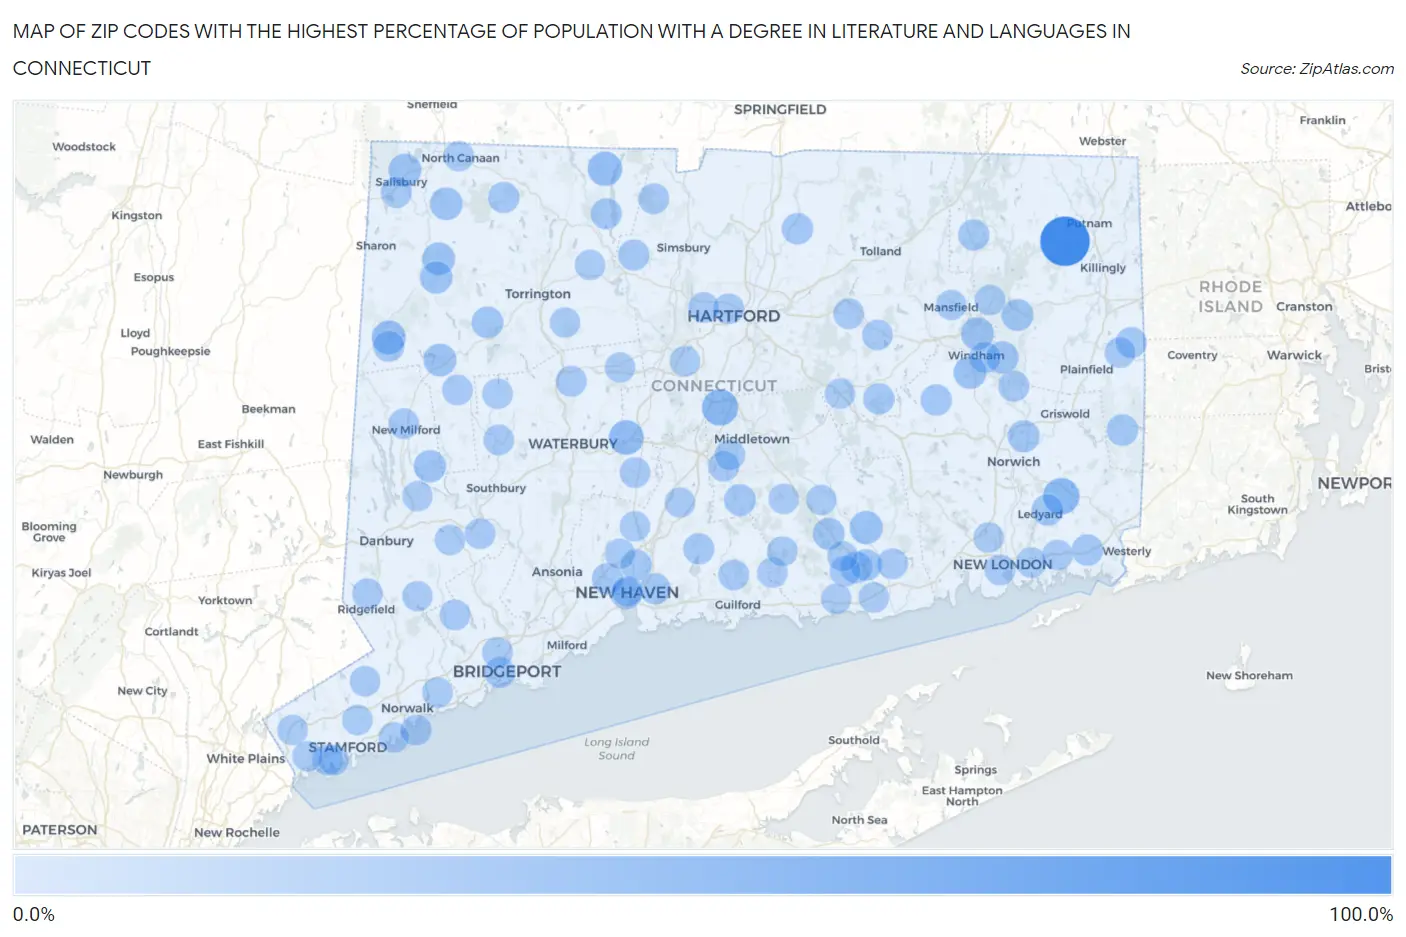
Map of Zip Codes with the Highest Percentage of Population with a Degree in Literature and Languages in Connecticut
0.0%
100.0%
Zip Codes with the Highest Percentage of Population with a Degree in Literature and Languages in Connecticut
| Zip Code | % Graduates | vs State | vs National | |
| 1. | 06258 | 100.0% | 6.1%(+93.9)#1 | 4.4%(+95.6)#13 |
| 2. | 06338 | 35.7% | 6.1%(+29.6)#2 | 4.4%(+31.3)#143 |
| 3. | 06023 | 34.4% | 6.1%(+28.3)#3 | 4.4%(+30.0)#152 |
| 4. | 06444 | 27.4% | 6.1%(+21.3)#4 | 4.4%(+23.0)#245 |
| 5. | 06091 | 26.4% | 6.1%(+20.3)#5 | 4.4%(+22.0)#270 |
| 6. | 06757 | 23.4% | 6.1%(+17.2)#6 | 4.4%(+19.0)#350 |
| 7. | 06439 | 20.0% | 6.1%(+13.9)#7 | 4.4%(+15.6)#482 |
| 8. | 06777 | 18.7% | 6.1%(+12.6)#8 | 4.4%(+14.3)#537 |
| 9. | 06256 | 18.6% | 6.1%(+12.5)#9 | 4.4%(+14.2)#540 |
| 10. | 06068 | 18.5% | 6.1%(+12.4)#10 | 4.4%(+14.1)#546 |
| 11. | 06796 | 18.1% | 6.1%(+12.0)#11 | 4.4%(+13.7)#573 |
| 12. | 06031 | 17.7% | 6.1%(+11.6)#12 | 4.4%(+13.3)#588 |
| 13. | 06266 | 17.5% | 6.1%(+11.4)#13 | 4.4%(+13.1)#600 |
| 14. | 06264 | 16.7% | 6.1%(+10.5)#14 | 4.4%(+12.3)#656 |
| 15. | 06753 | 16.7% | 6.1%(+10.5)#15 | 4.4%(+12.3)#662 |
| 16. | 06752 | 15.9% | 6.1%(+9.82)#16 | 4.4%(+11.5)#727 |
| 17. | 06380 | 15.0% | 6.1%(+8.86)#17 | 4.4%(+10.6)#818 |
| 18. | 06247 | 14.1% | 6.1%(+7.98)#18 | 4.4%(+9.69)#915 |
| 19. | 06412 | 13.7% | 6.1%(+7.54)#19 | 4.4%(+9.25)#955 |
| 20. | 06759 | 13.7% | 6.1%(+7.53)#20 | 4.4%(+9.24)#956 |
| 21. | 06422 | 13.4% | 6.1%(+7.24)#21 | 4.4%(+8.95)#1,000 |
| 22. | 06409 | 13.2% | 6.1%(+7.08)#22 | 4.4%(+8.79)#1,022 |
| 23. | 06384 | 12.7% | 6.1%(+6.57)#23 | 4.4%(+8.28)#1,101 |
| 24. | 06378 | 12.3% | 6.1%(+6.17)#24 | 4.4%(+7.88)#1,172 |
| 25. | 06339 | 12.1% | 6.1%(+5.94)#25 | 4.4%(+7.65)#1,211 |
| 26. | 06426 | 12.0% | 6.1%(+5.89)#26 | 4.4%(+7.60)#1,222 |
| 27. | 06280 | 12.0% | 6.1%(+5.84)#27 | 4.4%(+7.55)#1,229 |
| 28. | 06249 | 11.7% | 6.1%(+5.54)#28 | 4.4%(+7.24)#1,300 |
| 29. | 06016 | 11.6% | 6.1%(+5.49)#29 | 4.4%(+7.20)#1,310 |
| 30. | 06515 | 11.5% | 6.1%(+5.37)#30 | 4.4%(+7.08)#1,335 |
| 31. | 06058 | 11.0% | 6.1%(+4.86)#31 | 4.4%(+6.57)#1,483 |
| 32. | 06278 | 10.8% | 6.1%(+4.66)#32 | 4.4%(+6.36)#1,533 |
| 33. | 06517 | 10.7% | 6.1%(+4.55)#33 | 4.4%(+6.25)#1,569 |
| 34. | 06019 | 10.5% | 6.1%(+4.43)#34 | 4.4%(+6.14)#1,612 |
| 35. | 06510 | 10.4% | 6.1%(+4.26)#35 | 4.4%(+5.97)#1,678 |
| 36. | 06472 | 10.3% | 6.1%(+4.18)#36 | 4.4%(+5.89)#1,713 |
| 37. | 06231 | 10.3% | 6.1%(+4.17)#37 | 4.4%(+5.88)#1,717 |
| 38. | 06377 | 10.2% | 6.1%(+4.12)#38 | 4.4%(+5.82)#1,734 |
| 39. | 06604 | 10.1% | 6.1%(+3.93)#39 | 4.4%(+5.64)#1,796 |
| 40. | 06513 | 10.0% | 6.1%(+3.88)#40 | 4.4%(+5.59)#1,837 |
| 41. | 06063 | 10.0% | 6.1%(+3.87)#41 | 4.4%(+5.58)#1,839 |
| 42. | 06039 | 10.0% | 6.1%(+3.84)#42 | 4.4%(+5.55)#1,852 |
| 43. | 06785 | 9.8% | 6.1%(+3.63)#43 | 4.4%(+5.34)#1,934 |
| 44. | 06782 | 9.7% | 6.1%(+3.54)#44 | 4.4%(+5.24)#1,974 |
| 45. | 06330 | 9.5% | 6.1%(+3.40)#45 | 4.4%(+5.11)#2,038 |
| 46. | 06437 | 9.3% | 6.1%(+3.23)#46 | 4.4%(+4.94)#2,122 |
| 47. | 06354 | 9.3% | 6.1%(+3.19)#47 | 4.4%(+4.89)#2,142 |
| 48. | 06371 | 9.3% | 6.1%(+3.15)#48 | 4.4%(+4.86)#2,168 |
| 49. | 06090 | 9.2% | 6.1%(+3.04)#49 | 4.4%(+4.75)#2,234 |
| 50. | 06606 | 9.0% | 6.1%(+2.91)#50 | 4.4%(+4.62)#2,303 |
| 51. | 06442 | 8.9% | 6.1%(+2.83)#51 | 4.4%(+4.54)#2,344 |
| 52. | 06320 | 8.9% | 6.1%(+2.82)#52 | 4.4%(+4.53)#2,353 |
| 53. | 06798 | 8.7% | 6.1%(+2.58)#53 | 4.4%(+4.29)#2,480 |
| 54. | 06105 | 8.6% | 6.1%(+2.52)#54 | 4.4%(+4.23)#2,520 |
| 55. | 06877 | 8.4% | 6.1%(+2.28)#55 | 4.4%(+3.99)#2,678 |
| 56. | 06043 | 8.4% | 6.1%(+2.24)#56 | 4.4%(+3.95)#2,706 |
| 57. | 06117 | 8.3% | 6.1%(+2.23)#57 | 4.4%(+3.94)#2,711 |
| 58. | 06855 | 8.3% | 6.1%(+2.21)#58 | 4.4%(+3.91)#2,742 |
| 59. | 06232 | 8.3% | 6.1%(+2.16)#59 | 4.4%(+3.86)#2,763 |
| 60. | 06455 | 8.3% | 6.1%(+2.13)#60 | 4.4%(+3.84)#2,779 |
| 61. | 06840 | 8.2% | 6.1%(+2.07)#61 | 4.4%(+3.78)#2,827 |
| 62. | 06482 | 8.2% | 6.1%(+2.05)#62 | 4.4%(+3.75)#2,850 |
| 63. | 06612 | 8.1% | 6.1%(+1.99)#63 | 4.4%(+3.70)#2,899 |
| 64. | 06853 | 8.1% | 6.1%(+1.98)#64 | 4.4%(+3.69)#2,907 |
| 65. | 06751 | 8.1% | 6.1%(+1.94)#65 | 4.4%(+3.65)#2,936 |
| 66. | 06776 | 8.0% | 6.1%(+1.93)#66 | 4.4%(+3.64)#2,947 |
| 67. | 06410 | 8.0% | 6.1%(+1.88)#67 | 4.4%(+3.59)#2,987 |
| 68. | 06880 | 8.0% | 6.1%(+1.86)#68 | 4.4%(+3.56)#3,005 |
| 69. | 06793 | 8.0% | 6.1%(+1.85)#69 | 4.4%(+3.56)#3,009 |
| 70. | 06355 | 7.8% | 6.1%(+1.72)#70 | 4.4%(+3.43)#3,124 |
| 71. | 06511 | 7.8% | 6.1%(+1.69)#71 | 4.4%(+3.40)#3,149 |
| 72. | 06475 | 7.7% | 6.1%(+1.62)#72 | 4.4%(+3.33)#3,218 |
| 73. | 06470 | 7.7% | 6.1%(+1.61)#73 | 4.4%(+3.32)#3,222 |
| 74. | 06907 | 7.7% | 6.1%(+1.60)#74 | 4.4%(+3.31)#3,232 |
| 75. | 06481 | 7.7% | 6.1%(+1.54)#75 | 4.4%(+3.25)#3,296 |
| 76. | 06831 | 7.6% | 6.1%(+1.49)#76 | 4.4%(+3.20)#3,343 |
| 77. | 06441 | 7.6% | 6.1%(+1.46)#77 | 4.4%(+3.17)#3,370 |
| 78. | 06443 | 7.6% | 6.1%(+1.45)#78 | 4.4%(+3.16)#3,379 |
| 79. | 06878 | 7.5% | 6.1%(+1.35)#79 | 4.4%(+3.06)#3,474 |
| 80. | 06518 | 7.4% | 6.1%(+1.31)#80 | 4.4%(+3.01)#3,522 |
| 81. | 06018 | 7.4% | 6.1%(+1.26)#81 | 4.4%(+2.96)#3,576 |
| 82. | 06340 | 7.4% | 6.1%(+1.25)#82 | 4.4%(+2.96)#3,586 |
| 83. | 06235 | 7.4% | 6.1%(+1.25)#83 | 4.4%(+2.95)#3,590 |
| 84. | 06870 | 7.3% | 6.1%(+1.20)#84 | 4.4%(+2.91)#3,639 |
| 85. | 06447 | 7.3% | 6.1%(+1.17)#85 | 4.4%(+2.88)#3,666 |
| 86. | 06498 | 7.2% | 6.1%(+1.05)#86 | 4.4%(+2.76)#3,781 |
| 87. | 06830 | 7.1% | 6.1%(+0.995)#87 | 4.4%(+2.70)#3,851 |
| 88. | 06053 | 7.1% | 6.1%(+0.966)#88 | 4.4%(+2.67)#3,894 |
| 89. | 06417 | 7.1% | 6.1%(+0.965)#89 | 4.4%(+2.67)#3,896 |
| 90. | 06438 | 7.1% | 6.1%(+0.957)#90 | 4.4%(+2.66)#3,914 |
| 91. | 06419 | 7.1% | 6.1%(+0.953)#91 | 4.4%(+2.66)#3,922 |
| 92. | 06791 | 7.1% | 6.1%(+0.940)#92 | 4.4%(+2.65)#3,936 |
| 93. | 06010 | 7.0% | 6.1%(+0.862)#93 | 4.4%(+2.57)#4,017 |
| 94. | 06492 | 7.0% | 6.1%(+0.839)#94 | 4.4%(+2.55)#4,043 |
| 95. | 06250 | 6.9% | 6.1%(+0.832)#95 | 4.4%(+2.54)#4,056 |
| 96. | 06896 | 6.9% | 6.1%(+0.809)#96 | 4.4%(+2.52)#4,077 |
| 97. | 06804 | 6.9% | 6.1%(+0.808)#97 | 4.4%(+2.52)#4,080 |
| 98. | 06514 | 6.9% | 6.1%(+0.799)#98 | 4.4%(+2.51)#4,090 |
| 99. | 06375 | 6.9% | 6.1%(+0.768)#99 | 4.4%(+2.48)#4,128 |
| 100. | 06057 | 6.9% | 6.1%(+0.761)#100 | 4.4%(+2.47)#4,137 |
Common Questions
What are the Top 10 Zip Codes with the Highest Percentage of Population with a Degree in Literature and Languages in Connecticut?
Top 10 Zip Codes with the Highest Percentage of Population with a Degree in Literature and Languages in Connecticut are:
What zip code has the Highest Percentage of Population with a Degree in Literature and Languages in Connecticut?
06258 has the Highest Percentage of Population with a Degree in Literature and Languages in Connecticut with 100.0%.
What is the Percentage of Population with a Degree in Literature and Languages in the State of Connecticut?
Percentage of Population with a Degree in Literature and Languages in Connecticut is 6.1%.
What is the Percentage of Population with a Degree in Literature and Languages in the United States?
Percentage of Population with a Degree in Literature and Languages in the United States is 4.4%.