Virginia Beach, VA Map & Demographics
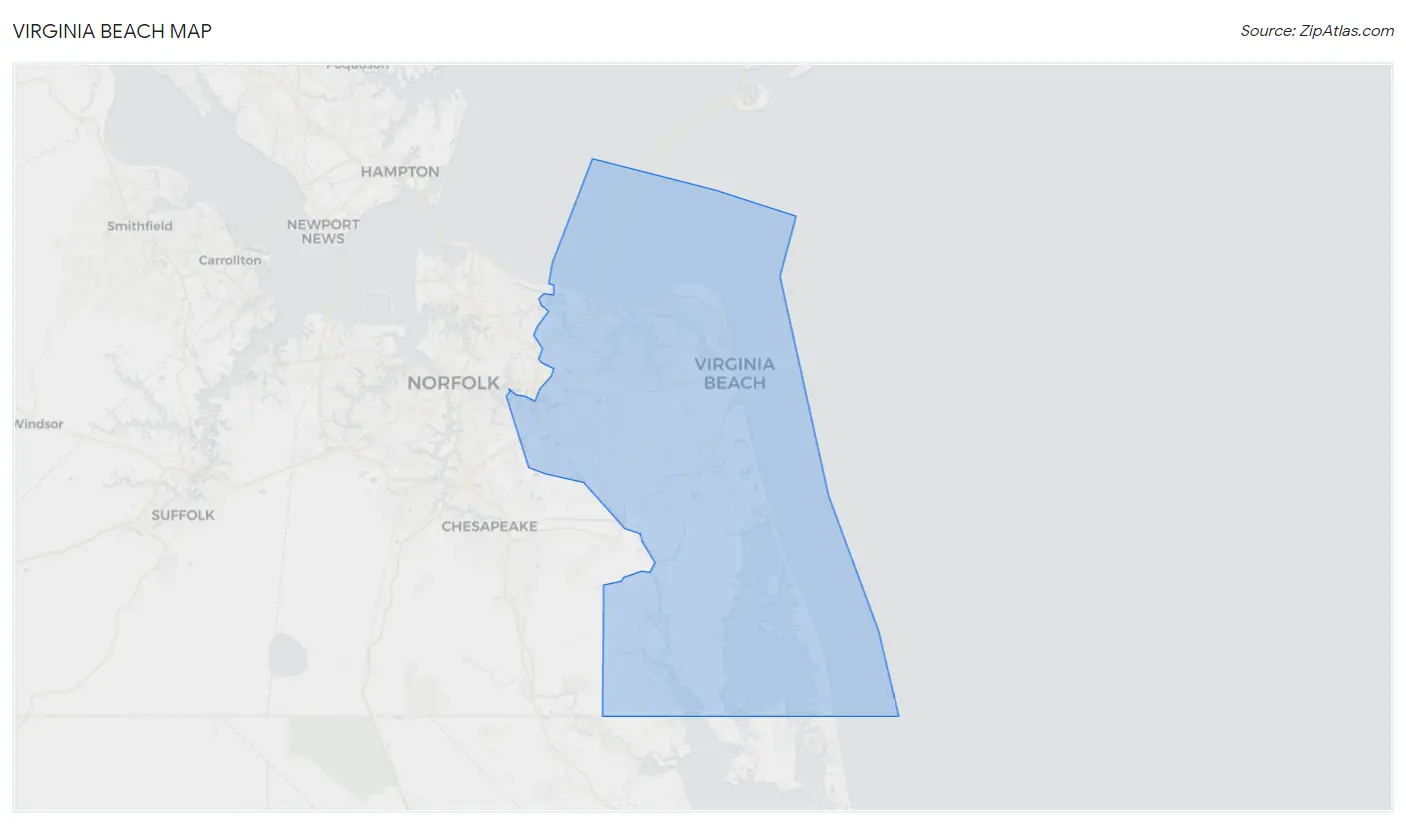
Virginia Beach Map
Virginia Beach Overview
$45,320
PER CAPITA INCOME
$103,720
AVG FAMILY INCOME
$87,544
AVG HOUSEHOLD INCOME
28.7%
WAGE / INCOME GAP [ % ]
71.3¢/ $1
WAGE / INCOME GAP [ $ ]
$11,607
FAMILY INCOME DEFICIT
0.43
INEQUALITY / GINI INDEX
457,900
TOTAL POPULATION
225,616
MALE POPULATION
232,284
FEMALE POPULATION
97.13
MALES / 100 FEMALES
102.96
FEMALES / 100 MALES
37.1
MEDIAN AGE
3.0
AVG FAMILY SIZE
2.5
AVG HOUSEHOLD SIZE
256,203
LABOR FORCE [ PEOPLE ]
69.5%
PERCENT IN LABOR FORCE
4.3%
UNEMPLOYMENT RATE
Virginia Beach Zip Codes
Virginia Beach Area Codes
Income in Virginia Beach
Income Overview in Virginia Beach
Per Capita Income in Virginia Beach is $45,320, while median incomes of families and households are $103,720 and $87,544 respectively.
| Characteristic | Number | Measure |
| Per Capita Income | 457,900 | $45,320 |
| Median Family Income | 120,548 | $103,720 |
| Mean Family Income | 120,548 | $129,597 |
| Median Household Income | 178,915 | $87,544 |
| Mean Household Income | 178,915 | $113,388 |
| Income Deficit | 120,548 | $11,607 |
| Wage / Income Gap (%) | 457,900 | 28.67% |
| Wage / Income Gap ($) | 457,900 | 71.33¢ per $1 |
| Gini / Inequality Index | 457,900 | 0.43 |
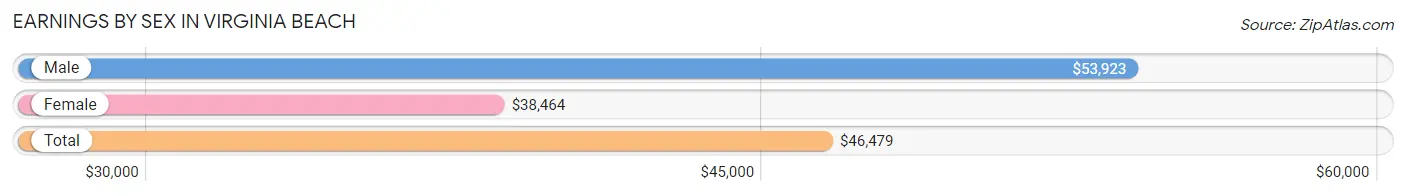
Earnings by Sex in Virginia Beach
Average Earnings in Virginia Beach are $46,479, $53,923 for men and $38,464 for women, a difference of 28.7%.
| Sex | Number | Average Earnings |
| Male | 140,367 (52.9%) | $53,923 |
| Female | 124,924 (47.1%) | $38,464 |
| Total | 265,291 (100.0%) | $46,479 |
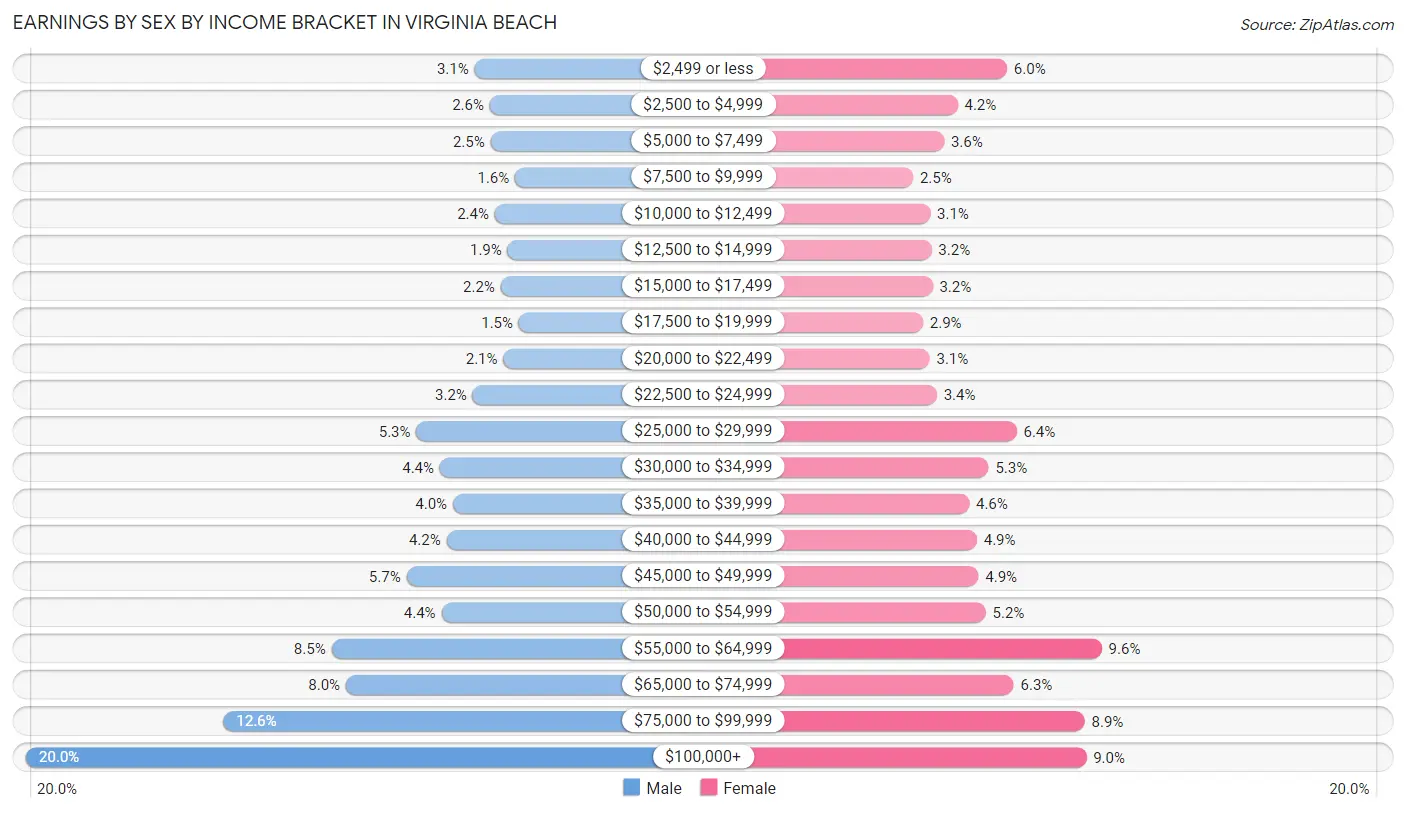
Earnings by Sex by Income Bracket in Virginia Beach
The most common earnings brackets in Virginia Beach are $100,000+ for men (28,004 | 20.0%) and $55,000 to $64,999 for women (11,927 | 9.6%).
| Income | Male | Female |
| $2,499 or less | 4,410 (3.1%) | 7,493 (6.0%) |
| $2,500 to $4,999 | 3,611 (2.6%) | 5,187 (4.2%) |
| $5,000 to $7,499 | 3,561 (2.5%) | 4,550 (3.6%) |
| $7,500 to $9,999 | 2,269 (1.6%) | 3,095 (2.5%) |
| $10,000 to $12,499 | 3,345 (2.4%) | 3,900 (3.1%) |
| $12,500 to $14,999 | 2,671 (1.9%) | 3,955 (3.2%) |
| $15,000 to $17,499 | 3,037 (2.2%) | 4,006 (3.2%) |
| $17,500 to $19,999 | 2,084 (1.5%) | 3,555 (2.9%) |
| $20,000 to $22,499 | 2,890 (2.1%) | 3,878 (3.1%) |
| $22,500 to $24,999 | 4,512 (3.2%) | 4,205 (3.4%) |
| $25,000 to $29,999 | 7,468 (5.3%) | 7,941 (6.4%) |
| $30,000 to $34,999 | 6,229 (4.4%) | 6,633 (5.3%) |
| $35,000 to $39,999 | 5,541 (4.0%) | 5,720 (4.6%) |
| $40,000 to $44,999 | 5,875 (4.2%) | 6,081 (4.9%) |
| $45,000 to $49,999 | 7,990 (5.7%) | 6,158 (4.9%) |
| $50,000 to $54,999 | 6,148 (4.4%) | 6,496 (5.2%) |
| $55,000 to $64,999 | 11,928 (8.5%) | 11,927 (9.6%) |
| $65,000 to $74,999 | 11,173 (8.0%) | 7,809 (6.2%) |
| $75,000 to $99,999 | 17,621 (12.6%) | 11,134 (8.9%) |
| $100,000+ | 28,004 (20.0%) | 11,201 (9.0%) |
| Total | 140,367 (100.0%) | 124,924 (100.0%) |
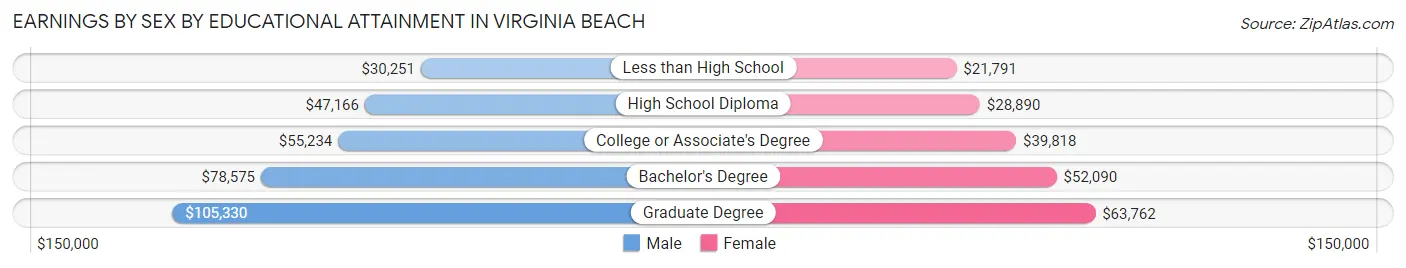
Earnings by Sex by Educational Attainment in Virginia Beach
Average earnings in Virginia Beach are $60,523 for men and $44,950 for women, a difference of 25.7%. Men with an educational attainment of graduate degree enjoy the highest average annual earnings of $105,330, while those with less than high school education earn the least with $30,251. Women with an educational attainment of graduate degree earn the most with the average annual earnings of $63,762, while those with less than high school education have the smallest earnings of $21,791.
| Educational Attainment | Male Income | Female Income |
| Less than High School | $30,251 | $21,791 |
| High School Diploma | $47,166 | $28,890 |
| College or Associate's Degree | $55,234 | $39,818 |
| Bachelor's Degree | $78,575 | $52,090 |
| Graduate Degree | $105,330 | $63,762 |
| Total | $60,523 | $44,950 |
Family Income in Virginia Beach
Family Income Brackets in Virginia Beach
According to the Virginia Beach family income data, there are 29,173 families falling into the $100,000 to $149,999 income range, which is the most common income bracket and makes up 24.2% of all families. Conversely, the $10,000 to $14,999 income bracket is the least frequent group with only 1,326 families (1.1%) belonging to this category.
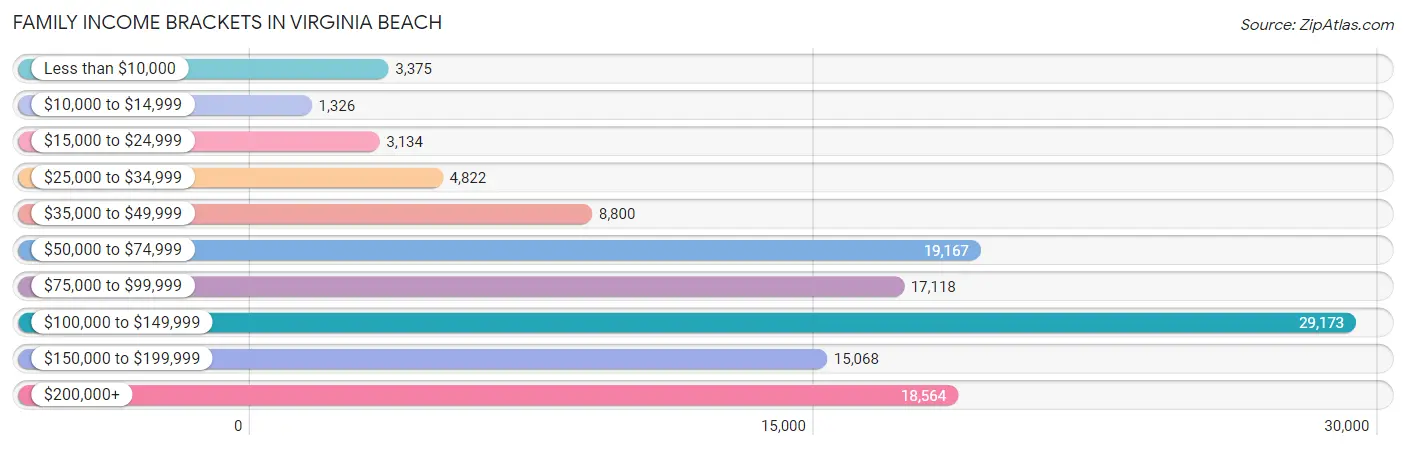
| Income Bracket | # Families | % Families |
| Less than $10,000 | 3,375 | 2.8% |
| $10,000 to $14,999 | 1,326 | 1.1% |
| $15,000 to $24,999 | 3,134 | 2.6% |
| $25,000 to $34,999 | 4,822 | 4.0% |
| $35,000 to $49,999 | 8,800 | 7.3% |
| $50,000 to $74,999 | 19,167 | 15.9% |
| $75,000 to $99,999 | 17,118 | 14.2% |
| $100,000 to $149,999 | 29,173 | 24.2% |
| $150,000 to $199,999 | 15,068 | 12.5% |
| $200,000+ | 18,564 | 15.4% |
Family Income by Famaliy Size in Virginia Beach
5-person families (9,265 | 7.7%) account for the highest median family income in Virginia Beach with $125,055 per family, while 2-person families (56,550 | 46.9%) have the highest median income of $45,690 per family member.
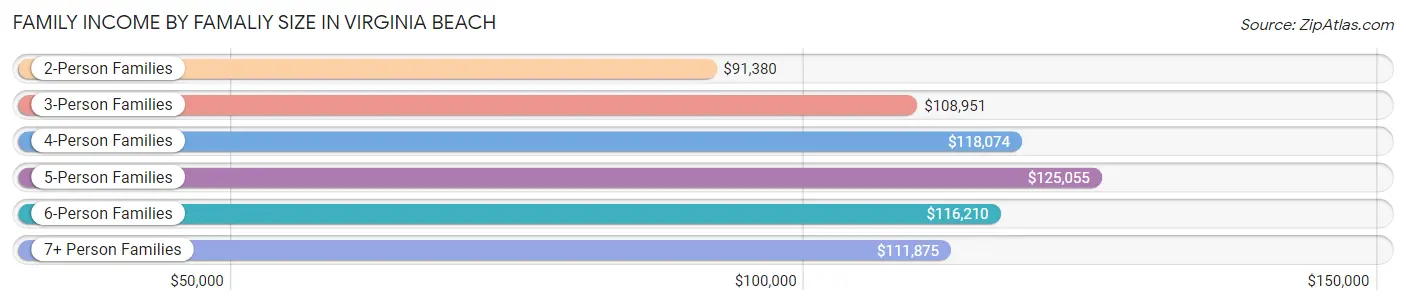
| Income Bracket | # Families | Median Income |
| 2-Person Families | 56,550 (46.9%) | $91,380 |
| 3-Person Families | 29,384 (24.4%) | $108,951 |
| 4-Person Families | 21,721 (18.0%) | $118,074 |
| 5-Person Families | 9,265 (7.7%) | $125,055 |
| 6-Person Families | 2,711 (2.2%) | $116,210 |
| 7+ Person Families | 917 (0.8%) | $111,875 |
| Total | 120,548 (100.0%) | $103,720 |
Family Income by Number of Earners in Virginia Beach
The median family income in Virginia Beach is $103,720, with families comprising 3+ earners (13,438) having the highest median family income of $148,777, while families with no earners (13,608) have the lowest median family income of $65,798, accounting for 11.2% and 11.3% of families, respectively.
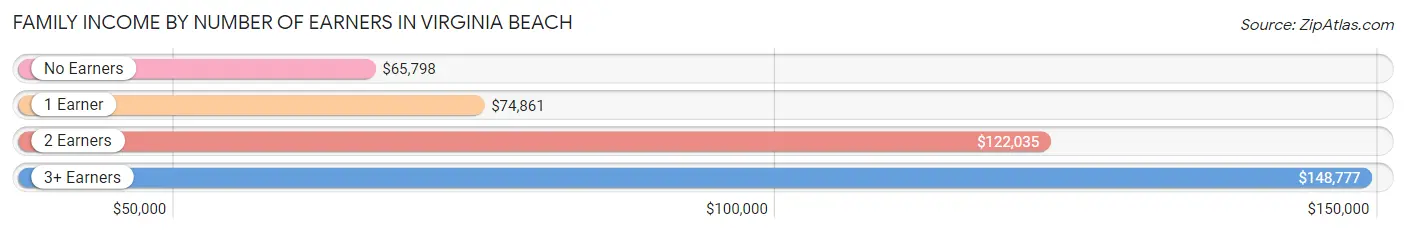
| Number of Earners | # Families | Median Income |
| No Earners | 13,608 (11.3%) | $65,798 |
| 1 Earner | 38,366 (31.8%) | $74,861 |
| 2 Earners | 55,136 (45.7%) | $122,035 |
| 3+ Earners | 13,438 (11.2%) | $148,777 |
| Total | 120,548 (100.0%) | $103,720 |
Household Income in Virginia Beach
Household Income Brackets in Virginia Beach
With 37,751 households falling in the category, the $100,000 to $149,999 income range is the most frequent in Virginia Beach, accounting for 21.1% of all households. In contrast, only 3,578 households (2.0%) fall into the $10,000 to $14,999 income bracket, making it the least populous group.
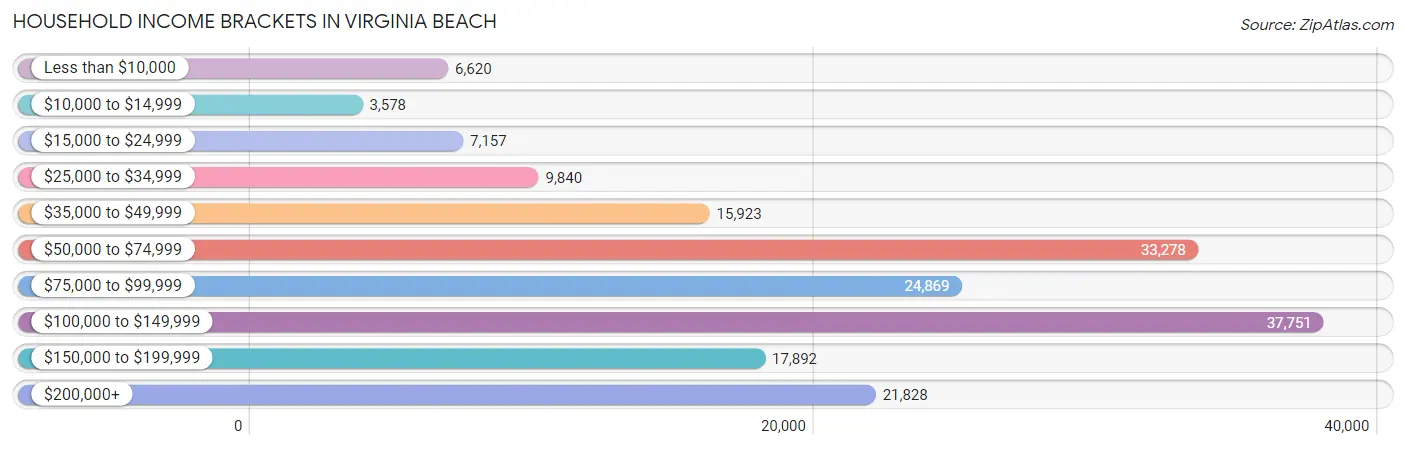
| Income Bracket | # Households | % Households |
| Less than $10,000 | 6,620 | 3.7% |
| $10,000 to $14,999 | 3,578 | 2.0% |
| $15,000 to $24,999 | 7,157 | 4.0% |
| $25,000 to $34,999 | 9,840 | 5.5% |
| $35,000 to $49,999 | 15,923 | 8.9% |
| $50,000 to $74,999 | 33,278 | 18.6% |
| $75,000 to $99,999 | 24,869 | 13.9% |
| $100,000 to $149,999 | 37,751 | 21.1% |
| $150,000 to $199,999 | 17,892 | 10.0% |
| $200,000+ | 21,828 | 12.2% |
Household Income by Householder Age in Virginia Beach
The median household income in Virginia Beach is $87,544, with the highest median household income of $107,485 found in the 45 to 64 years age bracket for the primary householder. A total of 63,000 households (35.2%) fall into this category. Meanwhile, the 15 to 24 years age bracket for the primary householder has the lowest median household income of $53,316, with 7,113 households (4.0%) in this group.
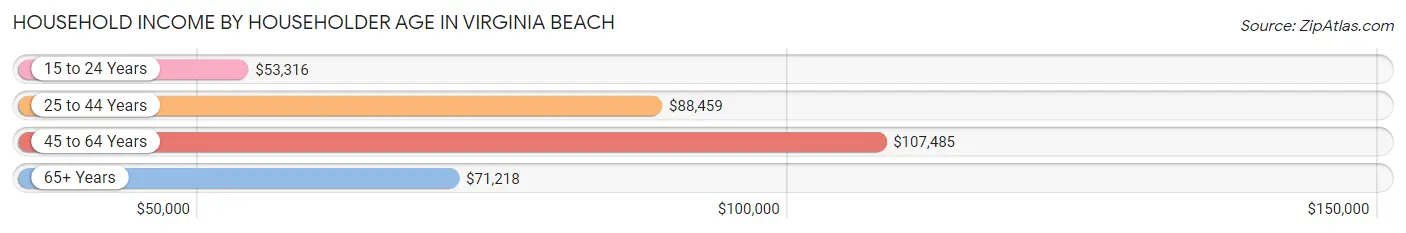
| Income Bracket | # Households | Median Income |
| 15 to 24 Years | 7,113 (4.0%) | $53,316 |
| 25 to 44 Years | 66,130 (37.0%) | $88,459 |
| 45 to 64 Years | 63,000 (35.2%) | $107,485 |
| 65+ Years | 42,672 (23.8%) | $71,218 |
| Total | 178,915 (100.0%) | $87,544 |
Poverty in Virginia Beach
Income Below Poverty by Sex and Age in Virginia Beach
With 7.0% poverty level for males and 9.0% for females among the residents of Virginia Beach, 6 to 11 year old males and 15 year old females are the most vulnerable to poverty, with 2,235 males (13.1%) and 522 females (19.0%) in their respective age groups living below the poverty level.
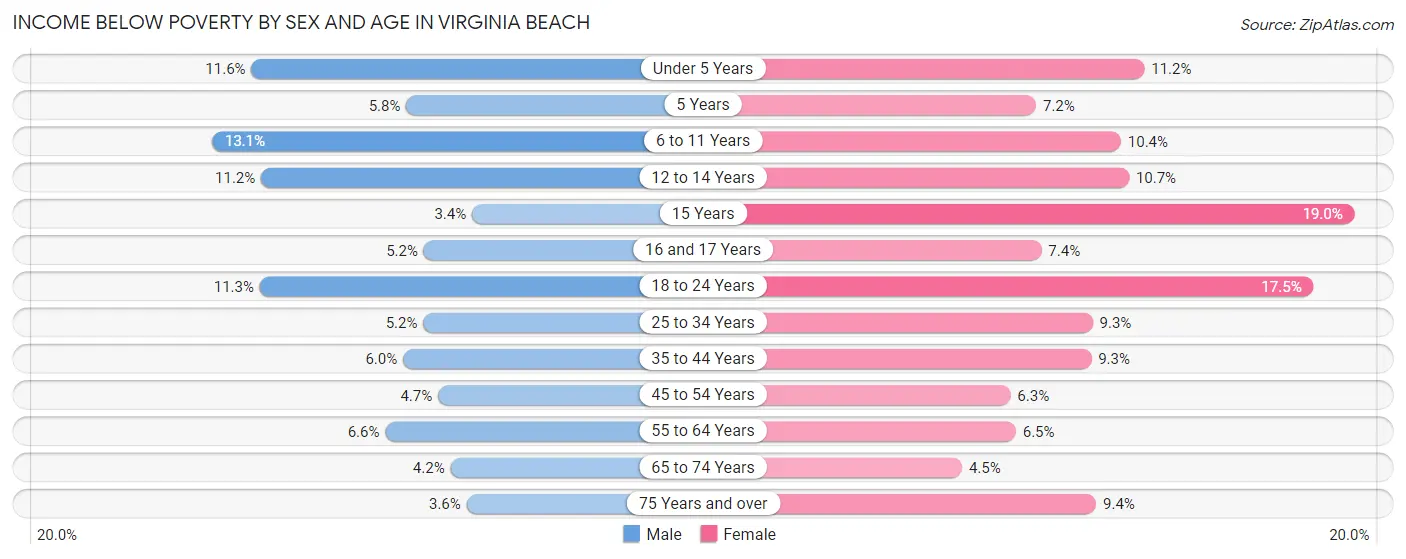
| Age Bracket | Male | Female |
| Under 5 Years | 1,613 (11.6%) | 1,479 (11.2%) |
| 5 Years | 149 (5.8%) | 177 (7.2%) |
| 6 to 11 Years | 2,235 (13.1%) | 1,601 (10.4%) |
| 12 to 14 Years | 1,003 (11.2%) | 982 (10.7%) |
| 15 Years | 84 (3.4%) | 522 (19.0%) |
| 16 and 17 Years | 315 (5.2%) | 405 (7.4%) |
| 18 to 24 Years | 2,087 (11.3%) | 3,098 (17.5%) |
| 25 to 34 Years | 1,891 (5.2%) | 3,297 (9.3%) |
| 35 to 44 Years | 1,866 (5.9%) | 2,900 (9.3%) |
| 45 to 54 Years | 1,221 (4.6%) | 1,760 (6.3%) |
| 55 to 64 Years | 1,791 (6.6%) | 1,939 (6.5%) |
| 65 to 74 Years | 766 (4.2%) | 984 (4.5%) |
| 75 Years and over | 392 (3.6%) | 1,528 (9.4%) |
| Total | 15,413 (7.0%) | 20,672 (9.0%) |
Income Above Poverty by Sex and Age in Virginia Beach
According to the poverty statistics in Virginia Beach, males aged 15 years and females aged 65 to 74 years are the age groups that are most secure financially, with 96.6% of males and 95.5% of females in these age groups living above the poverty line.
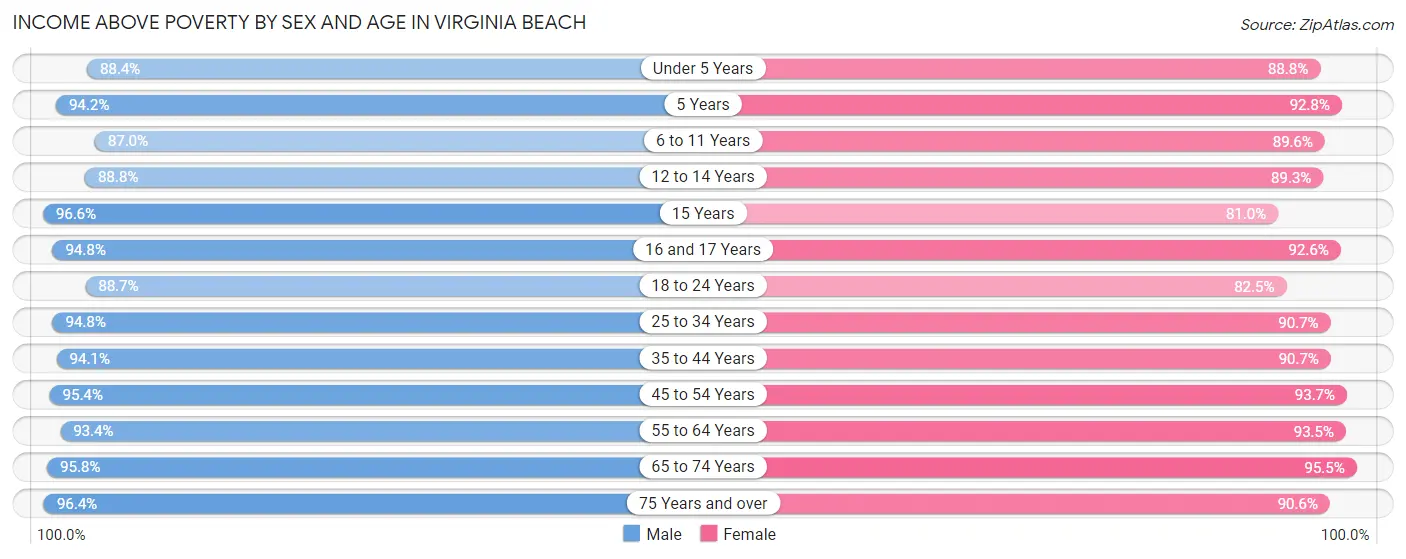
| Age Bracket | Male | Female |
| Under 5 Years | 12,317 (88.4%) | 11,691 (88.8%) |
| 5 Years | 2,406 (94.2%) | 2,279 (92.8%) |
| 6 to 11 Years | 14,888 (87.0%) | 13,849 (89.6%) |
| 12 to 14 Years | 7,935 (88.8%) | 8,227 (89.3%) |
| 15 Years | 2,396 (96.6%) | 2,219 (81.0%) |
| 16 and 17 Years | 5,771 (94.8%) | 5,061 (92.6%) |
| 18 to 24 Years | 16,425 (88.7%) | 14,592 (82.5%) |
| 25 to 34 Years | 34,450 (94.8%) | 32,104 (90.7%) |
| 35 to 44 Years | 29,495 (94.1%) | 28,418 (90.7%) |
| 45 to 54 Years | 25,024 (95.4%) | 26,340 (93.7%) |
| 55 to 64 Years | 25,292 (93.4%) | 28,097 (93.5%) |
| 65 to 74 Years | 17,532 (95.8%) | 21,059 (95.5%) |
| 75 Years and over | 10,516 (96.4%) | 14,665 (90.6%) |
| Total | 204,447 (93.0%) | 208,601 (91.0%) |
Income Below Poverty Among Married-Couple Families in Virginia Beach
The poverty statistics for married-couple families in Virginia Beach show that 2.6% or 2,300 of the total 88,961 families live below the poverty line. Families with 5 or more children have the highest poverty rate of 31.8%, comprising of 99 families. On the other hand, families with no children have the lowest poverty rate of 1.9%, which includes 951 families.
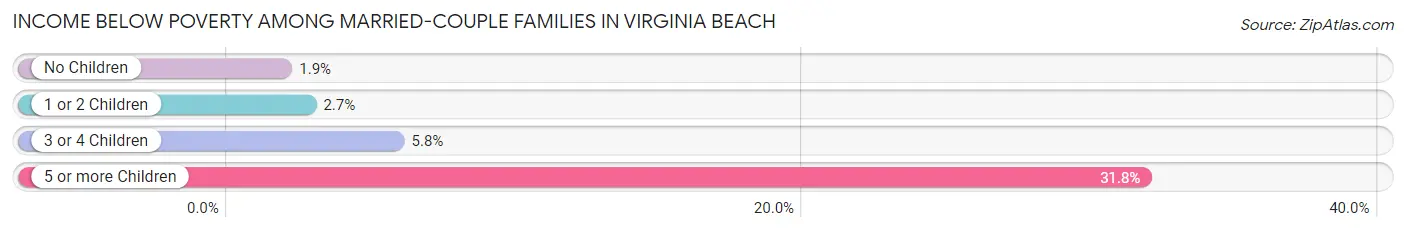
| Children | Above Poverty | Below Poverty |
| No Children | 49,340 (98.1%) | 951 (1.9%) |
| 1 or 2 Children | 30,837 (97.3%) | 864 (2.7%) |
| 3 or 4 Children | 6,272 (94.2%) | 386 (5.8%) |
| 5 or more Children | 212 (68.2%) | 99 (31.8%) |
| Total | 86,661 (97.4%) | 2,300 (2.6%) |
Income Below Poverty Among Single-Parent Households in Virginia Beach
According to the poverty data in Virginia Beach, 7.4% or 662 single-father households and 20.9% or 4,732 single-mother households are living below the poverty line. Among single-father households, those with no children have the highest poverty rate, with 497 households (10.9%) experiencing poverty. Likewise, among single-mother households, those with 5 or more children have the highest poverty rate, with 139 households (85.3%) falling below the poverty line.
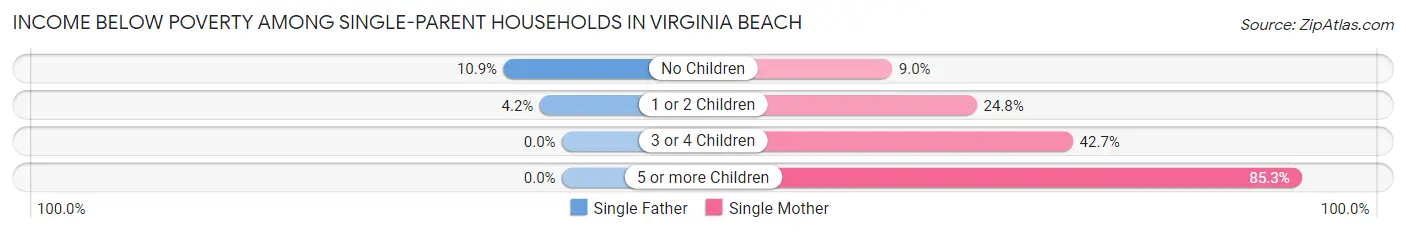
| Children | Single Father | Single Mother |
| No Children | 497 (10.9%) | 737 (9.0%) |
| 1 or 2 Children | 165 (4.2%) | 3,076 (24.7%) |
| 3 or 4 Children | 0 (0.0%) | 780 (42.6%) |
| 5 or more Children | 0 (0.0%) | 139 (85.3%) |
| Total | 662 (7.4%) | 4,732 (20.9%) |
Income Below Poverty Among Married-Couple vs Single-Parent Households in Virginia Beach
The poverty data for Virginia Beach shows that 2,300 of the married-couple family households (2.6%) and 5,394 of the single-parent households (17.1%) are living below the poverty level. Within the married-couple family households, those with 5 or more children have the highest poverty rate, with 99 households (31.8%) falling below the poverty line. Among the single-parent households, those with 5 or more children have the highest poverty rate, with 139 household (73.9%) living below poverty.
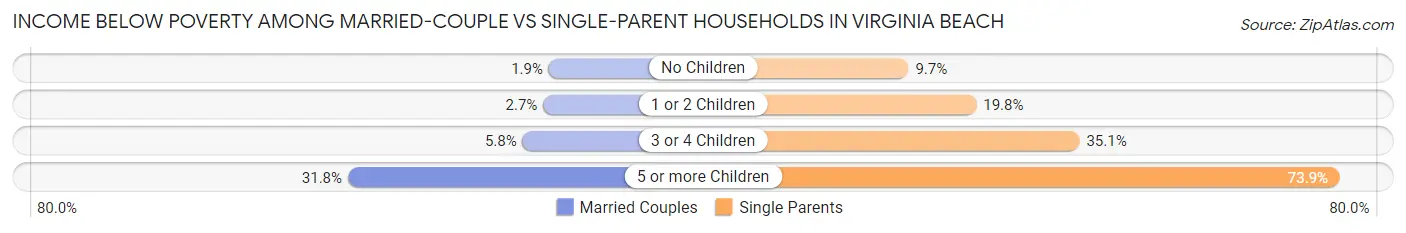
| Children | Married-Couple Families | Single-Parent Households |
| No Children | 951 (1.9%) | 1,234 (9.7%) |
| 1 or 2 Children | 864 (2.7%) | 3,241 (19.8%) |
| 3 or 4 Children | 386 (5.8%) | 780 (35.1%) |
| 5 or more Children | 99 (31.8%) | 139 (73.9%) |
| Total | 2,300 (2.6%) | 5,394 (17.1%) |
Race in Virginia Beach
The most populous races in Virginia Beach are White / Caucasian (287,415 | 62.8%), Black / African American (86,497 | 18.9%), and Hispanic or Latino (40,139 | 8.8%).
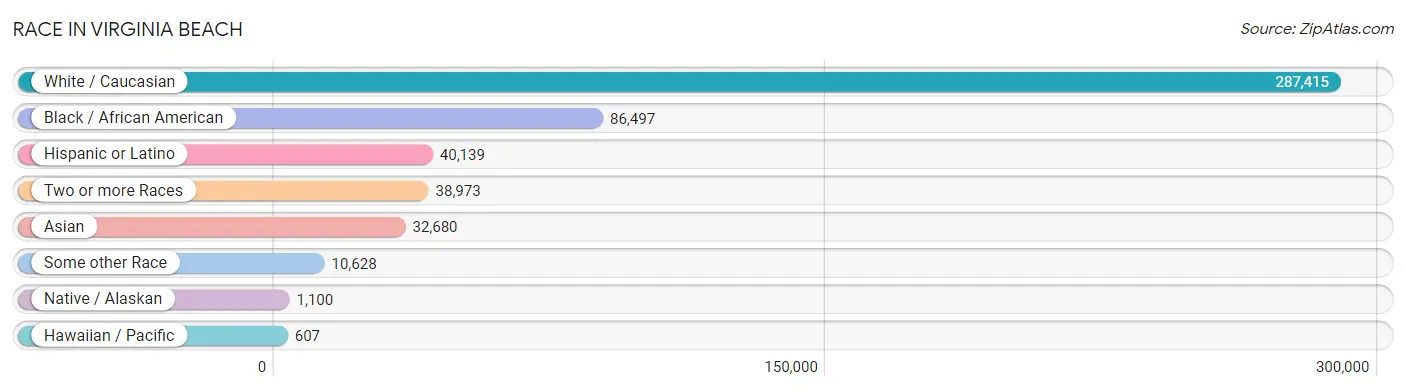
| Race | # Population | % Population |
| Asian | 32,680 | 7.1% |
| Black / African American | 86,497 | 18.9% |
| Hawaiian / Pacific | 607 | 0.1% |
| Hispanic or Latino | 40,139 | 8.8% |
| Native / Alaskan | 1,100 | 0.2% |
| White / Caucasian | 287,415 | 62.8% |
| Two or more Races | 38,973 | 8.5% |
| Some other Race | 10,628 | 2.3% |
| Total | 457,900 | 100.0% |
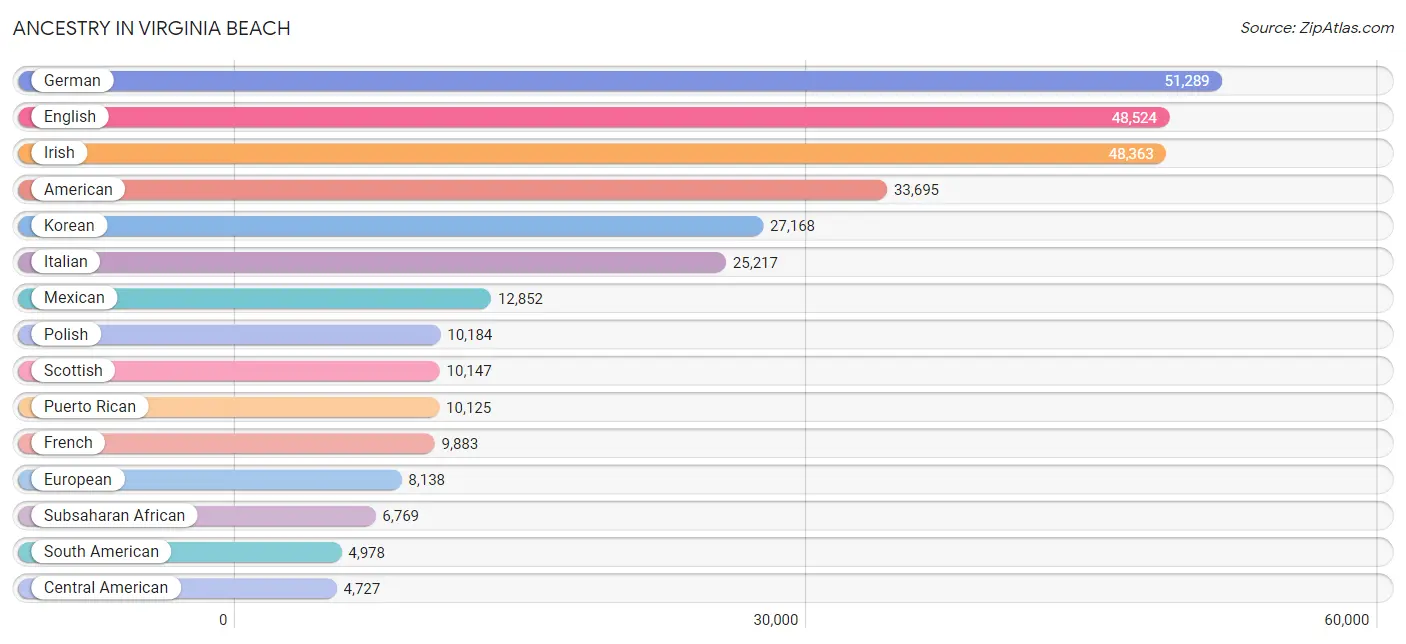
Ancestry in Virginia Beach
The most populous ancestries reported in Virginia Beach are German (51,289 | 11.2%), English (48,524 | 10.6%), Irish (48,363 | 10.6%), American (33,695 | 7.4%), and Korean (27,168 | 5.9%), together accounting for 45.7% of all Virginia Beach residents.
| Ancestry | # Population | % Population |
| Afghan | 124 | 0.0% |
| African | 4,159 | 0.9% |
| Albanian | 228 | 0.1% |
| Aleut | 2 | 0.0% |
| American | 33,695 | 7.4% |
| Apache | 19 | 0.0% |
| Arab | 1,554 | 0.3% |
| Arapaho | 50 | 0.0% |
| Argentinean | 128 | 0.0% |
| Armenian | 274 | 0.1% |
| Australian | 77 | 0.0% |
| Austrian | 810 | 0.2% |
| Bahamian | 66 | 0.0% |
| Bangladeshi | 37 | 0.0% |
| Barbadian | 108 | 0.0% |
| Basque | 11 | 0.0% |
| Belgian | 693 | 0.2% |
| Belizean | 65 | 0.0% |
| Bhutanese | 2,013 | 0.4% |
| Blackfeet | 230 | 0.1% |
| Bolivian | 370 | 0.1% |
| Brazilian | 392 | 0.1% |
| British | 2,889 | 0.6% |
| British West Indian | 242 | 0.1% |
| Bulgarian | 147 | 0.0% |
| Burmese | 1,928 | 0.4% |
| Cajun | 32 | 0.0% |
| Cambodian | 6 | 0.0% |
| Canadian | 1,041 | 0.2% |
| Cape Verdean | 46 | 0.0% |
| Celtic | 152 | 0.0% |
| Central American | 4,727 | 1.0% |
| Central American Indian | 333 | 0.1% |
| Cherokee | 1,625 | 0.4% |
| Chickasaw | 14 | 0.0% |
| Chilean | 316 | 0.1% |
| Chippewa | 151 | 0.0% |
| Choctaw | 191 | 0.0% |
| Colombian | 1,311 | 0.3% |
| Comanche | 72 | 0.0% |
| Costa Rican | 119 | 0.0% |
| Creek | 46 | 0.0% |
| Croatian | 167 | 0.0% |
| Cuban | 1,374 | 0.3% |
| Cypriot | 78 | 0.0% |
| Czech | 1,348 | 0.3% |
| Czechoslovakian | 253 | 0.1% |
| Danish | 942 | 0.2% |
| Delaware | 36 | 0.0% |
| Dominican | 1,125 | 0.3% |
| Dutch | 3,510 | 0.8% |
| Dutch West Indian | 73 | 0.0% |
| Eastern European | 1,846 | 0.4% |
| Ecuadorian | 819 | 0.2% |
| Egyptian | 348 | 0.1% |
| English | 48,524 | 10.6% |
| Estonian | 121 | 0.0% |
| Ethiopian | 144 | 0.0% |
| European | 8,138 | 1.8% |
| Filipino | 472 | 0.1% |
| Finnish | 446 | 0.1% |
| French | 9,883 | 2.2% |
| French Canadian | 2,299 | 0.5% |
| German | 51,289 | 11.2% |
| Ghanaian | 362 | 0.1% |
| Greek | 2,285 | 0.5% |
| Guamanian / Chamorro | 539 | 0.1% |
| Guatemalan | 979 | 0.2% |
| Guyanese | 173 | 0.0% |
| Haitian | 550 | 0.1% |
| Honduran | 1,331 | 0.3% |
| Hungarian | 1,188 | 0.3% |
| Icelander | 199 | 0.0% |
| Indian (Asian) | 4,004 | 0.9% |
| Indonesian | 199 | 0.0% |
| Inupiat | 70 | 0.0% |
| Iranian | 330 | 0.1% |
| Iraqi | 13 | 0.0% |
| Irish | 48,363 | 10.6% |
| Iroquois | 318 | 0.1% |
| Israeli | 187 | 0.0% |
| Italian | 25,217 | 5.5% |
| Jamaican | 1,876 | 0.4% |
| Japanese | 279 | 0.1% |
| Kenyan | 155 | 0.0% |
| Korean | 27,168 | 5.9% |
| Laotian | 33 | 0.0% |
| Latvian | 45 | 0.0% |
| Lebanese | 489 | 0.1% |
| Liberian | 237 | 0.1% |
| Lithuanian | 730 | 0.2% |
| Lumbee | 138 | 0.0% |
| Macedonian | 16 | 0.0% |
| Malaysian | 81 | 0.0% |
| Menominee | 7 | 0.0% |
| Mexican | 12,852 | 2.8% |
| Mexican American Indian | 108 | 0.0% |
| Mongolian | 37 | 0.0% |
| Moroccan | 139 | 0.0% |
| Native Hawaiian | 734 | 0.2% |
| Navajo | 52 | 0.0% |
| Nicaraguan | 181 | 0.0% |
| Nigerian | 1,124 | 0.3% |
| Northern European | 726 | 0.2% |
| Norwegian | 3,684 | 0.8% |
| Osage | 13 | 0.0% |
| Pakistani | 969 | 0.2% |
| Palestinian | 84 | 0.0% |
| Panamanian | 677 | 0.2% |
| Paraguayan | 45 | 0.0% |
| Pennsylvania German | 118 | 0.0% |
| Peruvian | 876 | 0.2% |
| Polish | 10,184 | 2.2% |
| Portuguese | 1,449 | 0.3% |
| Potawatomi | 60 | 0.0% |
| Pueblo | 100 | 0.0% |
| Puerto Rican | 10,125 | 2.2% |
| Puget Sound Salish | 39 | 0.0% |
| Romanian | 240 | 0.1% |
| Russian | 2,441 | 0.5% |
| Salvadoran | 1,440 | 0.3% |
| Samoan | 292 | 0.1% |
| Scandinavian | 1,091 | 0.2% |
| Scotch-Irish | 4,569 | 1.0% |
| Scottish | 10,147 | 2.2% |
| Seminole | 42 | 0.0% |
| Senegalese | 26 | 0.0% |
| Serbian | 128 | 0.0% |
| Sierra Leonean | 9 | 0.0% |
| Sioux | 120 | 0.0% |
| Slavic | 173 | 0.0% |
| Slovak | 835 | 0.2% |
| Slovene | 91 | 0.0% |
| South African | 250 | 0.1% |
| South American | 4,978 | 1.1% |
| South American Indian | 54 | 0.0% |
| Spaniard | 2,513 | 0.5% |
| Spanish | 1,073 | 0.2% |
| Spanish American | 142 | 0.0% |
| Spanish American Indian | 12 | 0.0% |
| Sri Lankan | 2,706 | 0.6% |
| Subsaharan African | 6,769 | 1.5% |
| Sudanese | 22 | 0.0% |
| Swedish | 3,683 | 0.8% |
| Swiss | 830 | 0.2% |
| Syrian | 91 | 0.0% |
| Thai | 4,036 | 0.9% |
| Trinidadian and Tobagonian | 634 | 0.1% |
| Tsimshian | 4 | 0.0% |
| Turkish | 337 | 0.1% |
| U.S. Virgin Islander | 469 | 0.1% |
| Ukrainian | 1,437 | 0.3% |
| Uruguayan | 7 | 0.0% |
| Venezuelan | 885 | 0.2% |
| Vietnamese | 317 | 0.1% |
| Welsh | 3,158 | 0.7% |
| West Indian | 1,115 | 0.2% |
| Yakama | 59 | 0.0% |
| Yaqui | 41 | 0.0% |
| Yugoslavian | 97 | 0.0% |
| Yup'ik | 14 | 0.0% | View All 161 Rows |
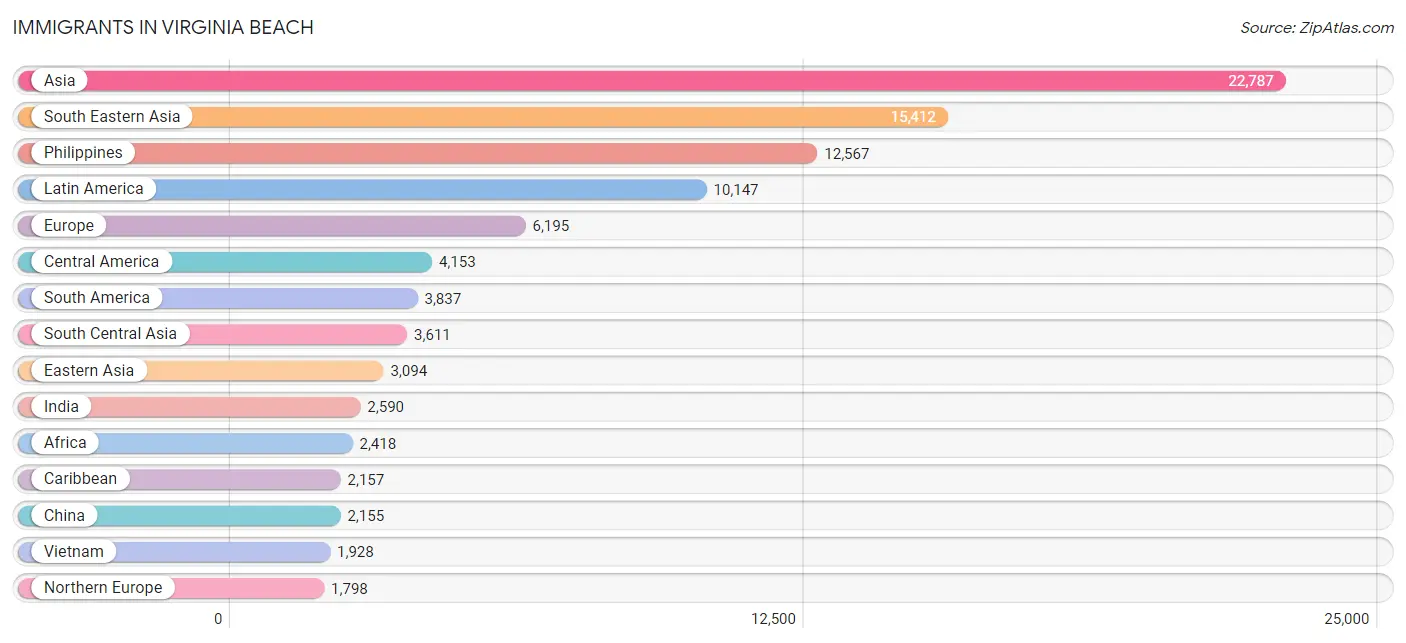
Immigrants in Virginia Beach
The most numerous immigrant groups reported in Virginia Beach came from Asia (22,787 | 5.0%), South Eastern Asia (15,412 | 3.4%), Philippines (12,567 | 2.7%), Latin America (10,147 | 2.2%), and Europe (6,195 | 1.3%), together accounting for 14.7% of all Virginia Beach residents.
| Immigration Origin | # Population | % Population |
| Afghanistan | 87 | 0.0% |
| Africa | 2,418 | 0.5% |
| Albania | 55 | 0.0% |
| Argentina | 25 | 0.0% |
| Asia | 22,787 | 5.0% |
| Australia | 101 | 0.0% |
| Austria | 10 | 0.0% |
| Bahamas | 15 | 0.0% |
| Bangladesh | 397 | 0.1% |
| Barbados | 25 | 0.0% |
| Belarus | 65 | 0.0% |
| Belgium | 44 | 0.0% |
| Belize | 10 | 0.0% |
| Bolivia | 264 | 0.1% |
| Bosnia and Herzegovina | 23 | 0.0% |
| Brazil | 744 | 0.2% |
| Bulgaria | 158 | 0.0% |
| Cambodia | 207 | 0.1% |
| Cameroon | 65 | 0.0% |
| Canada | 761 | 0.2% |
| Caribbean | 2,157 | 0.5% |
| Central America | 4,153 | 0.9% |
| Chile | 75 | 0.0% |
| China | 2,155 | 0.5% |
| Colombia | 838 | 0.2% |
| Congo | 2 | 0.0% |
| Costa Rica | 64 | 0.0% |
| Cuba | 114 | 0.0% |
| Czechoslovakia | 114 | 0.0% |
| Denmark | 52 | 0.0% |
| Dominican Republic | 440 | 0.1% |
| Eastern Africa | 348 | 0.1% |
| Eastern Asia | 3,094 | 0.7% |
| Eastern Europe | 1,786 | 0.4% |
| Ecuador | 356 | 0.1% |
| Egypt | 180 | 0.0% |
| El Salvador | 815 | 0.2% |
| England | 627 | 0.1% |
| Eritrea | 5 | 0.0% |
| Ethiopia | 92 | 0.0% |
| Europe | 6,195 | 1.3% |
| France | 280 | 0.1% |
| Germany | 992 | 0.2% |
| Ghana | 232 | 0.1% |
| Greece | 224 | 0.1% |
| Grenada | 49 | 0.0% |
| Guatemala | 526 | 0.1% |
| Guyana | 171 | 0.0% |
| Haiti | 176 | 0.0% |
| Honduras | 615 | 0.1% |
| Hong Kong | 148 | 0.0% |
| Hungary | 87 | 0.0% |
| India | 2,590 | 0.6% |
| Indonesia | 85 | 0.0% |
| Iran | 97 | 0.0% |
| Ireland | 77 | 0.0% |
| Israel | 81 | 0.0% |
| Italy | 400 | 0.1% |
| Jamaica | 795 | 0.2% |
| Japan | 413 | 0.1% |
| Jordan | 11 | 0.0% |
| Kazakhstan | 51 | 0.0% |
| Kenya | 166 | 0.0% |
| Korea | 526 | 0.1% |
| Laos | 17 | 0.0% |
| Latin America | 10,147 | 2.2% |
| Lebanon | 164 | 0.0% |
| Liberia | 209 | 0.1% |
| Lithuania | 232 | 0.1% |
| Malaysia | 38 | 0.0% |
| Mexico | 1,704 | 0.4% |
| Middle Africa | 67 | 0.0% |
| Moldova | 53 | 0.0% |
| Morocco | 194 | 0.0% |
| Nepal | 121 | 0.0% |
| Netherlands | 64 | 0.0% |
| Nicaragua | 131 | 0.0% |
| Nigeria | 598 | 0.1% |
| Northern Africa | 509 | 0.1% |
| Northern Europe | 1,798 | 0.4% |
| Norway | 73 | 0.0% |
| Oceania | 122 | 0.0% |
| Pakistan | 113 | 0.0% |
| Panama | 288 | 0.1% |
| Peru | 681 | 0.2% |
| Philippines | 12,567 | 2.7% |
| Poland | 130 | 0.0% |
| Portugal | 100 | 0.0% |
| Romania | 92 | 0.0% |
| Russia | 338 | 0.1% |
| Saudi Arabia | 22 | 0.0% |
| Scotland | 198 | 0.0% |
| Senegal | 15 | 0.0% |
| Serbia | 26 | 0.0% |
| Singapore | 36 | 0.0% |
| South Africa | 207 | 0.1% |
| South America | 3,837 | 0.8% |
| South Central Asia | 3,611 | 0.8% |
| South Eastern Asia | 15,412 | 3.4% |
| Southern Europe | 1,168 | 0.3% |
| Spain | 444 | 0.1% |
| Sri Lanka | 80 | 0.0% |
| St. Vincent and the Grenadines | 138 | 0.0% |
| Sudan | 38 | 0.0% |
| Sweden | 58 | 0.0% |
| Switzerland | 53 | 0.0% |
| Syria | 18 | 0.0% |
| Taiwan | 245 | 0.1% |
| Thailand | 294 | 0.1% |
| Trinidad and Tobago | 125 | 0.0% |
| Turkey | 251 | 0.1% |
| Ukraine | 321 | 0.1% |
| Uruguay | 7 | 0.0% |
| Uzbekistan | 35 | 0.0% |
| Venezuela | 626 | 0.1% |
| Vietnam | 1,928 | 0.4% |
| West Indies | 161 | 0.0% |
| Western Africa | 1,224 | 0.3% |
| Western Asia | 670 | 0.2% |
| Western Europe | 1,443 | 0.3% | View All 120 Rows |
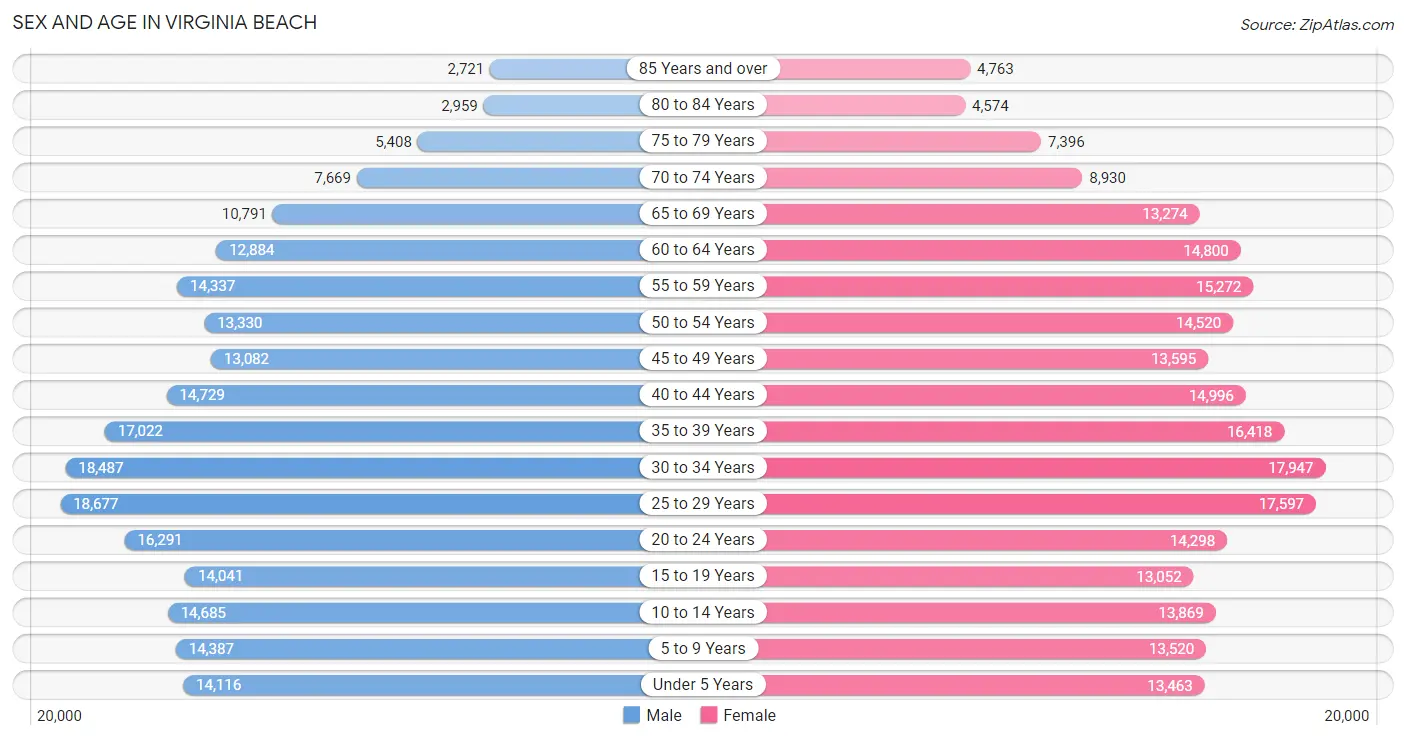
Sex and Age in Virginia Beach
Sex and Age in Virginia Beach
The most populous age groups in Virginia Beach are 25 to 29 Years (18,677 | 8.3%) for men and 30 to 34 Years (17,947 | 7.7%) for women.
| Age Bracket | Male | Female |
| Under 5 Years | 14,116 (6.3%) | 13,463 (5.8%) |
| 5 to 9 Years | 14,387 (6.4%) | 13,520 (5.8%) |
| 10 to 14 Years | 14,685 (6.5%) | 13,869 (6.0%) |
| 15 to 19 Years | 14,041 (6.2%) | 13,052 (5.6%) |
| 20 to 24 Years | 16,291 (7.2%) | 14,298 (6.2%) |
| 25 to 29 Years | 18,677 (8.3%) | 17,597 (7.6%) |
| 30 to 34 Years | 18,487 (8.2%) | 17,947 (7.7%) |
| 35 to 39 Years | 17,022 (7.5%) | 16,418 (7.1%) |
| 40 to 44 Years | 14,729 (6.5%) | 14,996 (6.5%) |
| 45 to 49 Years | 13,082 (5.8%) | 13,595 (5.9%) |
| 50 to 54 Years | 13,330 (5.9%) | 14,520 (6.2%) |
| 55 to 59 Years | 14,337 (6.4%) | 15,272 (6.6%) |
| 60 to 64 Years | 12,884 (5.7%) | 14,800 (6.4%) |
| 65 to 69 Years | 10,791 (4.8%) | 13,274 (5.7%) |
| 70 to 74 Years | 7,669 (3.4%) | 8,930 (3.8%) |
| 75 to 79 Years | 5,408 (2.4%) | 7,396 (3.2%) |
| 80 to 84 Years | 2,959 (1.3%) | 4,574 (2.0%) |
| 85 Years and over | 2,721 (1.2%) | 4,763 (2.1%) |
| Total | 225,616 (100.0%) | 232,284 (100.0%) |
Families and Households in Virginia Beach
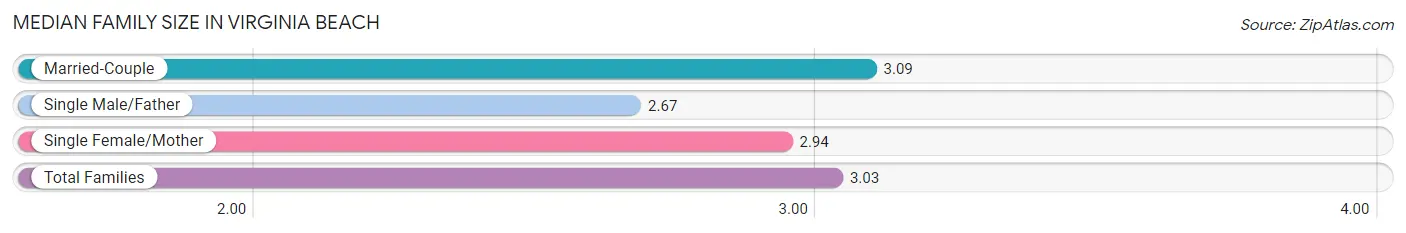
Median Family Size in Virginia Beach
The median family size in Virginia Beach is 3.03 persons per family, with married-couple families (88,961 | 73.8%) accounting for the largest median family size of 3.09 persons per family. On the other hand, single male/father families (8,950 | 7.4%) represent the smallest median family size with 2.67 persons per family.
| Family Type | # Families | Family Size |
| Married-Couple | 88,961 (73.8%) | 3.09 |
| Single Male/Father | 8,950 (7.4%) | 2.67 |
| Single Female/Mother | 22,637 (18.8%) | 2.94 |
| Total Families | 120,548 (100.0%) | 3.03 |
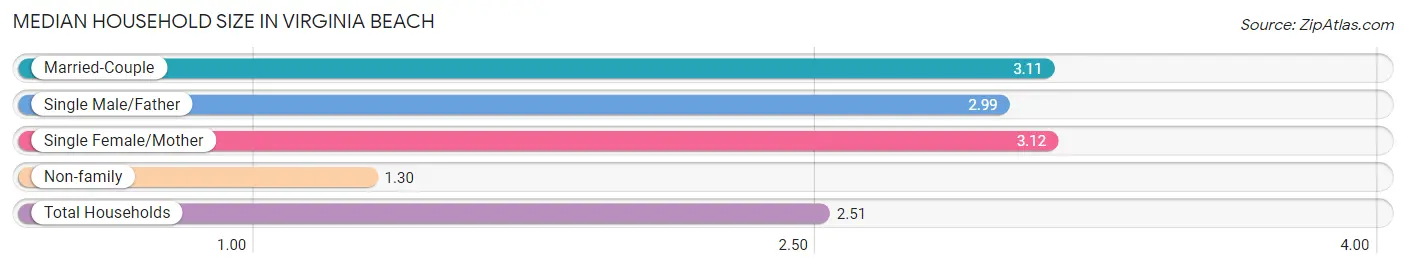
Median Household Size in Virginia Beach
The median household size in Virginia Beach is 2.51 persons per household, with single female/mother households (22,637 | 12.7%) accounting for the largest median household size of 3.12 persons per household. non-family households (58,367 | 32.6%) represent the smallest median household size with 1.30 persons per household.
| Household Type | # Households | Household Size |
| Married-Couple | 88,961 (49.7%) | 3.11 |
| Single Male/Father | 8,950 (5.0%) | 2.99 |
| Single Female/Mother | 22,637 (12.7%) | 3.12 |
| Non-family | 58,367 (32.6%) | 1.30 |
| Total Households | 178,915 (100.0%) | 2.51 |
Household Size by Marriage Status in Virginia Beach
Out of a total of 178,915 households in Virginia Beach, 120,548 (67.4%) are family households, while 58,367 (32.6%) are nonfamily households. The most numerous type of family households are 2-person households, comprising 53,050, and the most common type of nonfamily households are 1-person households, comprising 45,175.
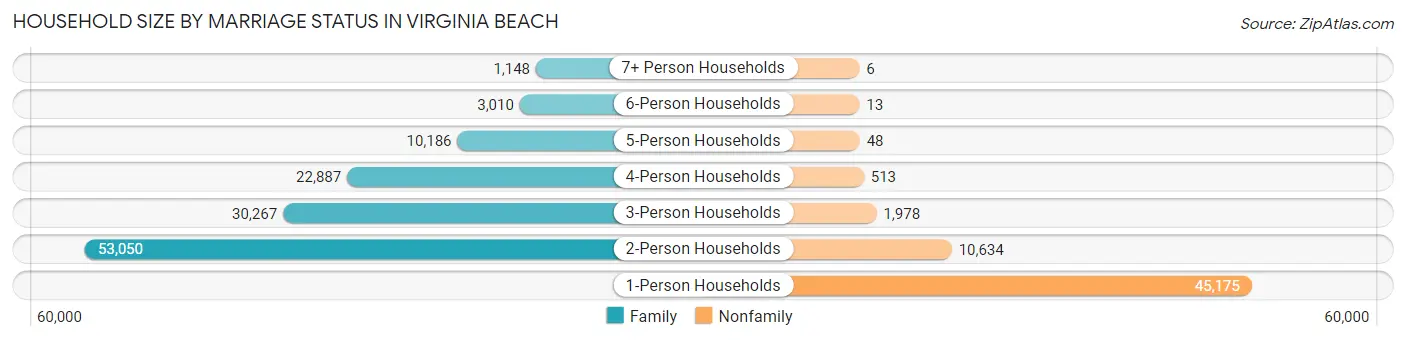
| Household Size | Family Households | Nonfamily Households |
| 1-Person Households | - | 45,175 (25.3%) |
| 2-Person Households | 53,050 (29.6%) | 10,634 (5.9%) |
| 3-Person Households | 30,267 (16.9%) | 1,978 (1.1%) |
| 4-Person Households | 22,887 (12.8%) | 513 (0.3%) |
| 5-Person Households | 10,186 (5.7%) | 48 (0.0%) |
| 6-Person Households | 3,010 (1.7%) | 13 (0.0%) |
| 7+ Person Households | 1,148 (0.6%) | 6 (0.0%) |
| Total | 120,548 (67.4%) | 58,367 (32.6%) |
Female Fertility in Virginia Beach
Fertility by Age in Virginia Beach
Average fertility rate in Virginia Beach is 52.0 births per 1,000 women. Women in the age bracket of 20 to 34 years have the highest fertility rate with 85.0 births per 1,000 women. Women in the age bracket of 20 to 34 years acount for 73.1% of all women with births.
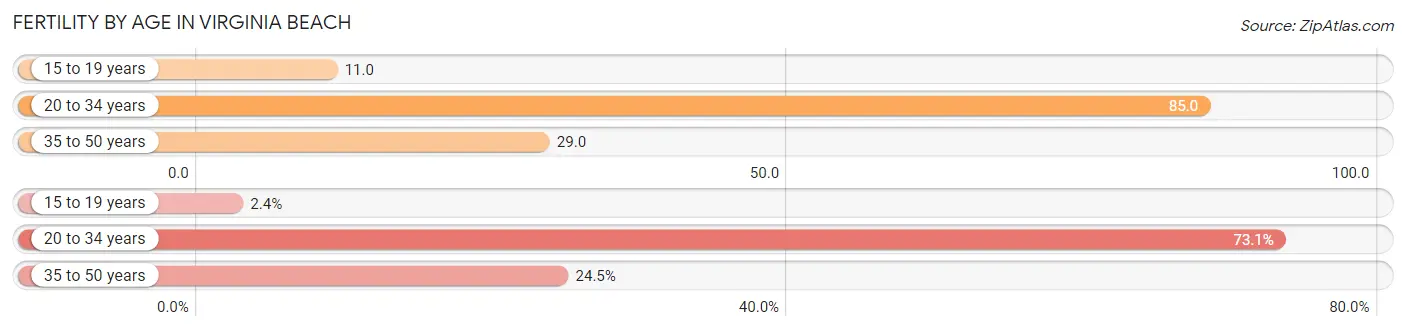
| Age Bracket | Women with Births | Births / 1,000 Women |
| 15 to 19 years | 139 (2.4%) | 11.0 |
| 20 to 34 years | 4,237 (73.1%) | 85.0 |
| 35 to 50 years | 1,418 (24.5%) | 29.0 |
| Total | 5,794 (100.0%) | 52.0 |
Fertility by Age by Marriage Status in Virginia Beach
76.7% of women with births (5,794) in Virginia Beach are married. The highest percentage of unmarried women with births falls into 20 to 34 years age bracket with 25.1% of them unmarried at the time of birth, while the lowest percentage of unmarried women with births belong to 15 to 19 years age bracket with 18.0% of them unmarried.
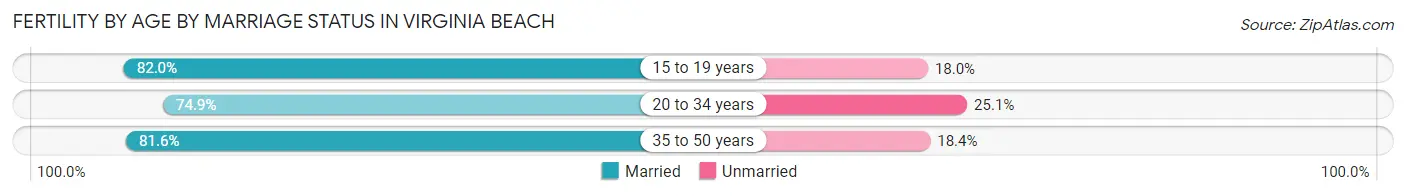
| Age Bracket | Married | Unmarried |
| 15 to 19 years | 114 (82.0%) | 25 (18.0%) |
| 20 to 34 years | 3,174 (74.9%) | 1,063 (25.1%) |
| 35 to 50 years | 1,157 (81.6%) | 261 (18.4%) |
| Total | 4,444 (76.7%) | 1,350 (23.3%) |
Fertility by Education in Virginia Beach
Average fertility rate in Virginia Beach is 52.0 births per 1,000 women. Women with the education attainment of graduate degree have the highest fertility rate of 67.0 births per 1,000 women, while women with the education attainment of less than high school have the lowest fertility at 22.0 births per 1,000 women. Women with the education attainment of college or associate's degree represent 35.8% of all women with births.
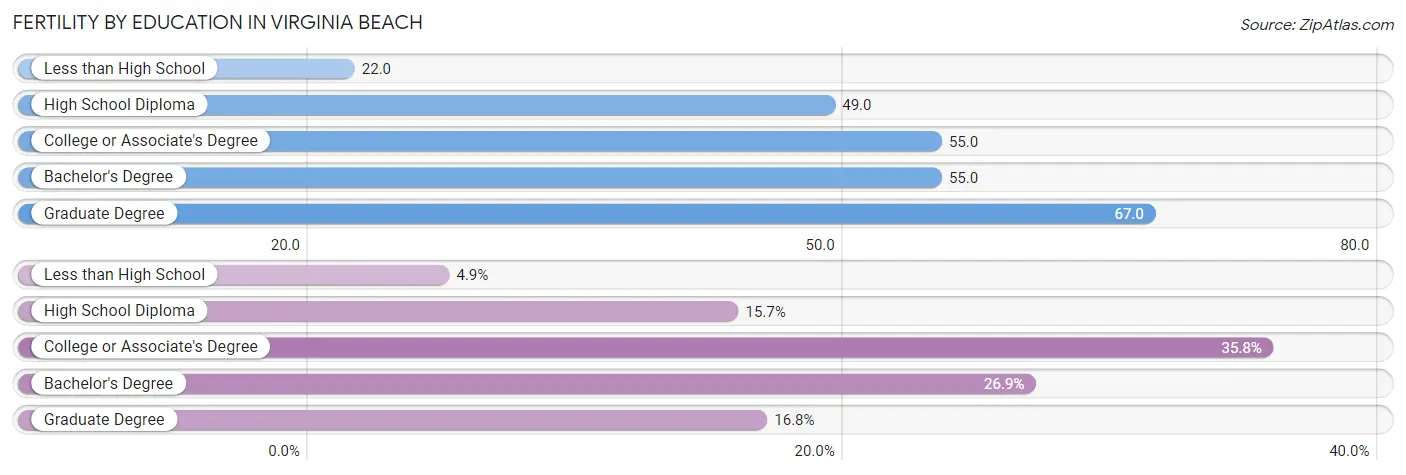
| Educational Attainment | Women with Births | Births / 1,000 Women |
| Less than High School | 283 (4.9%) | 22.0 |
| High School Diploma | 910 (15.7%) | 49.0 |
| College or Associate's Degree | 2,072 (35.8%) | 55.0 |
| Bachelor's Degree | 1,556 (26.9%) | 55.0 |
| Graduate Degree | 973 (16.8%) | 67.0 |
| Total | 5,794 (100.0%) | 52.0 |
Fertility by Education by Marriage Status in Virginia Beach
23.3% of women with births in Virginia Beach are unmarried. Women with the educational attainment of graduate degree are most likely to be married with 93.8% of them married at childbirth, while women with the educational attainment of high school diploma are least likely to be married with 59.3% of them unmarried at childbirth.
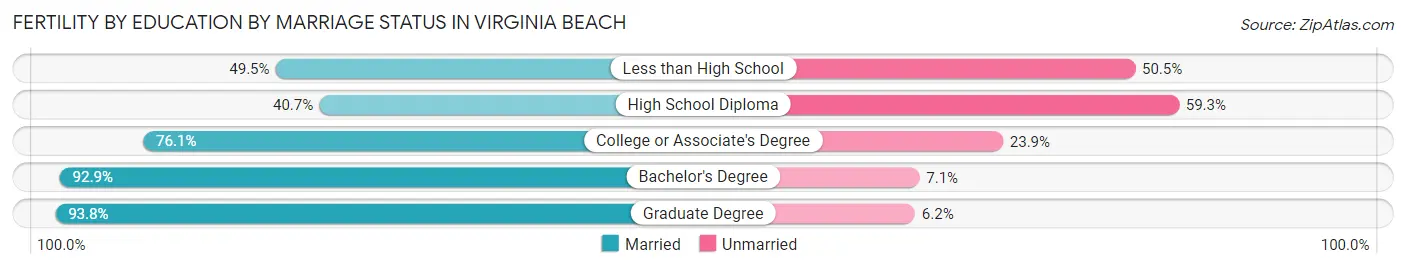
| Educational Attainment | Married | Unmarried |
| Less than High School | 140 (49.5%) | 143 (50.5%) |
| High School Diploma | 370 (40.7%) | 540 (59.3%) |
| College or Associate's Degree | 1,577 (76.1%) | 495 (23.9%) |
| Bachelor's Degree | 1,446 (92.9%) | 110 (7.1%) |
| Graduate Degree | 913 (93.8%) | 60 (6.2%) |
| Total | 4,444 (76.7%) | 1,350 (23.3%) |
Employment Characteristics in Virginia Beach
Employment by Class of Employer in Virginia Beach
Among the 242,547 employed individuals in Virginia Beach, private company employees (137,750 | 56.8%), federal government employees (41,044 | 16.9%), and local government employees (19,572 | 8.1%) make up the most common classes of employment.
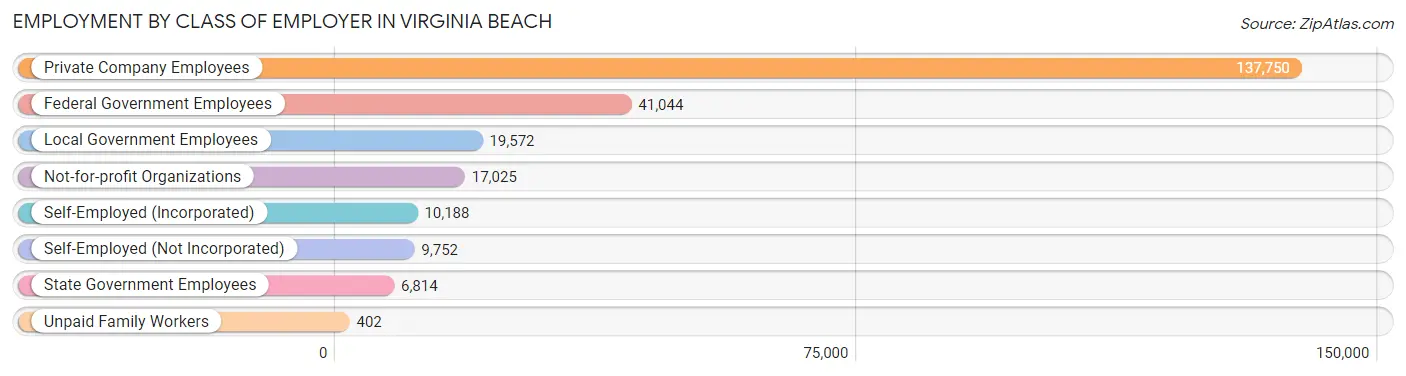
| Employer Class | # Employees | % Employees |
| Private Company Employees | 137,750 | 56.8% |
| Self-Employed (Incorporated) | 10,188 | 4.2% |
| Self-Employed (Not Incorporated) | 9,752 | 4.0% |
| Not-for-profit Organizations | 17,025 | 7.0% |
| Local Government Employees | 19,572 | 8.1% |
| State Government Employees | 6,814 | 2.8% |
| Federal Government Employees | 41,044 | 16.9% |
| Unpaid Family Workers | 402 | 0.2% |
| Total | 242,547 | 100.0% |
Employment Status by Age in Virginia Beach
According to the labor force statistics for Virginia Beach, out of the total population over 16 years of age (368,638), 69.5% or 256,203 individuals are in the labor force, with 4.3% or 11,017 of them unemployed. The age group with the highest labor force participation rate is 25 to 29 years, with 87.0% or 31,558 individuals in the labor force. Within the labor force, the 16 to 19 years age range has the highest percentage of unemployed individuals, with 12.0% or 1,291 of them being unemployed.
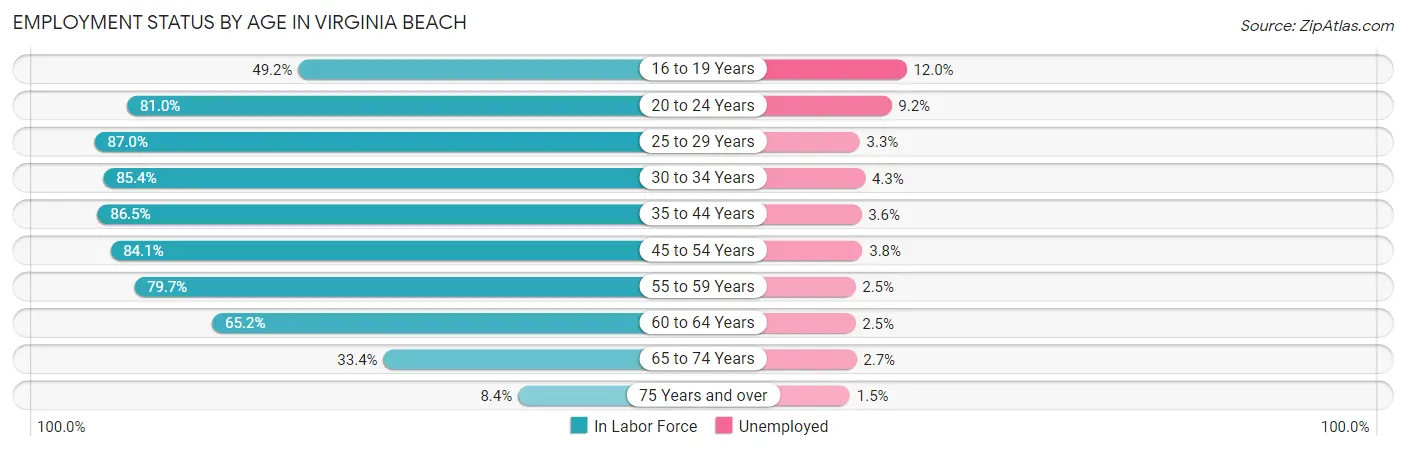
| Age Bracket | In Labor Force | Unemployed |
| 16 to 19 Years | 10,761 (49.2%) | 1,291 (12.0%) |
| 20 to 24 Years | 24,777 (81.0%) | 2,279 (9.2%) |
| 25 to 29 Years | 31,558 (87.0%) | 1,041 (3.3%) |
| 30 to 34 Years | 31,115 (85.4%) | 1,338 (4.3%) |
| 35 to 44 Years | 54,638 (86.5%) | 1,967 (3.6%) |
| 45 to 54 Years | 45,857 (84.1%) | 1,743 (3.8%) |
| 55 to 59 Years | 23,598 (79.7%) | 590 (2.5%) |
| 60 to 64 Years | 18,050 (65.2%) | 451 (2.5%) |
| 65 to 74 Years | 13,582 (33.4%) | 367 (2.7%) |
| 75 Years and over | 2,337 (8.4%) | 35 (1.5%) |
| Total | 256,203 (69.5%) | 11,017 (4.3%) |
Employment Status by Educational Attainment in Virginia Beach
According to labor force statistics for Virginia Beach, 82.7% of individuals (204,842) out of the total population between 25 and 64 years of age (247,693) are in the labor force, with 3.5% or 7,169 of them being unemployed. The group with the highest labor force participation rate are those with the educational attainment of bachelor's degree or higher, with 87.2% or 88,082 individuals in the labor force. Within the labor force, individuals with less than high school education have the highest percentage of unemployment, with 8.7% or 693 of them being unemployed.
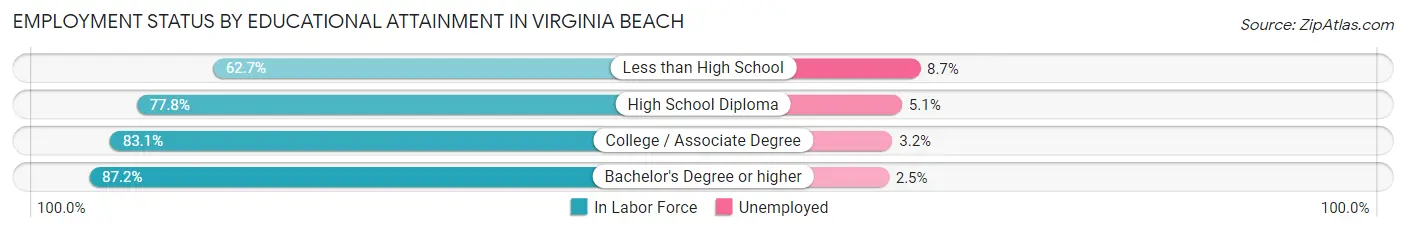
| Educational Attainment | In Labor Force | Unemployed |
| Less than High School | 7,965 (62.7%) | 1,105 (8.7%) |
| High School Diploma | 37,558 (77.8%) | 2,462 (5.1%) |
| College / Associate Degree | 71,219 (83.1%) | 2,742 (3.2%) |
| Bachelor's Degree or higher | 88,082 (87.2%) | 2,525 (2.5%) |
| Total | 204,842 (82.7%) | 8,669 (3.5%) |
Employment Occupations by Sex in Virginia Beach
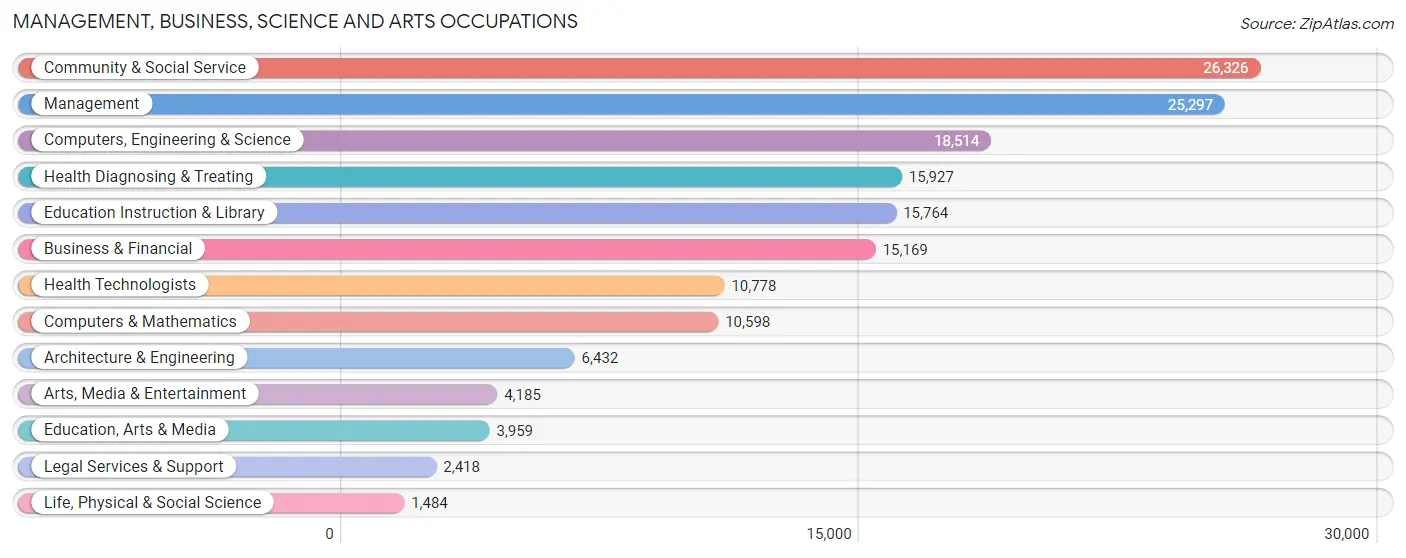
Management, Business, Science and Arts Occupations
The most common Management, Business, Science and Arts occupations in Virginia Beach are Community & Social Service (26,326 | 11.7%), Management (25,297 | 11.3%), Computers, Engineering & Science (18,514 | 8.3%), Health Diagnosing & Treating (15,927 | 7.1%), and Education Instruction & Library (15,764 | 7.0%).
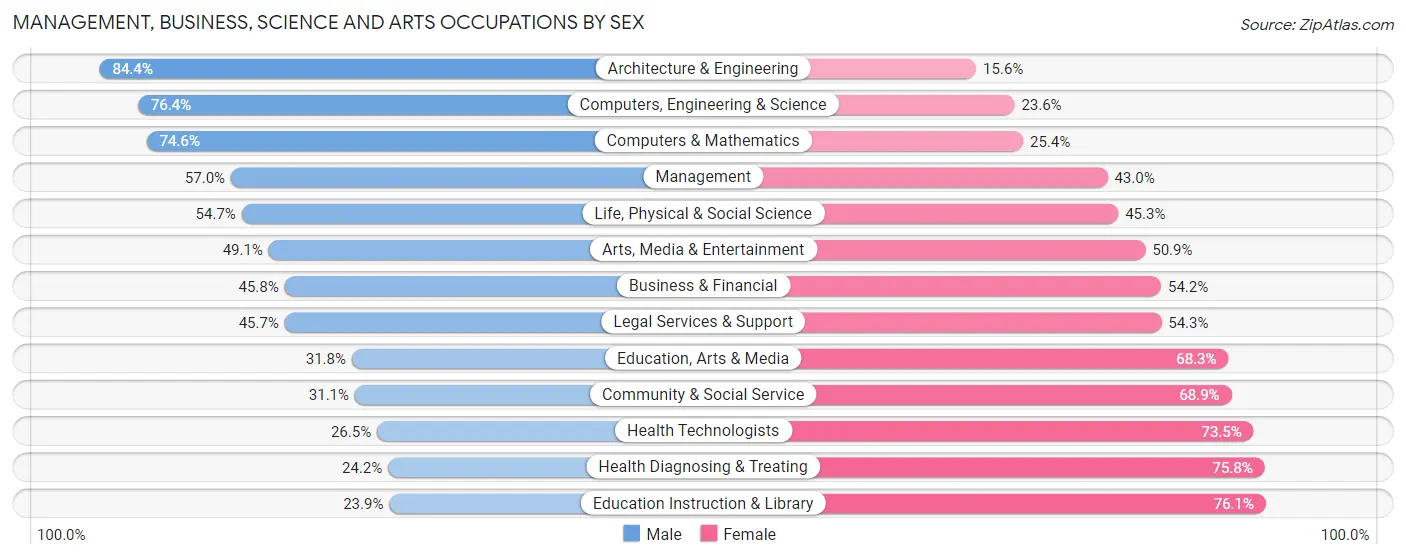
Management, Business, Science and Arts Occupations by Sex
Within the Management, Business, Science and Arts occupations in Virginia Beach, the most male-oriented occupations are Architecture & Engineering (84.4%), Computers, Engineering & Science (76.4%), and Computers & Mathematics (74.6%), while the most female-oriented occupations are Education Instruction & Library (76.1%), Health Diagnosing & Treating (75.8%), and Health Technologists (73.5%).
| Occupation | Male | Female |
| Management | 14,408 (57.0%) | 10,889 (43.0%) |
| Business & Financial | 6,944 (45.8%) | 8,225 (54.2%) |
| Computers, Engineering & Science | 14,140 (76.4%) | 4,374 (23.6%) |
| Computers & Mathematics | 7,902 (74.6%) | 2,696 (25.4%) |
| Architecture & Engineering | 5,426 (84.4%) | 1,006 (15.6%) |
| Life, Physical & Social Science | 812 (54.7%) | 672 (45.3%) |
| Community & Social Service | 8,191 (31.1%) | 18,135 (68.9%) |
| Education, Arts & Media | 1,257 (31.8%) | 2,702 (68.2%) |
| Legal Services & Support | 1,106 (45.7%) | 1,312 (54.3%) |
| Education Instruction & Library | 3,774 (23.9%) | 11,990 (76.1%) |
| Arts, Media & Entertainment | 2,054 (49.1%) | 2,131 (50.9%) |
| Health Diagnosing & Treating | 3,851 (24.2%) | 12,076 (75.8%) |
| Health Technologists | 2,855 (26.5%) | 7,923 (73.5%) |
| Total (Category) | 47,534 (47.0%) | 53,699 (53.0%) |
| Total (Overall) | 113,618 (50.6%) | 110,716 (49.3%) |
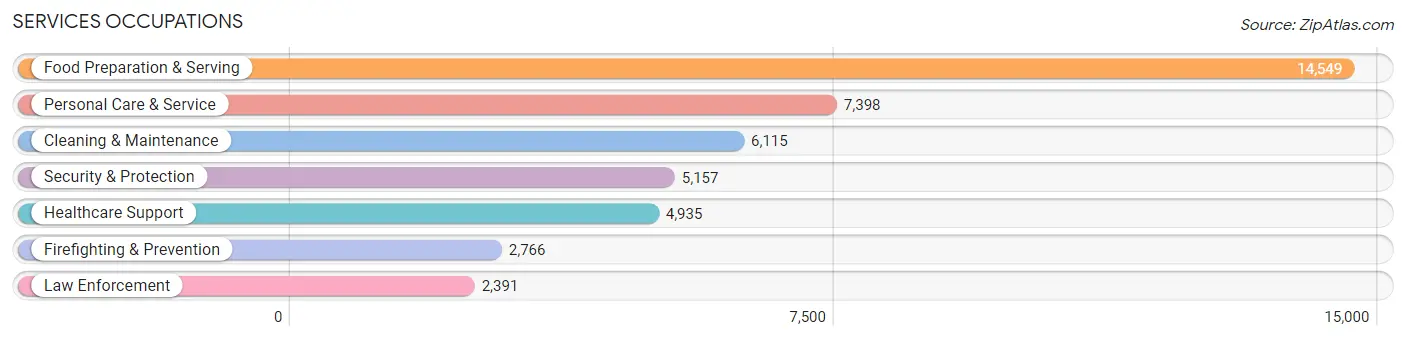
Services Occupations
The most common Services occupations in Virginia Beach are Food Preparation & Serving (14,549 | 6.5%), Personal Care & Service (7,398 | 3.3%), Cleaning & Maintenance (6,115 | 2.7%), Security & Protection (5,157 | 2.3%), and Healthcare Support (4,935 | 2.2%).
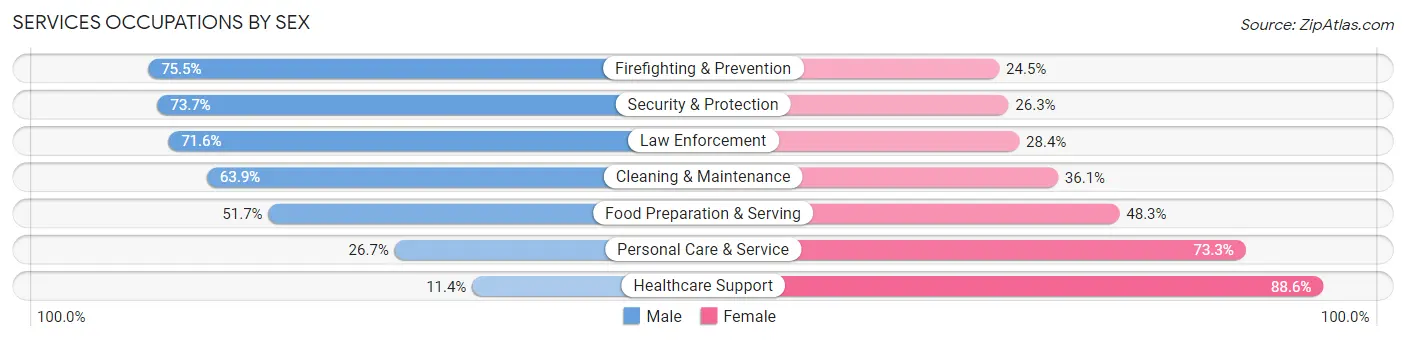
Services Occupations by Sex
Within the Services occupations in Virginia Beach, the most male-oriented occupations are Firefighting & Prevention (75.5%), Security & Protection (73.7%), and Law Enforcement (71.6%), while the most female-oriented occupations are Healthcare Support (88.6%), Personal Care & Service (73.3%), and Food Preparation & Serving (48.3%).
| Occupation | Male | Female |
| Healthcare Support | 561 (11.4%) | 4,374 (88.6%) |
| Security & Protection | 3,800 (73.7%) | 1,357 (26.3%) |
| Firefighting & Prevention | 2,089 (75.5%) | 677 (24.5%) |
| Law Enforcement | 1,711 (71.6%) | 680 (28.4%) |
| Food Preparation & Serving | 7,525 (51.7%) | 7,024 (48.3%) |
| Cleaning & Maintenance | 3,907 (63.9%) | 2,208 (36.1%) |
| Personal Care & Service | 1,977 (26.7%) | 5,421 (73.3%) |
| Total (Category) | 17,770 (46.6%) | 20,384 (53.4%) |
| Total (Overall) | 113,618 (50.6%) | 110,716 (49.3%) |
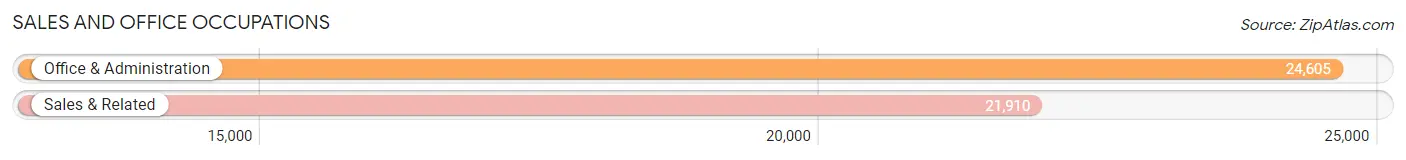
Sales and Office Occupations
The most common Sales and Office occupations in Virginia Beach are Office & Administration (24,605 | 11.0%), and Sales & Related (21,910 | 9.8%).
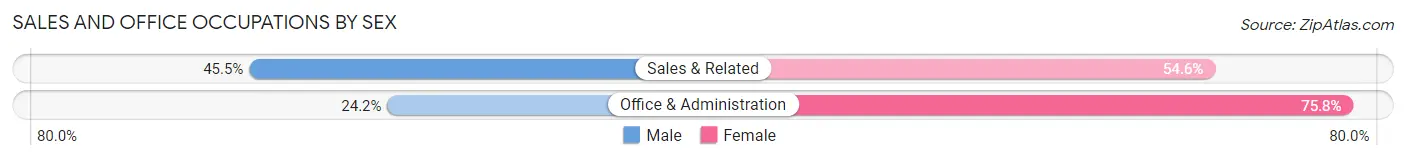
Sales and Office Occupations by Sex
| Occupation | Male | Female |
| Sales & Related | 9,958 (45.5%) | 11,952 (54.5%) |
| Office & Administration | 5,951 (24.2%) | 18,654 (75.8%) |
| Total (Category) | 15,909 (34.2%) | 30,606 (65.8%) |
| Total (Overall) | 113,618 (50.6%) | 110,716 (49.3%) |
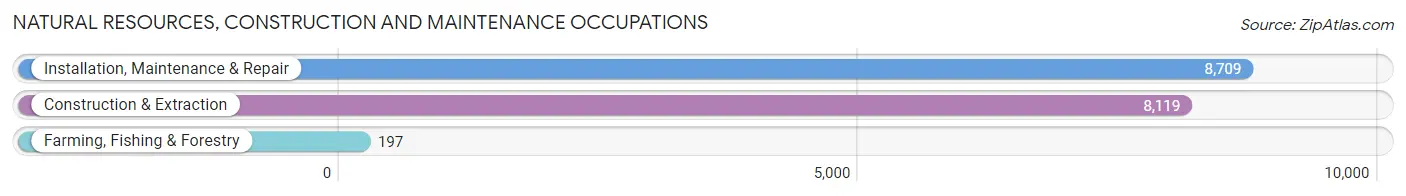
Natural Resources, Construction and Maintenance Occupations
The most common Natural Resources, Construction and Maintenance occupations in Virginia Beach are Installation, Maintenance & Repair (8,709 | 3.9%), Construction & Extraction (8,119 | 3.6%), and Farming, Fishing & Forestry (197 | 0.1%).
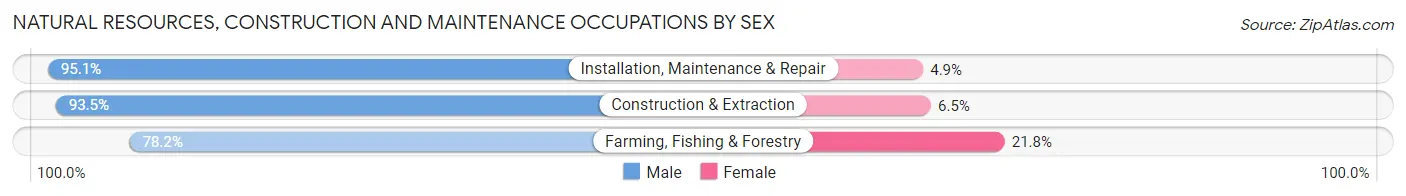
Natural Resources, Construction and Maintenance Occupations by Sex
| Occupation | Male | Female |
| Farming, Fishing & Forestry | 154 (78.2%) | 43 (21.8%) |
| Construction & Extraction | 7,592 (93.5%) | 527 (6.5%) |
| Installation, Maintenance & Repair | 8,286 (95.1%) | 423 (4.9%) |
| Total (Category) | 16,032 (94.2%) | 993 (5.8%) |
| Total (Overall) | 113,618 (50.6%) | 110,716 (49.3%) |
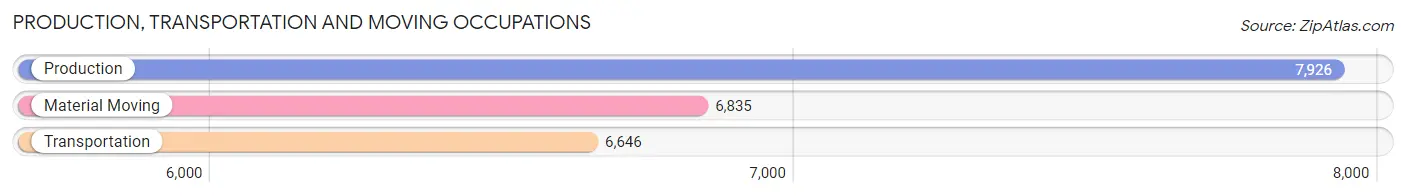
Production, Transportation and Moving Occupations
The most common Production, Transportation and Moving occupations in Virginia Beach are Production (7,926 | 3.5%), Material Moving (6,835 | 3.0%), and Transportation (6,646 | 3.0%).
Production, Transportation and Moving Occupations by Sex
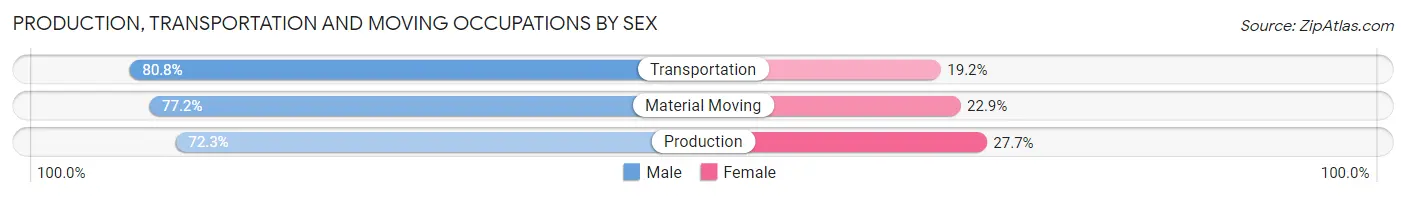
| Occupation | Male | Female |
| Production | 5,732 (72.3%) | 2,194 (27.7%) |
| Transportation | 5,368 (80.8%) | 1,278 (19.2%) |
| Material Moving | 5,273 (77.1%) | 1,562 (22.9%) |
| Total (Category) | 16,373 (76.5%) | 5,034 (23.5%) |
| Total (Overall) | 113,618 (50.6%) | 110,716 (49.3%) |
Employment Industries by Sex in Virginia Beach
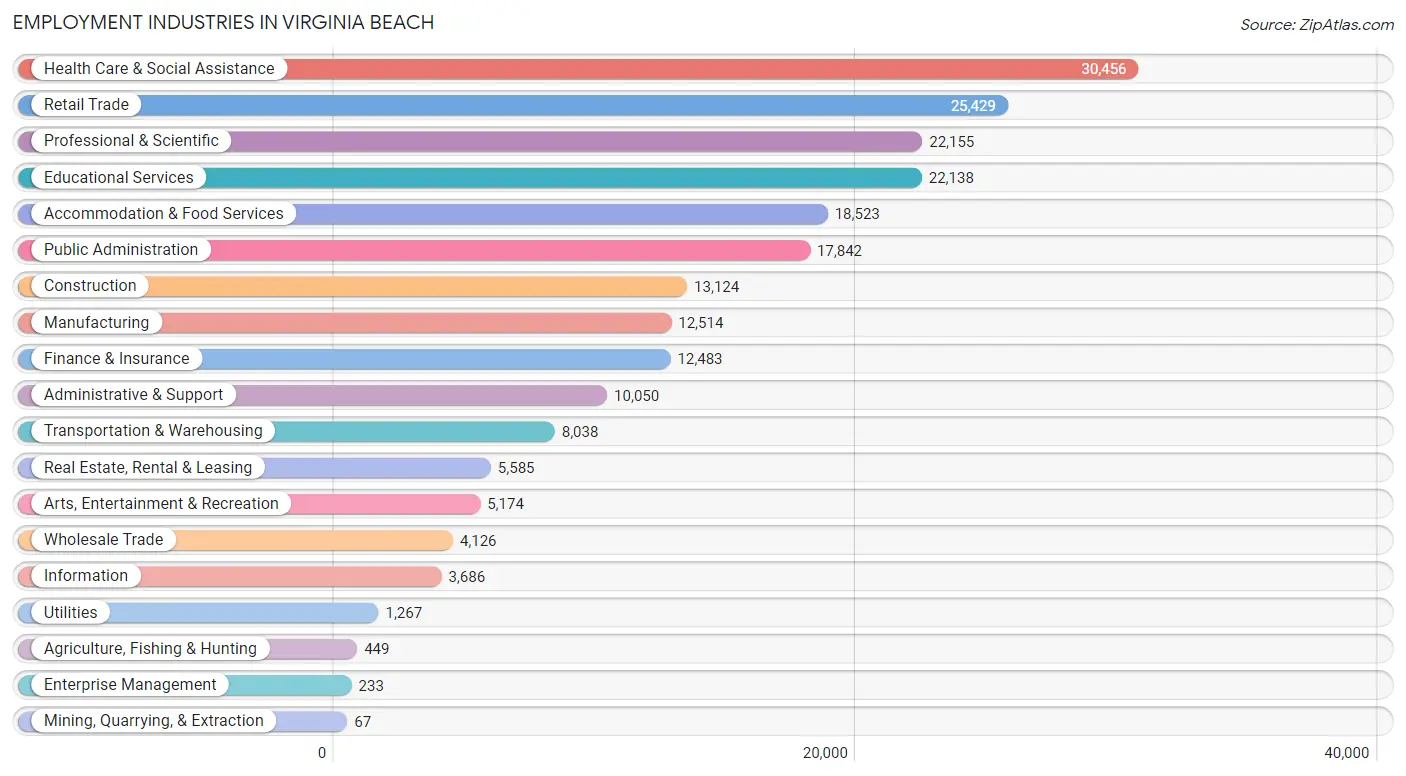
Employment Industries in Virginia Beach
The major employment industries in Virginia Beach include Health Care & Social Assistance (30,456 | 13.6%), Retail Trade (25,429 | 11.3%), Professional & Scientific (22,155 | 9.9%), Educational Services (22,138 | 9.9%), and Accommodation & Food Services (18,523 | 8.3%).
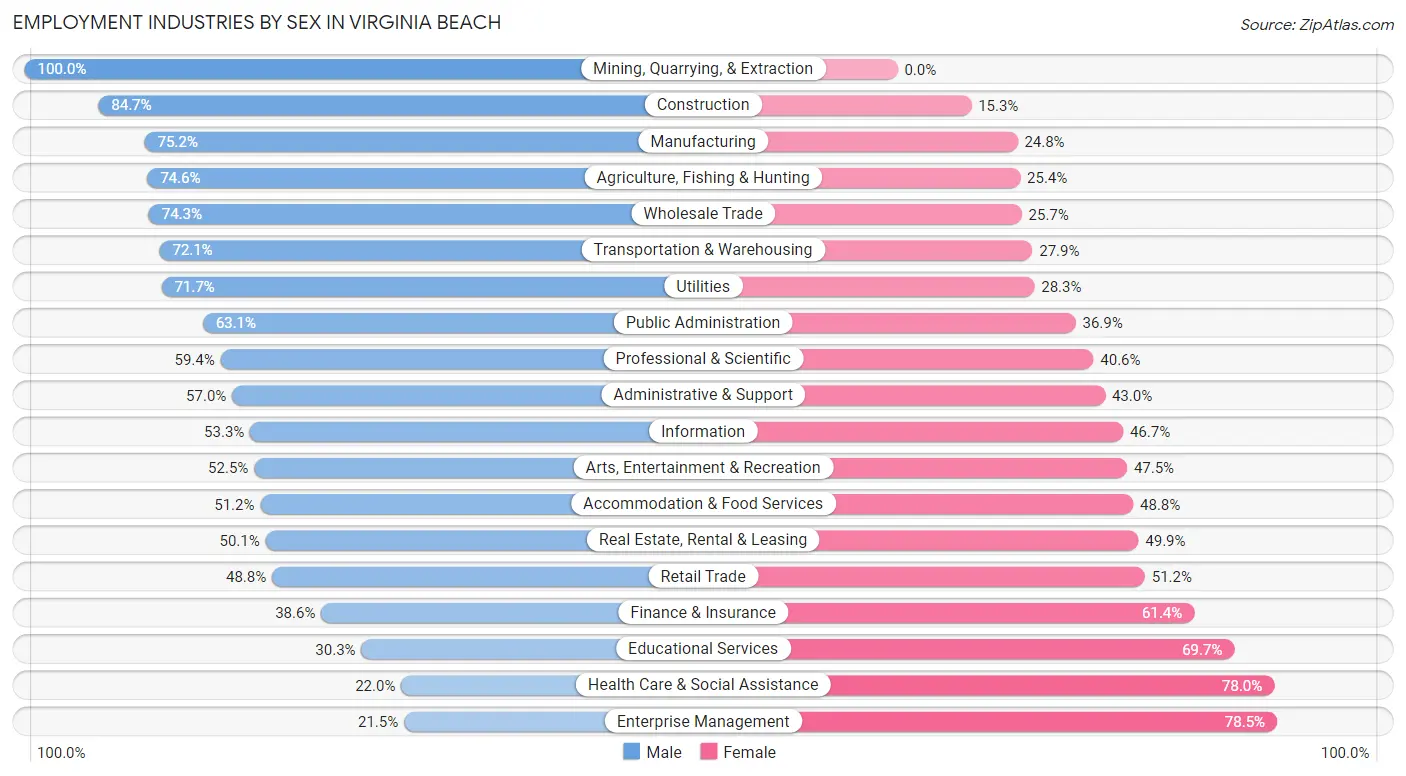
Employment Industries by Sex in Virginia Beach
The Virginia Beach industries that see more men than women are Mining, Quarrying, & Extraction (100.0%), Construction (84.7%), and Manufacturing (75.2%), whereas the industries that tend to have a higher number of women are Enterprise Management (78.5%), Health Care & Social Assistance (78.0%), and Educational Services (69.7%).
| Industry | Male | Female |
| Agriculture, Fishing & Hunting | 335 (74.6%) | 114 (25.4%) |
| Mining, Quarrying, & Extraction | 67 (100.0%) | 0 (0.0%) |
| Construction | 11,120 (84.7%) | 2,004 (15.3%) |
| Manufacturing | 9,406 (75.2%) | 3,108 (24.8%) |
| Wholesale Trade | 3,065 (74.3%) | 1,061 (25.7%) |
| Retail Trade | 12,408 (48.8%) | 13,021 (51.2%) |
| Transportation & Warehousing | 5,794 (72.1%) | 2,244 (27.9%) |
| Utilities | 908 (71.7%) | 359 (28.3%) |
| Information | 1,965 (53.3%) | 1,721 (46.7%) |
| Finance & Insurance | 4,819 (38.6%) | 7,664 (61.4%) |
| Real Estate, Rental & Leasing | 2,800 (50.1%) | 2,785 (49.9%) |
| Professional & Scientific | 13,170 (59.4%) | 8,985 (40.6%) |
| Enterprise Management | 50 (21.5%) | 183 (78.5%) |
| Administrative & Support | 5,733 (57.0%) | 4,317 (43.0%) |
| Educational Services | 6,705 (30.3%) | 15,433 (69.7%) |
| Health Care & Social Assistance | 6,711 (22.0%) | 23,745 (78.0%) |
| Arts, Entertainment & Recreation | 2,716 (52.5%) | 2,458 (47.5%) |
| Accommodation & Food Services | 9,485 (51.2%) | 9,038 (48.8%) |
| Public Administration | 11,264 (63.1%) | 6,578 (36.9%) |
| Total | 113,618 (50.6%) | 110,716 (49.3%) |
Education in Virginia Beach
School Enrollment in Virginia Beach
The most common levels of schooling among the 111,486 students in Virginia Beach are college / undergraduate (23,994 | 21.5%), high school (23,043 | 20.7%), and middle school (22,431 | 20.1%).
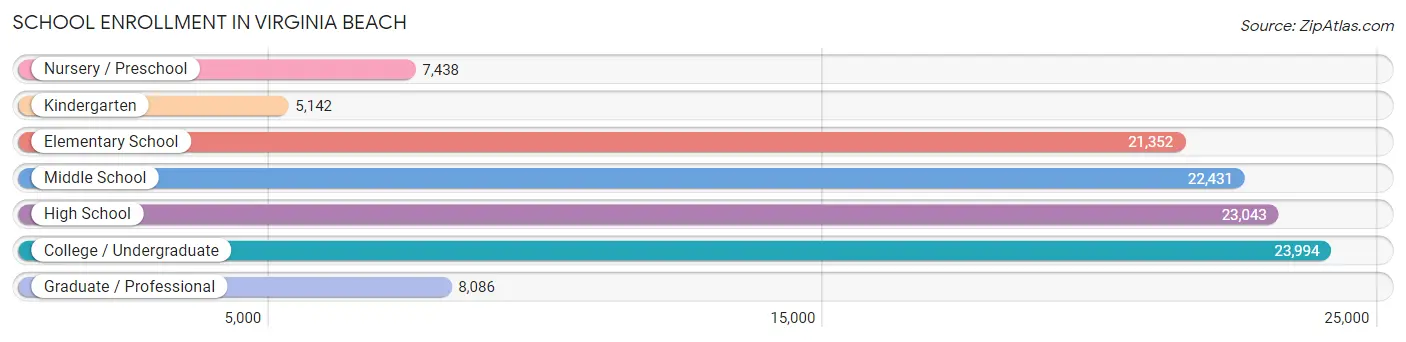
| School Level | # Students | % Students |
| Nursery / Preschool | 7,438 | 6.7% |
| Kindergarten | 5,142 | 4.6% |
| Elementary School | 21,352 | 19.2% |
| Middle School | 22,431 | 20.1% |
| High School | 23,043 | 20.7% |
| College / Undergraduate | 23,994 | 21.5% |
| Graduate / Professional | 8,086 | 7.2% |
| Total | 111,486 | 100.0% |
School Enrollment by Age by Funding Source in Virginia Beach
Out of a total of 111,486 students who are enrolled in schools in Virginia Beach, 21,963 (19.7%) attend a private institution, while the remaining 89,523 (80.3%) are enrolled in public schools. The age group of 3 to 4 year olds has the highest likelihood of being enrolled in private schools, with 3,919 (65.5% in the age bracket) enrolled. Conversely, the age group of 15 to 17 year olds has the lowest likelihood of being enrolled in a private school, with 15,198 (91.4% in the age bracket) attending a public institution.
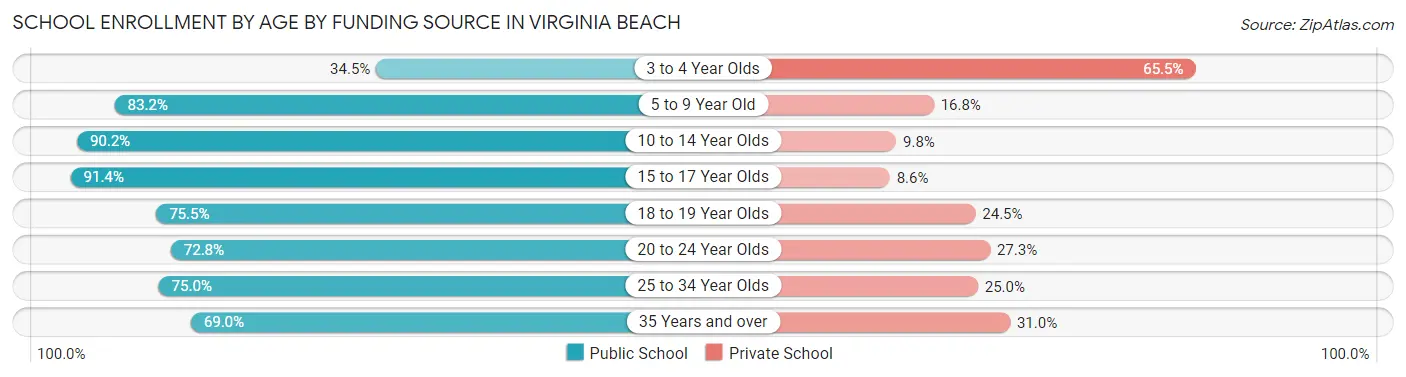
| Age Bracket | Public School | Private School |
| 3 to 4 Year Olds | 2,066 (34.5%) | 3,919 (65.5%) |
| 5 to 9 Year Old | 21,654 (83.2%) | 4,363 (16.8%) |
| 10 to 14 Year Olds | 24,956 (90.2%) | 2,700 (9.8%) |
| 15 to 17 Year Olds | 15,198 (91.4%) | 1,426 (8.6%) |
| 18 to 19 Year Olds | 4,743 (75.5%) | 1,542 (24.5%) |
| 20 to 24 Year Olds | 7,701 (72.8%) | 2,884 (27.3%) |
| 25 to 34 Year Olds | 6,937 (75.0%) | 2,310 (25.0%) |
| 35 Years and over | 6,272 (69.0%) | 2,815 (31.0%) |
| Total | 89,523 (80.3%) | 21,963 (19.7%) |
Educational Attainment by Field of Study in Virginia Beach
Business (25,141 | 18.5%), education (14,766 | 10.9%), science & technology (13,760 | 10.2%), social sciences (11,086 | 8.2%), and engineering (10,619 | 7.8%) are the most common fields of study among 135,534 individuals in Virginia Beach who have obtained a bachelor's degree or higher.
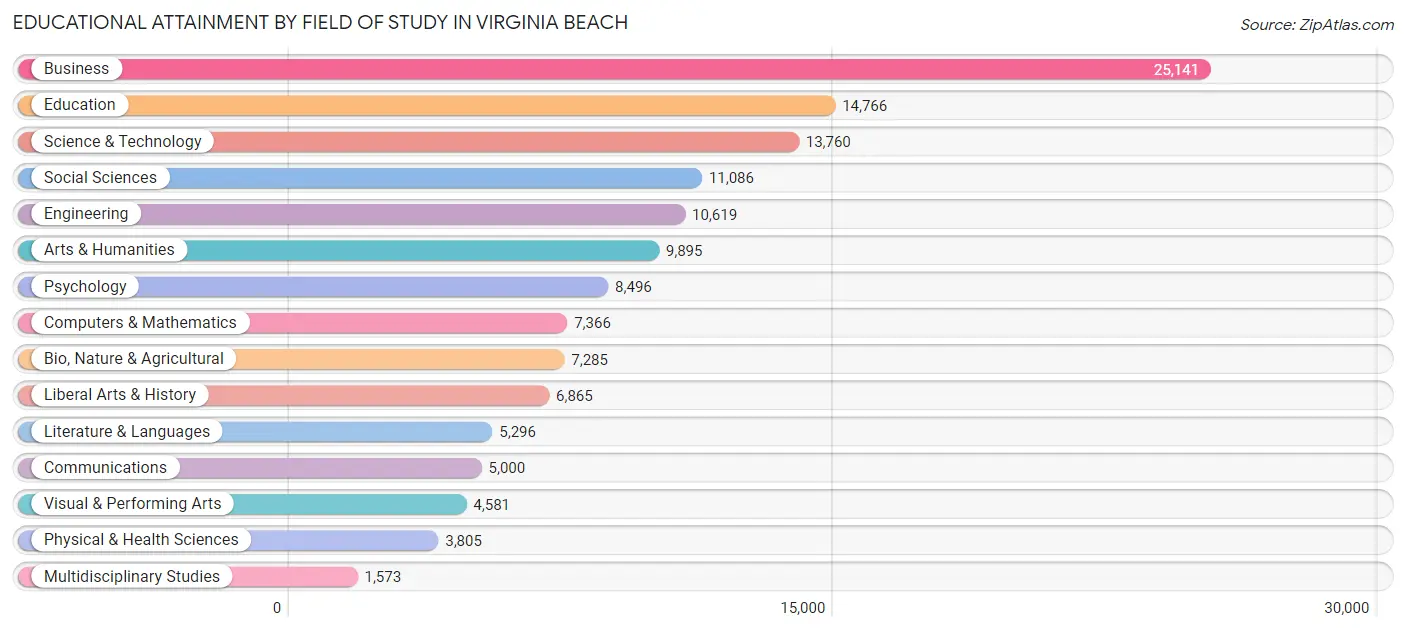
| Field of Study | # Graduates | % Graduates |
| Computers & Mathematics | 7,366 | 5.4% |
| Bio, Nature & Agricultural | 7,285 | 5.4% |
| Physical & Health Sciences | 3,805 | 2.8% |
| Psychology | 8,496 | 6.3% |
| Social Sciences | 11,086 | 8.2% |
| Engineering | 10,619 | 7.8% |
| Multidisciplinary Studies | 1,573 | 1.2% |
| Science & Technology | 13,760 | 10.2% |
| Business | 25,141 | 18.5% |
| Education | 14,766 | 10.9% |
| Literature & Languages | 5,296 | 3.9% |
| Liberal Arts & History | 6,865 | 5.1% |
| Visual & Performing Arts | 4,581 | 3.4% |
| Communications | 5,000 | 3.7% |
| Arts & Humanities | 9,895 | 7.3% |
| Total | 135,534 | 100.0% |
Transportation & Commute in Virginia Beach
Vehicle Availability by Sex in Virginia Beach
The most prevalent vehicle ownership categories in Virginia Beach are males with 2 vehicles (56,642, accounting for 44.7%) and females with 2 vehicles (46,850, making up 51.0%).
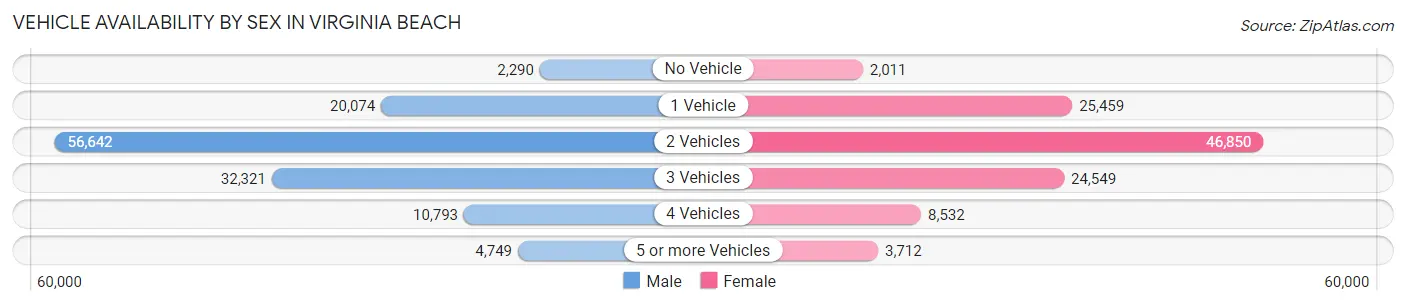
| Vehicles Available | Male | Female |
| No Vehicle | 2,290 (1.8%) | 2,011 (1.8%) |
| 1 Vehicle | 20,074 (15.8%) | 25,459 (22.9%) |
| 2 Vehicles | 56,642 (44.7%) | 46,850 (42.2%) |
| 3 Vehicles | 32,321 (25.5%) | 24,549 (22.1%) |
| 4 Vehicles | 10,793 (8.5%) | 8,532 (7.7%) |
| 5 or more Vehicles | 4,749 (3.7%) | 3,712 (3.3%) |
| Total | 126,869 (100.0%) | 111,113 (100.0%) |
Commute Time in Virginia Beach
The most frequently occuring commute durations in Virginia Beach are 20 to 24 minutes (40,490 commuters, 18.7%), 15 to 19 minutes (39,074 commuters, 18.0%), and 30 to 34 minutes (35,719 commuters, 16.5%).
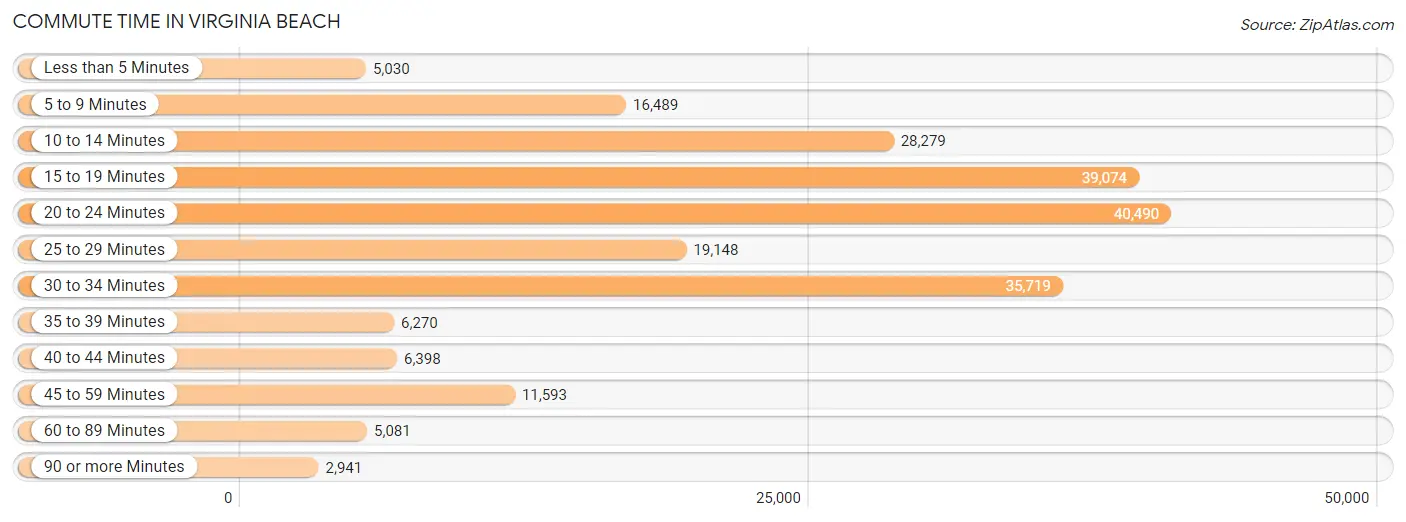
| Commute Time | # Commuters | % Commuters |
| Less than 5 Minutes | 5,030 | 2.3% |
| 5 to 9 Minutes | 16,489 | 7.6% |
| 10 to 14 Minutes | 28,279 | 13.1% |
| 15 to 19 Minutes | 39,074 | 18.0% |
| 20 to 24 Minutes | 40,490 | 18.7% |
| 25 to 29 Minutes | 19,148 | 8.8% |
| 30 to 34 Minutes | 35,719 | 16.5% |
| 35 to 39 Minutes | 6,270 | 2.9% |
| 40 to 44 Minutes | 6,398 | 3.0% |
| 45 to 59 Minutes | 11,593 | 5.3% |
| 60 to 89 Minutes | 5,081 | 2.4% |
| 90 or more Minutes | 2,941 | 1.4% |
Commute Time by Sex in Virginia Beach
The most common commute times in Virginia Beach are 30 to 34 minutes (21,536 commuters, 18.2%) for males and 15 to 19 minutes (19,853 commuters, 20.3%) for females.
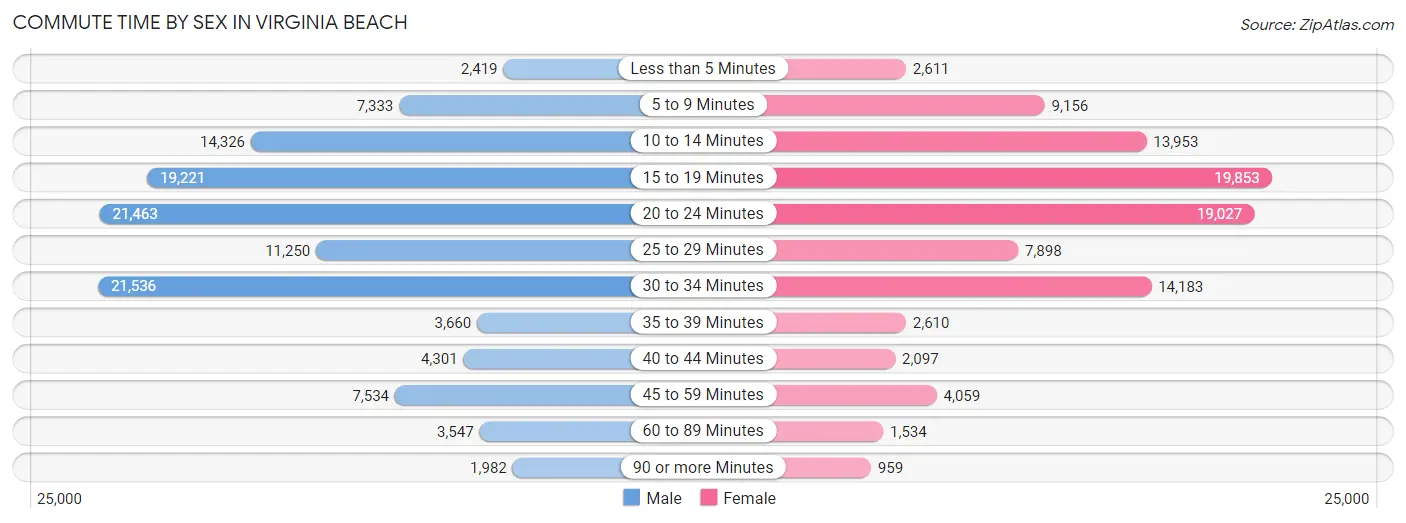
| Commute Time | Male | Female |
| Less than 5 Minutes | 2,419 (2.0%) | 2,611 (2.7%) |
| 5 to 9 Minutes | 7,333 (6.2%) | 9,156 (9.3%) |
| 10 to 14 Minutes | 14,326 (12.1%) | 13,953 (14.2%) |
| 15 to 19 Minutes | 19,221 (16.2%) | 19,853 (20.3%) |
| 20 to 24 Minutes | 21,463 (18.1%) | 19,027 (19.4%) |
| 25 to 29 Minutes | 11,250 (9.5%) | 7,898 (8.1%) |
| 30 to 34 Minutes | 21,536 (18.2%) | 14,183 (14.5%) |
| 35 to 39 Minutes | 3,660 (3.1%) | 2,610 (2.7%) |
| 40 to 44 Minutes | 4,301 (3.6%) | 2,097 (2.1%) |
| 45 to 59 Minutes | 7,534 (6.4%) | 4,059 (4.1%) |
| 60 to 89 Minutes | 3,547 (3.0%) | 1,534 (1.6%) |
| 90 or more Minutes | 1,982 (1.7%) | 959 (1.0%) |
Time of Departure to Work by Sex in Virginia Beach
The most frequent times of departure to work in Virginia Beach are 7:00 AM to 7:29 AM (16,928, 14.3%) for males and 8:00 AM to 8:29 AM (14,193, 14.5%) for females.
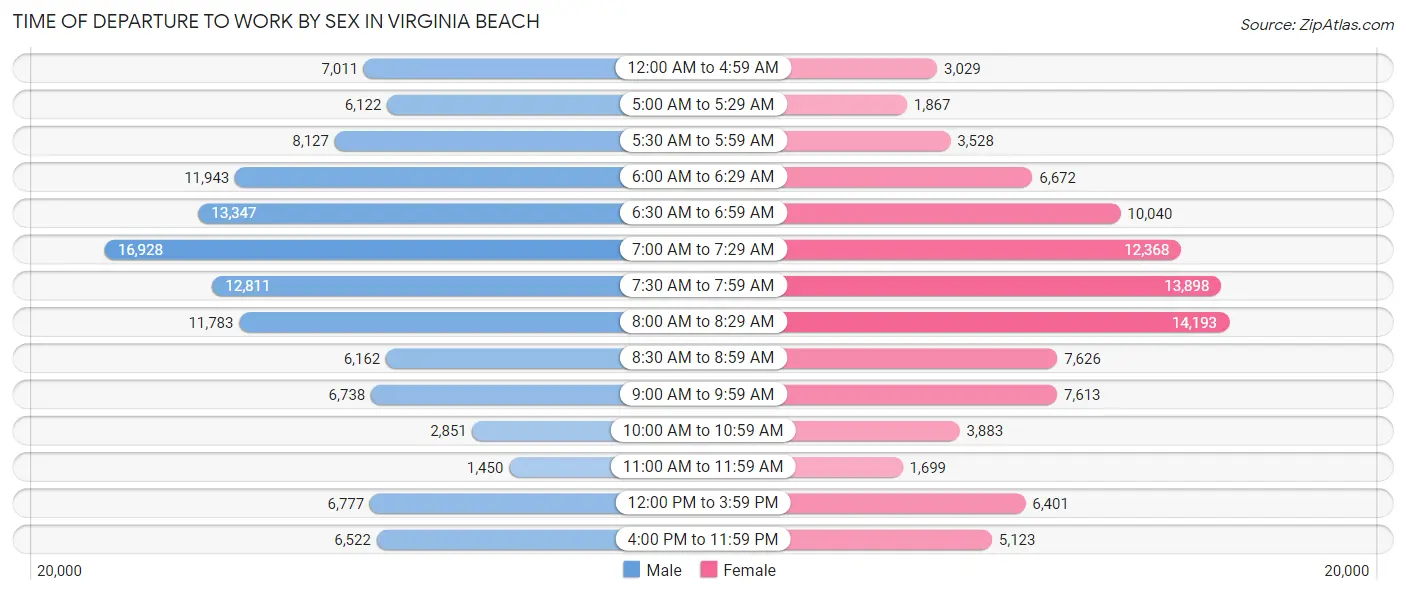
| Time of Departure | Male | Female |
| 12:00 AM to 4:59 AM | 7,011 (5.9%) | 3,029 (3.1%) |
| 5:00 AM to 5:29 AM | 6,122 (5.2%) | 1,867 (1.9%) |
| 5:30 AM to 5:59 AM | 8,127 (6.9%) | 3,528 (3.6%) |
| 6:00 AM to 6:29 AM | 11,943 (10.1%) | 6,672 (6.8%) |
| 6:30 AM to 6:59 AM | 13,347 (11.3%) | 10,040 (10.2%) |
| 7:00 AM to 7:29 AM | 16,928 (14.3%) | 12,368 (12.6%) |
| 7:30 AM to 7:59 AM | 12,811 (10.8%) | 13,898 (14.2%) |
| 8:00 AM to 8:29 AM | 11,783 (9.9%) | 14,193 (14.5%) |
| 8:30 AM to 8:59 AM | 6,162 (5.2%) | 7,626 (7.8%) |
| 9:00 AM to 9:59 AM | 6,738 (5.7%) | 7,613 (7.8%) |
| 10:00 AM to 10:59 AM | 2,851 (2.4%) | 3,883 (4.0%) |
| 11:00 AM to 11:59 AM | 1,450 (1.2%) | 1,699 (1.7%) |
| 12:00 PM to 3:59 PM | 6,777 (5.7%) | 6,401 (6.5%) |
| 4:00 PM to 11:59 PM | 6,522 (5.5%) | 5,123 (5.2%) |
| Total | 118,572 (100.0%) | 97,940 (100.0%) |
Housing Occupancy in Virginia Beach
Occupancy by Ownership in Virginia Beach
Of the total 178,915 dwellings in Virginia Beach, owner-occupied units account for 115,493 (64.5%), while renter-occupied units make up 63,422 (35.4%).
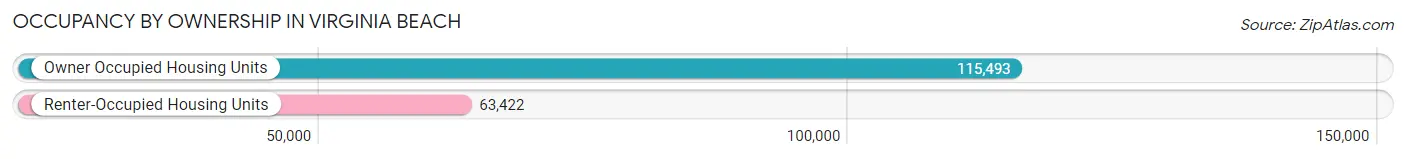
| Occupancy | # Housing Units | % Housing Units |
| Owner Occupied Housing Units | 115,493 | 64.5% |
| Renter-Occupied Housing Units | 63,422 | 35.4% |
| Total Occupied Housing Units | 178,915 | 100.0% |
Occupancy by Household Size in Virginia Beach
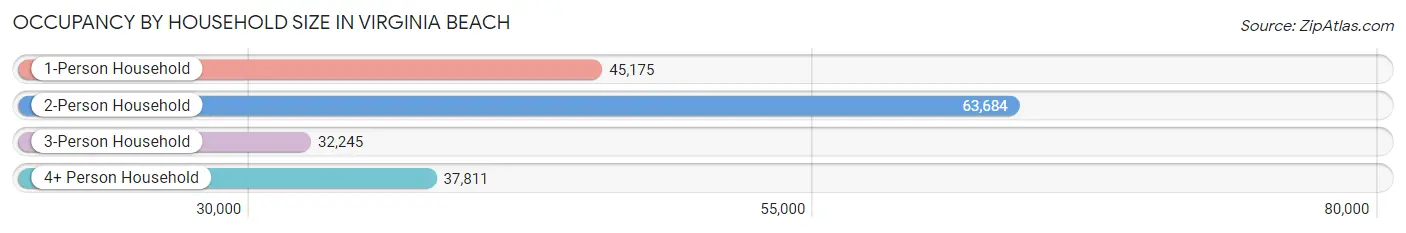
| Household Size | # Housing Units | % Housing Units |
| 1-Person Household | 45,175 | 25.3% |
| 2-Person Household | 63,684 | 35.6% |
| 3-Person Household | 32,245 | 18.0% |
| 4+ Person Household | 37,811 | 21.1% |
| Total Housing Units | 178,915 | 100.0% |
Occupancy by Ownership by Household Size in Virginia Beach
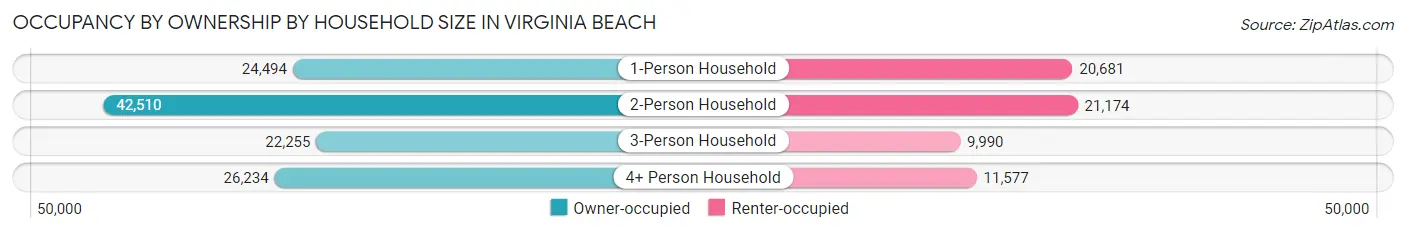
| Household Size | Owner-occupied | Renter-occupied |
| 1-Person Household | 24,494 (54.2%) | 20,681 (45.8%) |
| 2-Person Household | 42,510 (66.7%) | 21,174 (33.3%) |
| 3-Person Household | 22,255 (69.0%) | 9,990 (31.0%) |
| 4+ Person Household | 26,234 (69.4%) | 11,577 (30.6%) |
| Total Housing Units | 115,493 (64.5%) | 63,422 (35.4%) |
Occupancy by Educational Attainment in Virginia Beach
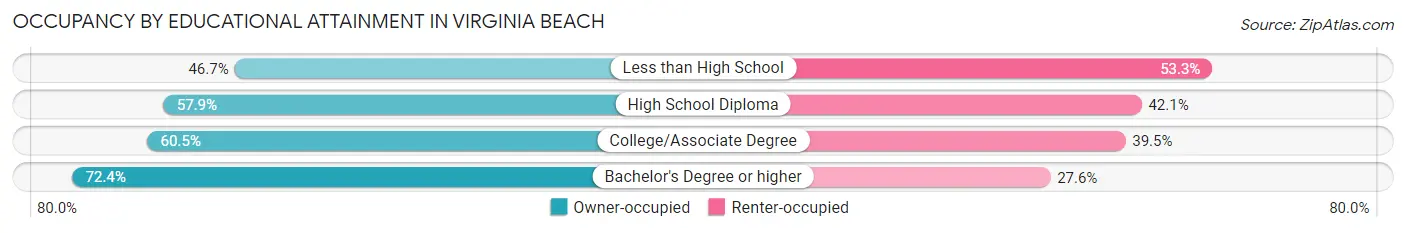
| Household Size | Owner-occupied | Renter-occupied |
| Less than High School | 3,537 (46.7%) | 4,036 (53.3%) |
| High School Diploma | 18,533 (57.9%) | 13,467 (42.1%) |
| College/Associate Degree | 37,872 (60.5%) | 24,741 (39.5%) |
| Bachelor's Degree or higher | 55,551 (72.4%) | 21,178 (27.6%) |
Occupancy by Age of Householder in Virginia Beach
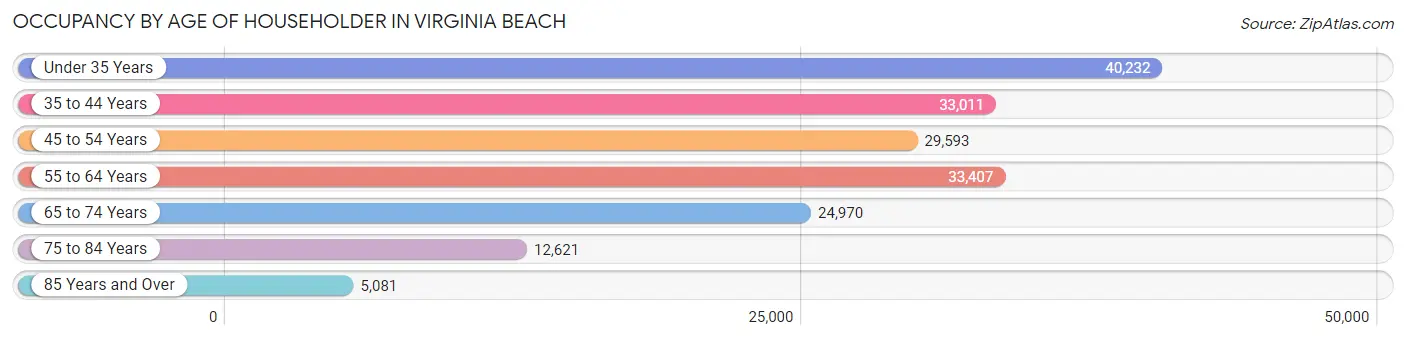
| Age Bracket | # Households | % Households |
| Under 35 Years | 40,232 | 22.5% |
| 35 to 44 Years | 33,011 | 18.4% |
| 45 to 54 Years | 29,593 | 16.5% |
| 55 to 64 Years | 33,407 | 18.7% |
| 65 to 74 Years | 24,970 | 14.0% |
| 75 to 84 Years | 12,621 | 7.0% |
| 85 Years and Over | 5,081 | 2.8% |
| Total | 178,915 | 100.0% |
Housing Finances in Virginia Beach
Median Income by Occupancy in Virginia Beach
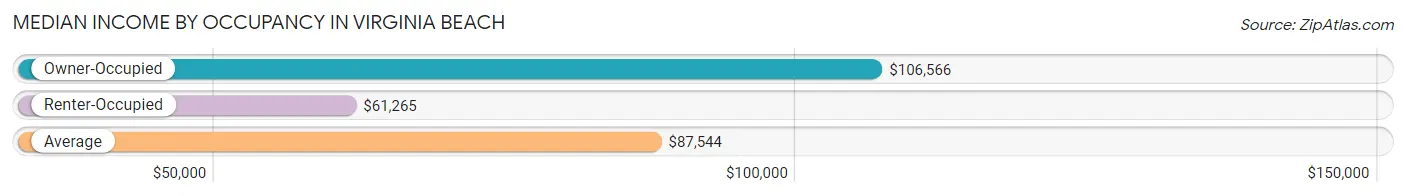
| Occupancy Type | # Households | Median Income |
| Owner-Occupied | 115,493 (64.5%) | $106,566 |
| Renter-Occupied | 63,422 (35.4%) | $61,265 |
| Average | 178,915 (100.0%) | $87,544 |
Occupancy by Householder Income Bracket in Virginia Beach
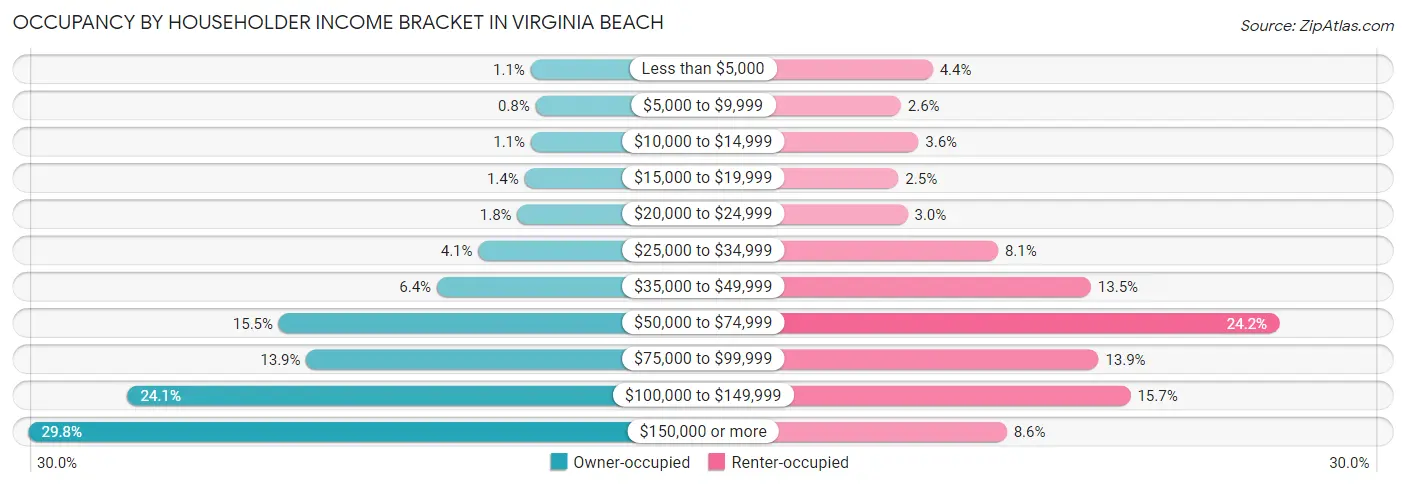
| Income Bracket | Owner-occupied | Renter-occupied |
| Less than $5,000 | 1,249 (1.1%) | 2,796 (4.4%) |
| $5,000 to $9,999 | 924 (0.8%) | 1,645 (2.6%) |
| $10,000 to $14,999 | 1,241 (1.1%) | 2,274 (3.6%) |
| $15,000 to $19,999 | 1,647 (1.4%) | 1,554 (2.5%) |
| $20,000 to $24,999 | 2,129 (1.8%) | 1,881 (3.0%) |
| $25,000 to $34,999 | 4,705 (4.1%) | 5,160 (8.1%) |
| $35,000 to $49,999 | 7,440 (6.4%) | 8,531 (13.5%) |
| $50,000 to $74,999 | 17,862 (15.5%) | 15,341 (24.2%) |
| $75,000 to $99,999 | 16,058 (13.9%) | 8,800 (13.9%) |
| $100,000 to $149,999 | 27,858 (24.1%) | 9,961 (15.7%) |
| $150,000 or more | 34,380 (29.8%) | 5,479 (8.6%) |
| Total | 115,493 (100.0%) | 63,422 (100.0%) |
Monthly Housing Cost Tiers in Virginia Beach
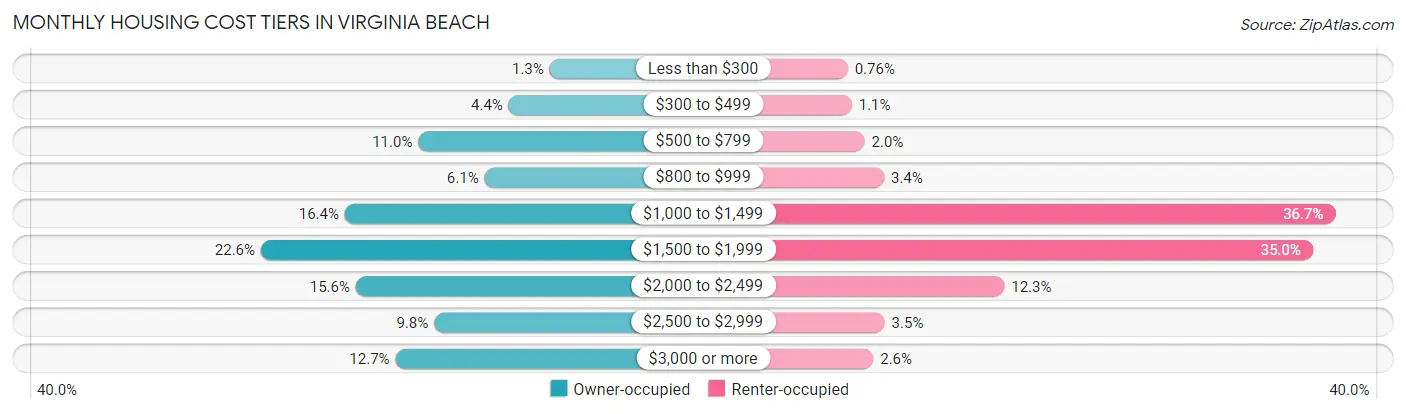
| Monthly Cost | Owner-occupied | Renter-occupied |
| Less than $300 | 1,552 (1.3%) | 484 (0.8%) |
| $300 to $499 | 5,023 (4.3%) | 670 (1.1%) |
| $500 to $799 | 12,717 (11.0%) | 1,271 (2.0%) |
| $800 to $999 | 7,079 (6.1%) | 2,177 (3.4%) |
| $1,000 to $1,499 | 18,963 (16.4%) | 23,252 (36.7%) |
| $1,500 to $1,999 | 26,102 (22.6%) | 22,203 (35.0%) |
| $2,000 to $2,499 | 18,034 (15.6%) | 7,797 (12.3%) |
| $2,500 to $2,999 | 11,362 (9.8%) | 2,205 (3.5%) |
| $3,000 or more | 14,661 (12.7%) | 1,674 (2.6%) |
| Total | 115,493 (100.0%) | 63,422 (100.0%) |
Physical Housing Characteristics in Virginia Beach
Housing Structures in Virginia Beach
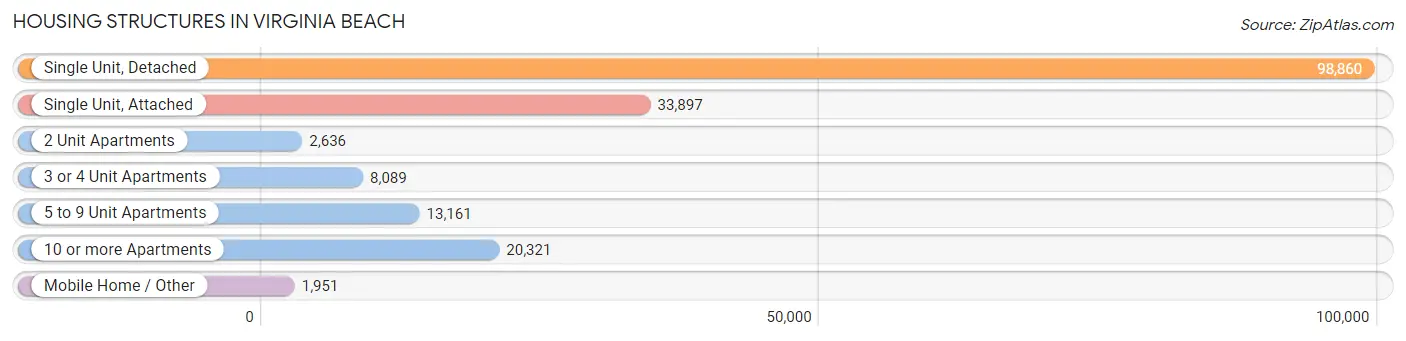
| Structure Type | # Housing Units | % Housing Units |
| Single Unit, Detached | 98,860 | 55.3% |
| Single Unit, Attached | 33,897 | 19.0% |
| 2 Unit Apartments | 2,636 | 1.5% |
| 3 or 4 Unit Apartments | 8,089 | 4.5% |
| 5 to 9 Unit Apartments | 13,161 | 7.4% |
| 10 or more Apartments | 20,321 | 11.4% |
| Mobile Home / Other | 1,951 | 1.1% |
| Total | 178,915 | 100.0% |
Housing Structures by Occupancy in Virginia Beach
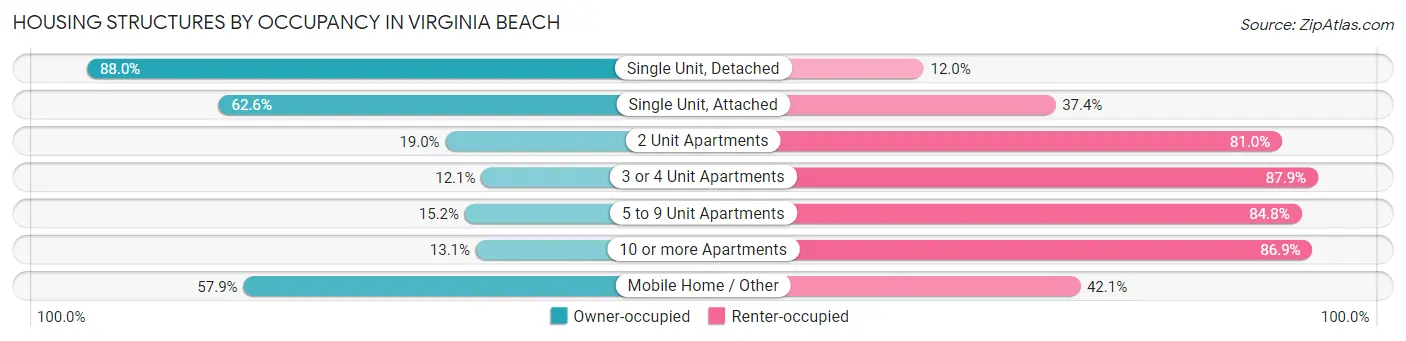
| Structure Type | Owner-occupied | Renter-occupied |
| Single Unit, Detached | 86,985 (88.0%) | 11,875 (12.0%) |
| Single Unit, Attached | 21,232 (62.6%) | 12,665 (37.4%) |
| 2 Unit Apartments | 500 (19.0%) | 2,136 (81.0%) |
| 3 or 4 Unit Apartments | 976 (12.1%) | 7,113 (87.9%) |
| 5 to 9 Unit Apartments | 2,004 (15.2%) | 11,157 (84.8%) |
| 10 or more Apartments | 2,667 (13.1%) | 17,654 (86.9%) |
| Mobile Home / Other | 1,129 (57.9%) | 822 (42.1%) |
| Total | 115,493 (64.5%) | 63,422 (35.4%) |
Housing Structures by Number of Rooms in Virginia Beach
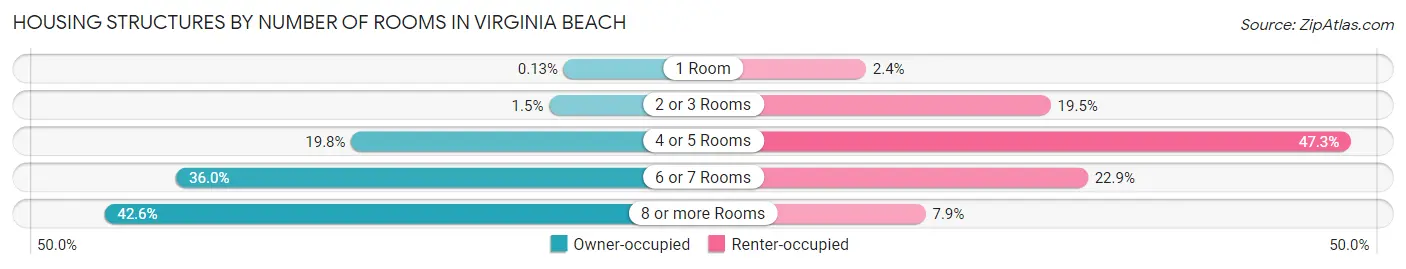
| Number of Rooms | Owner-occupied | Renter-occupied |
| 1 Room | 152 (0.1%) | 1,522 (2.4%) |
| 2 or 3 Rooms | 1,705 (1.5%) | 12,363 (19.5%) |
| 4 or 5 Rooms | 22,843 (19.8%) | 29,982 (47.3%) |
| 6 or 7 Rooms | 41,558 (36.0%) | 14,535 (22.9%) |
| 8 or more Rooms | 49,235 (42.6%) | 5,020 (7.9%) |
| Total | 115,493 (100.0%) | 63,422 (100.0%) |
Housing Structure by Heating Type in Virginia Beach
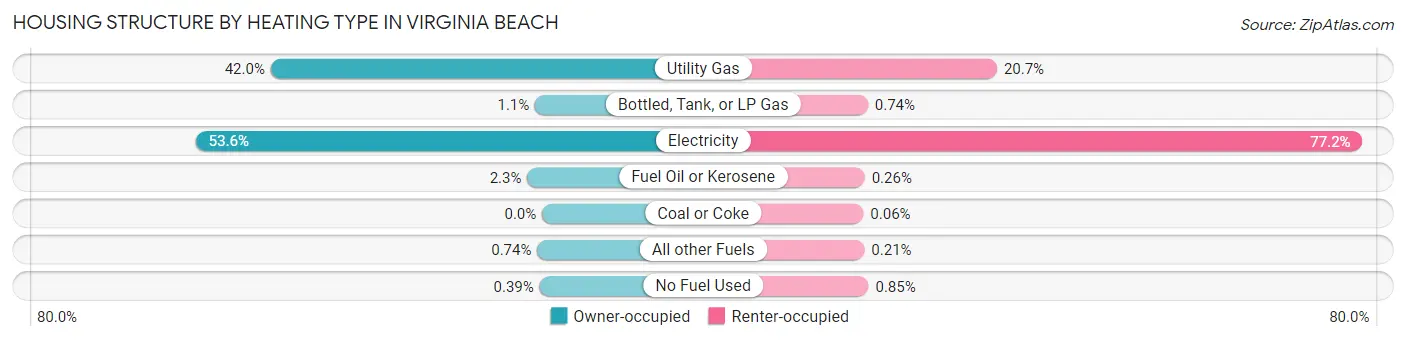
| Heating Type | Owner-occupied | Renter-occupied |
| Utility Gas | 48,444 (41.9%) | 13,126 (20.7%) |
| Bottled, Tank, or LP Gas | 1,253 (1.1%) | 467 (0.7%) |
| Electricity | 61,845 (53.5%) | 48,958 (77.2%) |
| Fuel Oil or Kerosene | 2,645 (2.3%) | 162 (0.3%) |
| Coal or Coke | 0 (0.0%) | 36 (0.1%) |
| All other Fuels | 855 (0.7%) | 131 (0.2%) |
| No Fuel Used | 451 (0.4%) | 542 (0.9%) |
| Total | 115,493 (100.0%) | 63,422 (100.0%) |
Household Vehicle Usage in Virginia Beach
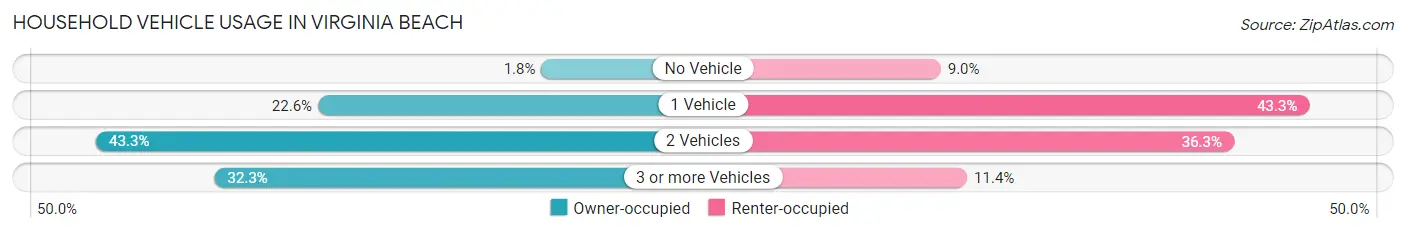
| Vehicles per Household | Owner-occupied | Renter-occupied |
| No Vehicle | 2,049 (1.8%) | 5,674 (8.9%) |
| 1 Vehicle | 26,121 (22.6%) | 27,489 (43.3%) |
| 2 Vehicles | 50,043 (43.3%) | 23,025 (36.3%) |
| 3 or more Vehicles | 37,280 (32.3%) | 7,234 (11.4%) |
| Total | 115,493 (100.0%) | 63,422 (100.0%) |
Real Estate & Mortgages in Virginia Beach
Real Estate and Mortgage Overview in Virginia Beach
| Characteristic | Without Mortgage | With Mortgage |
| Housing Units | 28,664 | 86,829 |
| Median Property Value | $346,800 | $342,700 |
| Median Household Income | $84,894 | $27,669 |
| Monthly Housing Costs | $696 | $14,331 |
| Real Estate Taxes | $3,005 | $3,376 |
Property Value by Mortgage Status in Virginia Beach
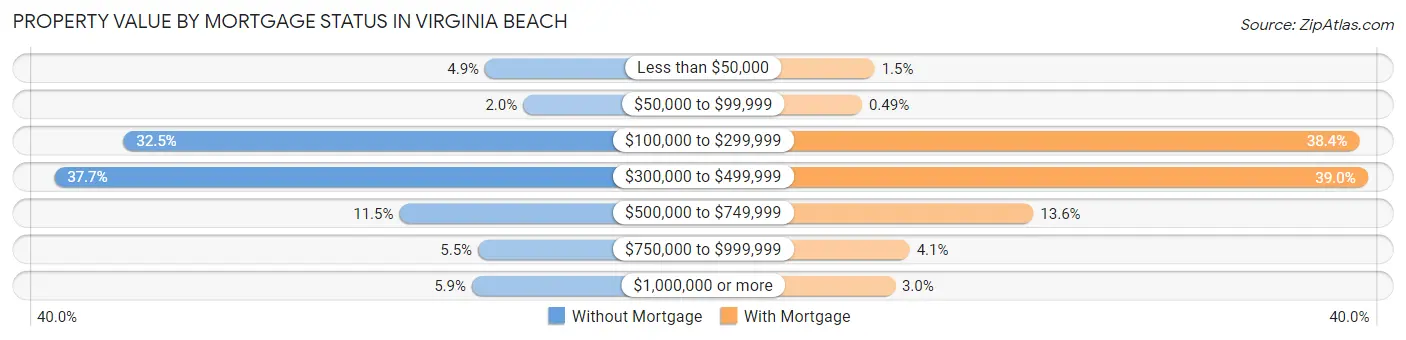
| Property Value | Without Mortgage | With Mortgage |
| Less than $50,000 | 1,414 (4.9%) | 1,266 (1.5%) |
| $50,000 to $99,999 | 578 (2.0%) | 429 (0.5%) |
| $100,000 to $299,999 | 9,308 (32.5%) | 33,311 (38.4%) |
| $300,000 to $499,999 | 10,819 (37.7%) | 33,869 (39.0%) |
| $500,000 to $749,999 | 3,281 (11.5%) | 11,761 (13.6%) |
| $750,000 to $999,999 | 1,565 (5.5%) | 3,590 (4.1%) |
| $1,000,000 or more | 1,699 (5.9%) | 2,603 (3.0%) |
| Total | 28,664 (100.0%) | 86,829 (100.0%) |
Household Income by Mortgage Status in Virginia Beach
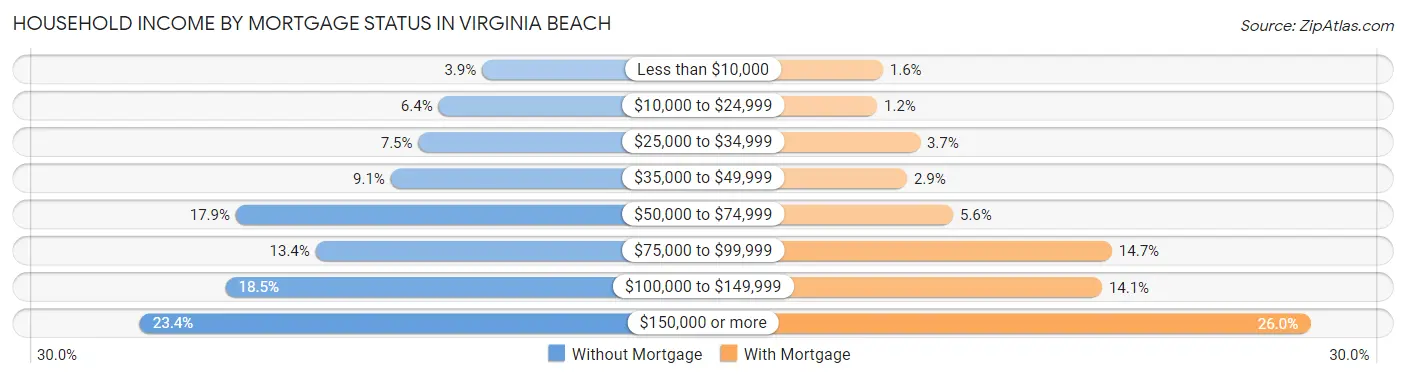
| Household Income | Without Mortgage | With Mortgage |
| Less than $10,000 | 1,107 (3.9%) | 1,358 (1.6%) |
| $10,000 to $24,999 | 1,819 (6.4%) | 1,066 (1.2%) |
| $25,000 to $34,999 | 2,149 (7.5%) | 3,198 (3.7%) |
| $35,000 to $49,999 | 2,602 (9.1%) | 2,556 (2.9%) |
| $50,000 to $74,999 | 5,139 (17.9%) | 4,838 (5.6%) |
| $75,000 to $99,999 | 3,831 (13.4%) | 12,723 (14.6%) |
| $100,000 to $149,999 | 5,306 (18.5%) | 12,227 (14.1%) |
| $150,000 or more | 6,711 (23.4%) | 22,552 (26.0%) |
| Total | 28,664 (100.0%) | 86,829 (100.0%) |
Property Value to Household Income Ratio in Virginia Beach
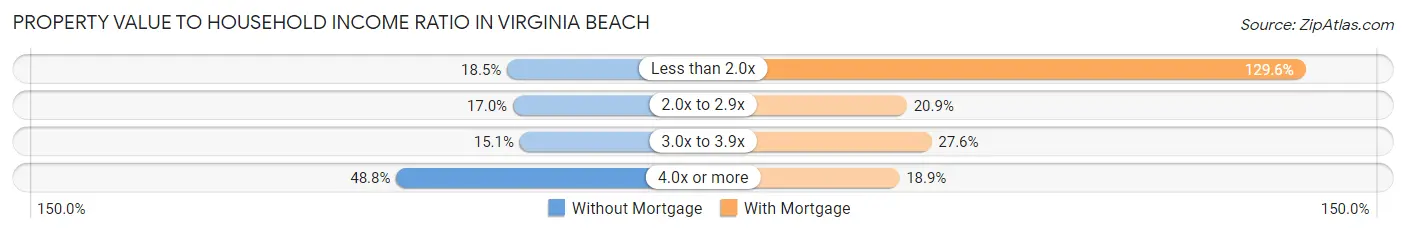
| Value-to-Income Ratio | Without Mortgage | With Mortgage |
| Less than 2.0x | 5,313 (18.5%) | 112,501 (129.6%) |
| 2.0x to 2.9x | 4,864 (17.0%) | 18,175 (20.9%) |
| 3.0x to 3.9x | 4,325 (15.1%) | 24,002 (27.6%) |
| 4.0x or more | 13,975 (48.7%) | 16,385 (18.9%) |
| Total | 28,664 (100.0%) | 86,829 (100.0%) |
Real Estate Taxes by Mortgage Status in Virginia Beach
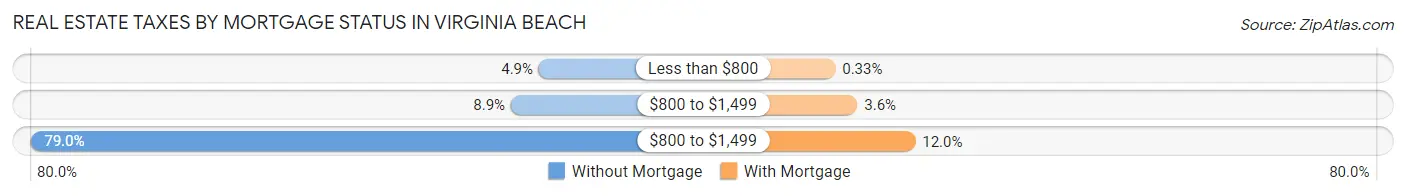
| Property Taxes | Without Mortgage | With Mortgage |
| Less than $800 | 1,393 (4.9%) | 284 (0.3%) |
| $800 to $1,499 | 2,562 (8.9%) | 3,085 (3.5%) |
| $800 to $1,499 | 22,648 (79.0%) | 10,435 (12.0%) |
| Total | 28,664 (100.0%) | 86,829 (100.0%) |
Health & Disability in Virginia Beach
Health Insurance Coverage by Age in Virginia Beach
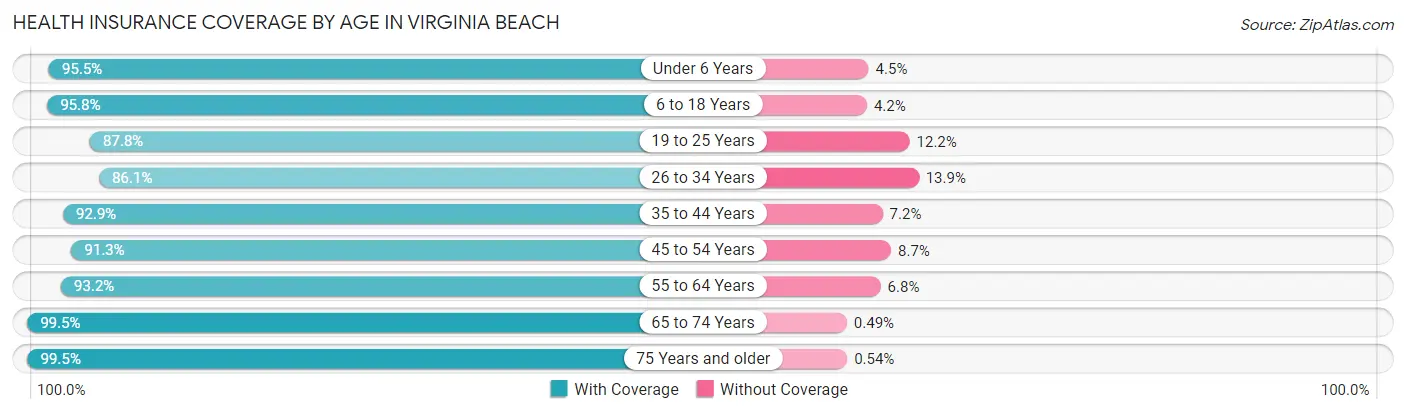
| Age Bracket | With Coverage | Without Coverage |
| Under 6 Years | 31,149 (95.5%) | 1,480 (4.5%) |
| 6 to 18 Years | 69,680 (95.8%) | 3,079 (4.2%) |
| 19 to 25 Years | 31,565 (87.8%) | 4,379 (12.2%) |
| 26 to 34 Years | 49,009 (86.1%) | 7,899 (13.9%) |
| 35 to 44 Years | 53,680 (92.8%) | 4,134 (7.1%) |
| 45 to 54 Years | 48,201 (91.3%) | 4,609 (8.7%) |
| 55 to 64 Years | 53,208 (93.2%) | 3,872 (6.8%) |
| 65 to 74 Years | 40,145 (99.5%) | 196 (0.5%) |
| 75 Years and older | 26,956 (99.5%) | 145 (0.5%) |
| Total | 403,593 (93.1%) | 29,793 (6.9%) |
Health Insurance Coverage by Citizenship Status in Virginia Beach
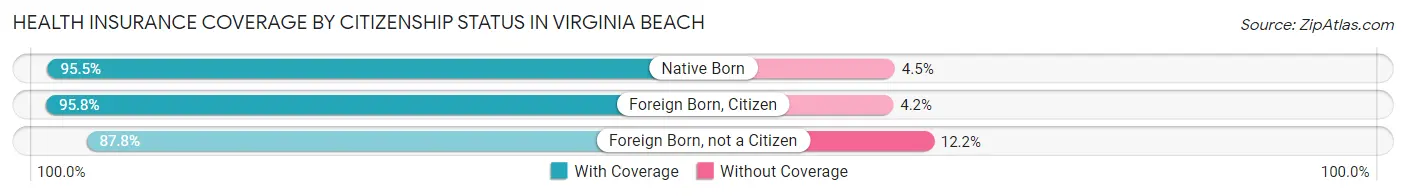
| Citizenship Status | With Coverage | Without Coverage |
| Native Born | 31,149 (95.5%) | 1,480 (4.5%) |
| Foreign Born, Citizen | 69,680 (95.8%) | 3,079 (4.2%) |
| Foreign Born, not a Citizen | 31,565 (87.8%) | 4,379 (12.2%) |
Health Insurance Coverage by Household Income in Virginia Beach
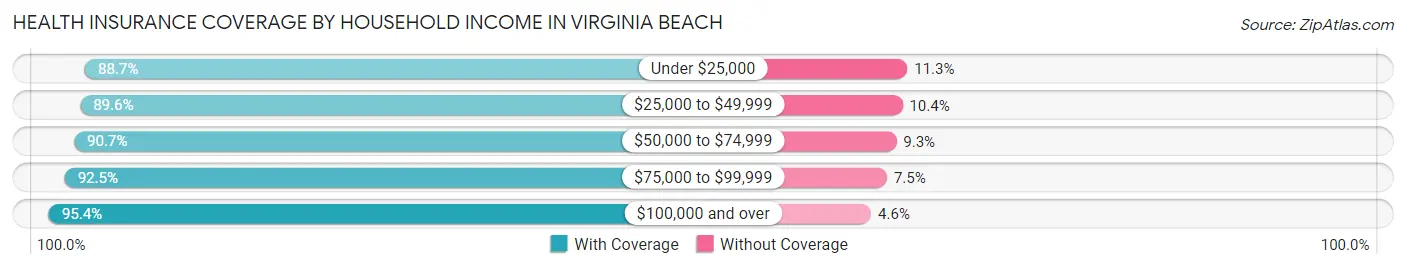
| Household Income | With Coverage | Without Coverage |
| Under $25,000 | 26,988 (88.7%) | 3,451 (11.3%) |
| $25,000 to $49,999 | 44,310 (89.6%) | 5,158 (10.4%) |
| $50,000 to $74,999 | 63,142 (90.7%) | 6,456 (9.3%) |
| $75,000 to $99,999 | 55,030 (92.5%) | 4,481 (7.5%) |
| $100,000 and over | 212,397 (95.4%) | 10,159 (4.6%) |
Public vs Private Health Insurance Coverage by Age in Virginia Beach
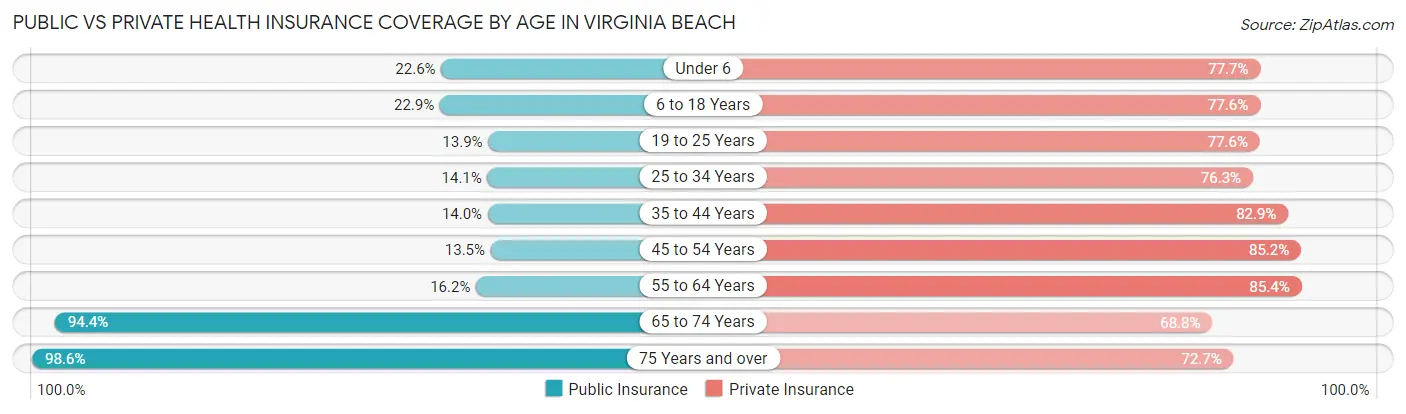
| Age Bracket | Public Insurance | Private Insurance |
| Under 6 | 7,385 (22.6%) | 25,343 (77.7%) |
| 6 to 18 Years | 16,652 (22.9%) | 56,483 (77.6%) |
| 19 to 25 Years | 5,001 (13.9%) | 27,887 (77.6%) |
| 25 to 34 Years | 8,000 (14.1%) | 43,418 (76.3%) |
| 35 to 44 Years | 8,096 (14.0%) | 47,900 (82.9%) |
| 45 to 54 Years | 7,109 (13.5%) | 45,016 (85.2%) |
| 55 to 64 Years | 9,231 (16.2%) | 48,715 (85.4%) |
| 65 to 74 Years | 38,071 (94.4%) | 27,741 (68.8%) |
| 75 Years and over | 26,723 (98.6%) | 19,704 (72.7%) |
| Total | 126,268 (29.1%) | 342,207 (79.0%) |
Disability Status by Sex by Age in Virginia Beach
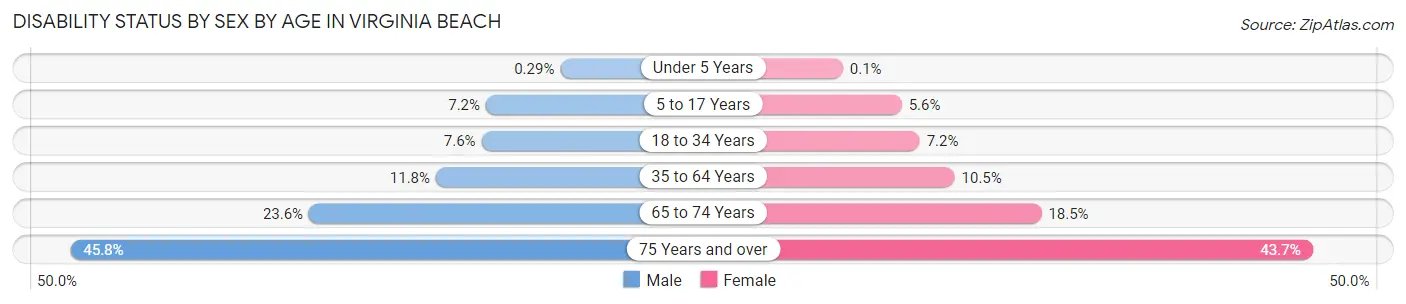
| Age Bracket | Male | Female |
| Under 5 Years | 41 (0.3%) | 14 (0.1%) |
| 5 to 17 Years | 2,707 (7.2%) | 1,981 (5.6%) |
| 18 to 34 Years | 3,488 (7.6%) | 3,721 (7.2%) |
| 35 to 64 Years | 9,347 (11.8%) | 9,287 (10.5%) |
| 65 to 74 Years | 4,321 (23.6%) | 4,084 (18.5%) |
| 75 Years and over | 4,990 (45.8%) | 7,073 (43.7%) |
Disability Class by Sex by Age in Virginia Beach
Disability Class: Hearing Difficulty
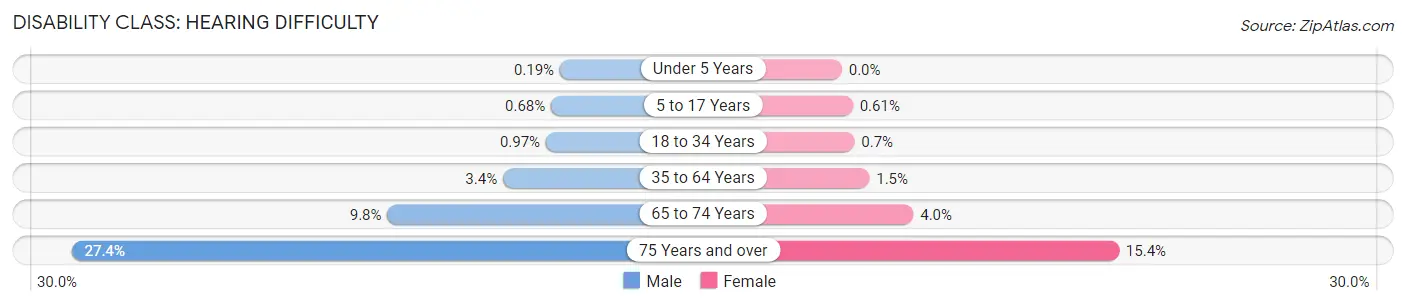
| Age Bracket | Male | Female |
| Under 5 Years | 27 (0.2%) | 0 (0.0%) |
| 5 to 17 Years | 256 (0.7%) | 216 (0.6%) |
| 18 to 34 Years | 445 (1.0%) | 363 (0.7%) |
| 35 to 64 Years | 2,655 (3.4%) | 1,356 (1.5%) |
| 65 to 74 Years | 1,794 (9.8%) | 877 (4.0%) |
| 75 Years and over | 2,987 (27.4%) | 2,498 (15.4%) |
Disability Class: Vision Difficulty
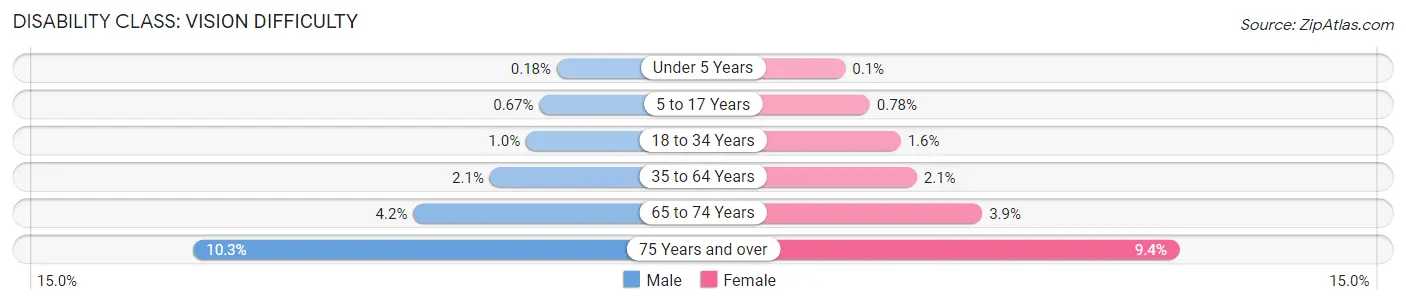
| Age Bracket | Male | Female |
| Under 5 Years | 26 (0.2%) | 14 (0.1%) |
| 5 to 17 Years | 253 (0.7%) | 278 (0.8%) |
| 18 to 34 Years | 478 (1.0%) | 844 (1.6%) |
| 35 to 64 Years | 1,617 (2.1%) | 1,852 (2.1%) |
| 65 to 74 Years | 764 (4.2%) | 862 (3.9%) |
| 75 Years and over | 1,123 (10.3%) | 1,519 (9.4%) |
Disability Class: Cognitive Difficulty
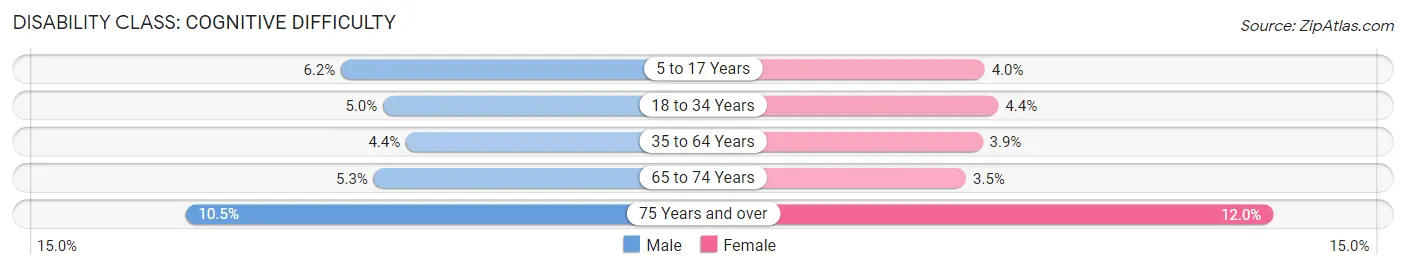
| Age Bracket | Male | Female |
| 5 to 17 Years | 2,329 (6.2%) | 1,419 (4.0%) |
| 18 to 34 Years | 2,303 (5.0%) | 2,247 (4.4%) |
| 35 to 64 Years | 3,461 (4.4%) | 3,476 (3.9%) |
| 65 to 74 Years | 966 (5.3%) | 763 (3.5%) |
| 75 Years and over | 1,147 (10.5%) | 1,944 (12.0%) |
Disability Class: Ambulatory Difficulty
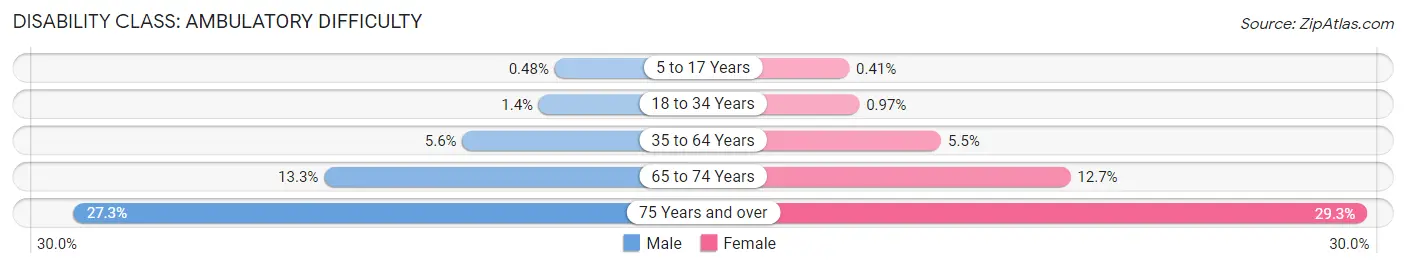
| Age Bracket | Male | Female |
| 5 to 17 Years | 179 (0.5%) | 145 (0.4%) |
| 18 to 34 Years | 623 (1.4%) | 498 (1.0%) |
| 35 to 64 Years | 4,444 (5.6%) | 4,903 (5.5%) |
| 65 to 74 Years | 2,437 (13.3%) | 2,807 (12.7%) |
| 75 Years and over | 2,973 (27.3%) | 4,736 (29.2%) |
Disability Class: Self-Care Difficulty
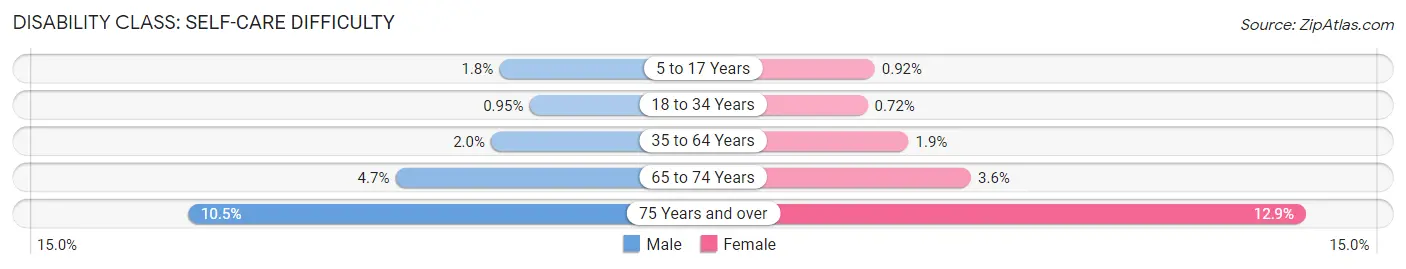
| Age Bracket | Male | Female |
| 5 to 17 Years | 675 (1.8%) | 329 (0.9%) |
| 18 to 34 Years | 437 (0.9%) | 373 (0.7%) |
| 35 to 64 Years | 1,595 (2.0%) | 1,648 (1.9%) |
| 65 to 74 Years | 857 (4.7%) | 794 (3.6%) |
| 75 Years and over | 1,140 (10.4%) | 2,092 (12.9%) |
Technology Access in Virginia Beach
Computing Device Access in Virginia Beach
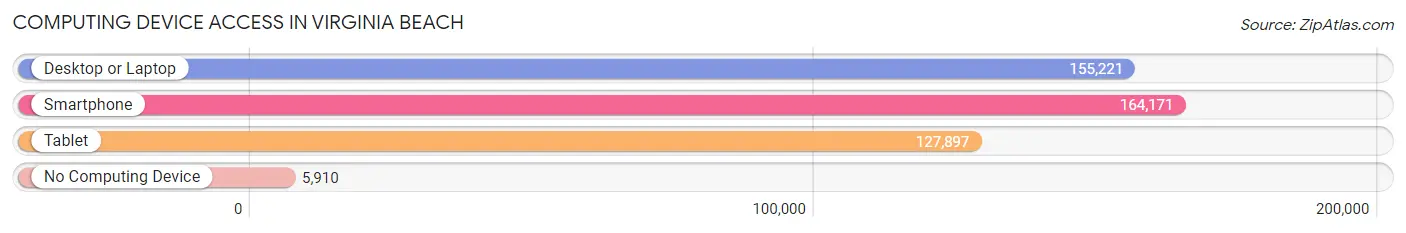
| Device Type | # Households | % Households |
| Desktop or Laptop | 155,221 | 86.8% |
| Smartphone | 164,171 | 91.8% |
| Tablet | 127,897 | 71.5% |
| No Computing Device | 5,910 | 3.3% |
| Total | 178,915 | 100.0% |
Internet Access in Virginia Beach
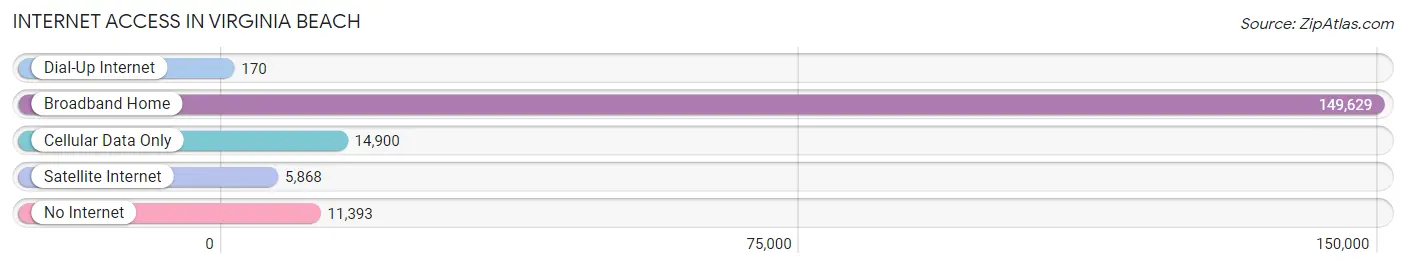
| Internet Type | # Households | % Households |
| Dial-Up Internet | 170 | 0.1% |
| Broadband Home | 149,629 | 83.6% |
| Cellular Data Only | 14,900 | 8.3% |
| Satellite Internet | 5,868 | 3.3% |
| No Internet | 11,393 | 6.4% |
| Total | 178,915 | 100.0% |
Virginia Beach Summary
Virginia Beach is a city located in the Commonwealth of Virginia in the United States. It is the most populous city in the state, with an estimated population of 447,021 in 2019. It is located on the Atlantic Ocean at the mouth of the Chesapeake Bay. It is the second-largest city in the Hampton Roads metropolitan area, which is home to over 1.7 million people.
History
The area that is now Virginia Beach was first inhabited by Native Americans, including the Powhatan, Nansemond, and Chesapeake tribes. The first European settlers arrived in the area in 1607, when the English established the Jamestown Settlement. The area was part of Princess Anne County until 1963, when it became an independent city.
Virginia Beach was initially a resort town, with the first hotel opening in 1883. The city was incorporated in 1906 and grew rapidly in the 20th century, becoming a popular tourist destination. The city was also a major military base during World War II, with the Naval Air Station Oceana and the Naval Amphibious Base Little Creek located in the city.
Geography
Virginia Beach is located in the southeastern corner of Virginia, at the mouth of the Chesapeake Bay. It is bordered by the cities of Norfolk to the northwest, Chesapeake to the west, and the Atlantic Ocean to the east. The city covers an area of 497 square miles, with a total land area of 437 square miles. The city is divided into seven boroughs: Bayside, Beach, Kempsville, Lynnhaven, Princess Anne, Pungo, and Virginia Beach.
The city has a humid subtropical climate, with hot, humid summers and mild winters. The average annual temperature is 62°F, with an average high of 79°F in July and an average low of 45°F in January. The average annual precipitation is 44.5 inches.
Economy
Virginia Beach is a major tourist destination, with over 8 million visitors each year. The city is home to several major attractions, including the Virginia Aquarium & Marine Science Center, the Virginia Beach Boardwalk, and the Virginia Beach Oceanfront. The city is also home to several military bases, including the Naval Air Station Oceana and the Naval Amphibious Base Little Creek.
The city's economy is also driven by its large service sector, which includes tourism, retail, and government services. The city is home to several major employers, including the City of Virginia Beach, Sentara Healthcare, and the Virginia Beach City Public Schools.
Demographics
As of the 2019 census, Virginia Beach had an estimated population of 447,021. The city has a population density of 890 people per square mile. The racial makeup of the city is 73.3% White, 15.2% African American, 5.3% Asian, and 4.2% Hispanic or Latino.
The median household income in Virginia Beach is $63,945, and the median family income is $76,945. The city has a poverty rate of 8.7%. The city is home to several colleges and universities, including Old Dominion University, Regent University, and Virginia Wesleyan University.
Common Questions
What is Per Capita Income in Virginia Beach?
Per Capita income in Virginia Beach is $45,320.
What is the Median Family Income in Virginia Beach?
Median Family Income in Virginia Beach is $103,720.
What is the Median Household income in Virginia Beach?
Median Household Income in Virginia Beach is $87,544.
What is Income or Wage Gap in Virginia Beach?
Income or Wage Gap in Virginia Beach is 28.7%.
Women in Virginia Beach earn 71.3 cents for every dollar earned by a man.
What is Family Income Deficit in Virginia Beach?
Family Income Deficit in Virginia Beach is $11,607.
Families that are below poverty line in Virginia Beach earn $11,607 less on average than the poverty threshold level.
What is Inequality or Gini Index in Virginia Beach?
Inequality or Gini Index in Virginia Beach is 0.43.
What is the Total Population of Virginia Beach?
Total Population of Virginia Beach is 457,900.
What is the Total Male Population of Virginia Beach?
Total Male Population of Virginia Beach is 225,616.
What is the Total Female Population of Virginia Beach?
Total Female Population of Virginia Beach is 232,284.
What is the Ratio of Males per 100 Females in Virginia Beach?
There are 97.13 Males per 100 Females in Virginia Beach.
What is the Ratio of Females per 100 Males in Virginia Beach?
There are 102.96 Females per 100 Males in Virginia Beach.
What is the Median Population Age in Virginia Beach?
Median Population Age in Virginia Beach is 37.1 Years.
What is the Average Family Size in Virginia Beach
Average Family Size in Virginia Beach is 3.0 People.
What is the Average Household Size in Virginia Beach
Average Household Size in Virginia Beach is 2.5 People.
How Large is the Labor Force in Virginia Beach?
There are 256,203 People in the Labor Forcein in Virginia Beach.
What is the Percentage of People in the Labor Force in Virginia Beach?
69.5% of People are in the Labor Force in Virginia Beach.
What is the Unemployment Rate in Virginia Beach?
Unemployment Rate in Virginia Beach is 4.3%.