Zip Codes with the Lowest Percentage of Births to Unmarried Women over the Age of 35 in Virginia
RELATED REPORTS & OPTIONS
Lowest Illegitimacy | Women 35+
Virginia
Compare Zip Codes
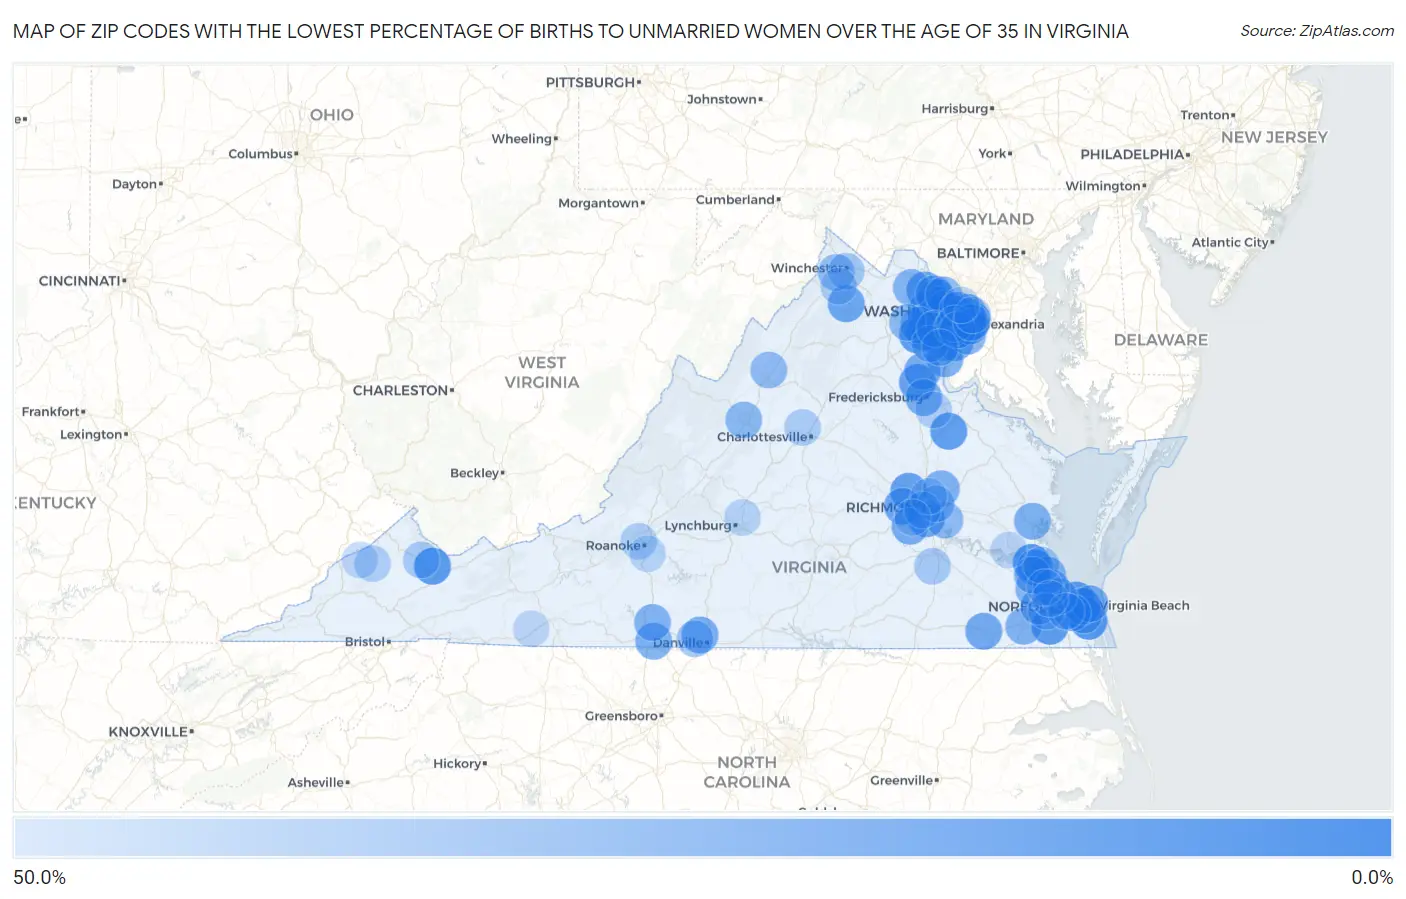
Map of Zip Codes with the Lowest Percentage of Births to Unmarried Women over the Age of 35 in Virginia
50.0%
0.0%
Zip Codes with the Lowest Percentage of Births to Unmarried Women over the Age of 35 in Virginia
| Zip Code | % Unmarried | vs State | vs National | |
| 1. | 23608 | 0.80% | 16.7%(-15.9)#1 | 20.1%(-19.3)#12 |
| 2. | 23456 | 1.3% | 16.7%(-15.4)#2 | 20.1%(-18.8)#29 |
| 3. | 22030 | 2.3% | 16.7%(-14.4)#3 | 20.1%(-17.8)#64 |
| 4. | 23323 | 2.6% | 16.7%(-14.1)#4 | 20.1%(-17.5)#84 |
| 5. | 20136 | 3.4% | 16.7%(-13.3)#5 | 20.1%(-16.7)#140 |
| 6. | 24641 | 3.4% | 16.7%(-13.3)#6 | 20.1%(-16.7)#143 |
| 7. | 23455 | 3.8% | 16.7%(-12.9)#7 | 20.1%(-16.3)#167 |
| 8. | 22427 | 4.5% | 16.7%(-12.2)#8 | 20.1%(-15.6)#241 |
| 9. | 22153 | 5.6% | 16.7%(-11.1)#9 | 20.1%(-14.5)#362 |
| 10. | 22406 | 6.0% | 16.7%(-10.7)#10 | 20.1%(-14.1)#400 |
| 11. | 23233 | 6.2% | 16.7%(-10.5)#11 | 20.1%(-13.9)#418 |
| 12. | 22201 | 7.1% | 16.7%(-9.60)#12 | 20.1%(-13.0)#499 |
| 13. | 22192 | 8.7% | 16.7%(-8.00)#13 | 20.1%(-11.4)#692 |
| 14. | 23234 | 8.8% | 16.7%(-7.90)#14 | 20.1%(-11.3)#708 |
| 15. | 22630 | 8.8% | 16.7%(-7.90)#15 | 20.1%(-11.3)#712 |
| 16. | 22003 | 9.6% | 16.7%(-7.10)#16 | 20.1%(-10.5)#793 |
| 17. | 20147 | 9.7% | 16.7%(-7.00)#17 | 20.1%(-10.4)#803 |
| 18. | 23113 | 9.7% | 16.7%(-7.00)#18 | 20.1%(-10.4)#810 |
| 19. | 20170 | 9.8% | 16.7%(-6.90)#19 | 20.1%(-10.3)#815 |
| 20. | 22124 | 9.9% | 16.7%(-6.80)#20 | 20.1%(-10.2)#823 |
| 21. | 22310 | 10.0% | 16.7%(-6.70)#21 | 20.1%(-10.1)#828 |
| 22. | 22305 | 10.4% | 16.7%(-6.30)#22 | 20.1%(-9.70)#877 |
| 23. | 23453 | 10.5% | 16.7%(-6.20)#23 | 20.1%(-9.60)#884 |
| 24. | 22079 | 10.7% | 16.7%(-6.00)#24 | 20.1%(-9.40)#899 |
| 25. | 23851 | 10.9% | 16.7%(-5.80)#25 | 20.1%(-9.20)#931 |
| 26. | 20121 | 11.1% | 16.7%(-5.60)#26 | 20.1%(-9.00)#945 |
| 27. | 22315 | 11.3% | 16.7%(-5.40)#27 | 20.1%(-8.80)#967 |
| 28. | 23452 | 11.4% | 16.7%(-5.30)#28 | 20.1%(-8.70)#971 |
| 29. | 24540 | 12.9% | 16.7%(-3.80)#29 | 20.1%(-7.20)#1,159 |
| 30. | 23832 | 13.0% | 16.7%(-3.70)#30 | 20.1%(-7.10)#1,172 |
| 31. | 20111 | 13.2% | 16.7%(-3.50)#31 | 20.1%(-6.90)#1,196 |
| 32. | 22026 | 13.5% | 16.7%(-3.20)#32 | 20.1%(-6.60)#1,238 |
| 33. | 20110 | 13.6% | 16.7%(-3.10)#33 | 20.1%(-6.50)#1,242 |
| 34. | 22031 | 13.8% | 16.7%(-2.90)#34 | 20.1%(-6.30)#1,263 |
| 35. | 22556 | 13.8% | 16.7%(-2.90)#35 | 20.1%(-6.30)#1,265 |
| 36. | 23451 | 13.9% | 16.7%(-2.80)#36 | 20.1%(-6.20)#1,273 |
| 37. | 22401 | 14.0% | 16.7%(-2.70)#37 | 20.1%(-6.10)#1,288 |
| 38. | 22302 | 14.2% | 16.7%(-2.50)#38 | 20.1%(-5.90)#1,315 |
| 39. | 20191 | 14.4% | 16.7%(-2.30)#39 | 20.1%(-5.70)#1,353 |
| 40. | 20151 | 14.6% | 16.7%(-2.10)#40 | 20.1%(-5.50)#1,380 |
| 41. | 23666 | 15.0% | 16.7%(-1.70)#41 | 20.1%(-5.10)#1,410 |
| 42. | 23061 | 15.2% | 16.7%(-1.50)#42 | 20.1%(-4.90)#1,436 |
| 43. | 24148 | 15.4% | 16.7%(-1.30)#43 | 20.1%(-4.70)#1,457 |
| 44. | 23464 | 15.9% | 16.7%(-0.800)#44 | 20.1%(-4.20)#1,502 |
| 45. | 23116 | 15.9% | 16.7%(-0.800)#45 | 20.1%(-4.20)#1,504 |
| 46. | 23434 | 16.7% | 16.7%(=0.000)#46 | 20.1%(-3.40)#1,582 |
| 47. | 23314 | 16.7% | 16.7%(=0.000)#47 | 20.1%(-3.40)#1,602 |
| 48. | 23435 | 16.8% | 16.7%(+0.100)#48 | 20.1%(-3.30)#1,619 |
| 49. | 23505 | 16.8% | 16.7%(+0.100)#49 | 20.1%(-3.30)#1,621 |
| 50. | 22204 | 17.3% | 16.7%(+0.600)#50 | 20.1%(-2.80)#1,674 |
| 51. | 22042 | 17.3% | 16.7%(+0.600)#51 | 20.1%(-2.80)#1,676 |
| 52. | 23602 | 17.5% | 16.7%(+0.800)#52 | 20.1%(-2.60)#1,696 |
| 53. | 22309 | 17.5% | 16.7%(+0.800)#53 | 20.1%(-2.60)#1,697 |
| 54. | 23606 | 17.5% | 16.7%(+0.800)#54 | 20.1%(-2.60)#1,700 |
| 55. | 20175 | 17.8% | 16.7%(+1.10)#55 | 20.1%(-2.30)#1,728 |
| 56. | 24112 | 17.8% | 16.7%(+1.10)#56 | 20.1%(-2.30)#1,729 |
| 57. | 22181 | 18.4% | 16.7%(+1.70)#57 | 20.1%(-1.70)#1,801 |
| 58. | 20164 | 18.7% | 16.7%(+2.00)#58 | 20.1%(-1.40)#1,829 |
| 59. | 20109 | 18.8% | 16.7%(+2.10)#59 | 20.1%(-1.30)#1,840 |
| 60. | 22066 | 18.9% | 16.7%(+2.20)#60 | 20.1%(-1.20)#1,865 |
| 61. | 23661 | 18.9% | 16.7%(+2.20)#61 | 20.1%(-1.20)#1,867 |
| 62. | 24401 | 20.0% | 16.7%(+3.30)#62 | 20.1%(-0.100)#1,958 |
| 63. | 20155 | 21.1% | 16.7%(+4.40)#63 | 20.1%(+1.00)#2,084 |
| 64. | 22303 | 21.1% | 16.7%(+4.40)#64 | 20.1%(+1.00)#2,087 |
| 65. | 23231 | 21.6% | 16.7%(+4.90)#65 | 20.1%(+1.50)#2,144 |
| 66. | 20112 | 21.7% | 16.7%(+5.00)#66 | 20.1%(+1.60)#2,161 |
| 67. | 22802 | 22.3% | 16.7%(+5.60)#67 | 20.1%(+2.20)#2,237 |
| 68. | 20124 | 22.4% | 16.7%(+5.70)#68 | 20.1%(+2.30)#2,247 |
| 69. | 22152 | 22.7% | 16.7%(+6.00)#69 | 20.1%(+2.60)#2,276 |
| 70. | 22043 | 22.7% | 16.7%(+6.00)#70 | 20.1%(+2.60)#2,278 |
| 71. | 22602 | 22.9% | 16.7%(+6.20)#71 | 20.1%(+2.80)#2,295 |
| 72. | 22151 | 23.2% | 16.7%(+6.50)#72 | 20.1%(+3.10)#2,327 |
| 73. | 23223 | 24.3% | 16.7%(+7.60)#73 | 20.1%(+4.20)#2,422 |
| 74. | 22150 | 25.2% | 16.7%(+8.50)#74 | 20.1%(+5.10)#2,508 |
| 75. | 22193 | 26.2% | 16.7%(+9.50)#75 | 20.1%(+6.10)#2,594 |
| 76. | 24541 | 27.6% | 16.7%(+10.9)#76 | 20.1%(+7.50)#2,723 |
| 77. | 22314 | 28.3% | 16.7%(+11.6)#77 | 20.1%(+8.20)#2,786 |
| 78. | 23225 | 28.6% | 16.7%(+11.9)#78 | 20.1%(+8.50)#2,808 |
| 79. | 22601 | 29.5% | 16.7%(+12.8)#79 | 20.1%(+9.40)#2,907 |
| 80. | 24639 | 30.3% | 16.7%(+13.6)#80 | 20.1%(+10.2)#2,965 |
| 81. | 23805 | 31.3% | 16.7%(+14.6)#81 | 20.1%(+11.2)#3,042 |
| 82. | 23693 | 31.4% | 16.7%(+14.7)#82 | 20.1%(+11.3)#3,056 |
| 83. | 22901 | 32.9% | 16.7%(+16.2)#83 | 20.1%(+12.8)#3,151 |
| 84. | 23321 | 33.3% | 16.7%(+16.6)#84 | 20.1%(+13.2)#3,177 |
| 85. | 24017 | 33.3% | 16.7%(+16.6)#85 | 20.1%(+13.2)#3,188 |
| 86. | 24226 | 33.3% | 16.7%(+16.6)#86 | 20.1%(+13.2)#3,233 |
| 87. | 22655 | 33.7% | 16.7%(+17.0)#87 | 20.1%(+13.6)#3,262 |
| 88. | 22408 | 34.0% | 16.7%(+17.3)#88 | 20.1%(+13.9)#3,283 |
| 89. | 23325 | 34.7% | 16.7%(+18.0)#89 | 20.1%(+14.6)#3,339 |
| 90. | 22202 | 35.6% | 16.7%(+18.9)#90 | 20.1%(+15.5)#3,388 |
| 91. | 24014 | 35.7% | 16.7%(+19.0)#91 | 20.1%(+15.6)#3,407 |
| 92. | 24572 | 35.9% | 16.7%(+19.2)#92 | 20.1%(+15.8)#3,421 |
| 93. | 23227 | 36.3% | 16.7%(+19.6)#93 | 20.1%(+16.2)#3,444 |
| 94. | 22101 | 37.7% | 16.7%(+21.0)#94 | 20.1%(+17.6)#3,561 |
| 95. | 23185 | 37.9% | 16.7%(+21.2)#95 | 20.1%(+17.8)#3,572 |
| 96. | 24333 | 38.1% | 16.7%(+21.4)#96 | 20.1%(+18.0)#3,591 |
| 97. | 24228 | 38.1% | 16.7%(+21.4)#97 | 20.1%(+18.0)#3,593 |
| 98. | 23236 | 39.2% | 16.7%(+22.5)#98 | 20.1%(+19.1)#3,672 |
| 99. | 23607 | 40.0% | 16.7%(+23.3)#99 | 20.1%(+19.9)#3,716 |
| 100. | 23703 | 40.9% | 16.7%(+24.2)#100 | 20.1%(+20.8)#3,798 |
Common Questions
What are the Top 10 Zip Codes with the Lowest Percentage of Births to Unmarried Women over the Age of 35 in Virginia?
Top 10 Zip Codes with the Lowest Percentage of Births to Unmarried Women over the Age of 35 in Virginia are:
What zip code has the Lowest Percentage of Births to Unmarried Women over the Age of 35 in Virginia?
23608 has the Lowest Percentage of Births to Unmarried Women over the Age of 35 in Virginia with 0.80%.
What is the Percentage of Births to Unmarried Women over the Age of 35 in the State of Virginia?
Percentage of Births to Unmarried Women over the Age of 35 in Virginia is 16.7%.
What is the Percentage of Births to Unmarried Women over the Age of 35 in the United States?
Percentage of Births to Unmarried Women over the Age of 35 in the United States is 20.1%.