Newport News, VA Map & Demographics
Newport News Map
Newport News Overview
$36,135
PER CAPITA INCOME
$77,483
AVG FAMILY INCOME
$63,355
AVG HOUSEHOLD INCOME
31.7%
WAGE / INCOME GAP [ % ]
68.3¢/ $1
WAGE / INCOME GAP [ $ ]
$11,881
FAMILY INCOME DEFICIT
0.46
INEQUALITY / GINI INDEX
185,118
TOTAL POPULATION
90,193
MALE POPULATION
94,925
FEMALE POPULATION
95.02
MALES / 100 FEMALES
105.25
FEMALES / 100 MALES
34.1
MEDIAN AGE
3.1
AVG FAMILY SIZE
2.4
AVG HOUSEHOLD SIZE
98,941
LABOR FORCE [ PEOPLE ]
67.6%
PERCENT IN LABOR FORCE
5.6%
UNEMPLOYMENT RATE
Newport News Area Codes
Income in Newport News
Income Overview in Newport News
Per Capita Income in Newport News is $36,135, while median incomes of families and households are $77,483 and $63,355 respectively.
| Characteristic | Number | Measure |
| Per Capita Income | 185,118 | $36,135 |
| Median Family Income | 43,547 | $77,483 |
| Mean Family Income | 43,547 | $94,602 |
| Median Household Income | 75,465 | $63,355 |
| Mean Household Income | 75,465 | $83,733 |
| Income Deficit | 43,547 | $11,881 |
| Wage / Income Gap (%) | 185,118 | 31.72% |
| Wage / Income Gap ($) | 185,118 | 68.28¢ per $1 |
| Gini / Inequality Index | 185,118 | 0.46 |
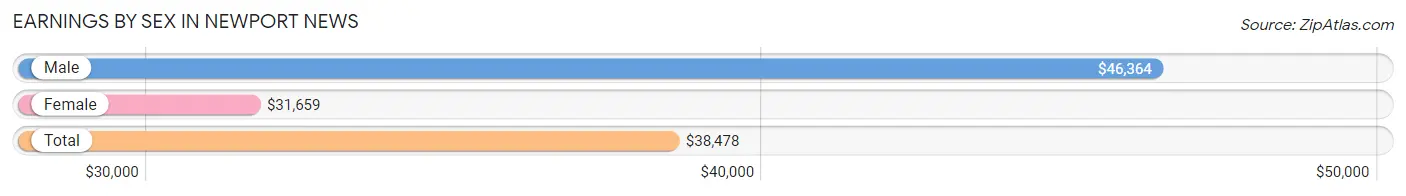
Earnings by Sex in Newport News
Average Earnings in Newport News are $38,478, $46,364 for men and $31,659 for women, a difference of 31.7%.
| Sex | Number | Average Earnings |
| Male | 53,132 (51.9%) | $46,364 |
| Female | 49,272 (48.1%) | $31,659 |
| Total | 102,404 (100.0%) | $38,478 |
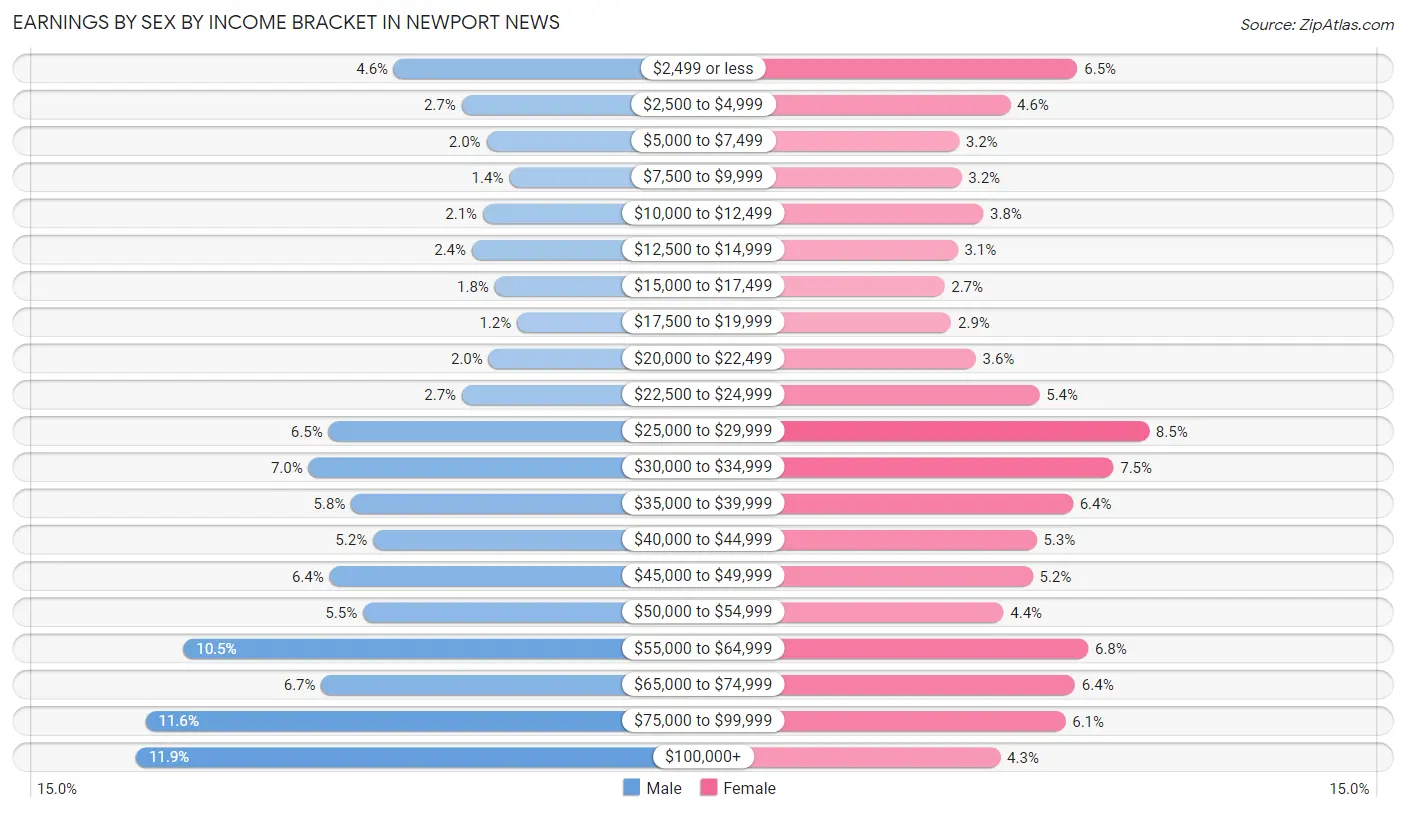
Earnings by Sex by Income Bracket in Newport News
The most common earnings brackets in Newport News are $100,000+ for men (6,306 | 11.9%) and $25,000 to $29,999 for women (4,181 | 8.5%).
| Income | Male | Female |
| $2,499 or less | 2,457 (4.6%) | 3,195 (6.5%) |
| $2,500 to $4,999 | 1,445 (2.7%) | 2,260 (4.6%) |
| $5,000 to $7,499 | 1,072 (2.0%) | 1,553 (3.2%) |
| $7,500 to $9,999 | 733 (1.4%) | 1,585 (3.2%) |
| $10,000 to $12,499 | 1,129 (2.1%) | 1,887 (3.8%) |
| $12,500 to $14,999 | 1,292 (2.4%) | 1,534 (3.1%) |
| $15,000 to $17,499 | 951 (1.8%) | 1,351 (2.7%) |
| $17,500 to $19,999 | 615 (1.2%) | 1,445 (2.9%) |
| $20,000 to $22,499 | 1,044 (2.0%) | 1,785 (3.6%) |
| $22,500 to $24,999 | 1,438 (2.7%) | 2,664 (5.4%) |
| $25,000 to $29,999 | 3,431 (6.5%) | 4,181 (8.5%) |
| $30,000 to $34,999 | 3,728 (7.0%) | 3,692 (7.5%) |
| $35,000 to $39,999 | 3,091 (5.8%) | 3,129 (6.4%) |
| $40,000 to $44,999 | 2,766 (5.2%) | 2,626 (5.3%) |
| $45,000 to $49,999 | 3,415 (6.4%) | 2,573 (5.2%) |
| $50,000 to $54,999 | 2,915 (5.5%) | 2,167 (4.4%) |
| $55,000 to $64,999 | 5,598 (10.5%) | 3,342 (6.8%) |
| $65,000 to $74,999 | 3,541 (6.7%) | 3,156 (6.4%) |
| $75,000 to $99,999 | 6,165 (11.6%) | 3,025 (6.1%) |
| $100,000+ | 6,306 (11.9%) | 2,122 (4.3%) |
| Total | 53,132 (100.0%) | 49,272 (100.0%) |
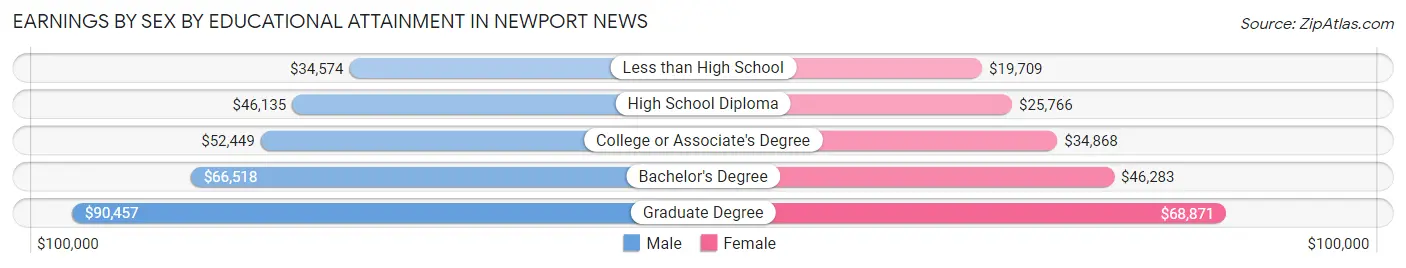
Earnings by Sex by Educational Attainment in Newport News
Average earnings in Newport News are $53,742 for men and $36,475 for women, a difference of 32.1%. Men with an educational attainment of graduate degree enjoy the highest average annual earnings of $90,457, while those with less than high school education earn the least with $34,574. Women with an educational attainment of graduate degree earn the most with the average annual earnings of $68,871, while those with less than high school education have the smallest earnings of $19,709.
| Educational Attainment | Male Income | Female Income |
| Less than High School | $34,574 | $19,709 |
| High School Diploma | $46,135 | $25,766 |
| College or Associate's Degree | $52,449 | $34,868 |
| Bachelor's Degree | $66,518 | $46,283 |
| Graduate Degree | $90,457 | $68,871 |
| Total | $53,742 | $36,475 |
Family Income in Newport News
Family Income Brackets in Newport News
According to the Newport News family income data, there are 9,537 families falling into the $100,000 to $149,999 income range, which is the most common income bracket and makes up 21.9% of all families. Conversely, the $10,000 to $14,999 income bracket is the least frequent group with only 914 families (2.1%) belonging to this category.
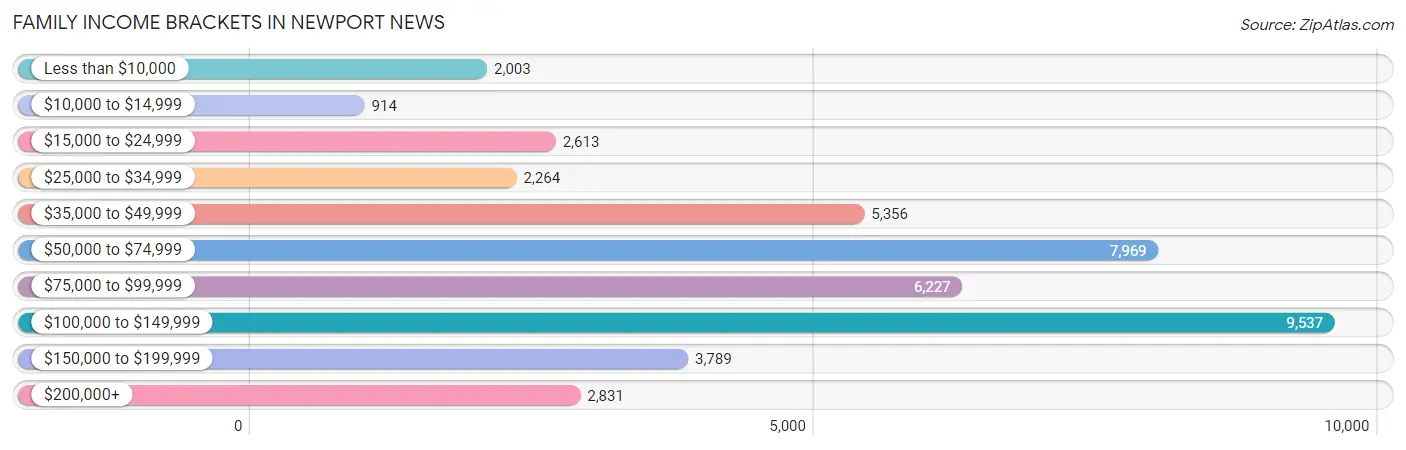
| Income Bracket | # Families | % Families |
| Less than $10,000 | 2,003 | 4.6% |
| $10,000 to $14,999 | 914 | 2.1% |
| $15,000 to $24,999 | 2,613 | 6.0% |
| $25,000 to $34,999 | 2,264 | 5.2% |
| $35,000 to $49,999 | 5,356 | 12.3% |
| $50,000 to $74,999 | 7,969 | 18.3% |
| $75,000 to $99,999 | 6,227 | 14.3% |
| $100,000 to $149,999 | 9,537 | 21.9% |
| $150,000 to $199,999 | 3,789 | 8.7% |
| $200,000+ | 2,831 | 6.5% |
Family Income by Famaliy Size in Newport News
7+ person families (461 | 1.1%) account for the highest median family income in Newport News with $106,750 per family, while 2-person families (21,058 | 48.4%) have the highest median income of $36,984 per family member.
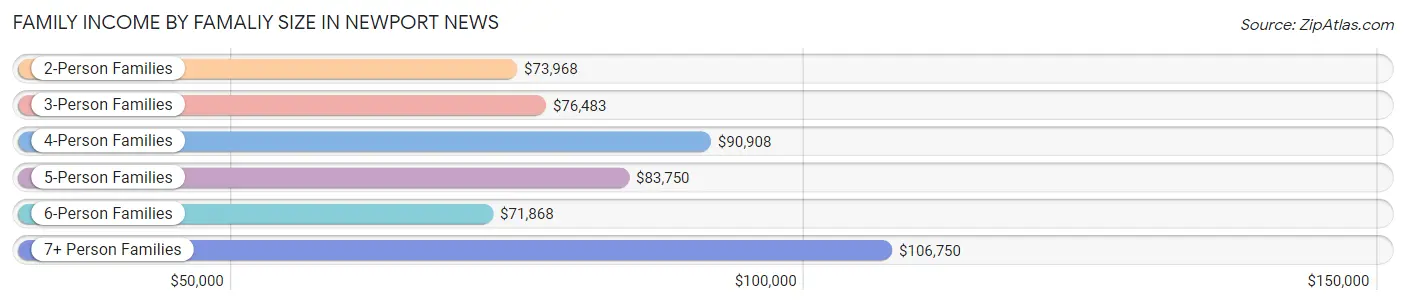
| Income Bracket | # Families | Median Income |
| 2-Person Families | 21,058 (48.4%) | $73,968 |
| 3-Person Families | 11,517 (26.5%) | $76,483 |
| 4-Person Families | 5,917 (13.6%) | $90,908 |
| 5-Person Families | 3,463 (8.0%) | $83,750 |
| 6-Person Families | 1,131 (2.6%) | $71,868 |
| 7+ Person Families | 461 (1.1%) | $106,750 |
| Total | 43,547 (100.0%) | $77,483 |
Family Income by Number of Earners in Newport News
The median family income in Newport News is $77,483, with families comprising 3+ earners (3,955) having the highest median family income of $122,422, while families with no earners (5,665) have the lowest median family income of $49,988, accounting for 9.1% and 13.0% of families, respectively.
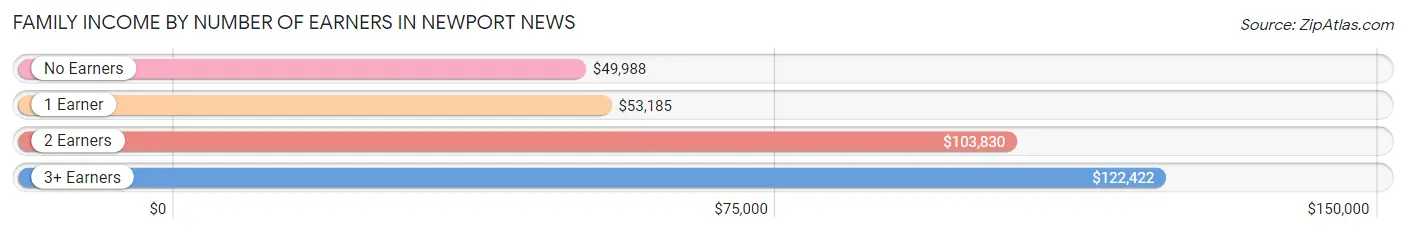
| Number of Earners | # Families | Median Income |
| No Earners | 5,665 (13.0%) | $49,988 |
| 1 Earner | 16,256 (37.3%) | $53,185 |
| 2 Earners | 17,671 (40.6%) | $103,830 |
| 3+ Earners | 3,955 (9.1%) | $122,422 |
| Total | 43,547 (100.0%) | $77,483 |
Household Income in Newport News
Household Income Brackets in Newport News
With 15,319 households falling in the category, the $50,000 to $74,999 income range is the most frequent in Newport News, accounting for 20.3% of all households. In contrast, only 2,792 households (3.7%) fall into the $10,000 to $14,999 income bracket, making it the least populous group.
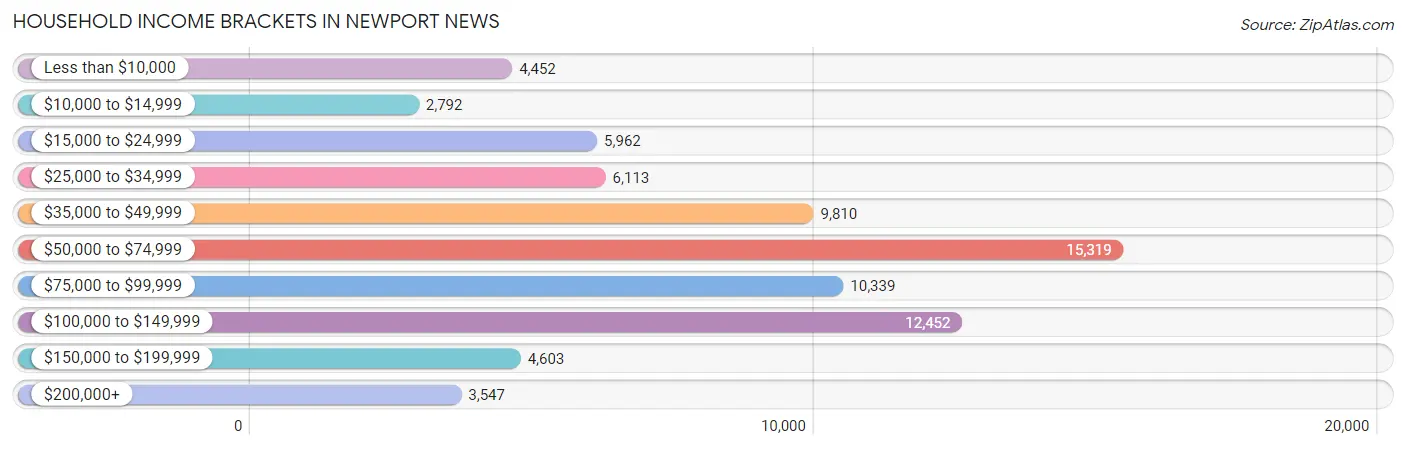
| Income Bracket | # Households | % Households |
| Less than $10,000 | 4,452 | 5.9% |
| $10,000 to $14,999 | 2,792 | 3.7% |
| $15,000 to $24,999 | 5,962 | 7.9% |
| $25,000 to $34,999 | 6,113 | 8.1% |
| $35,000 to $49,999 | 9,810 | 13.0% |
| $50,000 to $74,999 | 15,319 | 20.3% |
| $75,000 to $99,999 | 10,339 | 13.7% |
| $100,000 to $149,999 | 12,452 | 16.5% |
| $150,000 to $199,999 | 4,603 | 6.1% |
| $200,000+ | 3,547 | 4.7% |
Household Income by Householder Age in Newport News
The median household income in Newport News is $63,355, with the highest median household income of $76,294 found in the 45 to 64 years age bracket for the primary householder. A total of 24,488 households (32.5%) fall into this category. Meanwhile, the 15 to 24 years age bracket for the primary householder has the lowest median household income of $43,952, with 4,732 households (6.3%) in this group.
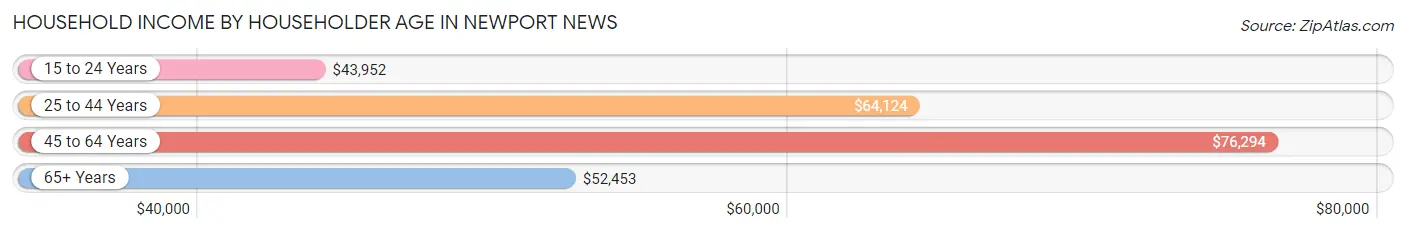
| Income Bracket | # Households | Median Income |
| 15 to 24 Years | 4,732 (6.3%) | $43,952 |
| 25 to 44 Years | 30,131 (39.9%) | $64,124 |
| 45 to 64 Years | 24,488 (32.5%) | $76,294 |
| 65+ Years | 16,114 (21.3%) | $52,453 |
| Total | 75,465 (100.0%) | $63,355 |
Poverty in Newport News
Income Below Poverty by Sex and Age in Newport News
With 13.0% poverty level for males and 16.2% for females among the residents of Newport News, 15 year old males and 5 year old females are the most vulnerable to poverty, with 370 males (28.3%) and 318 females (25.1%) in their respective age groups living below the poverty level.
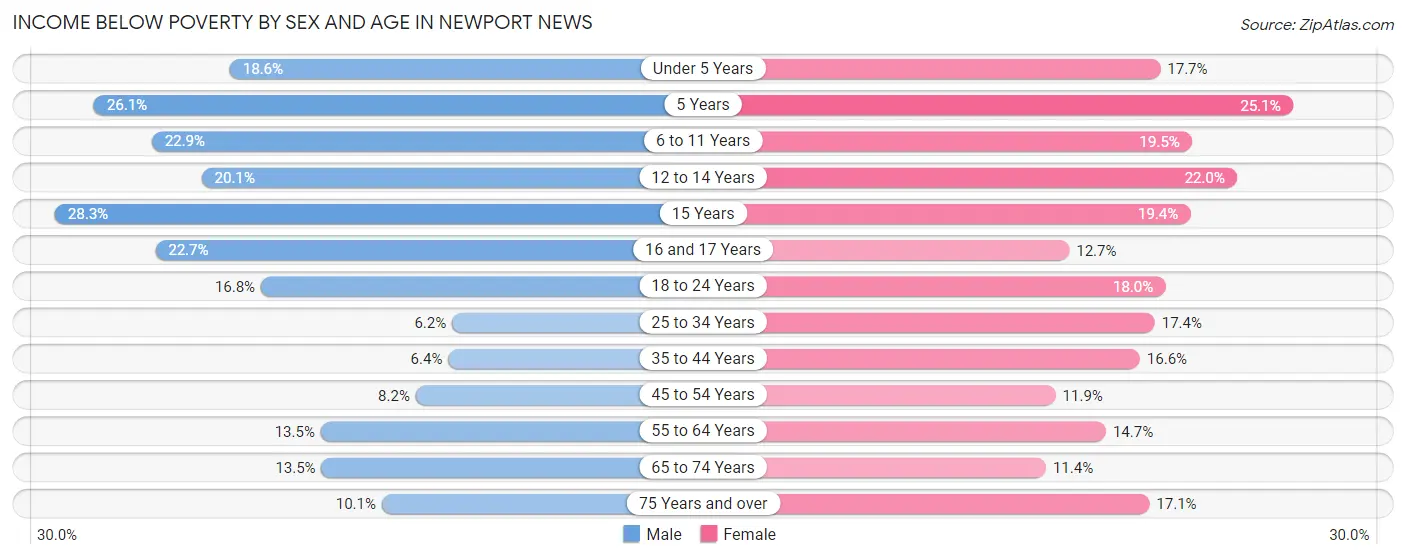
| Age Bracket | Male | Female |
| Under 5 Years | 1,236 (18.6%) | 1,113 (17.7%) |
| 5 Years | 224 (26.1%) | 318 (25.1%) |
| 6 to 11 Years | 1,757 (22.9%) | 1,247 (19.5%) |
| 12 to 14 Years | 630 (20.1%) | 786 (22.0%) |
| 15 Years | 370 (28.3%) | 209 (19.4%) |
| 16 and 17 Years | 453 (22.7%) | 261 (12.7%) |
| 18 to 24 Years | 1,398 (16.8%) | 1,515 (18.0%) |
| 25 to 34 Years | 928 (6.2%) | 2,657 (17.4%) |
| 35 to 44 Years | 718 (6.4%) | 1,983 (16.6%) |
| 45 to 54 Years | 741 (8.2%) | 1,219 (11.9%) |
| 55 to 64 Years | 1,379 (13.5%) | 1,716 (14.7%) |
| 65 to 74 Years | 849 (13.5%) | 916 (11.4%) |
| 75 Years and over | 371 (10.1%) | 1,062 (17.1%) |
| Total | 11,054 (13.0%) | 15,002 (16.2%) |
Income Above Poverty by Sex and Age in Newport News
According to the poverty statistics in Newport News, males aged 25 to 34 years and females aged 65 to 74 years are the age groups that are most secure financially, with 93.8% of males and 88.6% of females in these age groups living above the poverty line.
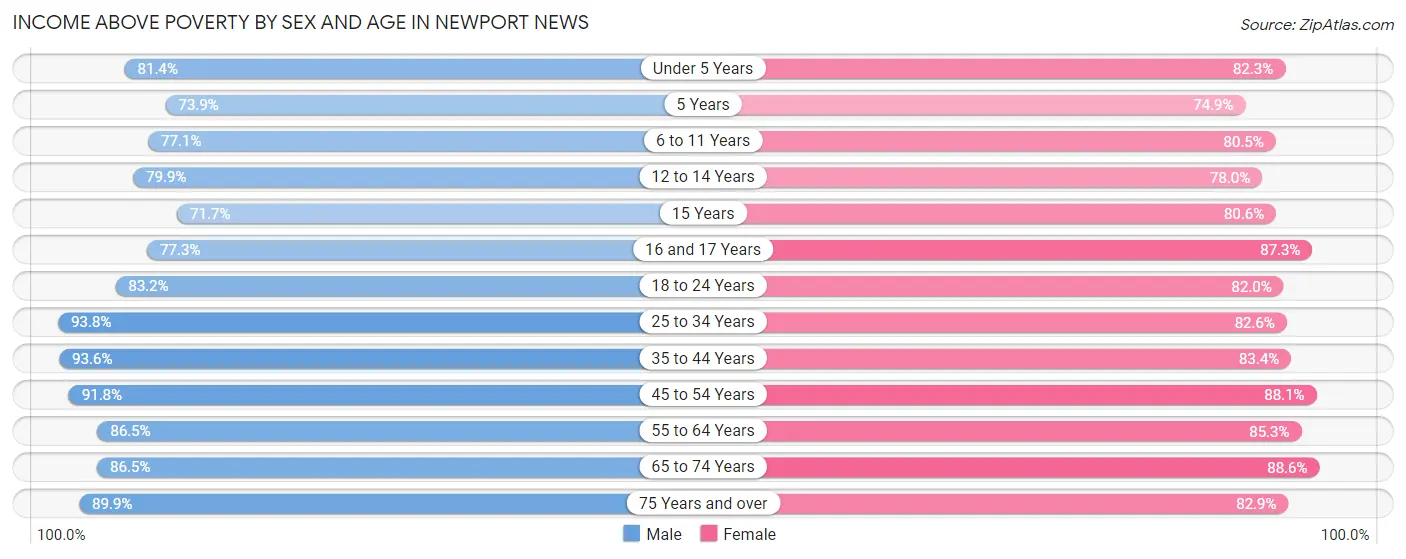
| Age Bracket | Male | Female |
| Under 5 Years | 5,419 (81.4%) | 5,160 (82.3%) |
| 5 Years | 633 (73.9%) | 949 (74.9%) |
| 6 to 11 Years | 5,908 (77.1%) | 5,153 (80.5%) |
| 12 to 14 Years | 2,498 (79.9%) | 2,789 (78.0%) |
| 15 Years | 937 (71.7%) | 869 (80.6%) |
| 16 and 17 Years | 1,541 (77.3%) | 1,799 (87.3%) |
| 18 to 24 Years | 6,902 (83.2%) | 6,903 (82.0%) |
| 25 to 34 Years | 14,029 (93.8%) | 12,585 (82.6%) |
| 35 to 44 Years | 10,484 (93.6%) | 9,961 (83.4%) |
| 45 to 54 Years | 8,277 (91.8%) | 9,016 (88.1%) |
| 55 to 64 Years | 8,830 (86.5%) | 9,949 (85.3%) |
| 65 to 74 Years | 5,452 (86.5%) | 7,137 (88.6%) |
| 75 Years and over | 3,298 (89.9%) | 5,138 (82.9%) |
| Total | 74,208 (87.0%) | 77,408 (83.8%) |
Income Below Poverty Among Married-Couple Families in Newport News
The poverty statistics for married-couple families in Newport News show that 4.5% or 1,213 of the total 27,159 families live below the poverty line. Families with 5 or more children have the highest poverty rate of 34.3%, comprising of 61 families. On the other hand, families with no children have the lowest poverty rate of 3.8%, which includes 624 families.
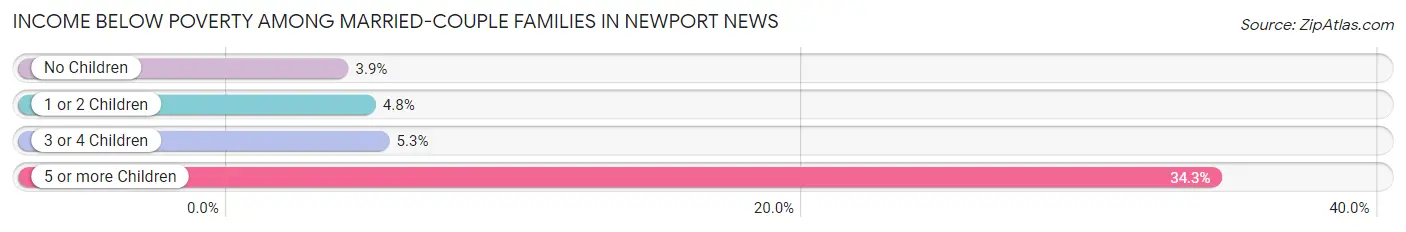
| Children | Above Poverty | Below Poverty |
| No Children | 15,591 (96.2%) | 624 (3.8%) |
| 1 or 2 Children | 8,030 (95.2%) | 405 (4.8%) |
| 3 or 4 Children | 2,208 (94.7%) | 123 (5.3%) |
| 5 or more Children | 117 (65.7%) | 61 (34.3%) |
| Total | 25,946 (95.5%) | 1,213 (4.5%) |
Income Below Poverty Among Single-Parent Households in Newport News
According to the poverty data in Newport News, 8.7% or 334 single-father households and 26.6% or 3,332 single-mother households are living below the poverty line. Among single-father households, those with no children have the highest poverty rate, with 153 households (9.0%) experiencing poverty. Likewise, among single-mother households, those with 5 or more children have the highest poverty rate, with 167 households (69.3%) falling below the poverty line.
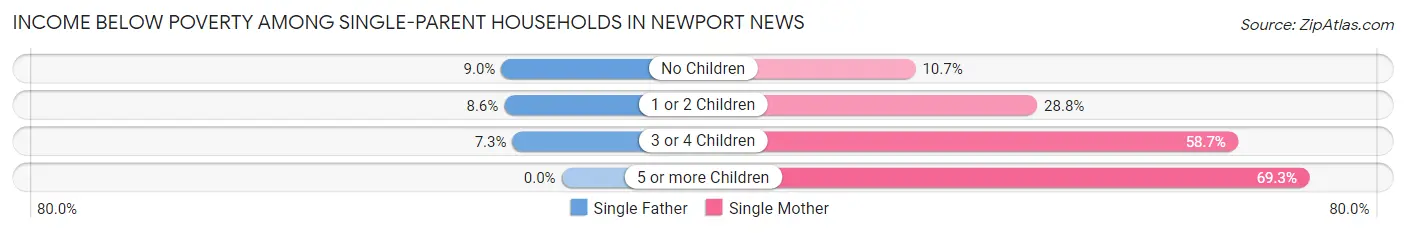
| Children | Single Father | Single Mother |
| No Children | 153 (9.0%) | 436 (10.7%) |
| 1 or 2 Children | 161 (8.6%) | 2,021 (28.8%) |
| 3 or 4 Children | 20 (7.3%) | 708 (58.7%) |
| 5 or more Children | 0 (0.0%) | 167 (69.3%) |
| Total | 334 (8.7%) | 3,332 (26.6%) |
Income Below Poverty Among Married-Couple vs Single-Parent Households in Newport News
The poverty data for Newport News shows that 1,213 of the married-couple family households (4.5%) and 3,666 of the single-parent households (22.4%) are living below the poverty level. Within the married-couple family households, those with 5 or more children have the highest poverty rate, with 61 households (34.3%) falling below the poverty line. Among the single-parent households, those with 5 or more children have the highest poverty rate, with 167 household (69.3%) living below poverty.
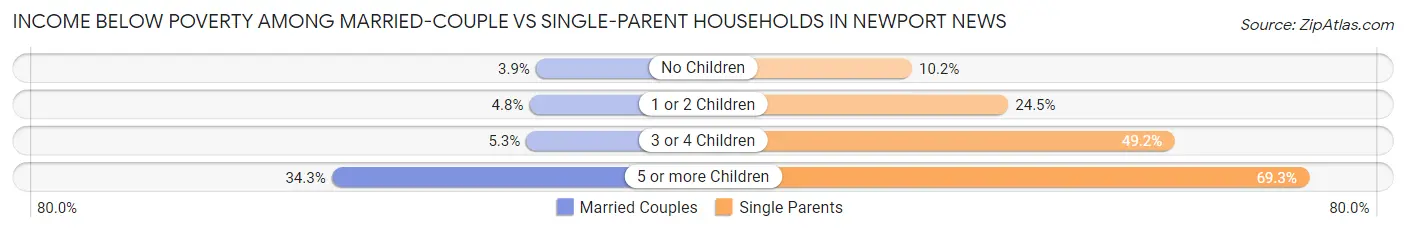
| Children | Married-Couple Families | Single-Parent Households |
| No Children | 624 (3.8%) | 589 (10.2%) |
| 1 or 2 Children | 405 (4.8%) | 2,182 (24.5%) |
| 3 or 4 Children | 123 (5.3%) | 728 (49.2%) |
| 5 or more Children | 61 (34.3%) | 167 (69.3%) |
| Total | 1,213 (4.5%) | 3,666 (22.4%) |
Race in Newport News
The most populous races in Newport News are White / Caucasian (81,623 | 44.1%), Black / African American (76,203 | 41.2%), and Hispanic or Latino (18,290 | 9.9%).
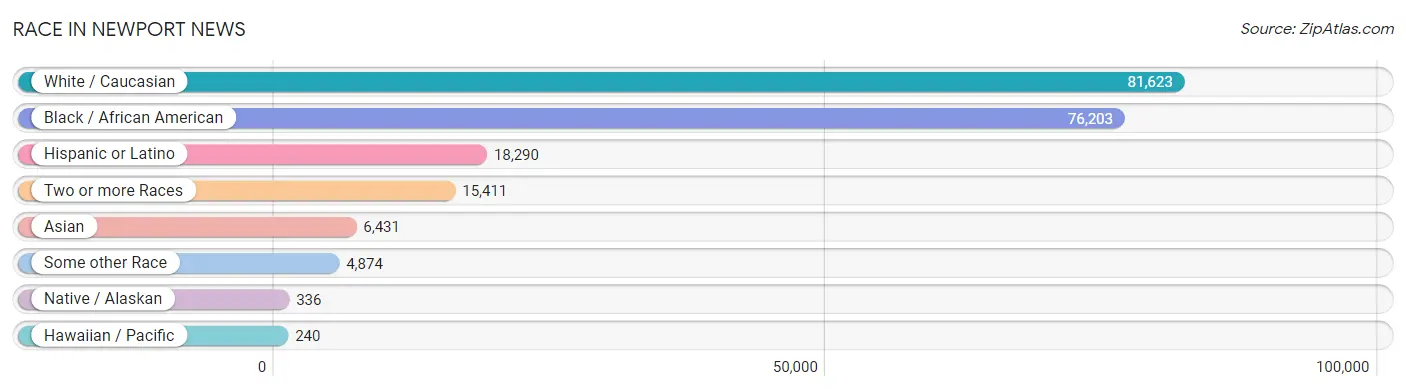
| Race | # Population | % Population |
| Asian | 6,431 | 3.5% |
| Black / African American | 76,203 | 41.2% |
| Hawaiian / Pacific | 240 | 0.1% |
| Hispanic or Latino | 18,290 | 9.9% |
| Native / Alaskan | 336 | 0.2% |
| White / Caucasian | 81,623 | 44.1% |
| Two or more Races | 15,411 | 8.3% |
| Some other Race | 4,874 | 2.6% |
| Total | 185,118 | 100.0% |
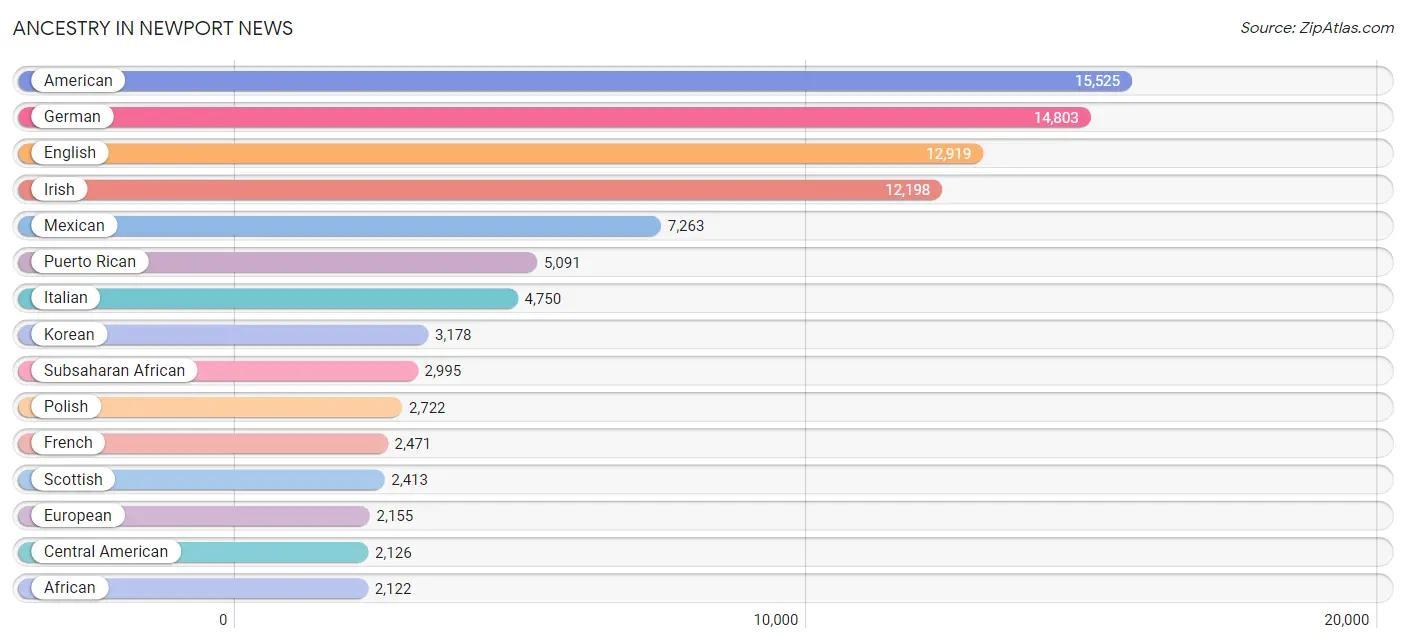
Ancestry in Newport News
The most populous ancestries reported in Newport News are American (15,525 | 8.4%), German (14,803 | 8.0%), English (12,919 | 7.0%), Irish (12,198 | 6.6%), and Mexican (7,263 | 3.9%), together accounting for 33.9% of all Newport News residents.
| Ancestry | # Population | % Population |
| Afghan | 24 | 0.0% |
| African | 2,122 | 1.1% |
| Albanian | 24 | 0.0% |
| Alsatian | 56 | 0.0% |
| American | 15,525 | 8.4% |
| Apache | 26 | 0.0% |
| Arab | 642 | 0.4% |
| Armenian | 74 | 0.0% |
| Assyrian / Chaldean / Syriac | 20 | 0.0% |
| Austrian | 266 | 0.1% |
| Bahamian | 184 | 0.1% |
| Barbadian | 40 | 0.0% |
| Basque | 29 | 0.0% |
| Belgian | 254 | 0.1% |
| Bermudan | 16 | 0.0% |
| Bhutanese | 643 | 0.4% |
| Blackfeet | 182 | 0.1% |
| Brazilian | 218 | 0.1% |
| British | 925 | 0.5% |
| British West Indian | 137 | 0.1% |
| Bulgarian | 66 | 0.0% |
| Burmese | 1,219 | 0.7% |
| Cambodian | 29 | 0.0% |
| Canadian | 242 | 0.1% |
| Cape Verdean | 211 | 0.1% |
| Celtic | 17 | 0.0% |
| Central American | 2,126 | 1.1% |
| Central American Indian | 35 | 0.0% |
| Cherokee | 292 | 0.2% |
| Cheyenne | 34 | 0.0% |
| Colombian | 341 | 0.2% |
| Comanche | 70 | 0.0% |
| Costa Rican | 61 | 0.0% |
| Creek | 21 | 0.0% |
| Croatian | 94 | 0.1% |
| Cuban | 1,176 | 0.6% |
| Cypriot | 51 | 0.0% |
| Czech | 514 | 0.3% |
| Czechoslovakian | 121 | 0.1% |
| Danish | 306 | 0.2% |
| Dominican | 453 | 0.2% |
| Dutch | 1,166 | 0.6% |
| Dutch West Indian | 39 | 0.0% |
| Eastern European | 161 | 0.1% |
| Ecuadorian | 175 | 0.1% |
| Egyptian | 257 | 0.1% |
| English | 12,919 | 7.0% |
| Ethiopian | 59 | 0.0% |
| European | 2,155 | 1.2% |
| Filipino | 54 | 0.0% |
| Finnish | 85 | 0.1% |
| French | 2,471 | 1.3% |
| French Canadian | 557 | 0.3% |
| German | 14,803 | 8.0% |
| Ghanaian | 181 | 0.1% |
| Greek | 569 | 0.3% |
| Guamanian / Chamorro | 58 | 0.0% |
| Guatemalan | 331 | 0.2% |
| Guyanese | 44 | 0.0% |
| Haitian | 204 | 0.1% |
| Honduran | 823 | 0.4% |
| Hungarian | 526 | 0.3% |
| Indian (Asian) | 1,348 | 0.7% |
| Indonesian | 14 | 0.0% |
| Iranian | 44 | 0.0% |
| Iraqi | 153 | 0.1% |
| Irish | 12,198 | 6.6% |
| Israeli | 101 | 0.1% |
| Italian | 4,750 | 2.6% |
| Jamaican | 1,374 | 0.7% |
| Japanese | 260 | 0.1% |
| Kenyan | 42 | 0.0% |
| Korean | 3,178 | 1.7% |
| Latvian | 26 | 0.0% |
| Lebanese | 101 | 0.1% |
| Liberian | 21 | 0.0% |
| Lithuanian | 111 | 0.1% |
| Lumbee | 20 | 0.0% |
| Luxembourger | 14 | 0.0% |
| Macedonian | 23 | 0.0% |
| Malaysian | 64 | 0.0% |
| Mexican | 7,263 | 3.9% |
| Mexican American Indian | 13 | 0.0% |
| Mongolian | 12 | 0.0% |
| Moroccan | 5 | 0.0% |
| Native Hawaiian | 514 | 0.3% |
| Navajo | 36 | 0.0% |
| Nicaraguan | 69 | 0.0% |
| Nigerian | 281 | 0.2% |
| Northern European | 101 | 0.1% |
| Norwegian | 940 | 0.5% |
| Pakistani | 501 | 0.3% |
| Palestinian | 54 | 0.0% |
| Panamanian | 245 | 0.1% |
| Pennsylvania German | 31 | 0.0% |
| Peruvian | 668 | 0.4% |
| Polish | 2,722 | 1.5% |
| Portuguese | 321 | 0.2% |
| Puerto Rican | 5,091 | 2.8% |
| Romanian | 229 | 0.1% |
| Russian | 398 | 0.2% |
| Salvadoran | 597 | 0.3% |
| Samoan | 679 | 0.4% |
| Scandinavian | 243 | 0.1% |
| Scotch-Irish | 1,117 | 0.6% |
| Scottish | 2,413 | 1.3% |
| Serbian | 107 | 0.1% |
| Sioux | 117 | 0.1% |
| Slavic | 17 | 0.0% |
| Slovak | 157 | 0.1% |
| Slovene | 64 | 0.0% |
| South American | 1,232 | 0.7% |
| Spaniard | 302 | 0.2% |
| Spanish | 193 | 0.1% |
| Sri Lankan | 1,260 | 0.7% |
| Subsaharan African | 2,995 | 1.6% |
| Sudanese | 43 | 0.0% |
| Swedish | 842 | 0.4% |
| Swiss | 203 | 0.1% |
| Syrian | 7 | 0.0% |
| Thai | 1,446 | 0.8% |
| Tlingit-Haida | 15 | 0.0% |
| Trinidadian and Tobagonian | 95 | 0.1% |
| Turkish | 170 | 0.1% |
| U.S. Virgin Islander | 263 | 0.1% |
| Ukrainian | 555 | 0.3% |
| Venezuelan | 48 | 0.0% |
| Vietnamese | 81 | 0.0% |
| Welsh | 817 | 0.4% |
| West Indian | 100 | 0.1% |
| Yugoslavian | 61 | 0.0% | View All 131 Rows |
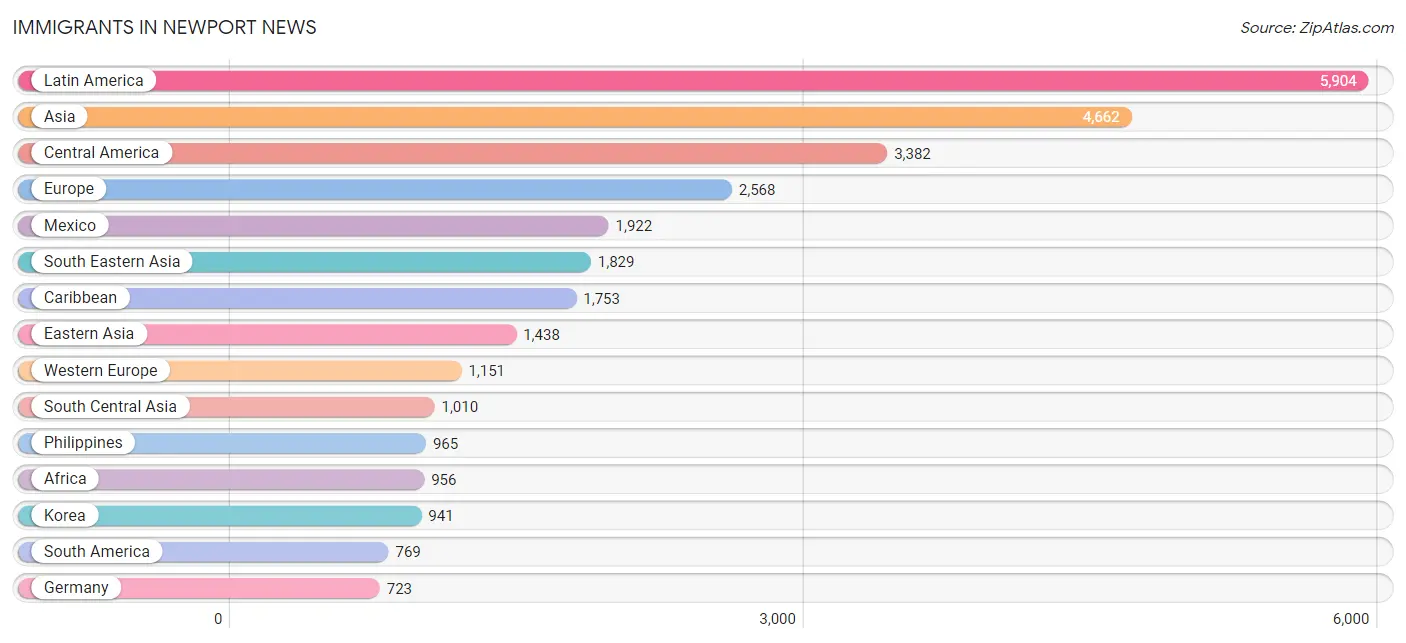
Immigrants in Newport News
The most numerous immigrant groups reported in Newport News came from Latin America (5,904 | 3.2%), Asia (4,662 | 2.5%), Central America (3,382 | 1.8%), Europe (2,568 | 1.4%), and Mexico (1,922 | 1.0%), together accounting for 10.0% of all Newport News residents.
| Immigration Origin | # Population | % Population |
| Afghanistan | 212 | 0.1% |
| Africa | 956 | 0.5% |
| Armenia | 16 | 0.0% |
| Asia | 4,662 | 2.5% |
| Austria | 34 | 0.0% |
| Bahamas | 26 | 0.0% |
| Bangladesh | 206 | 0.1% |
| Belarus | 61 | 0.0% |
| Belgium | 228 | 0.1% |
| Bosnia and Herzegovina | 107 | 0.1% |
| Brazil | 71 | 0.0% |
| Bulgaria | 52 | 0.0% |
| Cabo Verde | 52 | 0.0% |
| Cambodia | 91 | 0.1% |
| Cameroon | 9 | 0.0% |
| Canada | 366 | 0.2% |
| Caribbean | 1,753 | 0.9% |
| Central America | 3,382 | 1.8% |
| China | 215 | 0.1% |
| Colombia | 185 | 0.1% |
| Costa Rica | 40 | 0.0% |
| Croatia | 19 | 0.0% |
| Cuba | 704 | 0.4% |
| Czechoslovakia | 14 | 0.0% |
| Denmark | 13 | 0.0% |
| Dominica | 8 | 0.0% |
| Dominican Republic | 258 | 0.1% |
| Eastern Africa | 315 | 0.2% |
| Eastern Asia | 1,438 | 0.8% |
| Eastern Europe | 592 | 0.3% |
| Ecuador | 96 | 0.1% |
| Egypt | 95 | 0.1% |
| El Salvador | 341 | 0.2% |
| England | 237 | 0.1% |
| Eritrea | 12 | 0.0% |
| Ethiopia | 29 | 0.0% |
| Europe | 2,568 | 1.4% |
| Fiji | 7 | 0.0% |
| France | 154 | 0.1% |
| Germany | 723 | 0.4% |
| Ghana | 119 | 0.1% |
| Greece | 153 | 0.1% |
| Guatemala | 284 | 0.2% |
| Guyana | 147 | 0.1% |
| Haiti | 74 | 0.0% |
| Honduras | 477 | 0.3% |
| Hong Kong | 28 | 0.0% |
| Hungary | 9 | 0.0% |
| India | 325 | 0.2% |
| Iran | 44 | 0.0% |
| Iraq | 169 | 0.1% |
| Israel | 5 | 0.0% |
| Italy | 12 | 0.0% |
| Jamaica | 326 | 0.2% |
| Japan | 271 | 0.2% |
| Kenya | 246 | 0.1% |
| Korea | 941 | 0.5% |
| Laos | 21 | 0.0% |
| Latin America | 5,904 | 3.2% |
| Liberia | 94 | 0.1% |
| Mexico | 1,922 | 1.0% |
| Micronesia | 11 | 0.0% |
| Middle Africa | 9 | 0.0% |
| Moldova | 9 | 0.0% |
| Nepal | 34 | 0.0% |
| Netherlands | 12 | 0.0% |
| Nicaragua | 37 | 0.0% |
| Nigeria | 119 | 0.1% |
| Northern Africa | 197 | 0.1% |
| Northern Europe | 476 | 0.3% |
| Norway | 5 | 0.0% |
| Oceania | 18 | 0.0% |
| Pakistan | 9 | 0.0% |
| Panama | 281 | 0.2% |
| Peru | 239 | 0.1% |
| Philippines | 965 | 0.5% |
| Poland | 8 | 0.0% |
| Romania | 87 | 0.1% |
| Russia | 78 | 0.0% |
| Scotland | 71 | 0.0% |
| Serbia | 79 | 0.0% |
| Sierra Leone | 16 | 0.0% |
| South Africa | 11 | 0.0% |
| South America | 769 | 0.4% |
| South Central Asia | 1,010 | 0.5% |
| South Eastern Asia | 1,829 | 1.0% |
| Southern Europe | 283 | 0.2% |
| Spain | 118 | 0.1% |
| Sri Lanka | 26 | 0.0% |
| Sudan | 97 | 0.1% |
| Sweden | 11 | 0.0% |
| Taiwan | 8 | 0.0% |
| Thailand | 203 | 0.1% |
| Trinidad and Tobago | 86 | 0.1% |
| Turkey | 142 | 0.1% |
| Ukraine | 59 | 0.0% |
| Venezuela | 31 | 0.0% |
| Vietnam | 549 | 0.3% |
| West Indies | 111 | 0.1% |
| Western Africa | 410 | 0.2% |
| Western Asia | 371 | 0.2% |
| Western Europe | 1,151 | 0.6% | View All 102 Rows |
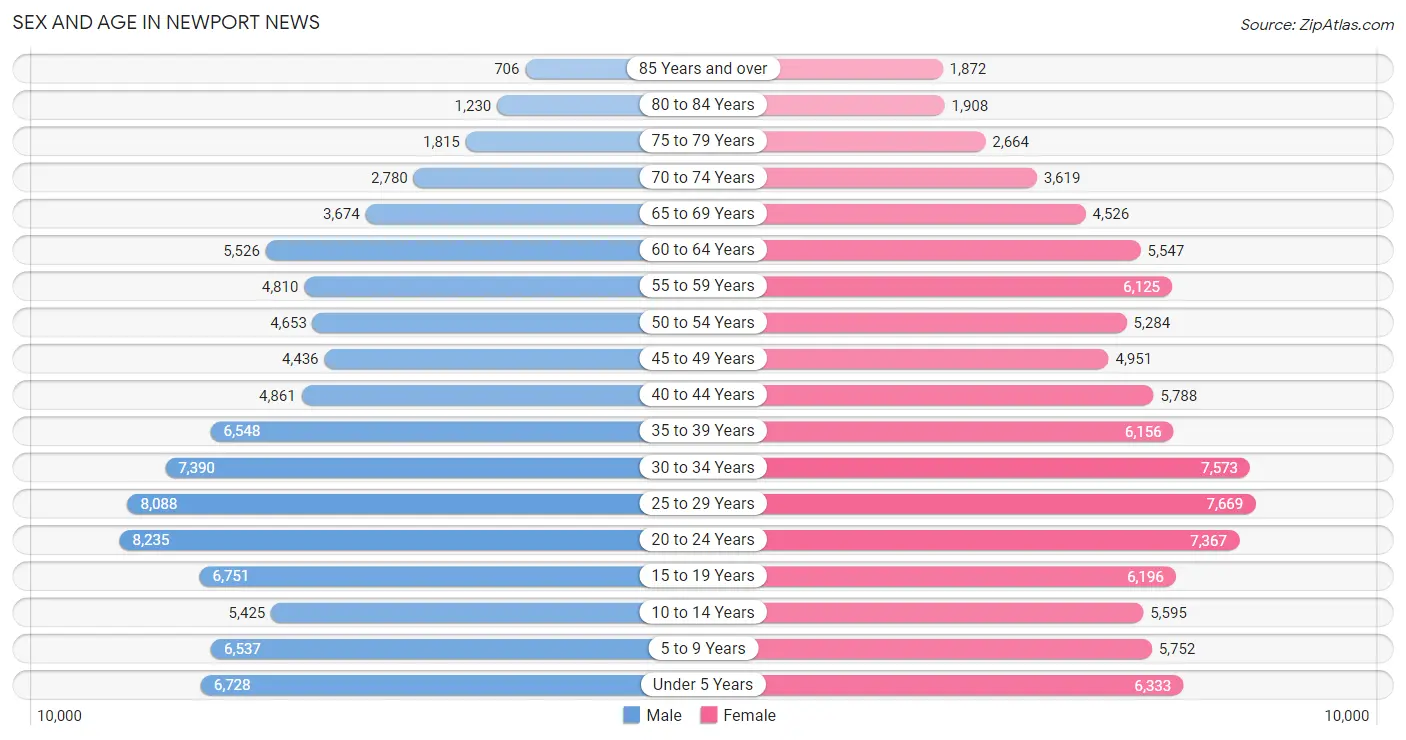
Sex and Age in Newport News
Sex and Age in Newport News
The most populous age groups in Newport News are 20 to 24 Years (8,235 | 9.1%) for men and 25 to 29 Years (7,669 | 8.1%) for women.
| Age Bracket | Male | Female |
| Under 5 Years | 6,728 (7.5%) | 6,333 (6.7%) |
| 5 to 9 Years | 6,537 (7.2%) | 5,752 (6.1%) |
| 10 to 14 Years | 5,425 (6.0%) | 5,595 (5.9%) |
| 15 to 19 Years | 6,751 (7.5%) | 6,196 (6.5%) |
| 20 to 24 Years | 8,235 (9.1%) | 7,367 (7.8%) |
| 25 to 29 Years | 8,088 (9.0%) | 7,669 (8.1%) |
| 30 to 34 Years | 7,390 (8.2%) | 7,573 (8.0%) |
| 35 to 39 Years | 6,548 (7.3%) | 6,156 (6.5%) |
| 40 to 44 Years | 4,861 (5.4%) | 5,788 (6.1%) |
| 45 to 49 Years | 4,436 (4.9%) | 4,951 (5.2%) |
| 50 to 54 Years | 4,653 (5.2%) | 5,284 (5.6%) |
| 55 to 59 Years | 4,810 (5.3%) | 6,125 (6.5%) |
| 60 to 64 Years | 5,526 (6.1%) | 5,547 (5.8%) |
| 65 to 69 Years | 3,674 (4.1%) | 4,526 (4.8%) |
| 70 to 74 Years | 2,780 (3.1%) | 3,619 (3.8%) |
| 75 to 79 Years | 1,815 (2.0%) | 2,664 (2.8%) |
| 80 to 84 Years | 1,230 (1.4%) | 1,908 (2.0%) |
| 85 Years and over | 706 (0.8%) | 1,872 (2.0%) |
| Total | 90,193 (100.0%) | 94,925 (100.0%) |
Families and Households in Newport News
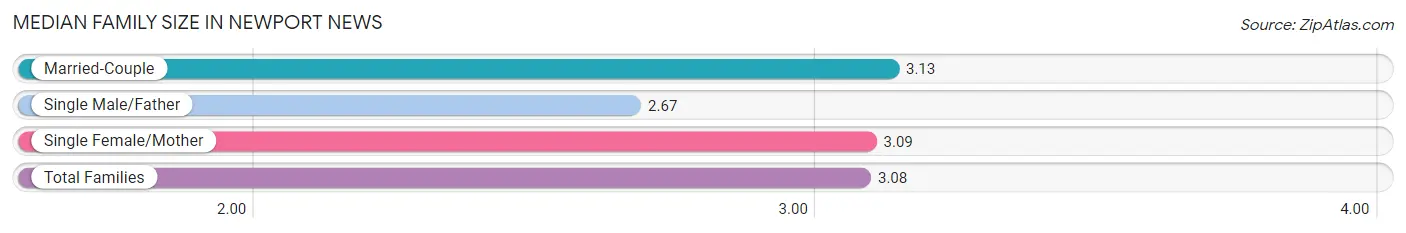
Median Family Size in Newport News
The median family size in Newport News is 3.08 persons per family, with married-couple families (27,159 | 62.4%) accounting for the largest median family size of 3.13 persons per family. On the other hand, single male/father families (3,859 | 8.9%) represent the smallest median family size with 2.67 persons per family.
| Family Type | # Families | Family Size |
| Married-Couple | 27,159 (62.4%) | 3.13 |
| Single Male/Father | 3,859 (8.9%) | 2.67 |
| Single Female/Mother | 12,529 (28.8%) | 3.09 |
| Total Families | 43,547 (100.0%) | 3.08 |
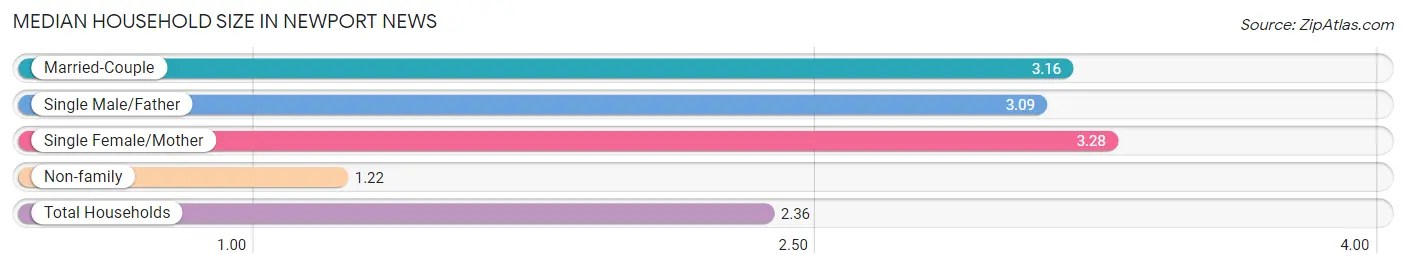
Median Household Size in Newport News
The median household size in Newport News is 2.36 persons per household, with single female/mother households (12,529 | 16.6%) accounting for the largest median household size of 3.28 persons per household. non-family households (31,918 | 42.3%) represent the smallest median household size with 1.22 persons per household.
| Household Type | # Households | Household Size |
| Married-Couple | 27,159 (36.0%) | 3.16 |
| Single Male/Father | 3,859 (5.1%) | 3.09 |
| Single Female/Mother | 12,529 (16.6%) | 3.28 |
| Non-family | 31,918 (42.3%) | 1.22 |
| Total Households | 75,465 (100.0%) | 2.36 |
Household Size by Marriage Status in Newport News
Out of a total of 75,465 households in Newport News, 43,547 (57.7%) are family households, while 31,918 (42.3%) are nonfamily households. The most numerous type of family households are 2-person households, comprising 19,281, and the most common type of nonfamily households are 1-person households, comprising 26,561.
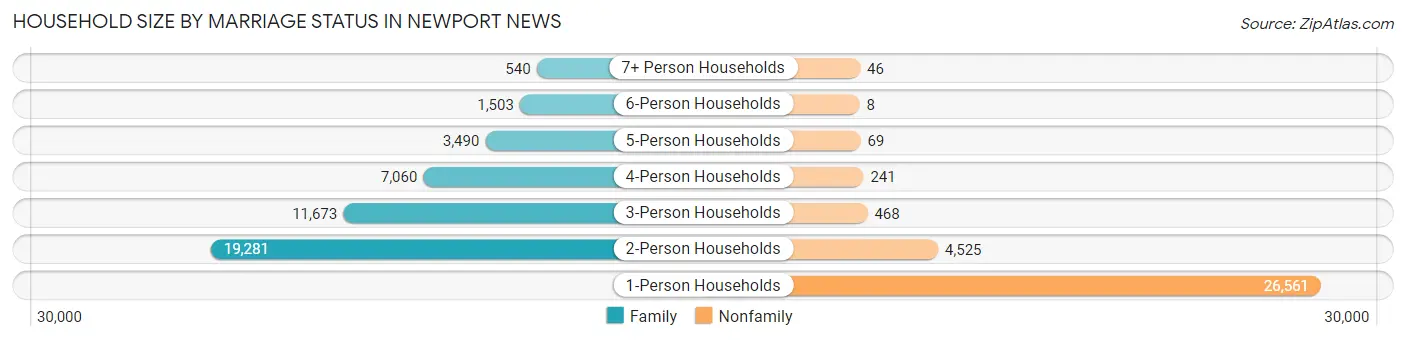
| Household Size | Family Households | Nonfamily Households |
| 1-Person Households | - | 26,561 (35.2%) |
| 2-Person Households | 19,281 (25.6%) | 4,525 (6.0%) |
| 3-Person Households | 11,673 (15.5%) | 468 (0.6%) |
| 4-Person Households | 7,060 (9.4%) | 241 (0.3%) |
| 5-Person Households | 3,490 (4.6%) | 69 (0.1%) |
| 6-Person Households | 1,503 (2.0%) | 8 (0.0%) |
| 7+ Person Households | 540 (0.7%) | 46 (0.1%) |
| Total | 43,547 (57.7%) | 31,918 (42.3%) |
Female Fertility in Newport News
Fertility by Age in Newport News
Average fertility rate in Newport News is 54.0 births per 1,000 women. Women in the age bracket of 20 to 34 years have the highest fertility rate with 84.0 births per 1,000 women. Women in the age bracket of 20 to 34 years acount for 75.0% of all women with births.
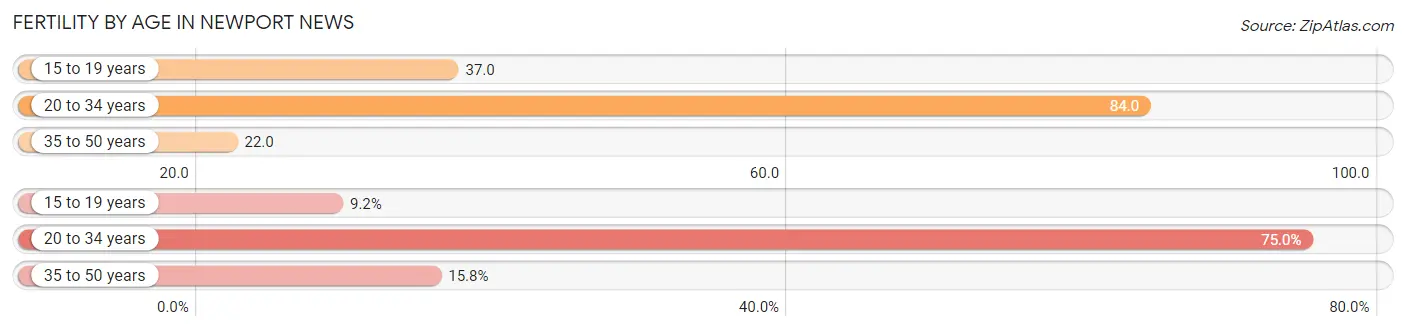
| Age Bracket | Women with Births | Births / 1,000 Women |
| 15 to 19 years | 231 (9.2%) | 37.0 |
| 20 to 34 years | 1,891 (75.0%) | 84.0 |
| 35 to 50 years | 399 (15.8%) | 22.0 |
| Total | 2,521 (100.0%) | 54.0 |
Fertility by Age by Marriage Status in Newport News
52.2% of women with births (2,521) in Newport News are married. The highest percentage of unmarried women with births falls into 15 to 19 years age bracket with 100.0% of them unmarried at the time of birth, while the lowest percentage of unmarried women with births belong to 35 to 50 years age bracket with 16.0% of them unmarried.
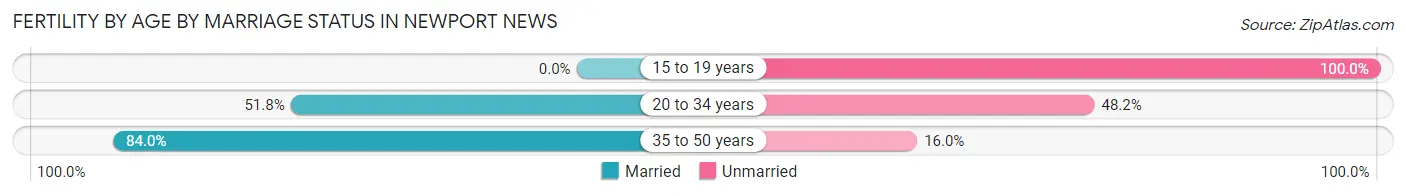
| Age Bracket | Married | Unmarried |
| 15 to 19 years | 0 (0.0%) | 231 (100.0%) |
| 20 to 34 years | 980 (51.8%) | 911 (48.2%) |
| 35 to 50 years | 335 (84.0%) | 64 (16.0%) |
| Total | 1,316 (52.2%) | 1,205 (47.8%) |
Fertility by Education in Newport News
Average fertility rate in Newport News is 54.0 births per 1,000 women. Women with the education attainment of graduate degree have the highest fertility rate of 67.0 births per 1,000 women, while women with the education attainment of less than high school have the lowest fertility at 28.0 births per 1,000 women. Women with the education attainment of college or associate's degree represent 43.3% of all women with births.
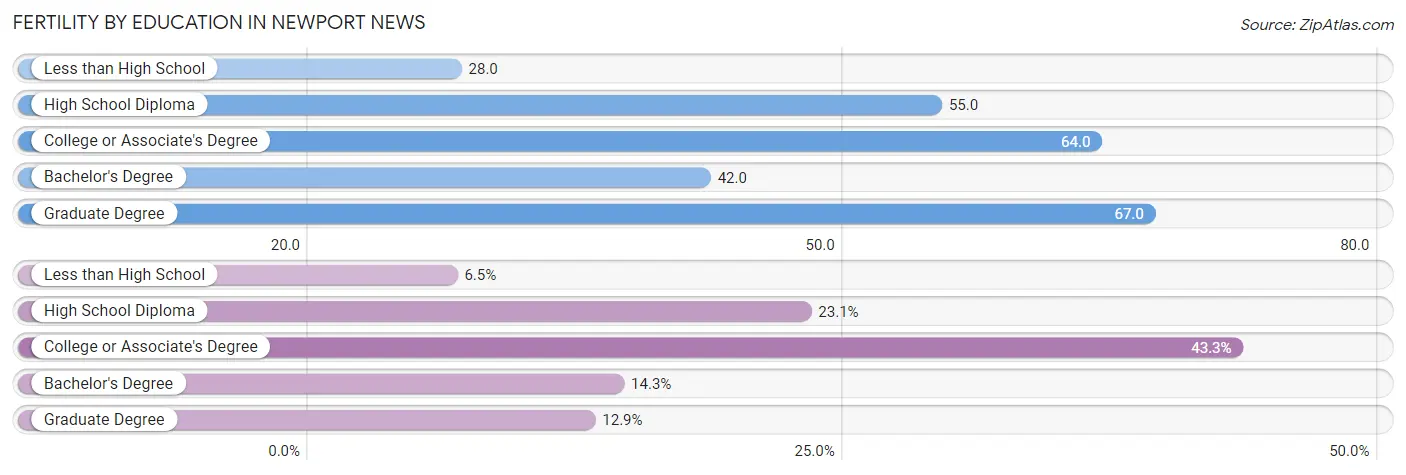
| Educational Attainment | Women with Births | Births / 1,000 Women |
| Less than High School | 163 (6.5%) | 28.0 |
| High School Diploma | 581 (23.1%) | 55.0 |
| College or Associate's Degree | 1,091 (43.3%) | 64.0 |
| Bachelor's Degree | 360 (14.3%) | 42.0 |
| Graduate Degree | 326 (12.9%) | 67.0 |
| Total | 2,521 (100.0%) | 54.0 |
Fertility by Education by Marriage Status in Newport News
47.8% of women with births in Newport News are unmarried. Women with the educational attainment of bachelor's degree are most likely to be married with 95.0% of them married at childbirth, while women with the educational attainment of high school diploma are least likely to be married with 74.7% of them unmarried at childbirth.
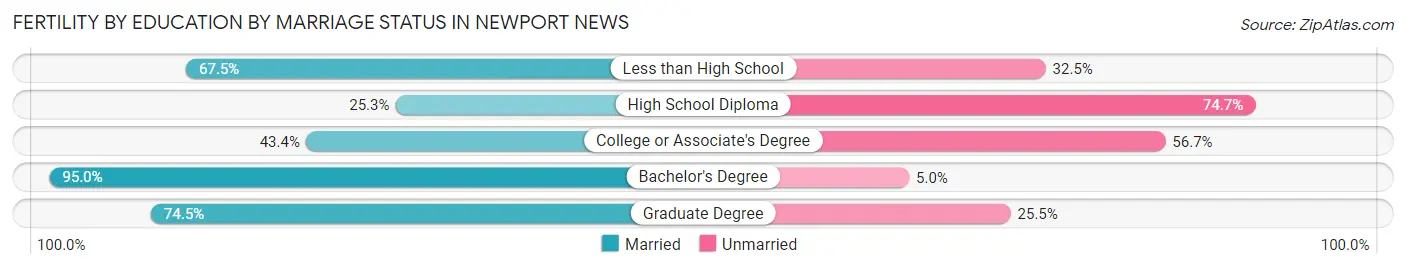
| Educational Attainment | Married | Unmarried |
| Less than High School | 110 (67.5%) | 53 (32.5%) |
| High School Diploma | 147 (25.3%) | 434 (74.7%) |
| College or Associate's Degree | 473 (43.3%) | 618 (56.7%) |
| Bachelor's Degree | 342 (95.0%) | 18 (5.0%) |
| Graduate Degree | 243 (74.5%) | 83 (25.5%) |
| Total | 1,316 (52.2%) | 1,205 (47.8%) |
Employment Characteristics in Newport News
Employment by Class of Employer in Newport News
Among the 92,115 employed individuals in Newport News, private company employees (56,551 | 61.4%), federal government employees (14,983 | 16.3%), and local government employees (7,085 | 7.7%) make up the most common classes of employment.
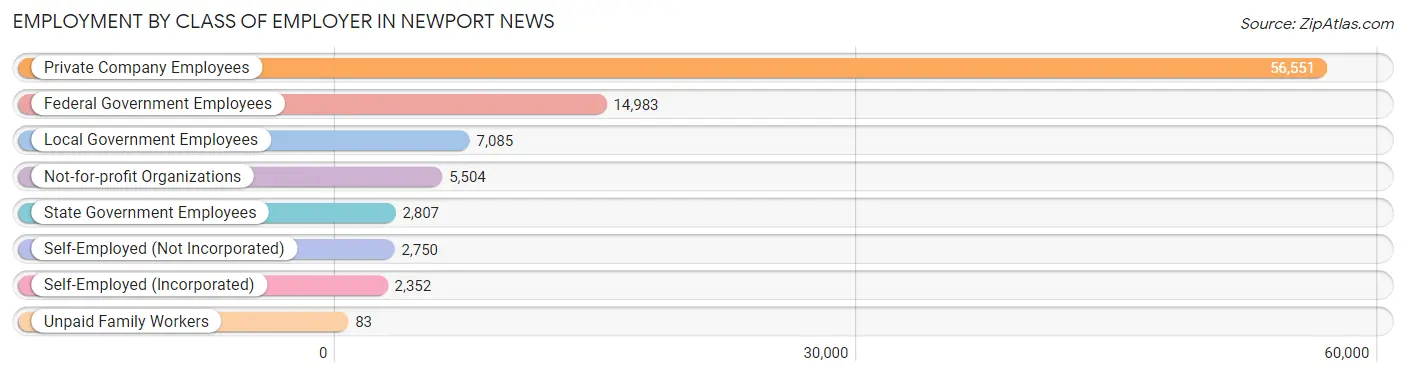
| Employer Class | # Employees | % Employees |
| Private Company Employees | 56,551 | 61.4% |
| Self-Employed (Incorporated) | 2,352 | 2.5% |
| Self-Employed (Not Incorporated) | 2,750 | 3.0% |
| Not-for-profit Organizations | 5,504 | 6.0% |
| Local Government Employees | 7,085 | 7.7% |
| State Government Employees | 2,807 | 3.0% |
| Federal Government Employees | 14,983 | 16.3% |
| Unpaid Family Workers | 83 | 0.1% |
| Total | 92,115 | 100.0% |
Employment Status by Age in Newport News
According to the labor force statistics for Newport News, out of the total population over 16 years of age (146,362), 67.6% or 98,941 individuals are in the labor force, with 5.6% or 5,541 of them unemployed. The age group with the highest labor force participation rate is 30 to 34 years, with 89.9% or 13,452 individuals in the labor force. Within the labor force, the 16 to 19 years age range has the highest percentage of unemployed individuals, with 21.4% or 994 of them being unemployed.
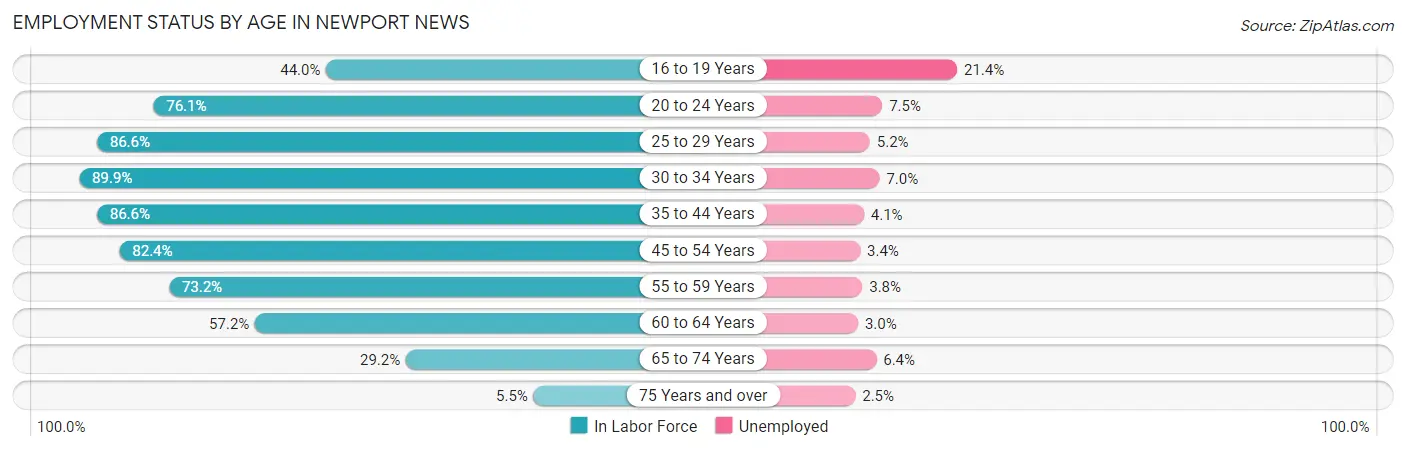
| Age Bracket | In Labor Force | Unemployed |
| 16 to 19 Years | 4,647 (44.0%) | 994 (21.4%) |
| 20 to 24 Years | 11,873 (76.1%) | 890 (7.5%) |
| 25 to 29 Years | 13,646 (86.6%) | 710 (5.2%) |
| 30 to 34 Years | 13,452 (89.9%) | 942 (7.0%) |
| 35 to 44 Years | 20,224 (86.6%) | 829 (4.1%) |
| 45 to 54 Years | 15,923 (82.4%) | 541 (3.4%) |
| 55 to 59 Years | 8,004 (73.2%) | 304 (3.8%) |
| 60 to 64 Years | 6,334 (57.2%) | 190 (3.0%) |
| 65 to 74 Years | 4,263 (29.2%) | 273 (6.4%) |
| 75 Years and over | 561 (5.5%) | 14 (2.5%) |
| Total | 98,941 (67.6%) | 5,541 (5.6%) |
Employment Status by Educational Attainment in Newport News
According to labor force statistics for Newport News, 81.3% of individuals (77,564) out of the total population between 25 and 64 years of age (95,405) are in the labor force, with 4.5% or 3,490 of them being unemployed. The group with the highest labor force participation rate are those with the educational attainment of bachelor's degree or higher, with 89.2% or 25,292 individuals in the labor force. Within the labor force, individuals with less than high school education have the highest percentage of unemployment, with 9.0% or 387 of them being unemployed.
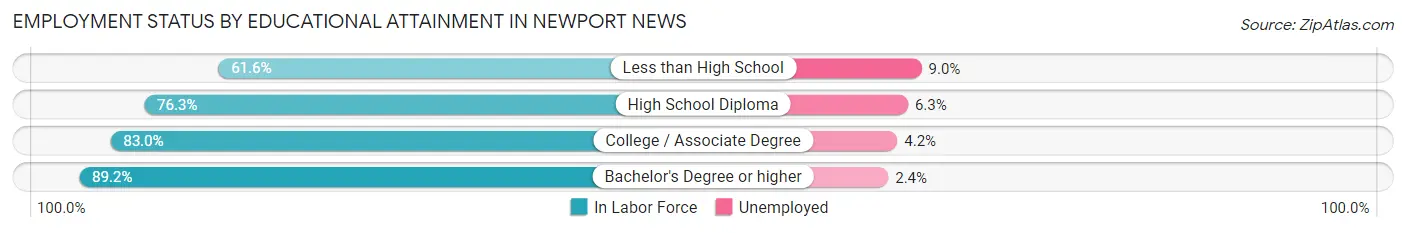
| Educational Attainment | In Labor Force | Unemployed |
| Less than High School | 4,297 (61.6%) | 628 (9.0%) |
| High School Diploma | 20,887 (76.3%) | 1,725 (6.3%) |
| College / Associate Degree | 27,141 (83.0%) | 1,373 (4.2%) |
| Bachelor's Degree or higher | 25,292 (89.2%) | 680 (2.4%) |
| Total | 77,564 (81.3%) | 4,293 (4.5%) |
Employment Occupations by Sex in Newport News
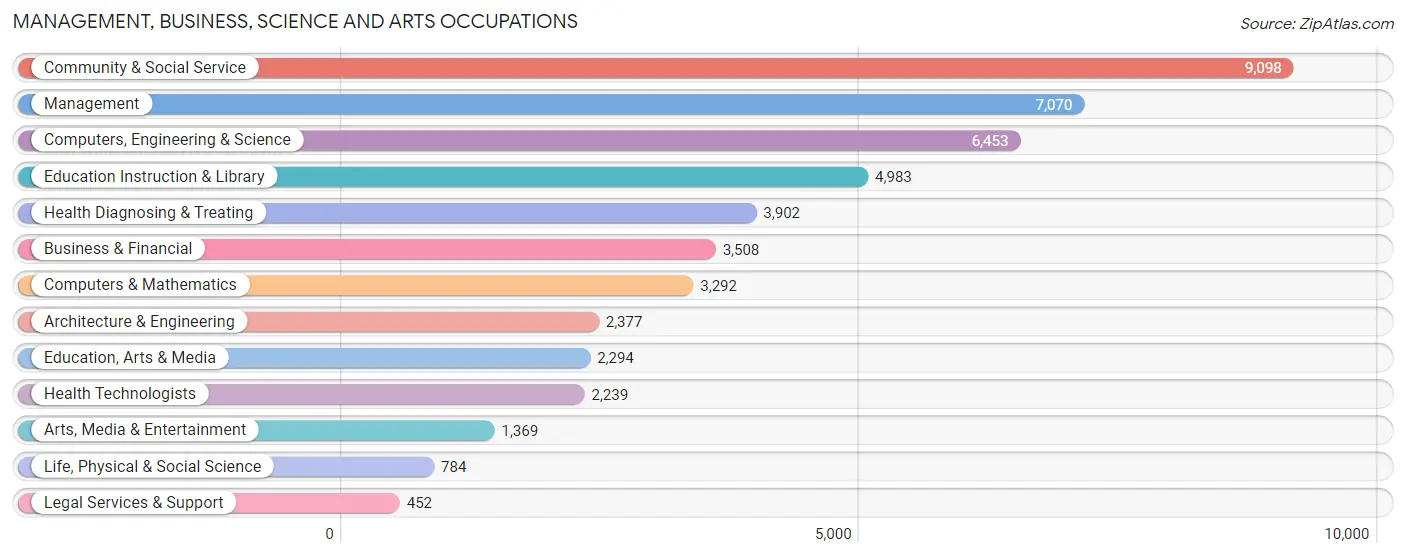
Management, Business, Science and Arts Occupations
The most common Management, Business, Science and Arts occupations in Newport News are Community & Social Service (9,098 | 10.7%), Management (7,070 | 8.3%), Computers, Engineering & Science (6,453 | 7.6%), Education Instruction & Library (4,983 | 5.9%), and Health Diagnosing & Treating (3,902 | 4.6%).
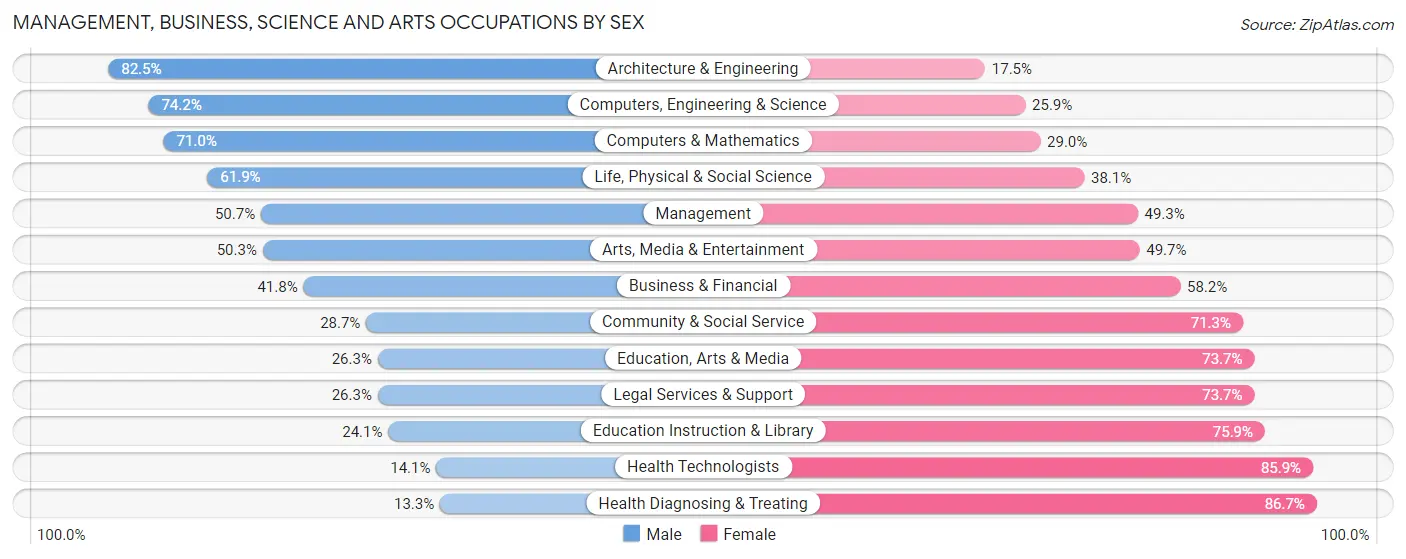
Management, Business, Science and Arts Occupations by Sex
Within the Management, Business, Science and Arts occupations in Newport News, the most male-oriented occupations are Architecture & Engineering (82.5%), Computers, Engineering & Science (74.2%), and Computers & Mathematics (71.0%), while the most female-oriented occupations are Health Diagnosing & Treating (86.7%), Health Technologists (85.9%), and Education Instruction & Library (75.9%).
| Occupation | Male | Female |
| Management | 3,584 (50.7%) | 3,486 (49.3%) |
| Business & Financial | 1,467 (41.8%) | 2,041 (58.2%) |
| Computers, Engineering & Science | 4,785 (74.2%) | 1,668 (25.9%) |
| Computers & Mathematics | 2,338 (71.0%) | 954 (29.0%) |
| Architecture & Engineering | 1,962 (82.5%) | 415 (17.5%) |
| Life, Physical & Social Science | 485 (61.9%) | 299 (38.1%) |
| Community & Social Service | 2,615 (28.7%) | 6,483 (71.3%) |
| Education, Arts & Media | 604 (26.3%) | 1,690 (73.7%) |
| Legal Services & Support | 119 (26.3%) | 333 (73.7%) |
| Education Instruction & Library | 1,203 (24.1%) | 3,780 (75.9%) |
| Arts, Media & Entertainment | 689 (50.3%) | 680 (49.7%) |
| Health Diagnosing & Treating | 520 (13.3%) | 3,382 (86.7%) |
| Health Technologists | 316 (14.1%) | 1,923 (85.9%) |
| Total (Category) | 12,971 (43.2%) | 17,060 (56.8%) |
| Total (Overall) | 41,786 (49.2%) | 43,093 (50.8%) |
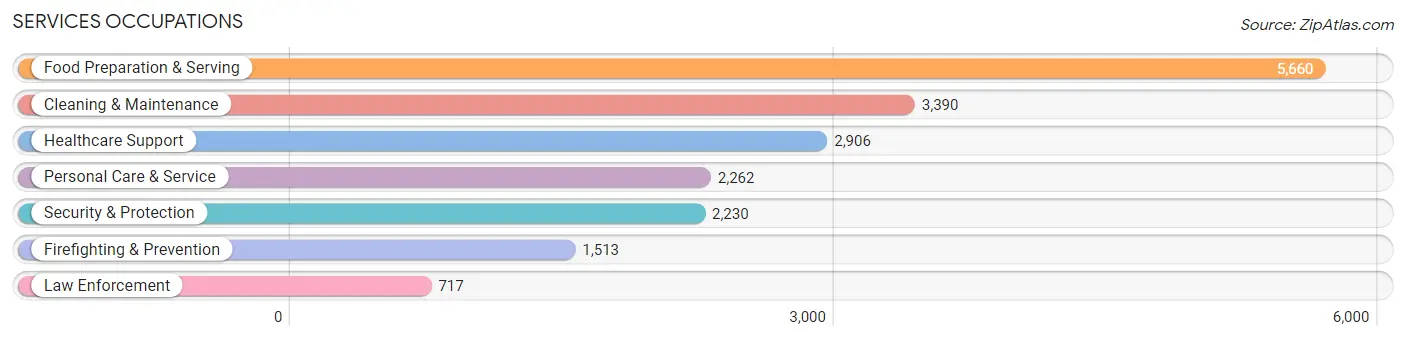
Services Occupations
The most common Services occupations in Newport News are Food Preparation & Serving (5,660 | 6.7%), Cleaning & Maintenance (3,390 | 4.0%), Healthcare Support (2,906 | 3.4%), Personal Care & Service (2,262 | 2.7%), and Security & Protection (2,230 | 2.6%).
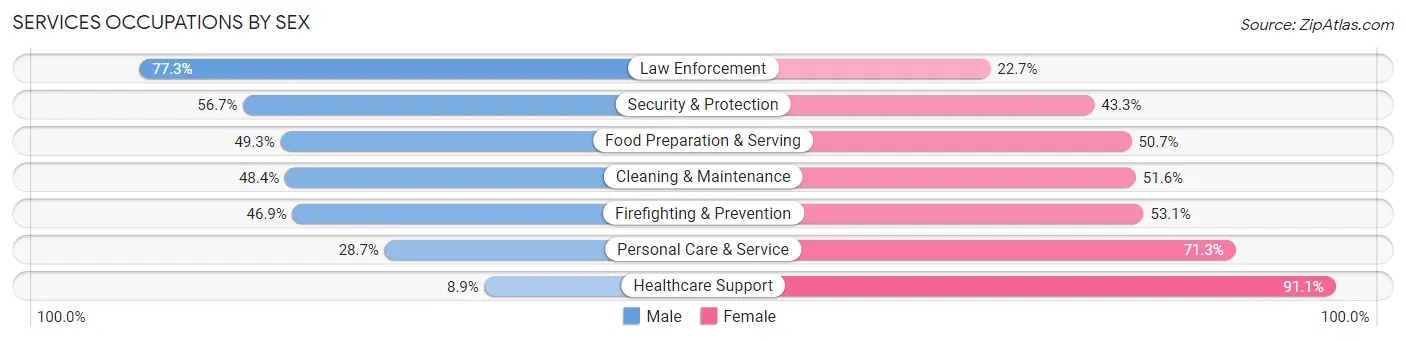
Services Occupations by Sex
Within the Services occupations in Newport News, the most male-oriented occupations are Law Enforcement (77.3%), Security & Protection (56.7%), and Food Preparation & Serving (49.3%), while the most female-oriented occupations are Healthcare Support (91.1%), Personal Care & Service (71.3%), and Firefighting & Prevention (53.1%).
| Occupation | Male | Female |
| Healthcare Support | 259 (8.9%) | 2,647 (91.1%) |
| Security & Protection | 1,264 (56.7%) | 966 (43.3%) |
| Firefighting & Prevention | 710 (46.9%) | 803 (53.1%) |
| Law Enforcement | 554 (77.3%) | 163 (22.7%) |
| Food Preparation & Serving | 2,792 (49.3%) | 2,868 (50.7%) |
| Cleaning & Maintenance | 1,642 (48.4%) | 1,748 (51.6%) |
| Personal Care & Service | 649 (28.7%) | 1,613 (71.3%) |
| Total (Category) | 6,606 (40.2%) | 9,842 (59.8%) |
| Total (Overall) | 41,786 (49.2%) | 43,093 (50.8%) |
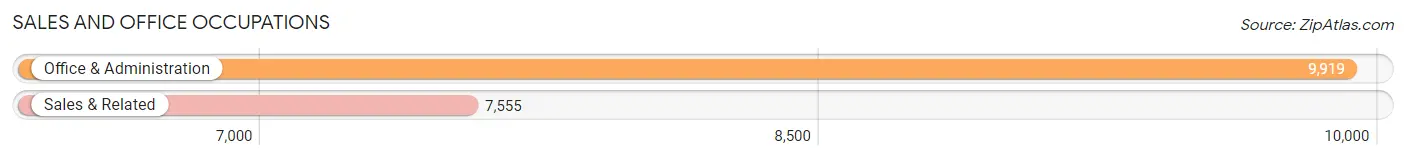
Sales and Office Occupations
The most common Sales and Office occupations in Newport News are Office & Administration (9,919 | 11.7%), and Sales & Related (7,555 | 8.9%).
Sales and Office Occupations by Sex
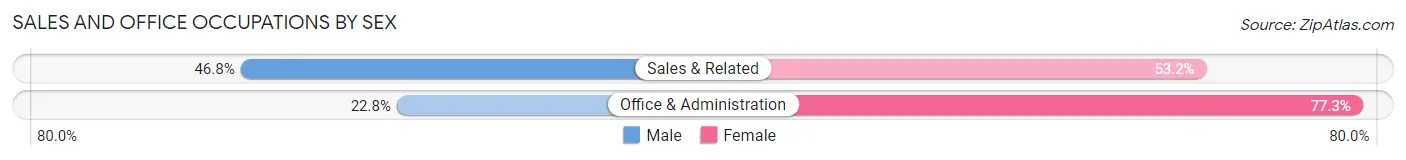
| Occupation | Male | Female |
| Sales & Related | 3,535 (46.8%) | 4,020 (53.2%) |
| Office & Administration | 2,257 (22.8%) | 7,662 (77.2%) |
| Total (Category) | 5,792 (33.2%) | 11,682 (66.8%) |
| Total (Overall) | 41,786 (49.2%) | 43,093 (50.8%) |
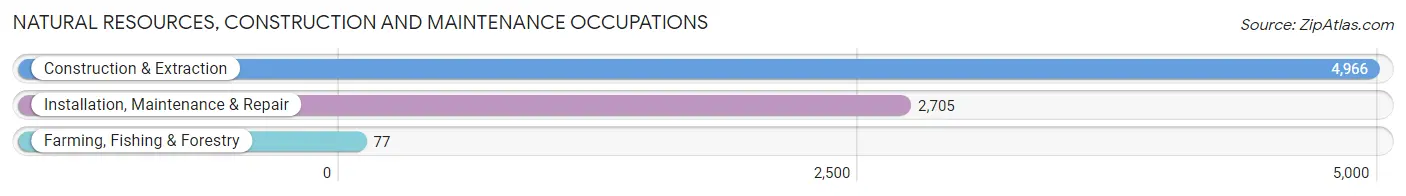
Natural Resources, Construction and Maintenance Occupations
The most common Natural Resources, Construction and Maintenance occupations in Newport News are Construction & Extraction (4,966 | 5.9%), Installation, Maintenance & Repair (2,705 | 3.2%), and Farming, Fishing & Forestry (77 | 0.1%).
Natural Resources, Construction and Maintenance Occupations by Sex
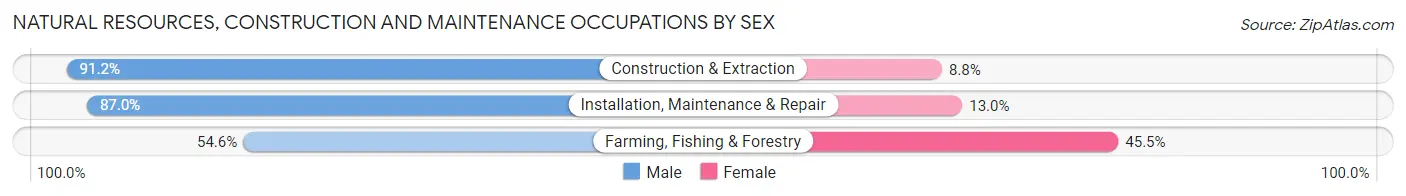
| Occupation | Male | Female |
| Farming, Fishing & Forestry | 42 (54.5%) | 35 (45.5%) |
| Construction & Extraction | 4,531 (91.2%) | 435 (8.8%) |
| Installation, Maintenance & Repair | 2,354 (87.0%) | 351 (13.0%) |
| Total (Category) | 6,927 (89.4%) | 821 (10.6%) |
| Total (Overall) | 41,786 (49.2%) | 43,093 (50.8%) |
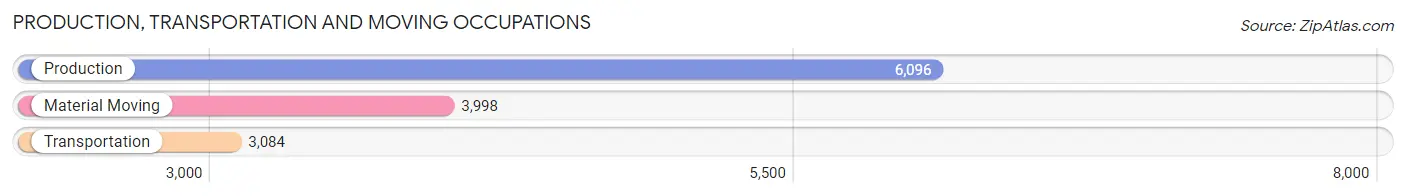
Production, Transportation and Moving Occupations
The most common Production, Transportation and Moving occupations in Newport News are Production (6,096 | 7.2%), Material Moving (3,998 | 4.7%), and Transportation (3,084 | 3.6%).
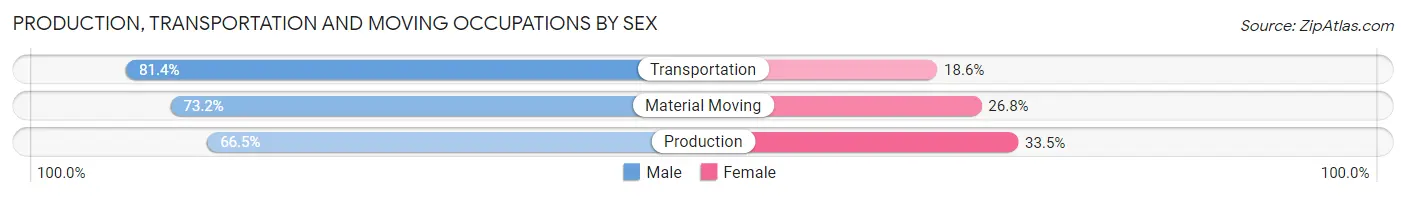
Production, Transportation and Moving Occupations by Sex
| Occupation | Male | Female |
| Production | 4,053 (66.5%) | 2,043 (33.5%) |
| Transportation | 2,509 (81.4%) | 575 (18.6%) |
| Material Moving | 2,928 (73.2%) | 1,070 (26.8%) |
| Total (Category) | 9,490 (72.0%) | 3,688 (28.0%) |
| Total (Overall) | 41,786 (49.2%) | 43,093 (50.8%) |
Employment Industries by Sex in Newport News
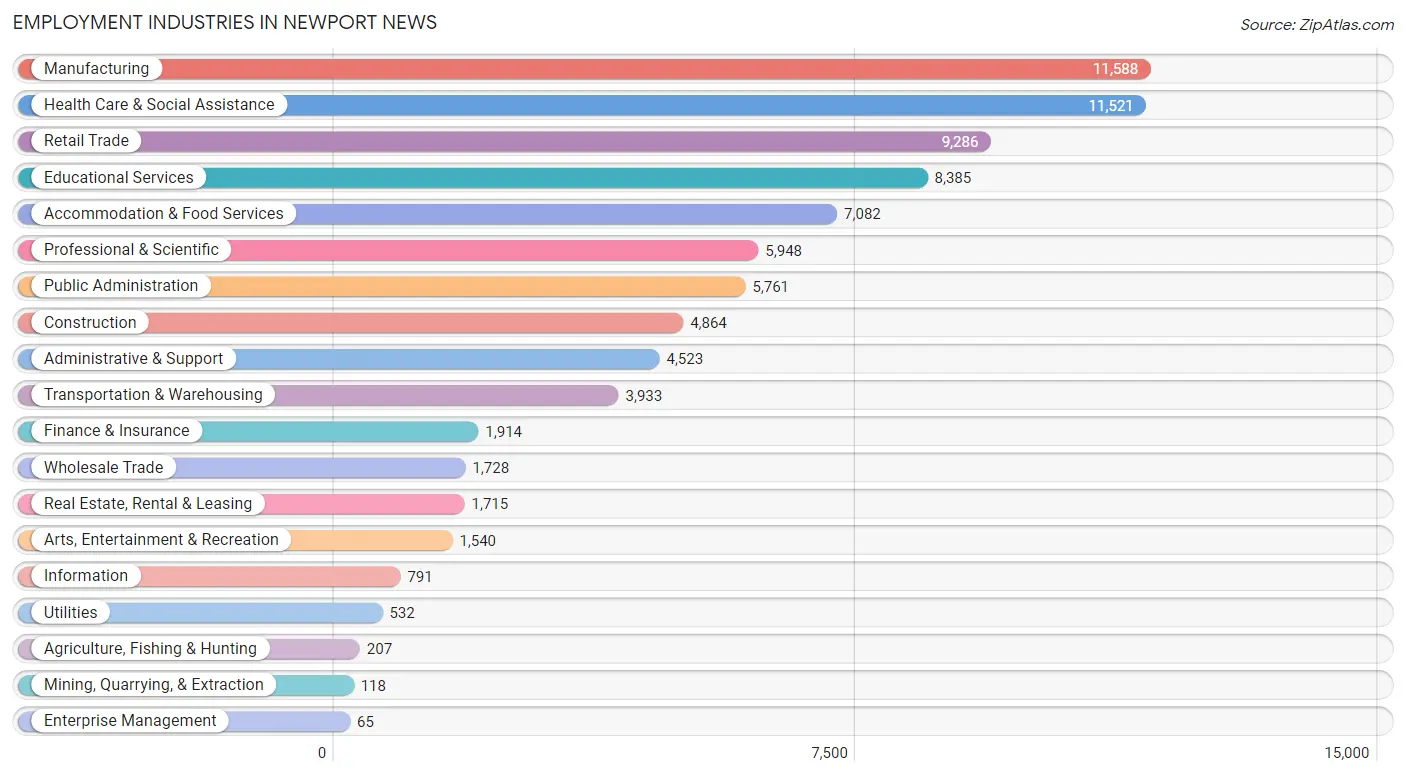
Employment Industries in Newport News
The major employment industries in Newport News include Manufacturing (11,588 | 13.7%), Health Care & Social Assistance (11,521 | 13.6%), Retail Trade (9,286 | 10.9%), Educational Services (8,385 | 9.9%), and Accommodation & Food Services (7,082 | 8.3%).
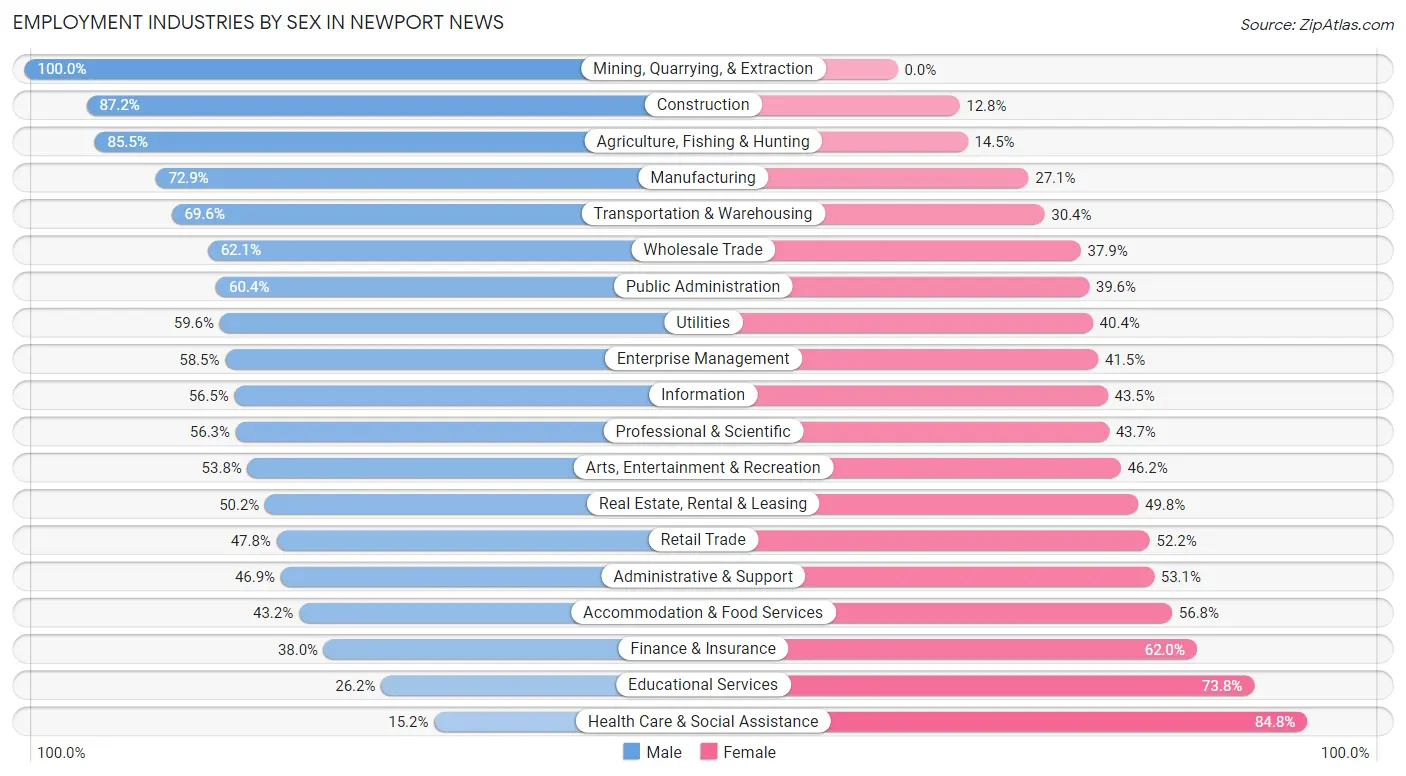
Employment Industries by Sex in Newport News
The Newport News industries that see more men than women are Mining, Quarrying, & Extraction (100.0%), Construction (87.2%), and Agriculture, Fishing & Hunting (85.5%), whereas the industries that tend to have a higher number of women are Health Care & Social Assistance (84.8%), Educational Services (73.8%), and Finance & Insurance (62.0%).
| Industry | Male | Female |
| Agriculture, Fishing & Hunting | 177 (85.5%) | 30 (14.5%) |
| Mining, Quarrying, & Extraction | 118 (100.0%) | 0 (0.0%) |
| Construction | 4,241 (87.2%) | 623 (12.8%) |
| Manufacturing | 8,449 (72.9%) | 3,139 (27.1%) |
| Wholesale Trade | 1,073 (62.1%) | 655 (37.9%) |
| Retail Trade | 4,441 (47.8%) | 4,845 (52.2%) |
| Transportation & Warehousing | 2,737 (69.6%) | 1,196 (30.4%) |
| Utilities | 317 (59.6%) | 215 (40.4%) |
| Information | 447 (56.5%) | 344 (43.5%) |
| Finance & Insurance | 728 (38.0%) | 1,186 (62.0%) |
| Real Estate, Rental & Leasing | 861 (50.2%) | 854 (49.8%) |
| Professional & Scientific | 3,347 (56.3%) | 2,601 (43.7%) |
| Enterprise Management | 38 (58.5%) | 27 (41.5%) |
| Administrative & Support | 2,123 (46.9%) | 2,400 (53.1%) |
| Educational Services | 2,194 (26.2%) | 6,191 (73.8%) |
| Health Care & Social Assistance | 1,751 (15.2%) | 9,770 (84.8%) |
| Arts, Entertainment & Recreation | 829 (53.8%) | 711 (46.2%) |
| Accommodation & Food Services | 3,059 (43.2%) | 4,023 (56.8%) |
| Public Administration | 3,478 (60.4%) | 2,283 (39.6%) |
| Total | 41,786 (49.2%) | 43,093 (50.8%) |
Education in Newport News
School Enrollment in Newport News
The most common levels of schooling among the 48,368 students in Newport News are college / undergraduate (11,989 | 24.8%), elementary school (9,715 | 20.1%), and middle school (9,204 | 19.0%).
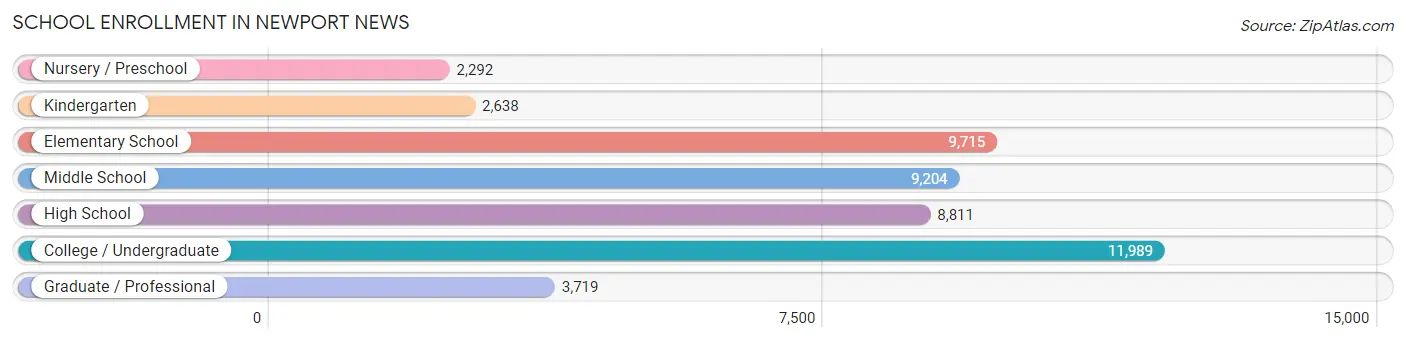
| School Level | # Students | % Students |
| Nursery / Preschool | 2,292 | 4.7% |
| Kindergarten | 2,638 | 5.4% |
| Elementary School | 9,715 | 20.1% |
| Middle School | 9,204 | 19.0% |
| High School | 8,811 | 18.2% |
| College / Undergraduate | 11,989 | 24.8% |
| Graduate / Professional | 3,719 | 7.7% |
| Total | 48,368 | 100.0% |
School Enrollment by Age by Funding Source in Newport News
Out of a total of 48,368 students who are enrolled in schools in Newport News, 6,626 (13.7%) attend a private institution, while the remaining 41,742 (86.3%) are enrolled in public schools. The age group of 25 to 34 year olds has the highest likelihood of being enrolled in private schools, with 1,630 (29.4% in the age bracket) enrolled. Conversely, the age group of 20 to 24 year olds has the lowest likelihood of being enrolled in a private school, with 4,732 (92.9% in the age bracket) attending a public institution.
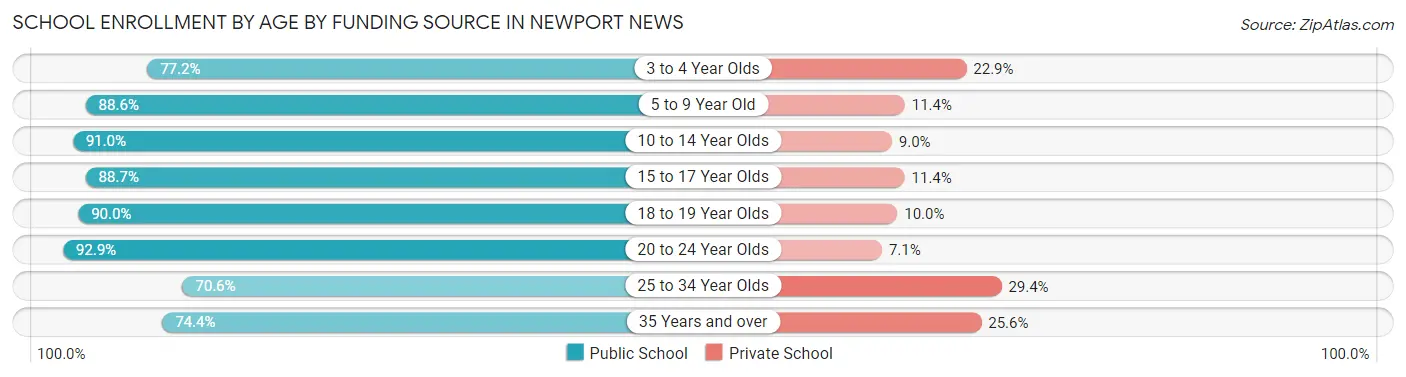
| Age Bracket | Public School | Private School |
| 3 to 4 Year Olds | 1,587 (77.1%) | 470 (22.9%) |
| 5 to 9 Year Old | 10,502 (88.6%) | 1,348 (11.4%) |
| 10 to 14 Year Olds | 9,755 (91.0%) | 961 (9.0%) |
| 15 to 17 Year Olds | 5,590 (88.6%) | 716 (11.4%) |
| 18 to 19 Year Olds | 3,548 (90.0%) | 394 (10.0%) |
| 20 to 24 Year Olds | 4,732 (92.9%) | 364 (7.1%) |
| 25 to 34 Year Olds | 3,916 (70.6%) | 1,630 (29.4%) |
| 35 Years and over | 2,123 (74.4%) | 732 (25.6%) |
| Total | 41,742 (86.3%) | 6,626 (13.7%) |
Educational Attainment by Field of Study in Newport News
Business (7,589 | 20.6%), education (4,251 | 11.5%), science & technology (3,796 | 10.3%), arts & humanities (3,155 | 8.6%), and social sciences (2,798 | 7.6%) are the most common fields of study among 36,884 individuals in Newport News who have obtained a bachelor's degree or higher.
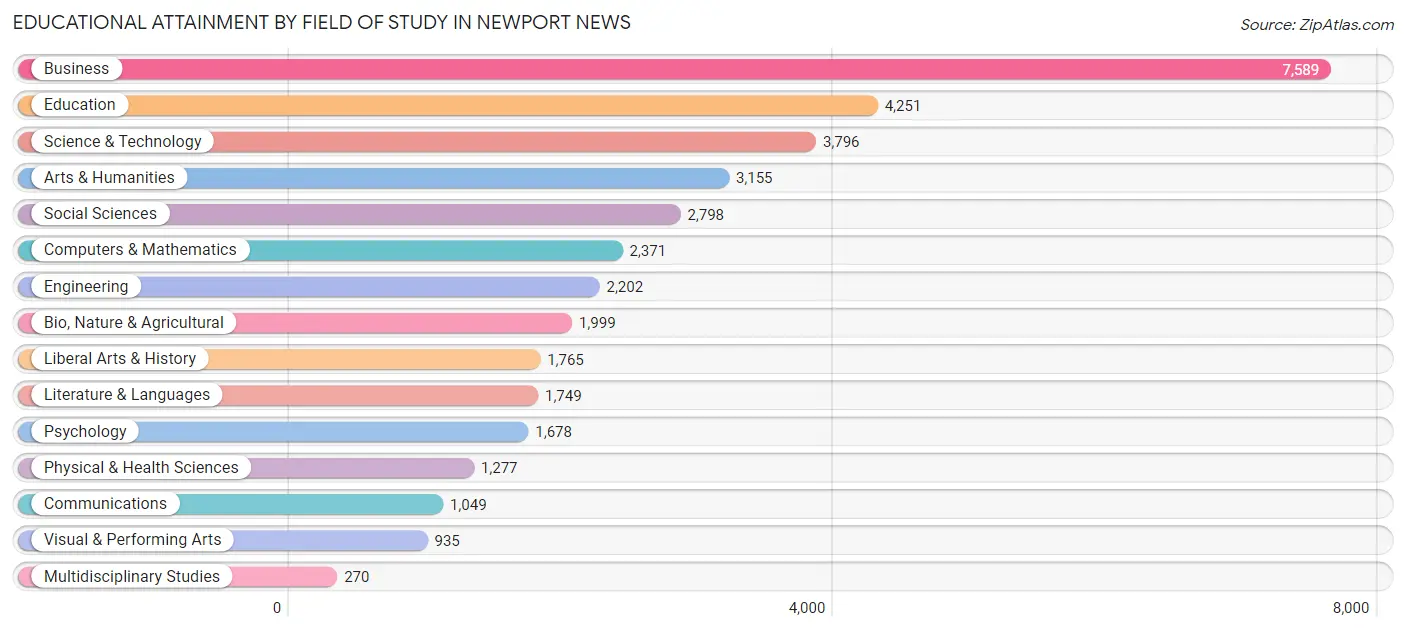
| Field of Study | # Graduates | % Graduates |
| Computers & Mathematics | 2,371 | 6.4% |
| Bio, Nature & Agricultural | 1,999 | 5.4% |
| Physical & Health Sciences | 1,277 | 3.5% |
| Psychology | 1,678 | 4.5% |
| Social Sciences | 2,798 | 7.6% |
| Engineering | 2,202 | 6.0% |
| Multidisciplinary Studies | 270 | 0.7% |
| Science & Technology | 3,796 | 10.3% |
| Business | 7,589 | 20.6% |
| Education | 4,251 | 11.5% |
| Literature & Languages | 1,749 | 4.7% |
| Liberal Arts & History | 1,765 | 4.8% |
| Visual & Performing Arts | 935 | 2.5% |
| Communications | 1,049 | 2.8% |
| Arts & Humanities | 3,155 | 8.6% |
| Total | 36,884 | 100.0% |
Transportation & Commute in Newport News
Vehicle Availability by Sex in Newport News
The most prevalent vehicle ownership categories in Newport News are males with 2 vehicles (19,658, accounting for 42.8%) and females with 2 vehicles (14,570, making up 46.3%).
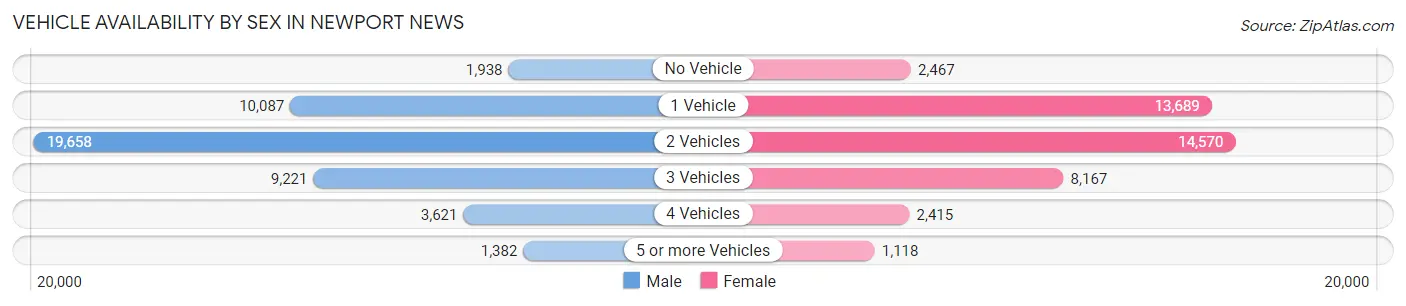
| Vehicles Available | Male | Female |
| No Vehicle | 1,938 (4.2%) | 2,467 (5.8%) |
| 1 Vehicle | 10,087 (22.0%) | 13,689 (32.3%) |
| 2 Vehicles | 19,658 (42.8%) | 14,570 (34.3%) |
| 3 Vehicles | 9,221 (20.1%) | 8,167 (19.3%) |
| 4 Vehicles | 3,621 (7.9%) | 2,415 (5.7%) |
| 5 or more Vehicles | 1,382 (3.0%) | 1,118 (2.6%) |
| Total | 45,907 (100.0%) | 42,426 (100.0%) |
Commute Time in Newport News
The most frequently occuring commute durations in Newport News are 15 to 19 minutes (16,805 commuters, 19.7%), 10 to 14 minutes (14,436 commuters, 16.9%), and 20 to 24 minutes (13,646 commuters, 16.0%).
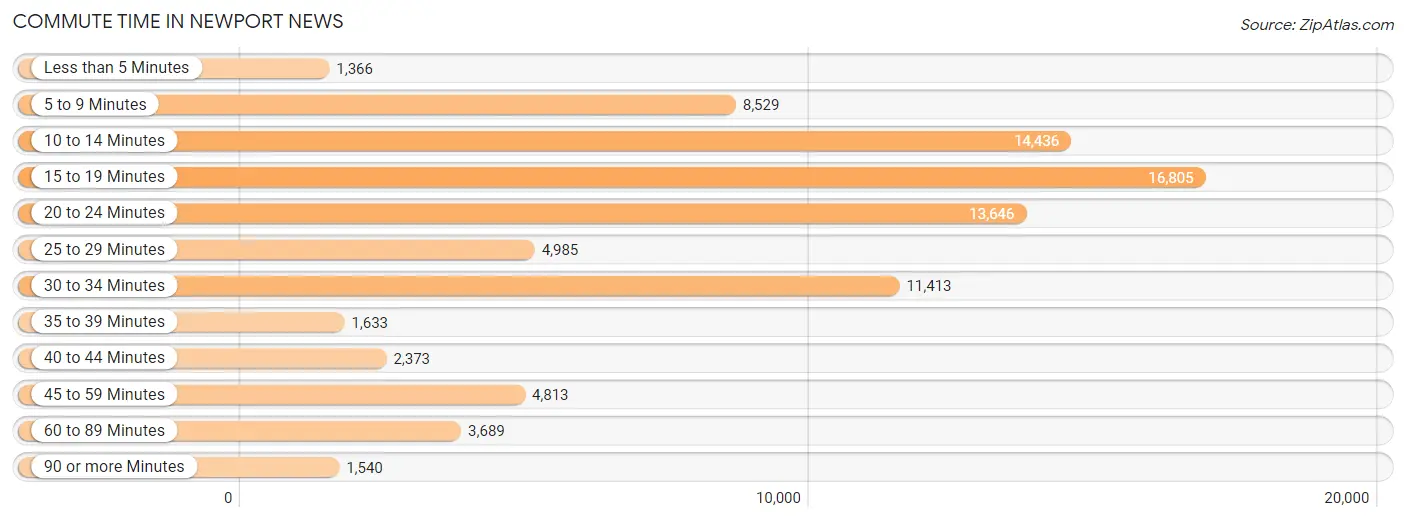
| Commute Time | # Commuters | % Commuters |
| Less than 5 Minutes | 1,366 | 1.6% |
| 5 to 9 Minutes | 8,529 | 10.0% |
| 10 to 14 Minutes | 14,436 | 16.9% |
| 15 to 19 Minutes | 16,805 | 19.7% |
| 20 to 24 Minutes | 13,646 | 16.0% |
| 25 to 29 Minutes | 4,985 | 5.9% |
| 30 to 34 Minutes | 11,413 | 13.4% |
| 35 to 39 Minutes | 1,633 | 1.9% |
| 40 to 44 Minutes | 2,373 | 2.8% |
| 45 to 59 Minutes | 4,813 | 5.7% |
| 60 to 89 Minutes | 3,689 | 4.3% |
| 90 or more Minutes | 1,540 | 1.8% |
Commute Time by Sex in Newport News
The most common commute times in Newport News are 15 to 19 minutes (8,687 commuters, 19.1%) for males and 15 to 19 minutes (8,118 commuters, 20.4%) for females.
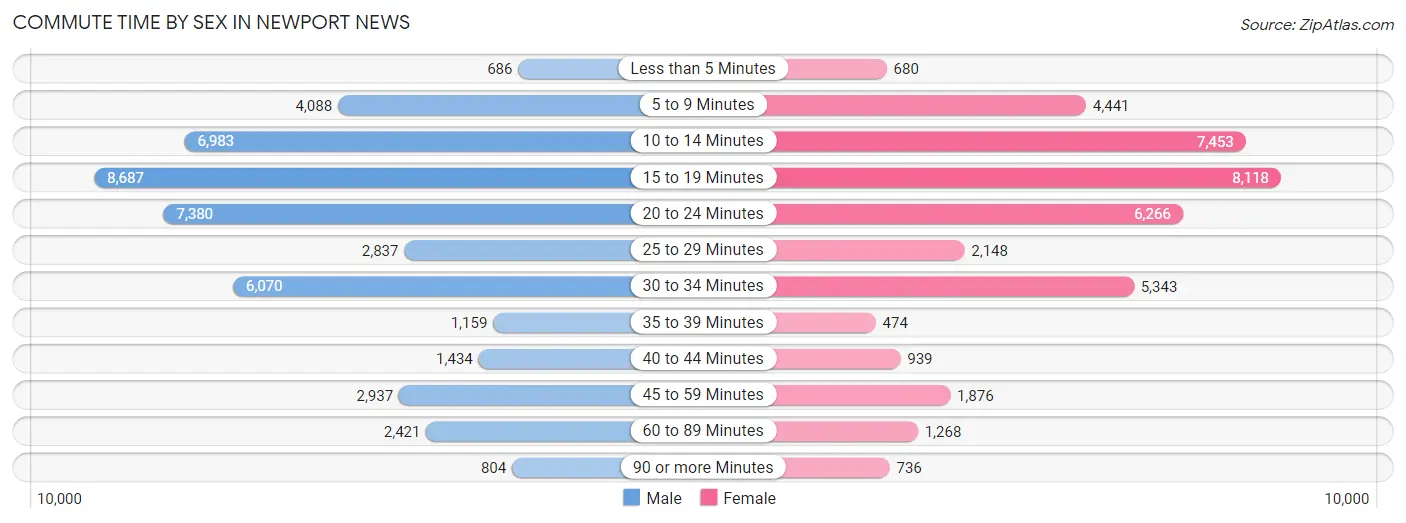
| Commute Time | Male | Female |
| Less than 5 Minutes | 686 (1.5%) | 680 (1.7%) |
| 5 to 9 Minutes | 4,088 (9.0%) | 4,441 (11.2%) |
| 10 to 14 Minutes | 6,983 (15.3%) | 7,453 (18.8%) |
| 15 to 19 Minutes | 8,687 (19.1%) | 8,118 (20.4%) |
| 20 to 24 Minutes | 7,380 (16.2%) | 6,266 (15.8%) |
| 25 to 29 Minutes | 2,837 (6.2%) | 2,148 (5.4%) |
| 30 to 34 Minutes | 6,070 (13.3%) | 5,343 (13.4%) |
| 35 to 39 Minutes | 1,159 (2.5%) | 474 (1.2%) |
| 40 to 44 Minutes | 1,434 (3.2%) | 939 (2.4%) |
| 45 to 59 Minutes | 2,937 (6.5%) | 1,876 (4.7%) |
| 60 to 89 Minutes | 2,421 (5.3%) | 1,268 (3.2%) |
| 90 or more Minutes | 804 (1.8%) | 736 (1.8%) |
Time of Departure to Work by Sex in Newport News
The most frequent times of departure to work in Newport News are 6:00 AM to 6:29 AM (7,975, 17.5%) for males and 7:00 AM to 7:29 AM (6,731, 16.9%) for females.
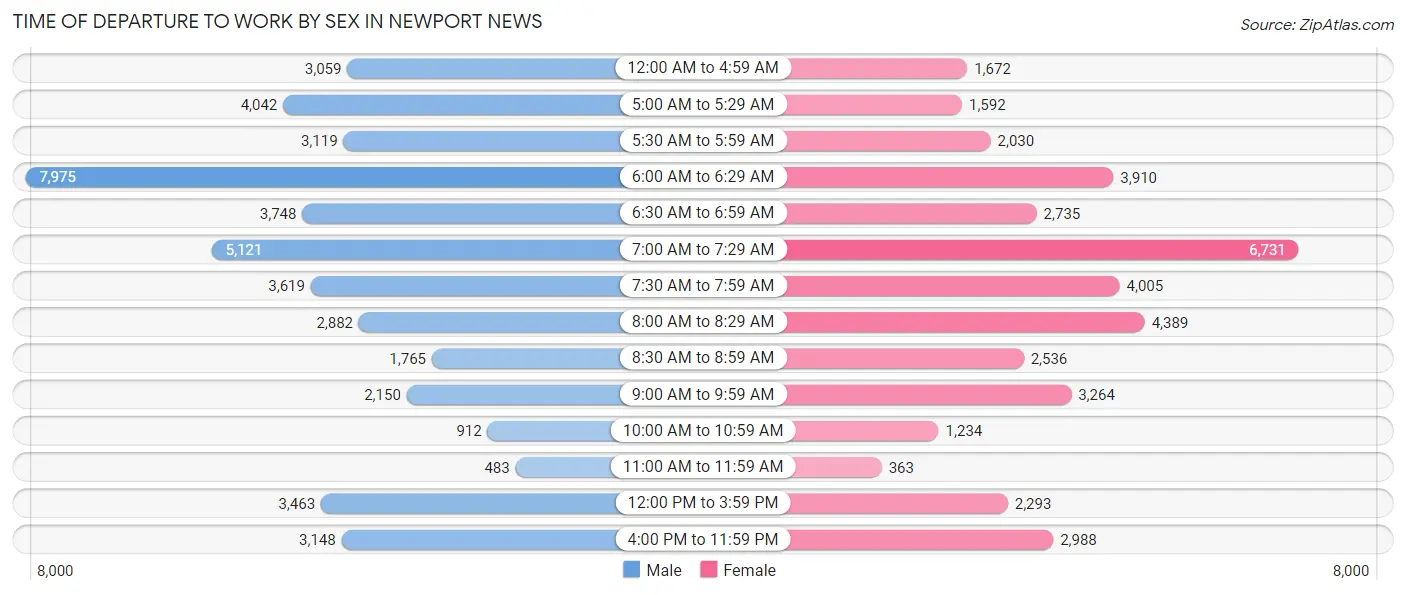
| Time of Departure | Male | Female |
| 12:00 AM to 4:59 AM | 3,059 (6.7%) | 1,672 (4.2%) |
| 5:00 AM to 5:29 AM | 4,042 (8.9%) | 1,592 (4.0%) |
| 5:30 AM to 5:59 AM | 3,119 (6.9%) | 2,030 (5.1%) |
| 6:00 AM to 6:29 AM | 7,975 (17.5%) | 3,910 (9.8%) |
| 6:30 AM to 6:59 AM | 3,748 (8.2%) | 2,735 (6.9%) |
| 7:00 AM to 7:29 AM | 5,121 (11.3%) | 6,731 (16.9%) |
| 7:30 AM to 7:59 AM | 3,619 (8.0%) | 4,005 (10.1%) |
| 8:00 AM to 8:29 AM | 2,882 (6.3%) | 4,389 (11.0%) |
| 8:30 AM to 8:59 AM | 1,765 (3.9%) | 2,536 (6.4%) |
| 9:00 AM to 9:59 AM | 2,150 (4.7%) | 3,264 (8.2%) |
| 10:00 AM to 10:59 AM | 912 (2.0%) | 1,234 (3.1%) |
| 11:00 AM to 11:59 AM | 483 (1.1%) | 363 (0.9%) |
| 12:00 PM to 3:59 PM | 3,463 (7.6%) | 2,293 (5.8%) |
| 4:00 PM to 11:59 PM | 3,148 (6.9%) | 2,988 (7.5%) |
| Total | 45,486 (100.0%) | 39,742 (100.0%) |
Housing Occupancy in Newport News
Occupancy by Ownership in Newport News
Of the total 75,465 dwellings in Newport News, owner-occupied units account for 35,931 (47.6%), while renter-occupied units make up 39,534 (52.4%).
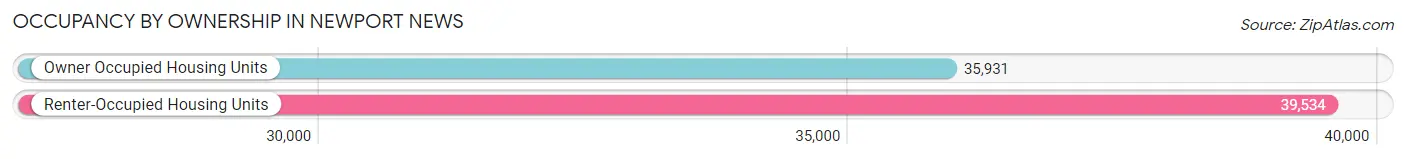
| Occupancy | # Housing Units | % Housing Units |
| Owner Occupied Housing Units | 35,931 | 47.6% |
| Renter-Occupied Housing Units | 39,534 | 52.4% |
| Total Occupied Housing Units | 75,465 | 100.0% |
Occupancy by Household Size in Newport News
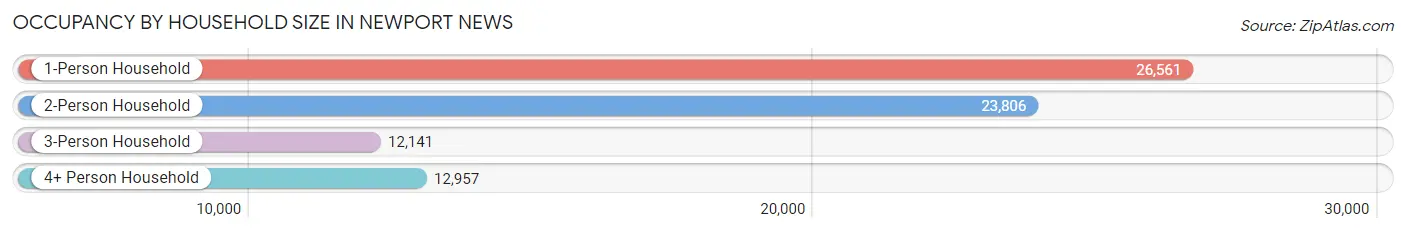
| Household Size | # Housing Units | % Housing Units |
| 1-Person Household | 26,561 | 35.2% |
| 2-Person Household | 23,806 | 31.6% |
| 3-Person Household | 12,141 | 16.1% |
| 4+ Person Household | 12,957 | 17.2% |
| Total Housing Units | 75,465 | 100.0% |
Occupancy by Ownership by Household Size in Newport News
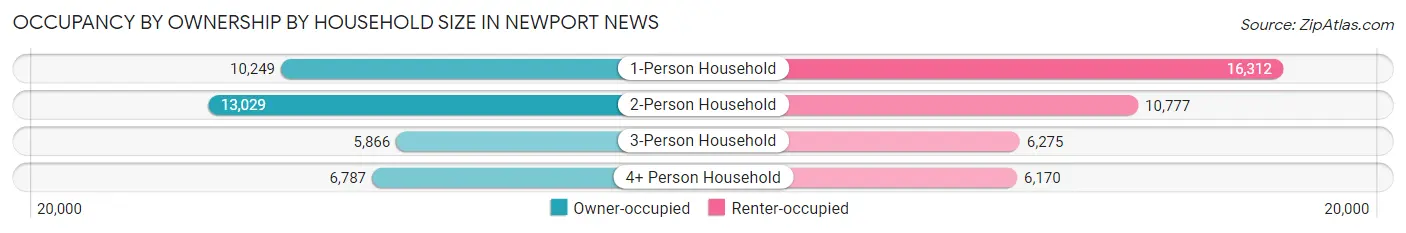
| Household Size | Owner-occupied | Renter-occupied |
| 1-Person Household | 10,249 (38.6%) | 16,312 (61.4%) |
| 2-Person Household | 13,029 (54.7%) | 10,777 (45.3%) |
| 3-Person Household | 5,866 (48.3%) | 6,275 (51.7%) |
| 4+ Person Household | 6,787 (52.4%) | 6,170 (47.6%) |
| Total Housing Units | 35,931 (47.6%) | 39,534 (52.4%) |
Occupancy by Educational Attainment in Newport News
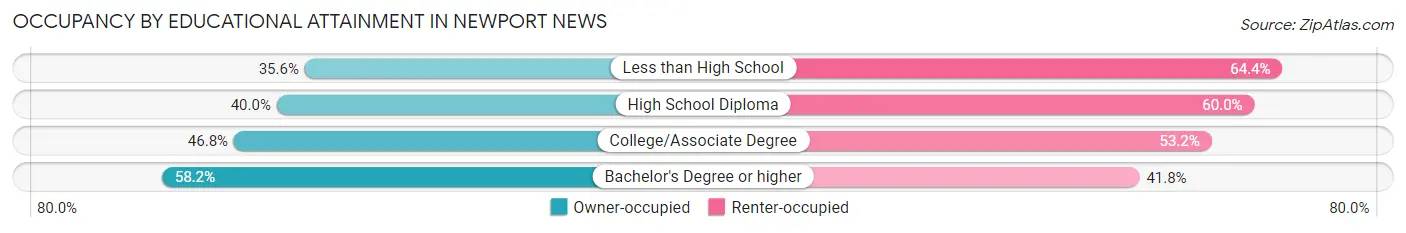
| Household Size | Owner-occupied | Renter-occupied |
| Less than High School | 1,790 (35.6%) | 3,242 (64.4%) |
| High School Diploma | 8,481 (40.0%) | 12,716 (60.0%) |
| College/Associate Degree | 12,336 (46.8%) | 14,022 (53.2%) |
| Bachelor's Degree or higher | 13,324 (58.2%) | 9,554 (41.8%) |
Occupancy by Age of Householder in Newport News
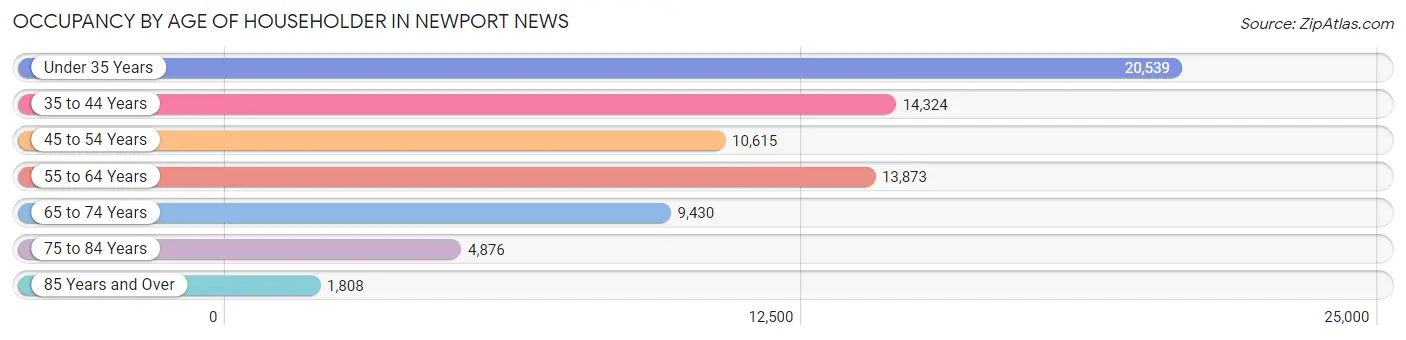
| Age Bracket | # Households | % Households |
| Under 35 Years | 20,539 | 27.2% |
| 35 to 44 Years | 14,324 | 19.0% |
| 45 to 54 Years | 10,615 | 14.1% |
| 55 to 64 Years | 13,873 | 18.4% |
| 65 to 74 Years | 9,430 | 12.5% |
| 75 to 84 Years | 4,876 | 6.5% |
| 85 Years and Over | 1,808 | 2.4% |
| Total | 75,465 | 100.0% |
Housing Finances in Newport News
Median Income by Occupancy in Newport News
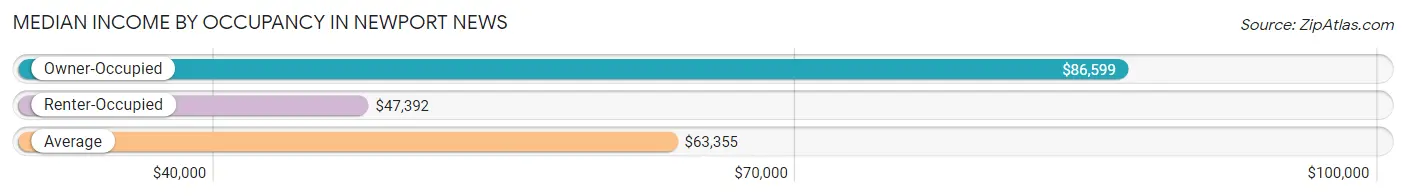
| Occupancy Type | # Households | Median Income |
| Owner-Occupied | 35,931 (47.6%) | $86,599 |
| Renter-Occupied | 39,534 (52.4%) | $47,392 |
| Average | 75,465 (100.0%) | $63,355 |
Occupancy by Householder Income Bracket in Newport News
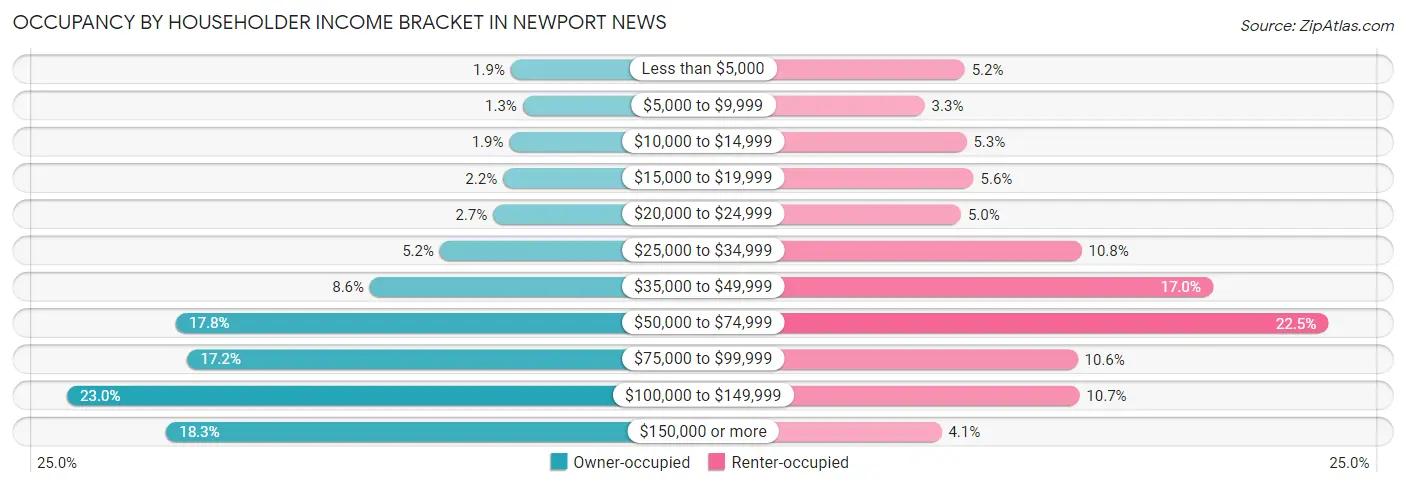
| Income Bracket | Owner-occupied | Renter-occupied |
| Less than $5,000 | 664 (1.8%) | 2,054 (5.2%) |
| $5,000 to $9,999 | 461 (1.3%) | 1,301 (3.3%) |
| $10,000 to $14,999 | 690 (1.9%) | 2,086 (5.3%) |
| $15,000 to $19,999 | 798 (2.2%) | 2,221 (5.6%) |
| $20,000 to $24,999 | 966 (2.7%) | 1,986 (5.0%) |
| $25,000 to $34,999 | 1,880 (5.2%) | 4,255 (10.8%) |
| $35,000 to $49,999 | 3,075 (8.6%) | 6,724 (17.0%) |
| $50,000 to $74,999 | 6,389 (17.8%) | 8,896 (22.5%) |
| $75,000 to $99,999 | 6,194 (17.2%) | 4,178 (10.6%) |
| $100,000 to $149,999 | 8,257 (23.0%) | 4,216 (10.7%) |
| $150,000 or more | 6,557 (18.2%) | 1,617 (4.1%) |
| Total | 35,931 (100.0%) | 39,534 (100.0%) |
Monthly Housing Cost Tiers in Newport News
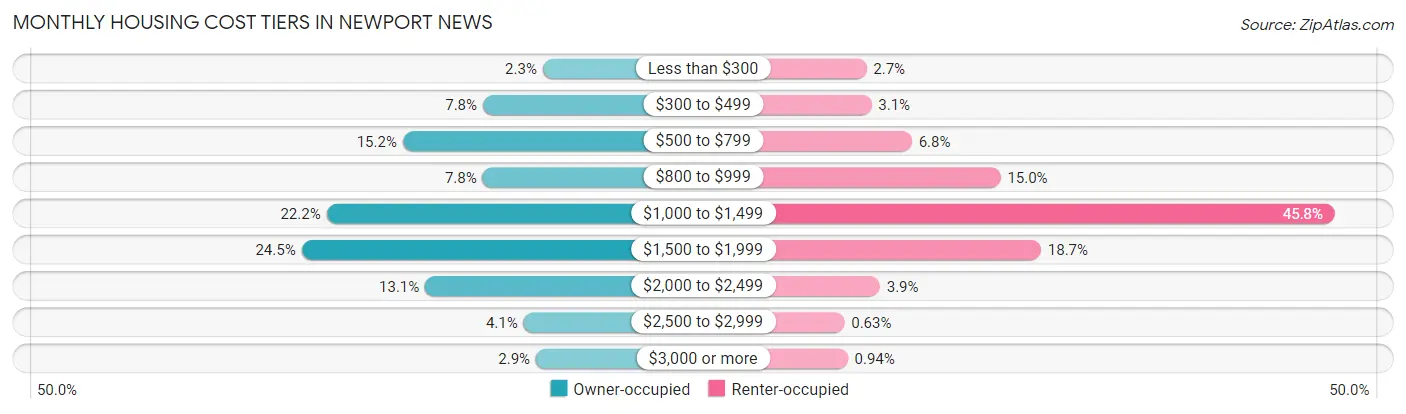
| Monthly Cost | Owner-occupied | Renter-occupied |
| Less than $300 | 827 (2.3%) | 1,053 (2.7%) |
| $300 to $499 | 2,807 (7.8%) | 1,232 (3.1%) |
| $500 to $799 | 5,459 (15.2%) | 2,706 (6.8%) |
| $800 to $999 | 2,817 (7.8%) | 5,933 (15.0%) |
| $1,000 to $1,499 | 7,982 (22.2%) | 18,104 (45.8%) |
| $1,500 to $1,999 | 8,807 (24.5%) | 7,404 (18.7%) |
| $2,000 to $2,499 | 4,718 (13.1%) | 1,541 (3.9%) |
| $2,500 to $2,999 | 1,462 (4.1%) | 251 (0.6%) |
| $3,000 or more | 1,052 (2.9%) | 372 (0.9%) |
| Total | 35,931 (100.0%) | 39,534 (100.0%) |
Physical Housing Characteristics in Newport News
Housing Structures in Newport News
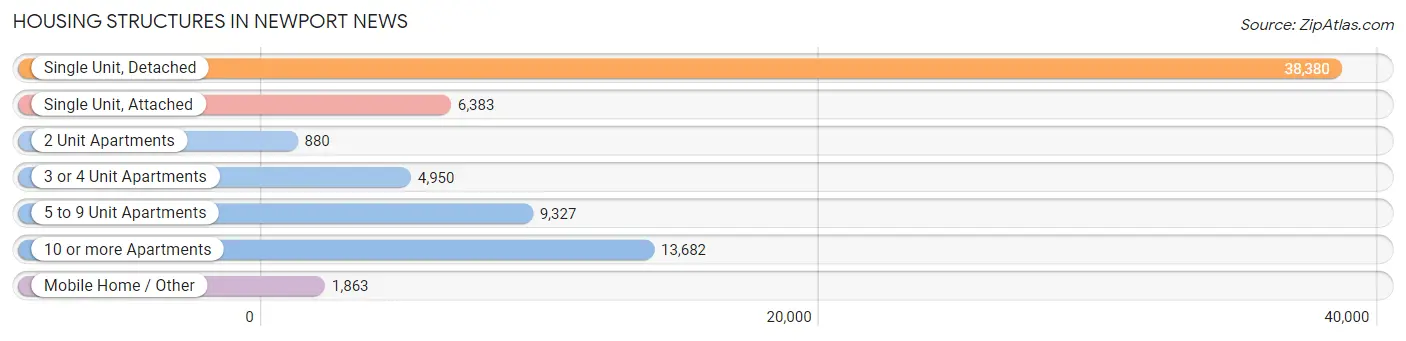
| Structure Type | # Housing Units | % Housing Units |
| Single Unit, Detached | 38,380 | 50.9% |
| Single Unit, Attached | 6,383 | 8.5% |
| 2 Unit Apartments | 880 | 1.2% |
| 3 or 4 Unit Apartments | 4,950 | 6.6% |
| 5 to 9 Unit Apartments | 9,327 | 12.4% |
| 10 or more Apartments | 13,682 | 18.1% |
| Mobile Home / Other | 1,863 | 2.5% |
| Total | 75,465 | 100.0% |
Housing Structures by Occupancy in Newport News
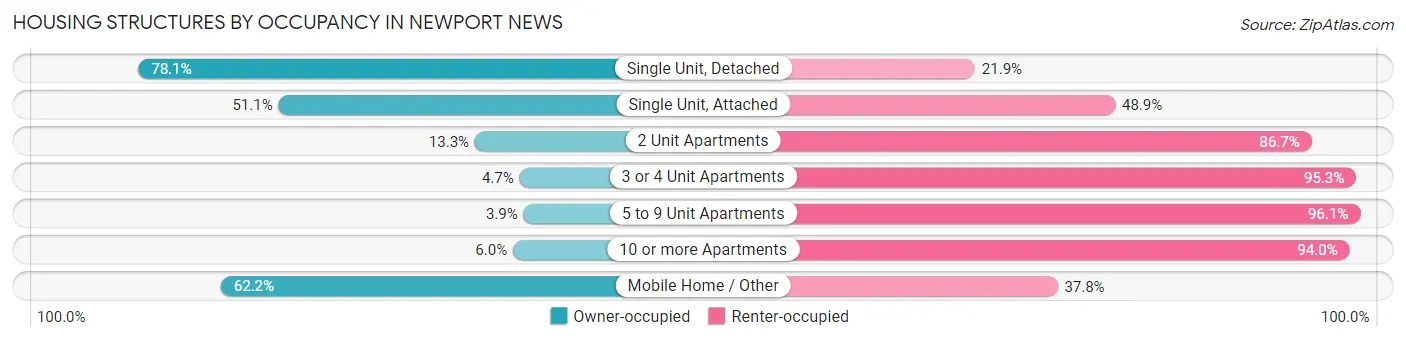
| Structure Type | Owner-occupied | Renter-occupied |
| Single Unit, Detached | 29,975 (78.1%) | 8,405 (21.9%) |
| Single Unit, Attached | 3,263 (51.1%) | 3,120 (48.9%) |
| 2 Unit Apartments | 117 (13.3%) | 763 (86.7%) |
| 3 or 4 Unit Apartments | 233 (4.7%) | 4,717 (95.3%) |
| 5 to 9 Unit Apartments | 367 (3.9%) | 8,960 (96.1%) |
| 10 or more Apartments | 817 (6.0%) | 12,865 (94.0%) |
| Mobile Home / Other | 1,159 (62.2%) | 704 (37.8%) |
| Total | 35,931 (47.6%) | 39,534 (52.4%) |
Housing Structures by Number of Rooms in Newport News
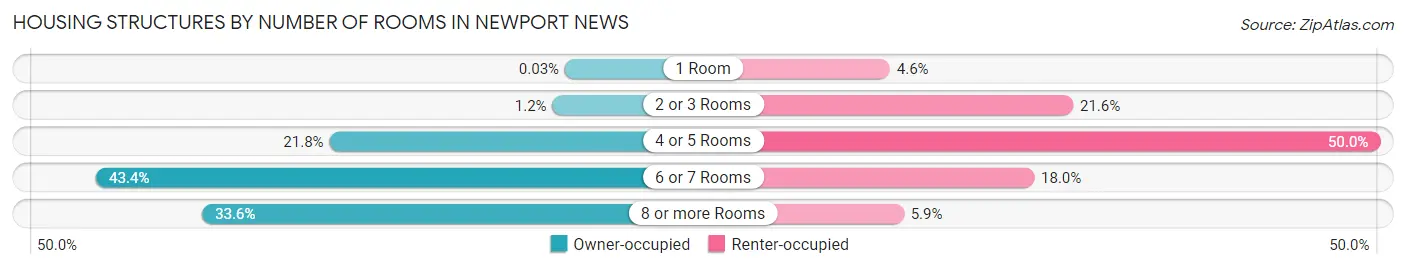
| Number of Rooms | Owner-occupied | Renter-occupied |
| 1 Room | 10 (0.0%) | 1,826 (4.6%) |
| 2 or 3 Rooms | 424 (1.2%) | 8,523 (21.6%) |
| 4 or 5 Rooms | 7,838 (21.8%) | 19,752 (50.0%) |
| 6 or 7 Rooms | 15,592 (43.4%) | 7,101 (18.0%) |
| 8 or more Rooms | 12,067 (33.6%) | 2,332 (5.9%) |
| Total | 35,931 (100.0%) | 39,534 (100.0%) |
Housing Structure by Heating Type in Newport News
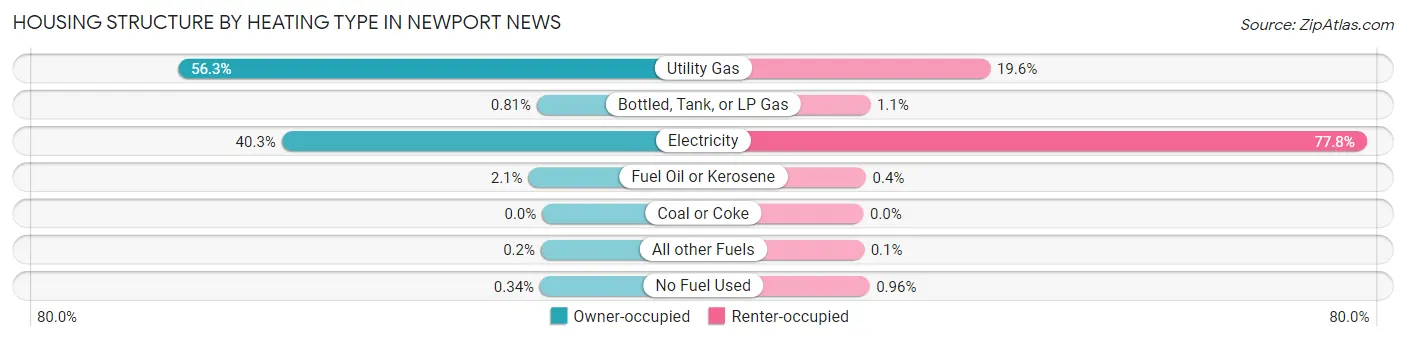
| Heating Type | Owner-occupied | Renter-occupied |
| Utility Gas | 20,218 (56.3%) | 7,758 (19.6%) |
| Bottled, Tank, or LP Gas | 291 (0.8%) | 424 (1.1%) |
| Electricity | 14,466 (40.3%) | 30,772 (77.8%) |
| Fuel Oil or Kerosene | 761 (2.1%) | 158 (0.4%) |
| Coal or Coke | 0 (0.0%) | 0 (0.0%) |
| All other Fuels | 72 (0.2%) | 41 (0.1%) |
| No Fuel Used | 123 (0.3%) | 381 (1.0%) |
| Total | 35,931 (100.0%) | 39,534 (100.0%) |
Household Vehicle Usage in Newport News
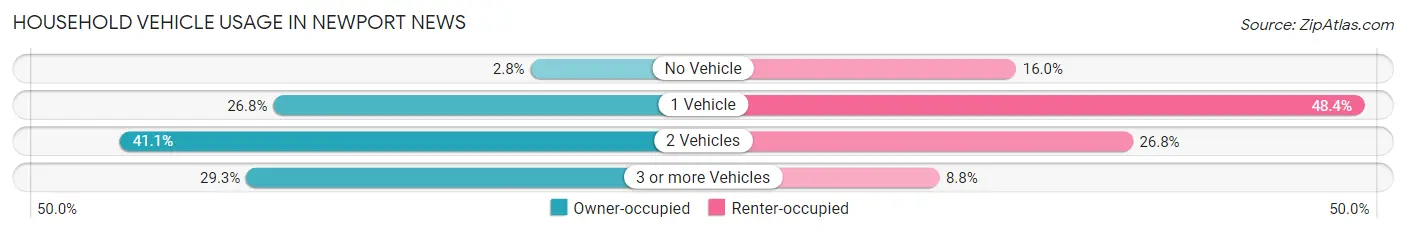
| Vehicles per Household | Owner-occupied | Renter-occupied |
| No Vehicle | 1,000 (2.8%) | 6,304 (16.0%) |
| 1 Vehicle | 9,625 (26.8%) | 19,148 (48.4%) |
| 2 Vehicles | 14,772 (41.1%) | 10,609 (26.8%) |
| 3 or more Vehicles | 10,534 (29.3%) | 3,473 (8.8%) |
| Total | 35,931 (100.0%) | 39,534 (100.0%) |
Real Estate & Mortgages in Newport News
Real Estate and Mortgage Overview in Newport News
| Characteristic | Without Mortgage | With Mortgage |
| Housing Units | 10,529 | 25,402 |
| Median Property Value | $213,800 | $239,800 |
| Median Household Income | $66,016 | $5,291 |
| Monthly Housing Costs | $594 | $1,038 |
| Real Estate Taxes | $2,415 | $1,437 |
Property Value by Mortgage Status in Newport News
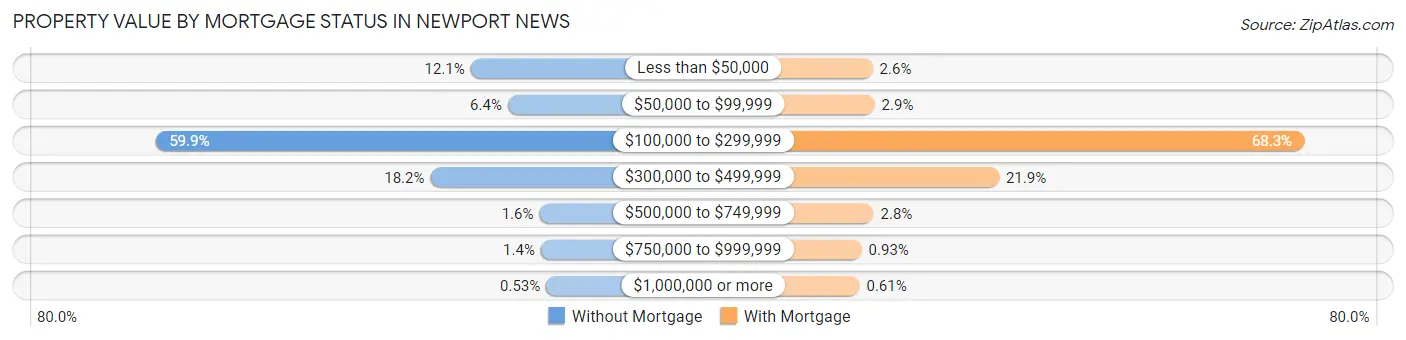
| Property Value | Without Mortgage | With Mortgage |
| Less than $50,000 | 1,269 (12.0%) | 663 (2.6%) |
| $50,000 to $99,999 | 672 (6.4%) | 739 (2.9%) |
| $100,000 to $299,999 | 6,311 (59.9%) | 17,355 (68.3%) |
| $300,000 to $499,999 | 1,914 (18.2%) | 5,554 (21.9%) |
| $500,000 to $749,999 | 165 (1.6%) | 699 (2.8%) |
| $750,000 to $999,999 | 142 (1.3%) | 236 (0.9%) |
| $1,000,000 or more | 56 (0.5%) | 156 (0.6%) |
| Total | 10,529 (100.0%) | 25,402 (100.0%) |
Household Income by Mortgage Status in Newport News
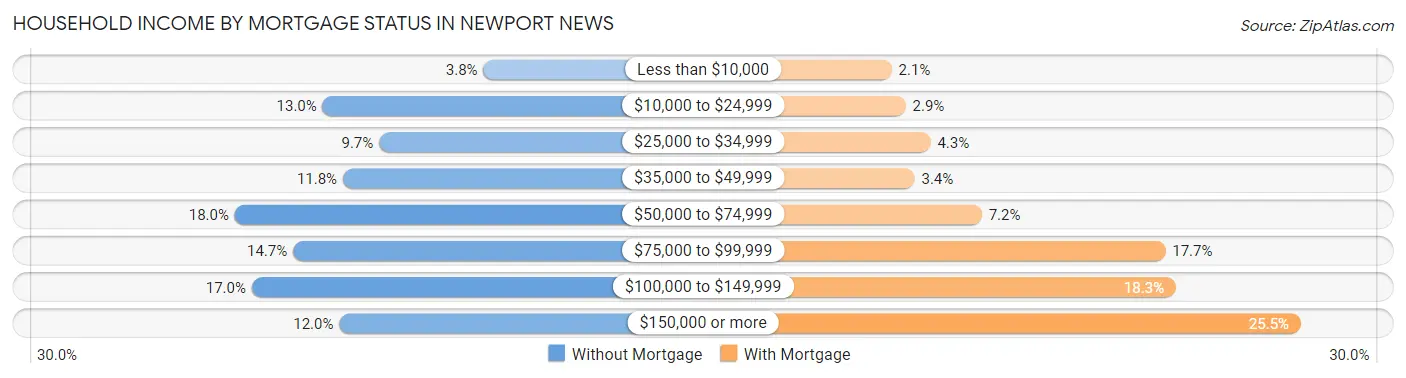
| Household Income | Without Mortgage | With Mortgage |
| Less than $10,000 | 398 (3.8%) | 523 (2.1%) |
| $10,000 to $24,999 | 1,366 (13.0%) | 727 (2.9%) |
| $25,000 to $34,999 | 1,025 (9.7%) | 1,088 (4.3%) |
| $35,000 to $49,999 | 1,244 (11.8%) | 855 (3.4%) |
| $50,000 to $74,999 | 1,894 (18.0%) | 1,831 (7.2%) |
| $75,000 to $99,999 | 1,544 (14.7%) | 4,495 (17.7%) |
| $100,000 to $149,999 | 1,792 (17.0%) | 4,650 (18.3%) |
| $150,000 or more | 1,266 (12.0%) | 6,465 (25.5%) |
| Total | 10,529 (100.0%) | 25,402 (100.0%) |
Property Value to Household Income Ratio in Newport News
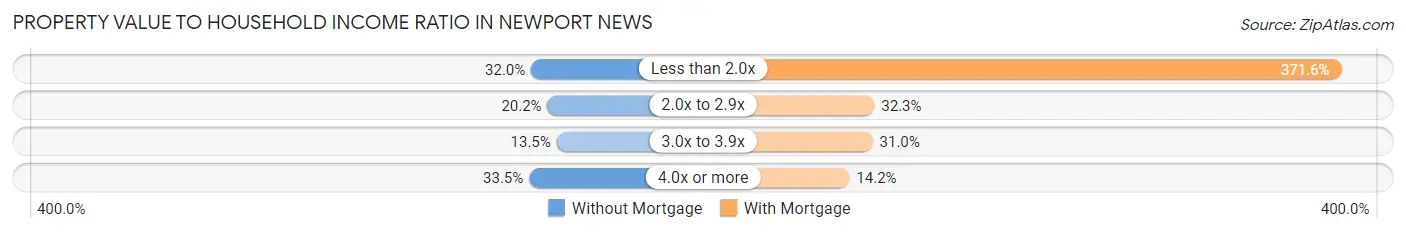
| Value-to-Income Ratio | Without Mortgage | With Mortgage |
| Less than 2.0x | 3,372 (32.0%) | 94,387 (371.6%) |
| 2.0x to 2.9x | 2,125 (20.2%) | 8,199 (32.3%) |
| 3.0x to 3.9x | 1,422 (13.5%) | 7,873 (31.0%) |
| 4.0x or more | 3,526 (33.5%) | 3,596 (14.2%) |
| Total | 10,529 (100.0%) | 25,402 (100.0%) |
Real Estate Taxes by Mortgage Status in Newport News
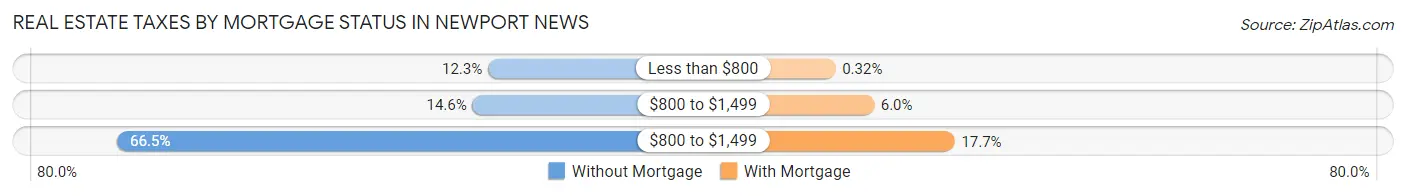
| Property Taxes | Without Mortgage | With Mortgage |
| Less than $800 | 1,293 (12.3%) | 81 (0.3%) |
| $800 to $1,499 | 1,532 (14.5%) | 1,512 (5.9%) |
| $800 to $1,499 | 7,001 (66.5%) | 4,507 (17.7%) |
| Total | 10,529 (100.0%) | 25,402 (100.0%) |
Health & Disability in Newport News
Health Insurance Coverage by Age in Newport News
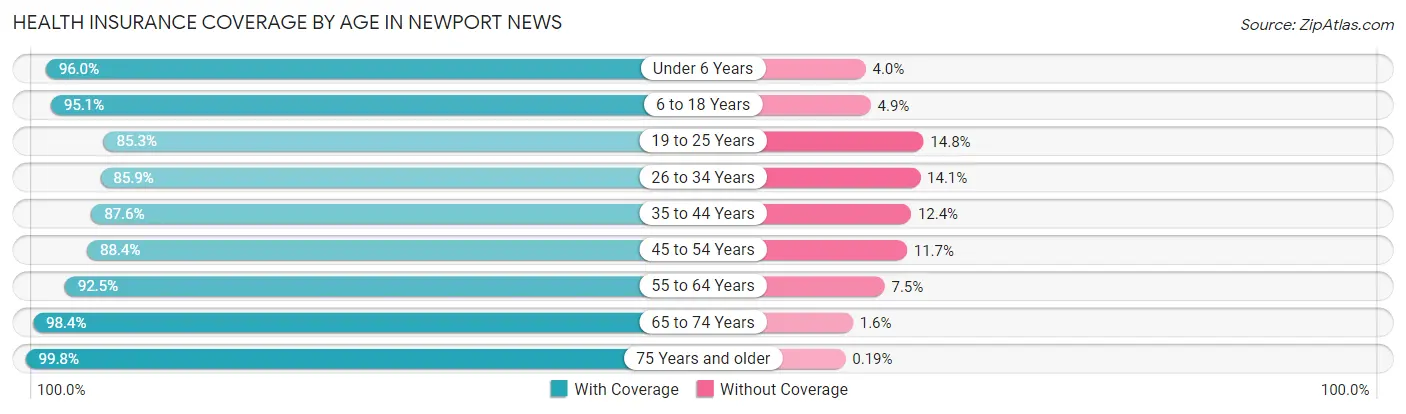
| Age Bracket | With Coverage | Without Coverage |
| Under 6 Years | 14,636 (96.0%) | 604 (4.0%) |
| 6 to 18 Years | 29,069 (95.1%) | 1,499 (4.9%) |
| 19 to 25 Years | 14,980 (85.3%) | 2,592 (14.7%) |
| 26 to 34 Years | 21,404 (85.9%) | 3,524 (14.1%) |
| 35 to 44 Years | 18,834 (87.6%) | 2,673 (12.4%) |
| 45 to 54 Years | 16,753 (88.3%) | 2,210 (11.7%) |
| 55 to 64 Years | 20,189 (92.5%) | 1,639 (7.5%) |
| 65 to 74 Years | 14,127 (98.4%) | 227 (1.6%) |
| 75 Years and older | 9,850 (99.8%) | 19 (0.2%) |
| Total | 159,842 (91.4%) | 14,987 (8.6%) |
Health Insurance Coverage by Citizenship Status in Newport News
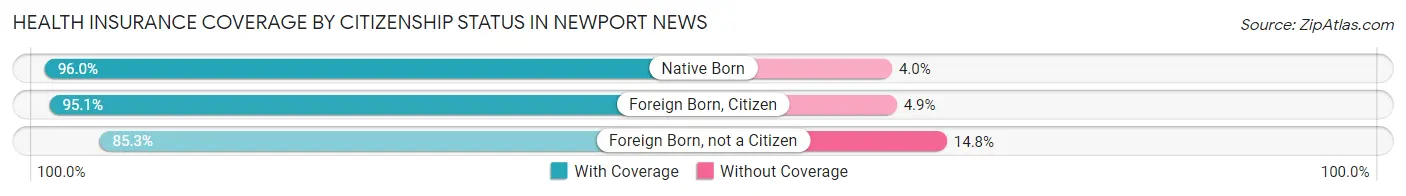
| Citizenship Status | With Coverage | Without Coverage |
| Native Born | 14,636 (96.0%) | 604 (4.0%) |
| Foreign Born, Citizen | 29,069 (95.1%) | 1,499 (4.9%) |
| Foreign Born, not a Citizen | 14,980 (85.3%) | 2,592 (14.7%) |
Health Insurance Coverage by Household Income in Newport News
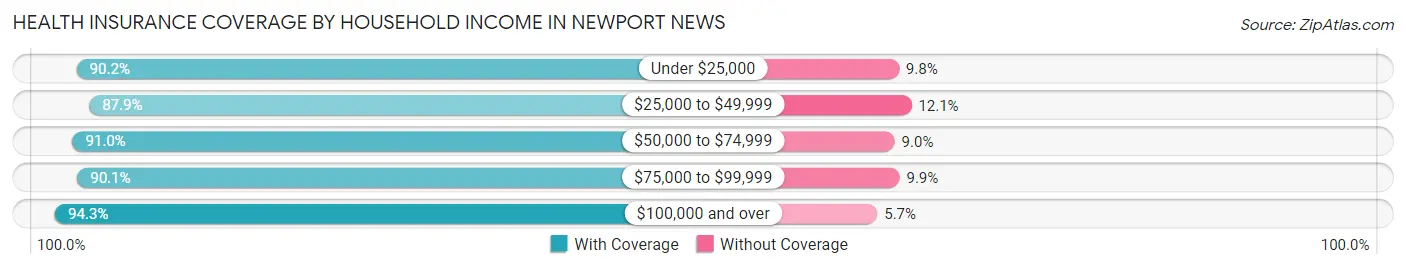
| Household Income | With Coverage | Without Coverage |
| Under $25,000 | 21,024 (90.2%) | 2,273 (9.8%) |
| $25,000 to $49,999 | 27,195 (87.9%) | 3,746 (12.1%) |
| $50,000 to $74,999 | 28,718 (91.0%) | 2,830 (9.0%) |
| $75,000 to $99,999 | 24,063 (90.1%) | 2,637 (9.9%) |
| $100,000 and over | 55,595 (94.3%) | 3,366 (5.7%) |
Public vs Private Health Insurance Coverage by Age in Newport News
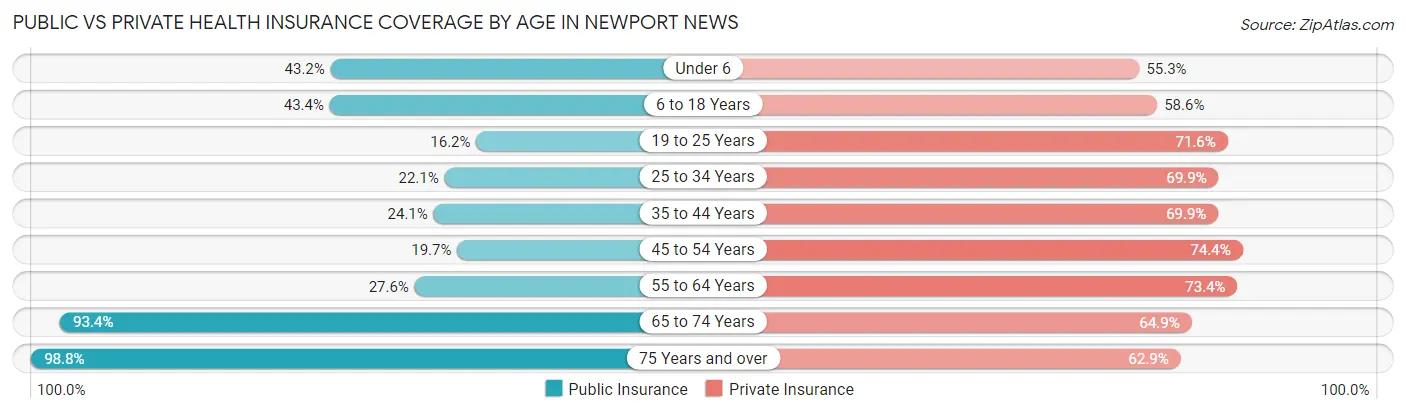
| Age Bracket | Public Insurance | Private Insurance |
| Under 6 | 6,584 (43.2%) | 8,420 (55.2%) |
| 6 to 18 Years | 13,252 (43.3%) | 17,899 (58.6%) |
| 19 to 25 Years | 2,838 (16.2%) | 12,583 (71.6%) |
| 25 to 34 Years | 5,497 (22.1%) | 17,429 (69.9%) |
| 35 to 44 Years | 5,178 (24.1%) | 15,025 (69.9%) |
| 45 to 54 Years | 3,732 (19.7%) | 14,106 (74.4%) |
| 55 to 64 Years | 6,023 (27.6%) | 16,028 (73.4%) |
| 65 to 74 Years | 13,409 (93.4%) | 9,317 (64.9%) |
| 75 Years and over | 9,748 (98.8%) | 6,206 (62.9%) |
| Total | 66,261 (37.9%) | 117,013 (66.9%) |
Disability Status by Sex by Age in Newport News
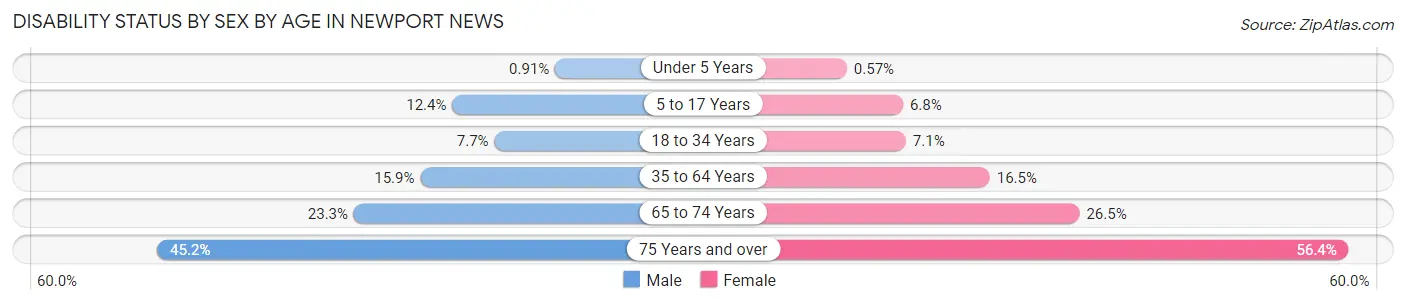
| Age Bracket | Male | Female |
| Under 5 Years | 61 (0.9%) | 36 (0.6%) |
| 5 to 17 Years | 1,885 (12.4%) | 986 (6.8%) |
| 18 to 34 Years | 1,629 (7.7%) | 1,735 (7.1%) |
| 35 to 64 Years | 4,582 (15.9%) | 5,527 (16.5%) |
| 65 to 74 Years | 1,470 (23.3%) | 2,132 (26.5%) |
| 75 Years and over | 1,660 (45.2%) | 3,499 (56.4%) |
Disability Class by Sex by Age in Newport News
Disability Class: Hearing Difficulty
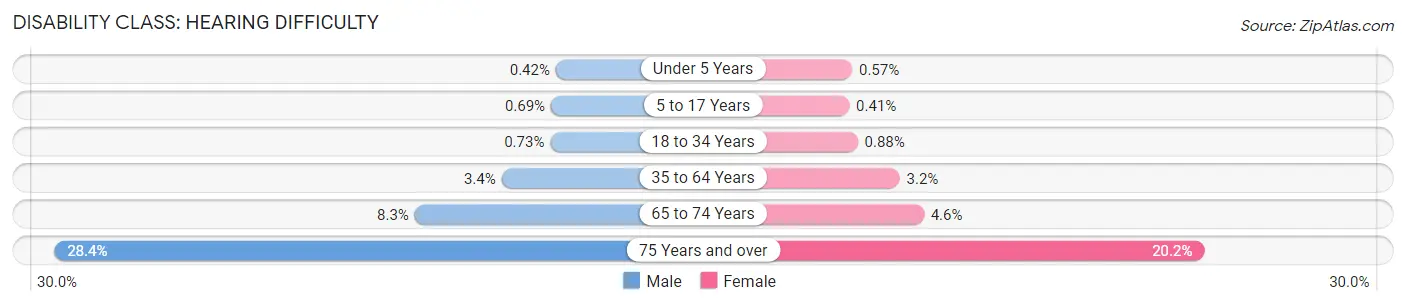
| Age Bracket | Male | Female |
| Under 5 Years | 28 (0.4%) | 36 (0.6%) |
| 5 to 17 Years | 105 (0.7%) | 59 (0.4%) |
| 18 to 34 Years | 155 (0.7%) | 215 (0.9%) |
| 35 to 64 Years | 989 (3.4%) | 1,080 (3.2%) |
| 65 to 74 Years | 522 (8.3%) | 367 (4.6%) |
| 75 Years and over | 1,040 (28.3%) | 1,251 (20.2%) |
Disability Class: Vision Difficulty
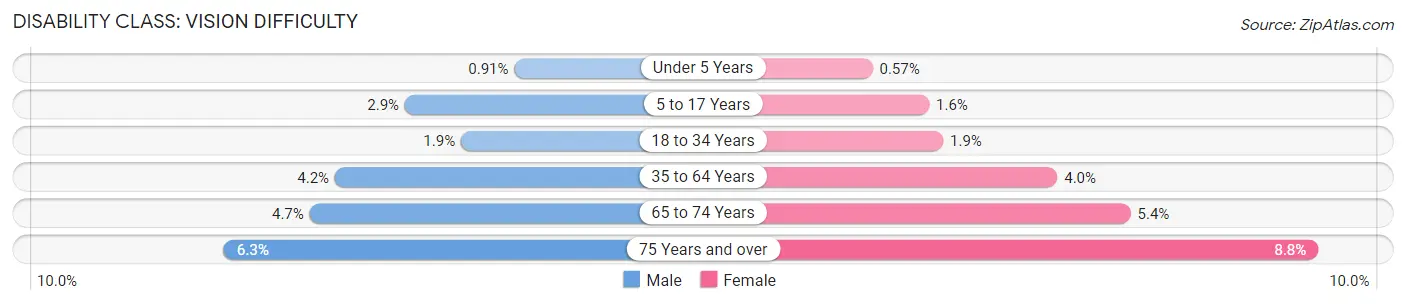
| Age Bracket | Male | Female |
| Under 5 Years | 61 (0.9%) | 36 (0.6%) |
| 5 to 17 Years | 448 (2.9%) | 235 (1.6%) |
| 18 to 34 Years | 403 (1.9%) | 458 (1.9%) |
| 35 to 64 Years | 1,220 (4.2%) | 1,341 (4.0%) |
| 65 to 74 Years | 297 (4.7%) | 432 (5.4%) |
| 75 Years and over | 231 (6.3%) | 548 (8.8%) |
Disability Class: Cognitive Difficulty
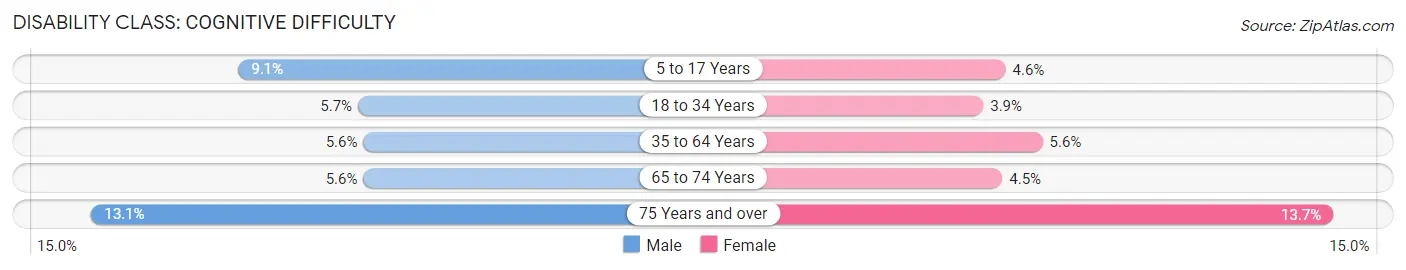
| Age Bracket | Male | Female |
| 5 to 17 Years | 1,380 (9.0%) | 660 (4.6%) |
| 18 to 34 Years | 1,214 (5.7%) | 957 (3.9%) |
| 35 to 64 Years | 1,601 (5.6%) | 1,875 (5.6%) |
| 65 to 74 Years | 351 (5.6%) | 360 (4.5%) |
| 75 Years and over | 482 (13.1%) | 848 (13.7%) |
Disability Class: Ambulatory Difficulty
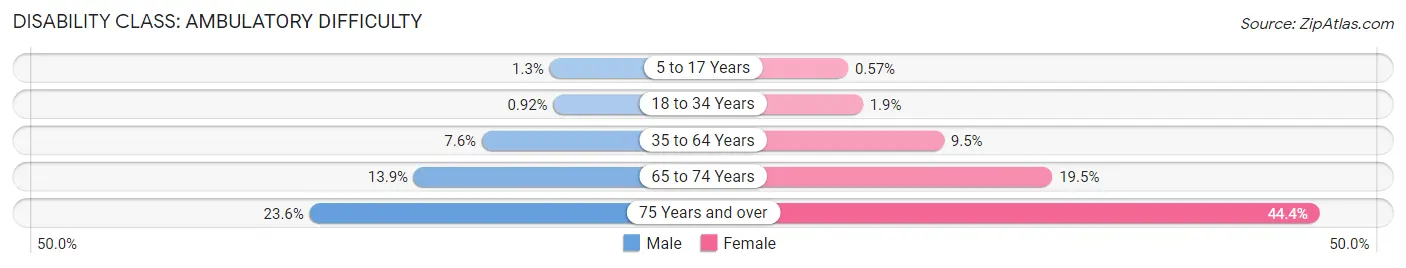
| Age Bracket | Male | Female |
| 5 to 17 Years | 194 (1.3%) | 83 (0.6%) |
| 18 to 34 Years | 196 (0.9%) | 472 (1.9%) |
| 35 to 64 Years | 2,176 (7.6%) | 3,177 (9.5%) |
| 65 to 74 Years | 874 (13.9%) | 1,573 (19.5%) |
| 75 Years and over | 864 (23.5%) | 2,750 (44.4%) |
Disability Class: Self-Care Difficulty
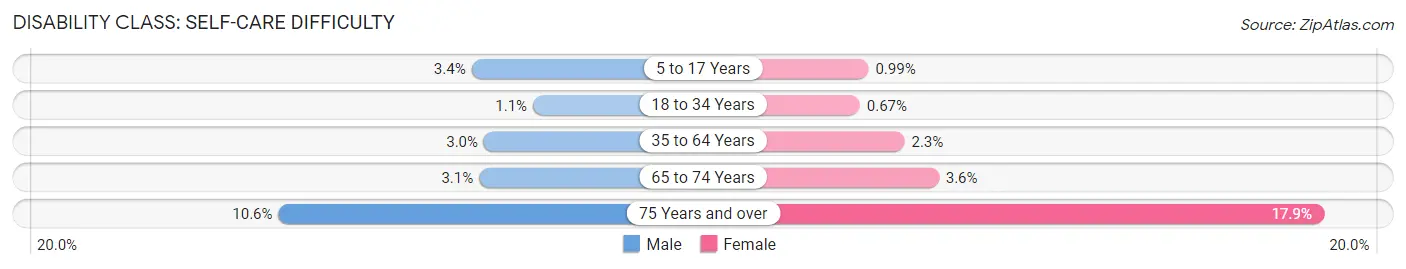
| Age Bracket | Male | Female |
| 5 to 17 Years | 520 (3.4%) | 144 (1.0%) |
| 18 to 34 Years | 240 (1.1%) | 162 (0.7%) |
| 35 to 64 Years | 850 (2.9%) | 781 (2.3%) |
| 65 to 74 Years | 197 (3.1%) | 290 (3.6%) |
| 75 Years and over | 388 (10.6%) | 1,109 (17.9%) |
Technology Access in Newport News
Computing Device Access in Newport News
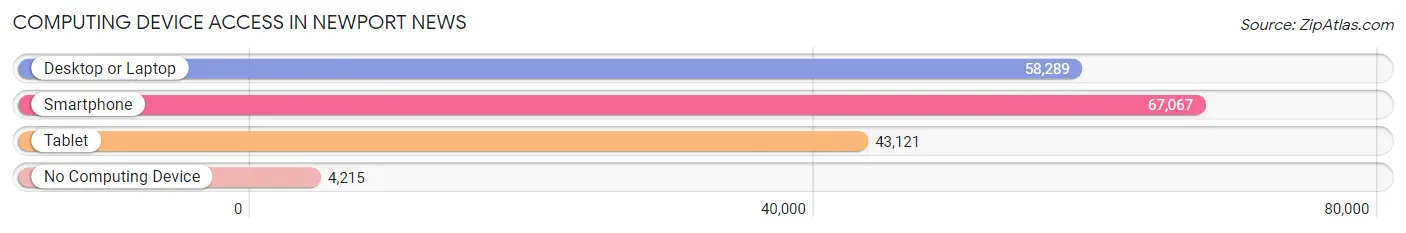
| Device Type | # Households | % Households |
| Desktop or Laptop | 58,289 | 77.2% |
| Smartphone | 67,067 | 88.9% |
| Tablet | 43,121 | 57.1% |
| No Computing Device | 4,215 | 5.6% |
| Total | 75,465 | 100.0% |
Internet Access in Newport News
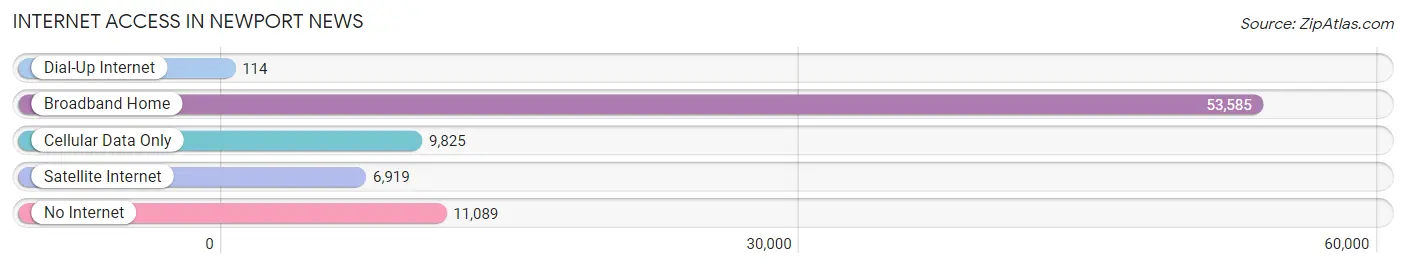
| Internet Type | # Households | % Households |
| Dial-Up Internet | 114 | 0.2% |
| Broadband Home | 53,585 | 71.0% |
| Cellular Data Only | 9,825 | 13.0% |
| Satellite Internet | 6,919 | 9.2% |
| No Internet | 11,089 | 14.7% |
| Total | 75,465 | 100.0% |
Newport News Summary
Newport News is an independent city located in the Hampton Roads region of southeastern Virginia. It is bordered by the cities of Hampton, Yorktown, and Williamsburg, as well as the James River. The city has a population of 180,719 as of the 2019 census, making it the fifth-most populous city in Virginia.
History
The area that is now Newport News was first settled by English colonists in 1619. The city was officially founded in 1855 and incorporated in 1896. It was named after Christopher Newport, an English sea captain who had led the first expedition to the area in 1607.
The city was an important port during the American Civil War, and it was the site of the Battle of Hampton Roads in 1862. After the war, the city experienced a period of rapid growth and industrialization, becoming a major shipbuilding center. During World War II, the city was home to the Newport News Shipbuilding and Drydock Company, which built many of the ships used by the U.S. Navy.
Geography
Newport News is located in southeastern Virginia, at the mouth of the James River. It is bordered by the cities of Hampton, Yorktown, and Williamsburg, as well as the James River. The city covers an area of approximately 75 square miles, with a population density of 2,400 people per square mile.
The city is divided into several distinct neighborhoods, including Denbigh, Hilton Village, and Oyster Point. The city is also home to several parks and recreational areas, including Newport News Park, Huntington Park, and the Mariners' Museum.
Economy
Newport News is home to a diverse economy, with a mix of manufacturing, retail, and service industries. The city is home to several major employers, including Newport News Shipbuilding and Drydock Company, Canon Virginia, and Ferguson Enterprises. The city is also home to several military installations, including Naval Station Norfolk and Langley Air Force Base.
The city's port is an important economic driver, with a variety of cargo and passenger ships passing through each year. The port is also home to several cruise lines, including Carnival Cruise Lines and Royal Caribbean International.
Demographics
As of the 2019 census, the population of Newport News was 180,719. The city has a population that is 57.3% white, 28.2% African American, 8.2% Hispanic or Latino, and 6.3% Asian. The median household income is $54,845, and the median home value is $179,400.
The city is home to several higher education institutions, including Christopher Newport University, Thomas Nelson Community College, and Tidewater Community College. The city is also home to several museums, including the Mariners' Museum and the Virginia War Museum.
Conclusion
Newport News is an independent city located in the Hampton Roads region of southeastern Virginia. It has a rich history, dating back to the early 1600s, and has been an important port city since the American Civil War. The city has a diverse economy, with a mix of manufacturing, retail, and service industries, as well as several military installations. The city has a population of 180,719, with a median household income of $54,845 and a median home value of $179,400. Newport News is home to several higher education institutions, museums, and parks, making it an attractive place to live and work.
Common Questions
What is Per Capita Income in Newport News?
Per Capita income in Newport News is $36,135.
What is the Median Family Income in Newport News?
Median Family Income in Newport News is $77,483.
What is the Median Household income in Newport News?
Median Household Income in Newport News is $63,355.
What is Income or Wage Gap in Newport News?
Income or Wage Gap in Newport News is 31.7%.
Women in Newport News earn 68.3 cents for every dollar earned by a man.
What is Family Income Deficit in Newport News?
Family Income Deficit in Newport News is $11,881.
Families that are below poverty line in Newport News earn $11,881 less on average than the poverty threshold level.
What is Inequality or Gini Index in Newport News?
Inequality or Gini Index in Newport News is 0.46.
What is the Total Population of Newport News?
Total Population of Newport News is 185,118.
What is the Total Male Population of Newport News?
Total Male Population of Newport News is 90,193.
What is the Total Female Population of Newport News?
Total Female Population of Newport News is 94,925.
What is the Ratio of Males per 100 Females in Newport News?
There are 95.02 Males per 100 Females in Newport News.
What is the Ratio of Females per 100 Males in Newport News?
There are 105.25 Females per 100 Males in Newport News.
What is the Median Population Age in Newport News?
Median Population Age in Newport News is 34.1 Years.
What is the Average Family Size in Newport News
Average Family Size in Newport News is 3.1 People.
What is the Average Household Size in Newport News
Average Household Size in Newport News is 2.4 People.
How Large is the Labor Force in Newport News?
There are 98,941 People in the Labor Forcein in Newport News.
What is the Percentage of People in the Labor Force in Newport News?
67.6% of People are in the Labor Force in Newport News.
What is the Unemployment Rate in Newport News?
Unemployment Rate in Newport News is 5.6%.