Front Royal, VA Map & Demographics
Front Royal Map
Front Royal Overview
$30,837
PER CAPITA INCOME
$73,897
AVG FAMILY INCOME
$62,735
AVG HOUSEHOLD INCOME
16.4%
WAGE / INCOME GAP [ % ]
83.6¢/ $1
WAGE / INCOME GAP [ $ ]
0.42
INEQUALITY / GINI INDEX
15,064
TOTAL POPULATION
7,412
MALE POPULATION
7,652
FEMALE POPULATION
96.86
MALES / 100 FEMALES
103.24
FEMALES / 100 MALES
37.7
MEDIAN AGE
3.2
AVG FAMILY SIZE
2.6
AVG HOUSEHOLD SIZE
7,603
LABOR FORCE [ PEOPLE ]
64.5%
PERCENT IN LABOR FORCE
7.5%
UNEMPLOYMENT RATE
Front Royal Zip Codes
Front Royal Area Codes
Income in Front Royal
Income Overview in Front Royal
Per Capita Income in Front Royal is $30,837, while median incomes of families and households are $73,897 and $62,735 respectively.
| Characteristic | Number | Measure |
| Per Capita Income | 15,064 | $30,837 |
| Median Family Income | 3,557 | $73,897 |
| Mean Family Income | 3,557 | $91,258 |
| Median Household Income | 5,750 | $62,735 |
| Mean Household Income | 5,750 | $79,524 |
| Income Deficit | 3,557 | $0 |
| Wage / Income Gap (%) | 15,064 | 16.37% |
| Wage / Income Gap ($) | 15,064 | 83.63¢ per $1 |
| Gini / Inequality Index | 15,064 | 0.42 |
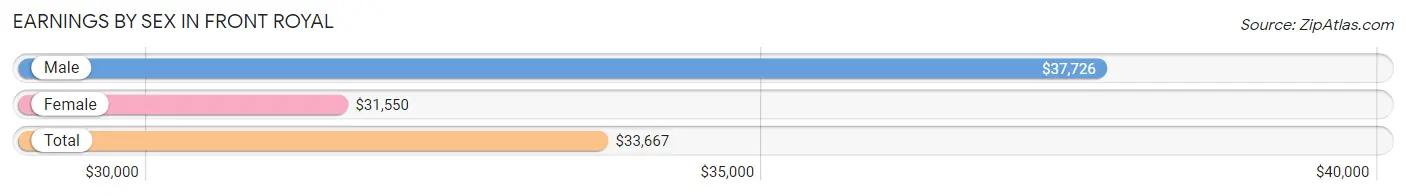
Earnings by Sex in Front Royal
Average Earnings in Front Royal are $33,667, $37,726 for men and $31,550 for women, a difference of 16.4%.
| Sex | Number | Average Earnings |
| Male | 4,201 (52.9%) | $37,726 |
| Female | 3,747 (47.1%) | $31,550 |
| Total | 7,948 (100.0%) | $33,667 |
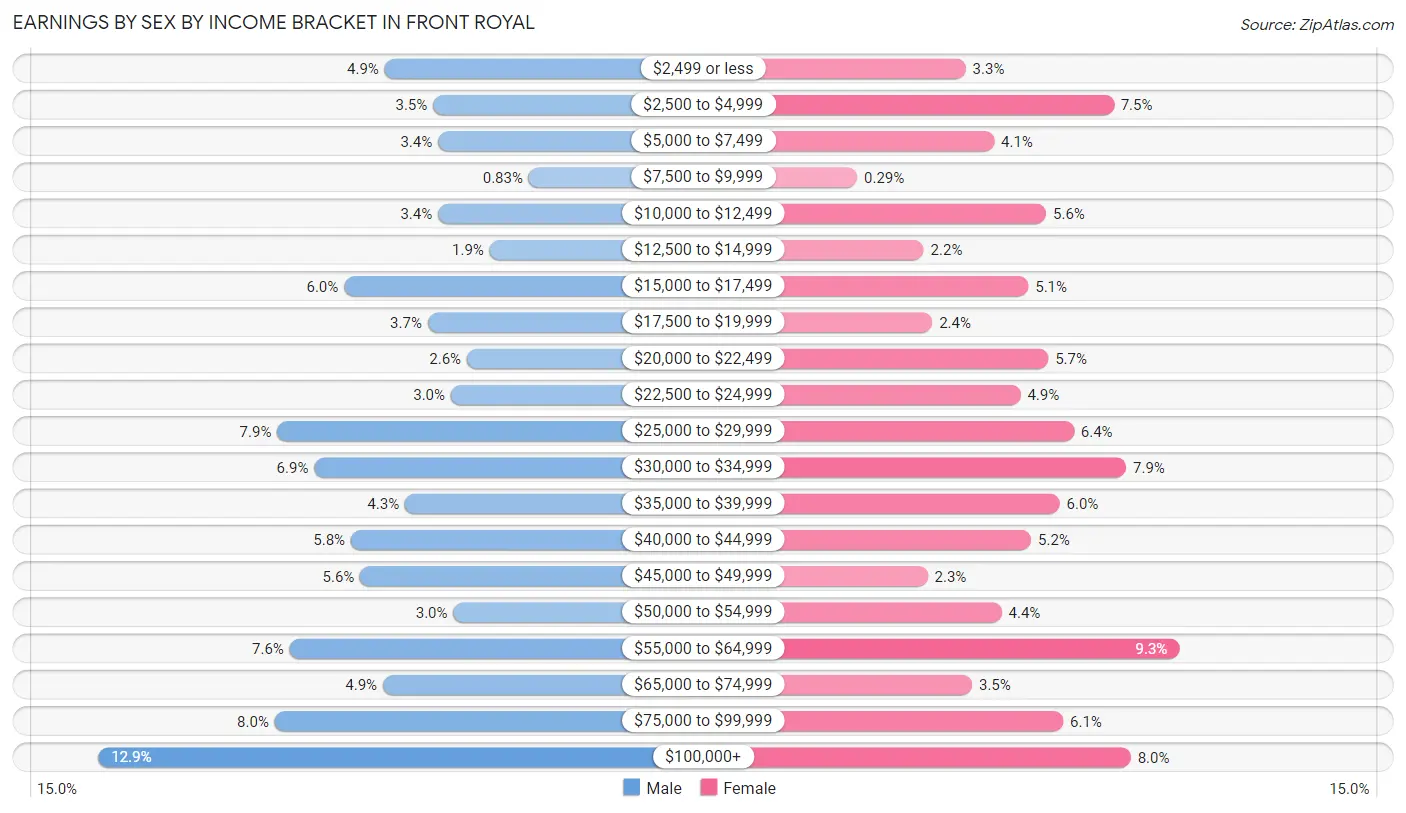
Earnings by Sex by Income Bracket in Front Royal
The most common earnings brackets in Front Royal are $100,000+ for men (543 | 12.9%) and $55,000 to $64,999 for women (350 | 9.3%).
| Income | Male | Female |
| $2,499 or less | 205 (4.9%) | 125 (3.3%) |
| $2,500 to $4,999 | 148 (3.5%) | 281 (7.5%) |
| $5,000 to $7,499 | 142 (3.4%) | 155 (4.1%) |
| $7,500 to $9,999 | 35 (0.8%) | 11 (0.3%) |
| $10,000 to $12,499 | 142 (3.4%) | 210 (5.6%) |
| $12,500 to $14,999 | 81 (1.9%) | 81 (2.2%) |
| $15,000 to $17,499 | 253 (6.0%) | 191 (5.1%) |
| $17,500 to $19,999 | 154 (3.7%) | 90 (2.4%) |
| $20,000 to $22,499 | 108 (2.6%) | 212 (5.7%) |
| $22,500 to $24,999 | 127 (3.0%) | 183 (4.9%) |
| $25,000 to $29,999 | 332 (7.9%) | 239 (6.4%) |
| $30,000 to $34,999 | 288 (6.9%) | 294 (7.9%) |
| $35,000 to $39,999 | 181 (4.3%) | 224 (6.0%) |
| $40,000 to $44,999 | 245 (5.8%) | 194 (5.2%) |
| $45,000 to $49,999 | 234 (5.6%) | 85 (2.3%) |
| $50,000 to $54,999 | 124 (2.9%) | 163 (4.3%) |
| $55,000 to $64,999 | 317 (7.5%) | 350 (9.3%) |
| $65,000 to $74,999 | 207 (4.9%) | 132 (3.5%) |
| $75,000 to $99,999 | 335 (8.0%) | 228 (6.1%) |
| $100,000+ | 543 (12.9%) | 299 (8.0%) |
| Total | 4,201 (100.0%) | 3,747 (100.0%) |
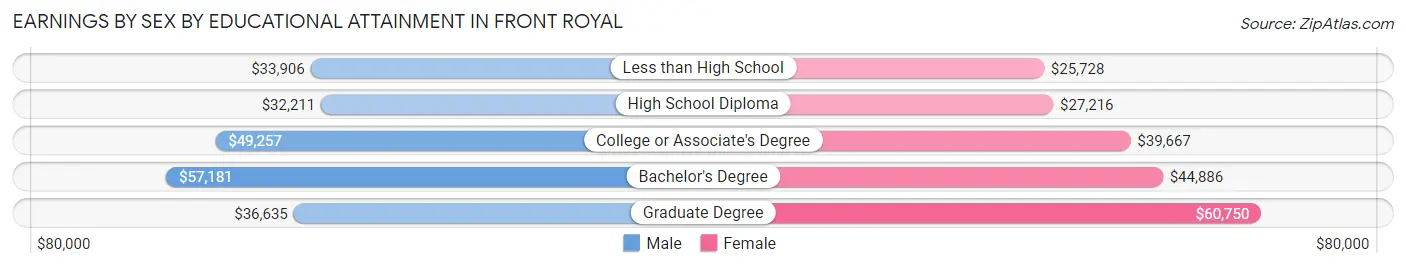
Earnings by Sex by Educational Attainment in Front Royal
Average earnings in Front Royal are $42,645 for men and $35,649 for women, a difference of 16.4%. Men with an educational attainment of bachelor's degree enjoy the highest average annual earnings of $57,181, while those with high school diploma education earn the least with $32,211. Women with an educational attainment of graduate degree earn the most with the average annual earnings of $60,750, while those with less than high school education have the smallest earnings of $25,728.
| Educational Attainment | Male Income | Female Income |
| Less than High School | $33,906 | $25,728 |
| High School Diploma | $32,211 | $27,216 |
| College or Associate's Degree | $49,257 | $39,667 |
| Bachelor's Degree | $57,181 | $44,886 |
| Graduate Degree | $36,635 | $60,750 |
| Total | $42,645 | $35,649 |
Family Income in Front Royal
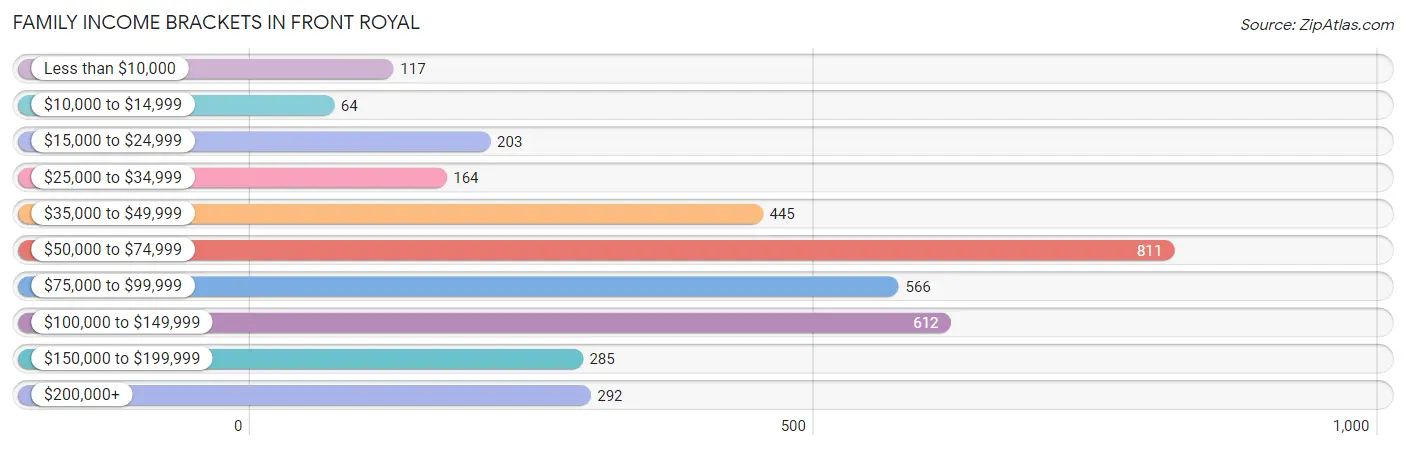
Family Income Brackets in Front Royal
According to the Front Royal family income data, there are 811 families falling into the $50,000 to $74,999 income range, which is the most common income bracket and makes up 22.8% of all families. Conversely, the $10,000 to $14,999 income bracket is the least frequent group with only 64 families (1.8%) belonging to this category.
| Income Bracket | # Families | % Families |
| Less than $10,000 | 117 | 3.3% |
| $10,000 to $14,999 | 64 | 1.8% |
| $15,000 to $24,999 | 203 | 5.7% |
| $25,000 to $34,999 | 164 | 4.6% |
| $35,000 to $49,999 | 445 | 12.5% |
| $50,000 to $74,999 | 811 | 22.8% |
| $75,000 to $99,999 | 566 | 15.9% |
| $100,000 to $149,999 | 612 | 17.2% |
| $150,000 to $199,999 | 285 | 8.0% |
| $200,000+ | 292 | 8.2% |
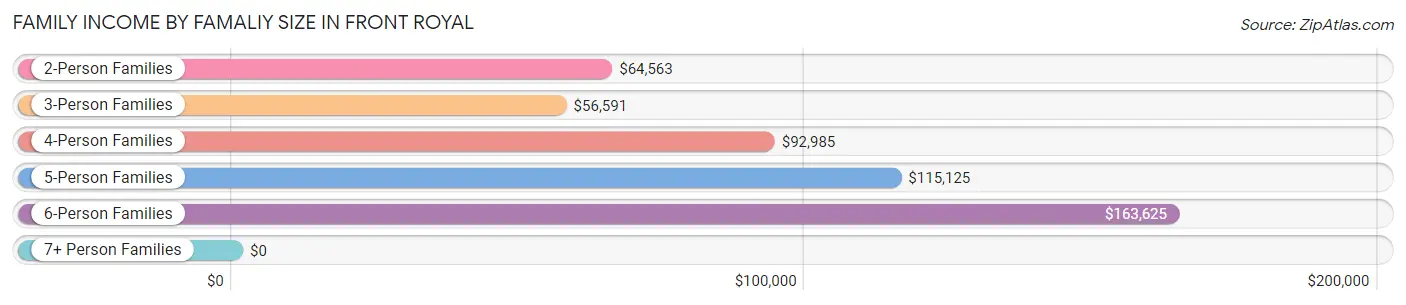
Family Income by Famaliy Size in Front Royal
6-person families (240 | 6.8%) account for the highest median family income in Front Royal with $163,625 per family, while 2-person families (1,373 | 38.6%) have the highest median income of $32,282 per family member.
| Income Bracket | # Families | Median Income |
| 2-Person Families | 1,373 (38.6%) | $64,563 |
| 3-Person Families | 1,116 (31.4%) | $56,591 |
| 4-Person Families | 511 (14.4%) | $92,985 |
| 5-Person Families | 265 (7.4%) | $115,125 |
| 6-Person Families | 240 (6.8%) | $163,625 |
| 7+ Person Families | 52 (1.5%) | $0 |
| Total | 3,557 (100.0%) | $73,897 |
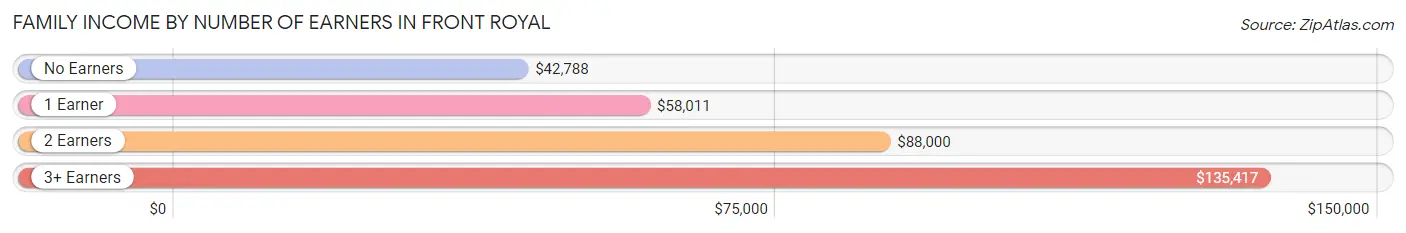
Family Income by Number of Earners in Front Royal
The median family income in Front Royal is $73,897, with families comprising 3+ earners (469) having the highest median family income of $135,417, while families with no earners (481) have the lowest median family income of $42,788, accounting for 13.2% and 13.5% of families, respectively.
| Number of Earners | # Families | Median Income |
| No Earners | 481 (13.5%) | $42,788 |
| 1 Earner | 1,267 (35.6%) | $58,011 |
| 2 Earners | 1,340 (37.7%) | $88,000 |
| 3+ Earners | 469 (13.2%) | $135,417 |
| Total | 3,557 (100.0%) | $73,897 |
Household Income in Front Royal
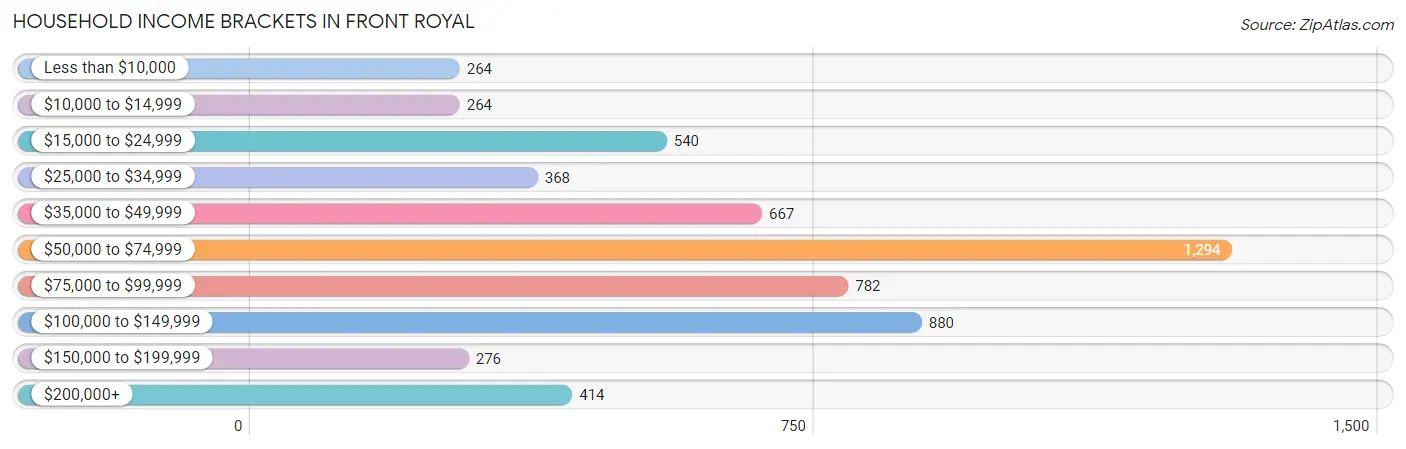
Household Income Brackets in Front Royal
With 1,294 households falling in the category, the $50,000 to $74,999 income range is the most frequent in Front Royal, accounting for 22.5% of all households. In contrast, only 264 households (4.6%) fall into the less than $10,000 income bracket, making it the least populous group.
| Income Bracket | # Households | % Households |
| Less than $10,000 | 264 | 4.6% |
| $10,000 to $14,999 | 264 | 4.6% |
| $15,000 to $24,999 | 540 | 9.4% |
| $25,000 to $34,999 | 368 | 6.4% |
| $35,000 to $49,999 | 667 | 11.6% |
| $50,000 to $74,999 | 1,294 | 22.5% |
| $75,000 to $99,999 | 782 | 13.6% |
| $100,000 to $149,999 | 880 | 15.3% |
| $150,000 to $199,999 | 276 | 4.8% |
| $200,000+ | 414 | 7.2% |
Household Income by Householder Age in Front Royal
The median household income in Front Royal is $62,735, with the highest median household income of $73,600 found in the 45 to 64 years age bracket for the primary householder. A total of 2,344 households (40.8%) fall into this category. Meanwhile, the 15 to 24 years age bracket for the primary householder has the lowest median household income of $46,154, with 110 households (1.9%) in this group.
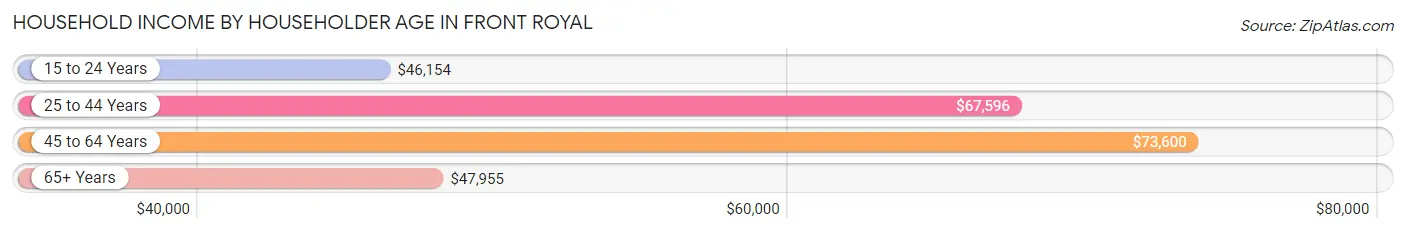
| Income Bracket | # Households | Median Income |
| 15 to 24 Years | 110 (1.9%) | $46,154 |
| 25 to 44 Years | 1,780 (31.0%) | $67,596 |
| 45 to 64 Years | 2,344 (40.8%) | $73,600 |
| 65+ Years | 1,516 (26.4%) | $47,955 |
| Total | 5,750 (100.0%) | $62,735 |
Poverty in Front Royal
Income Below Poverty by Sex and Age in Front Royal
With 14.6% poverty level for males and 16.3% for females among the residents of Front Royal, 15 year old males and 16 and 17 year old females are the most vulnerable to poverty, with 44 males (72.1%) and 40 females (48.8%) in their respective age groups living below the poverty level.
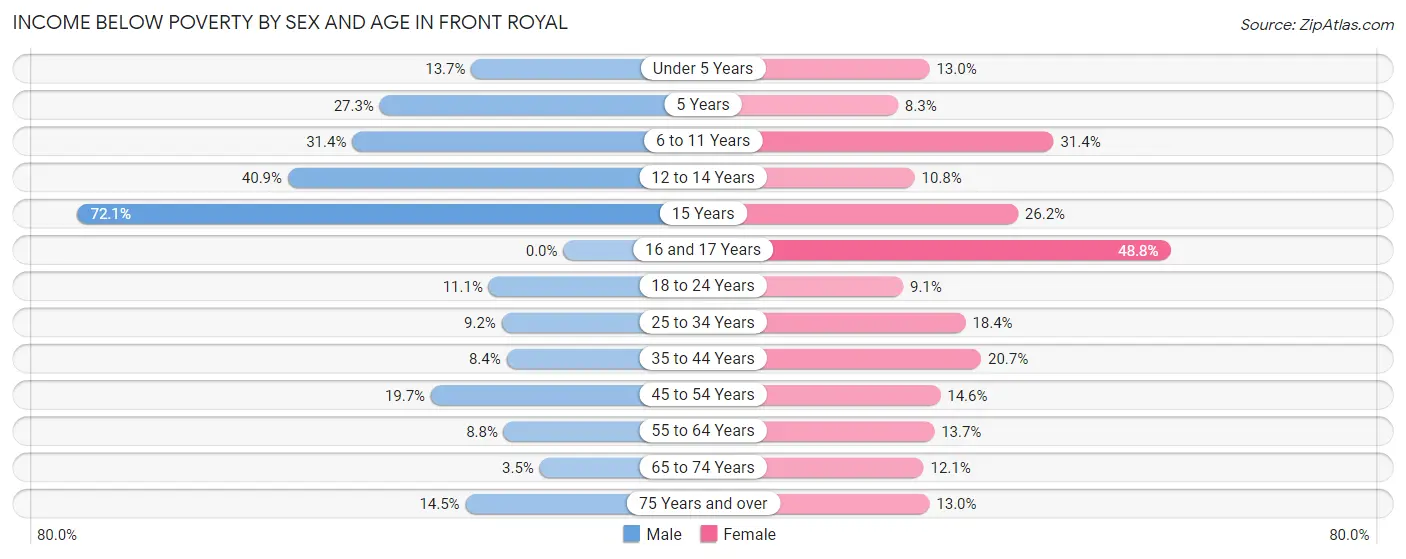
| Age Bracket | Male | Female |
| Under 5 Years | 60 (13.7%) | 59 (13.0%) |
| 5 Years | 36 (27.3%) | 6 (8.3%) |
| 6 to 11 Years | 279 (31.4%) | 149 (31.4%) |
| 12 to 14 Years | 99 (40.9%) | 32 (10.8%) |
| 15 Years | 44 (72.1%) | 17 (26.2%) |
| 16 and 17 Years | 0 (0.0%) | 40 (48.8%) |
| 18 to 24 Years | 45 (11.1%) | 52 (9.1%) |
| 25 to 34 Years | 88 (9.2%) | 233 (18.4%) |
| 35 to 44 Years | 81 (8.4%) | 196 (20.7%) |
| 45 to 54 Years | 152 (19.7%) | 102 (14.6%) |
| 55 to 64 Years | 99 (8.8%) | 164 (13.7%) |
| 65 to 74 Years | 26 (3.5%) | 92 (12.1%) |
| 75 Years and over | 57 (14.5%) | 72 (13.0%) |
| Total | 1,066 (14.6%) | 1,214 (16.3%) |
Income Above Poverty by Sex and Age in Front Royal
According to the poverty statistics in Front Royal, males aged 16 and 17 years and females aged 5 years are the age groups that are most secure financially, with 100.0% of males and 91.7% of females in these age groups living above the poverty line.
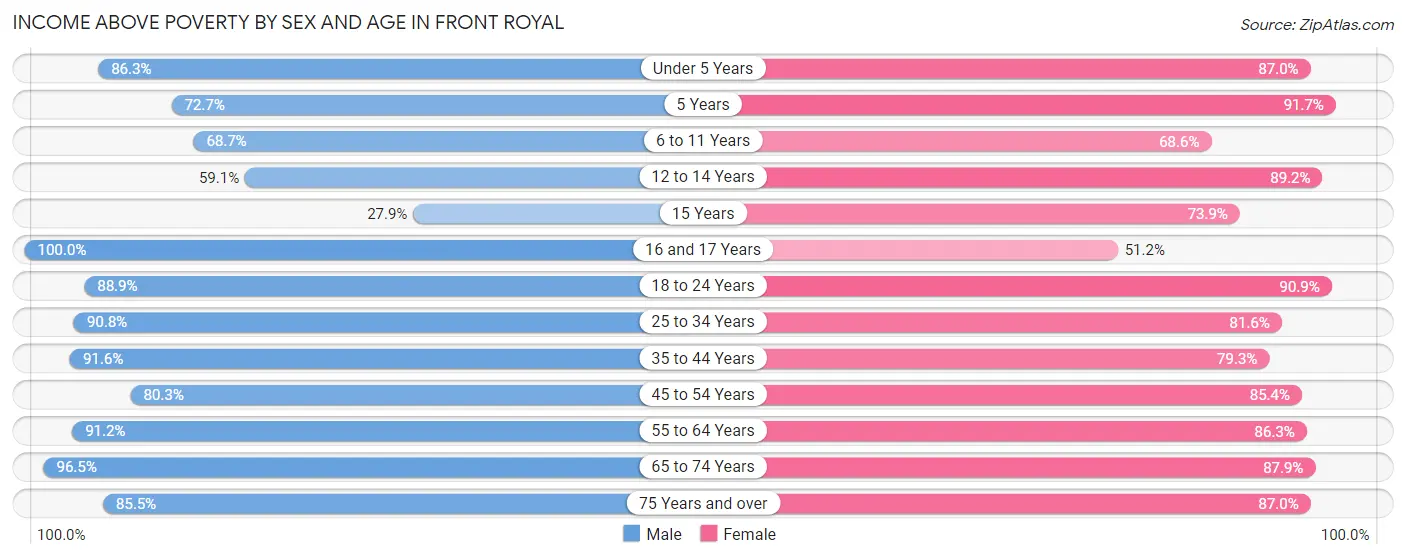
| Age Bracket | Male | Female |
| Under 5 Years | 379 (86.3%) | 394 (87.0%) |
| 5 Years | 96 (72.7%) | 66 (91.7%) |
| 6 to 11 Years | 611 (68.6%) | 325 (68.6%) |
| 12 to 14 Years | 143 (59.1%) | 264 (89.2%) |
| 15 Years | 17 (27.9%) | 48 (73.9%) |
| 16 and 17 Years | 171 (100.0%) | 42 (51.2%) |
| 18 to 24 Years | 361 (88.9%) | 520 (90.9%) |
| 25 to 34 Years | 873 (90.8%) | 1,036 (81.6%) |
| 35 to 44 Years | 880 (91.6%) | 752 (79.3%) |
| 45 to 54 Years | 621 (80.3%) | 595 (85.4%) |
| 55 to 64 Years | 1,021 (91.2%) | 1,031 (86.3%) |
| 65 to 74 Years | 712 (96.5%) | 666 (87.9%) |
| 75 Years and over | 335 (85.5%) | 482 (87.0%) |
| Total | 6,220 (85.4%) | 6,221 (83.7%) |
Income Below Poverty Among Married-Couple Families in Front Royal
The poverty statistics for married-couple families in Front Royal show that 5.2% or 125 of the total 2,392 families live below the poverty line. Families with 5 or more children have the highest poverty rate of 82.4%, comprising of 28 families. On the other hand, families with 1 or 2 children have the lowest poverty rate of 0.5%, which includes 4 families.
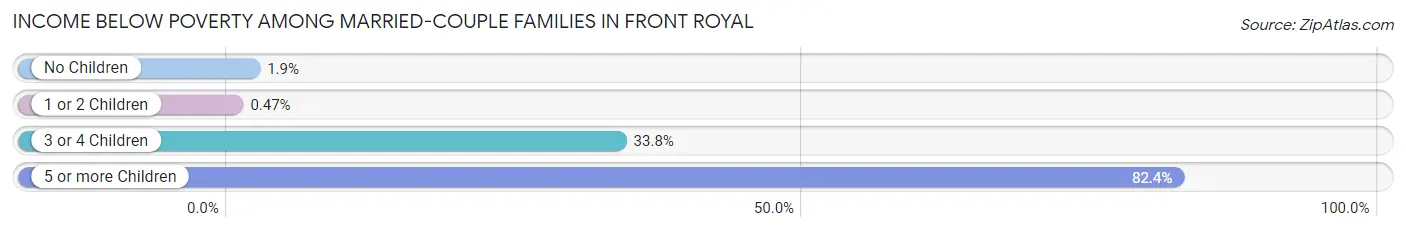
| Children | Above Poverty | Below Poverty |
| No Children | 1,273 (98.1%) | 25 (1.9%) |
| 1 or 2 Children | 855 (99.5%) | 4 (0.5%) |
| 3 or 4 Children | 133 (66.2%) | 68 (33.8%) |
| 5 or more Children | 6 (17.6%) | 28 (82.4%) |
| Total | 2,267 (94.8%) | 125 (5.2%) |
Income Below Poverty Among Single-Parent Households in Front Royal
According to the poverty data in Front Royal, 6.3% or 27 single-father households and 35.6% or 261 single-mother households are living below the poverty line. Among single-father households, those with 1 or 2 children have the highest poverty rate, with 27 households (12.9%) experiencing poverty. Likewise, among single-mother households, those with 1 or 2 children have the highest poverty rate, with 187 households (46.1%) falling below the poverty line.
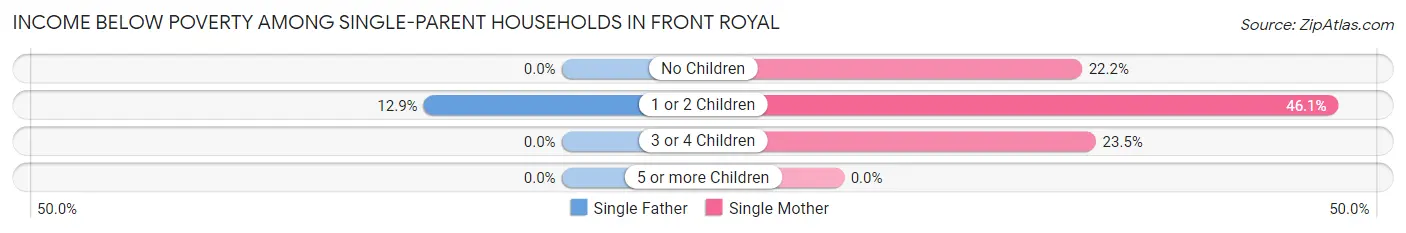
| Children | Single Father | Single Mother |
| No Children | 0 (0.0%) | 51 (22.2%) |
| 1 or 2 Children | 27 (12.9%) | 187 (46.1%) |
| 3 or 4 Children | 0 (0.0%) | 23 (23.5%) |
| 5 or more Children | 0 (0.0%) | 0 (0.0%) |
| Total | 27 (6.3%) | 261 (35.6%) |
Income Below Poverty Among Married-Couple vs Single-Parent Households in Front Royal
The poverty data for Front Royal shows that 125 of the married-couple family households (5.2%) and 288 of the single-parent households (24.7%) are living below the poverty level. Within the married-couple family households, those with 5 or more children have the highest poverty rate, with 28 households (82.4%) falling below the poverty line. Among the single-parent households, those with 1 or 2 children have the highest poverty rate, with 214 household (34.7%) living below poverty.
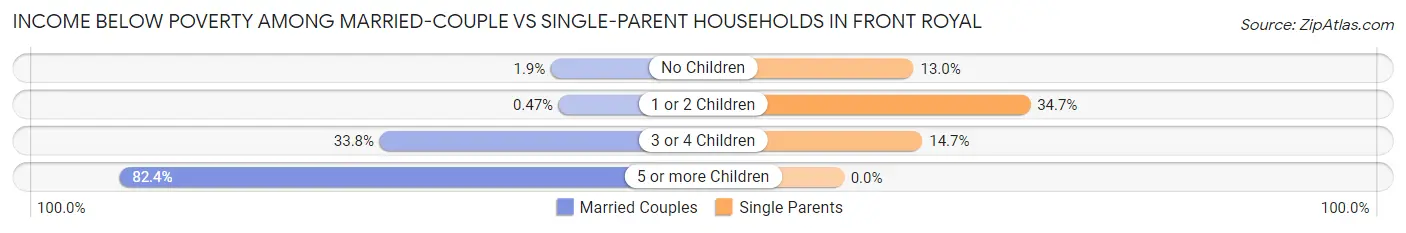
| Children | Married-Couple Families | Single-Parent Households |
| No Children | 25 (1.9%) | 51 (13.0%) |
| 1 or 2 Children | 4 (0.5%) | 214 (34.7%) |
| 3 or 4 Children | 68 (33.8%) | 23 (14.6%) |
| 5 or more Children | 28 (82.4%) | 0 (0.0%) |
| Total | 125 (5.2%) | 288 (24.7%) |
Race in Front Royal
The most populous races in Front Royal are White / Caucasian (11,293 | 75.0%), Black / African American (1,503 | 10.0%), and Hispanic or Latino (1,400 | 9.3%).
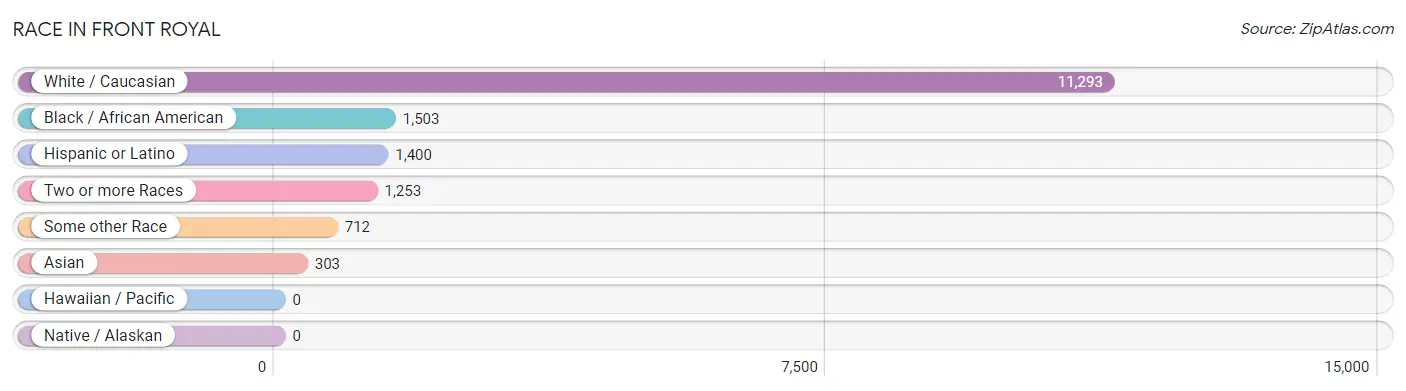
| Race | # Population | % Population |
| Asian | 303 | 2.0% |
| Black / African American | 1,503 | 10.0% |
| Hawaiian / Pacific | 0 | 0.0% |
| Hispanic or Latino | 1,400 | 9.3% |
| Native / Alaskan | 0 | 0.0% |
| White / Caucasian | 11,293 | 75.0% |
| Two or more Races | 1,253 | 8.3% |
| Some other Race | 712 | 4.7% |
| Total | 15,064 | 100.0% |
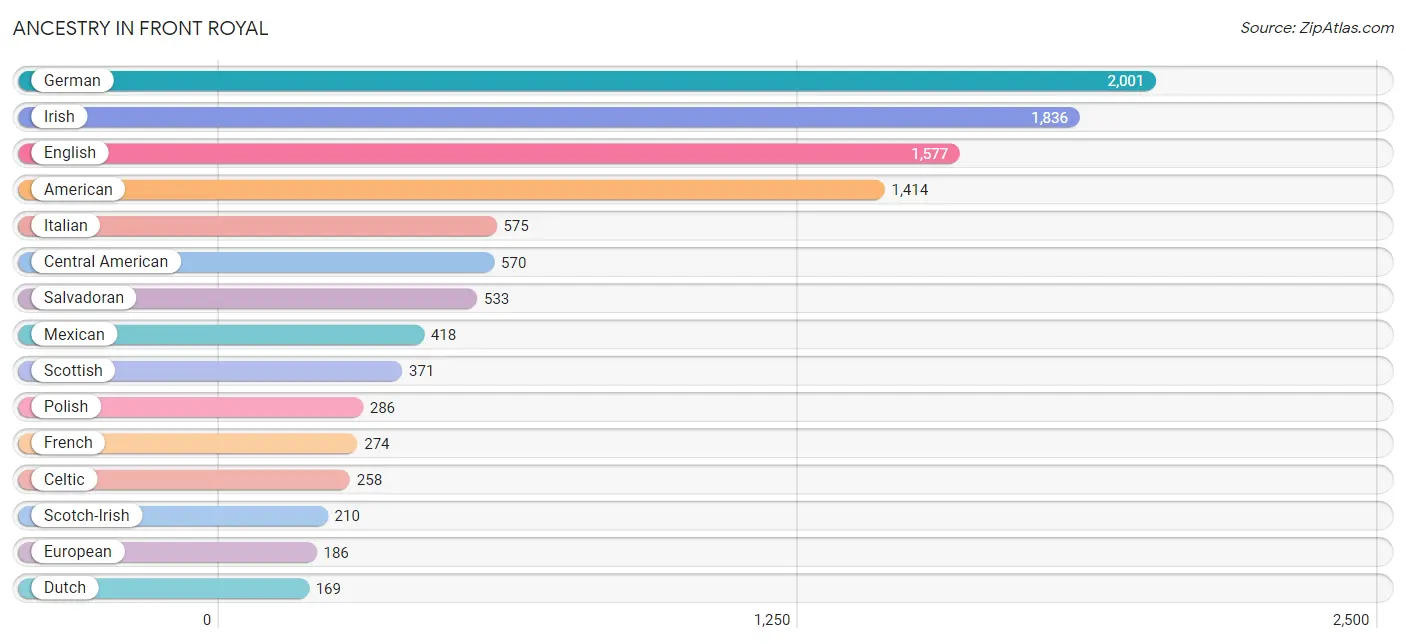
Ancestry in Front Royal
The most populous ancestries reported in Front Royal are German (2,001 | 13.3%), Irish (1,836 | 12.2%), English (1,577 | 10.5%), American (1,414 | 9.4%), and Italian (575 | 3.8%), together accounting for 49.1% of all Front Royal residents.
| Ancestry | # Population | % Population |
| African | 82 | 0.5% |
| Albanian | 4 | 0.0% |
| American | 1,414 | 9.4% |
| Australian | 44 | 0.3% |
| Austrian | 17 | 0.1% |
| Belgian | 11 | 0.1% |
| Bhutanese | 59 | 0.4% |
| British | 18 | 0.1% |
| Burmese | 24 | 0.2% |
| Celtic | 258 | 1.7% |
| Central American | 570 | 3.8% |
| Central American Indian | 60 | 0.4% |
| Cherokee | 155 | 1.0% |
| Chickasaw | 38 | 0.3% |
| Cuban | 29 | 0.2% |
| Czechoslovakian | 19 | 0.1% |
| Danish | 5 | 0.0% |
| Dutch | 169 | 1.1% |
| Eastern European | 37 | 0.3% |
| English | 1,577 | 10.5% |
| European | 186 | 1.2% |
| French | 274 | 1.8% |
| French Canadian | 31 | 0.2% |
| German | 2,001 | 13.3% |
| Greek | 32 | 0.2% |
| Hungarian | 115 | 0.8% |
| Irish | 1,836 | 12.2% |
| Italian | 575 | 3.8% |
| Jamaican | 38 | 0.3% |
| Korean | 91 | 0.6% |
| Lithuanian | 27 | 0.2% |
| Mexican | 418 | 2.8% |
| Native Hawaiian | 23 | 0.2% |
| Northern European | 14 | 0.1% |
| Norwegian | 31 | 0.2% |
| Pakistani | 16 | 0.1% |
| Panamanian | 37 | 0.3% |
| Peruvian | 140 | 0.9% |
| Polish | 286 | 1.9% |
| Portuguese | 31 | 0.2% |
| Puerto Rican | 95 | 0.6% |
| Russian | 44 | 0.3% |
| Salvadoran | 533 | 3.5% |
| Scandinavian | 125 | 0.8% |
| Scotch-Irish | 210 | 1.4% |
| Scottish | 371 | 2.5% |
| Slovak | 45 | 0.3% |
| South American | 140 | 0.9% |
| Spaniard | 10 | 0.1% |
| Spanish | 67 | 0.4% |
| Sri Lankan | 7 | 0.1% |
| Subsaharan African | 82 | 0.5% |
| Swedish | 169 | 1.1% |
| Swiss | 22 | 0.2% |
| Thai | 7 | 0.1% |
| Ukrainian | 5 | 0.0% |
| Welsh | 22 | 0.2% | View All 57 Rows |
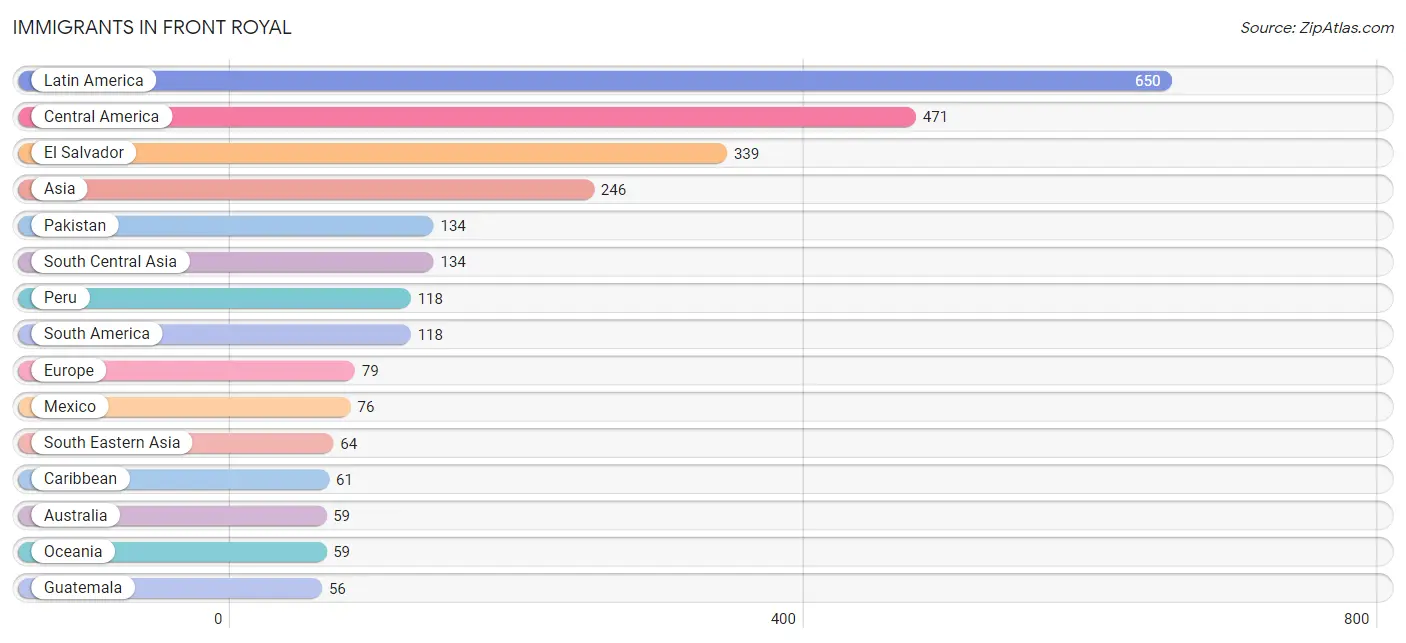
Immigrants in Front Royal
The most numerous immigrant groups reported in Front Royal came from Latin America (650 | 4.3%), Central America (471 | 3.1%), El Salvador (339 | 2.2%), Asia (246 | 1.6%), and Pakistan (134 | 0.9%), together accounting for 12.2% of all Front Royal residents.
| Immigration Origin | # Population | % Population |
| Asia | 246 | 1.6% |
| Australia | 59 | 0.4% |
| Caribbean | 61 | 0.4% |
| Central America | 471 | 3.1% |
| Cuba | 12 | 0.1% |
| Eastern Asia | 48 | 0.3% |
| El Salvador | 339 | 2.2% |
| Europe | 79 | 0.5% |
| Germany | 5 | 0.0% |
| Guatemala | 56 | 0.4% |
| Indonesia | 9 | 0.1% |
| Ireland | 18 | 0.1% |
| Jamaica | 49 | 0.3% |
| Japan | 40 | 0.3% |
| Korea | 8 | 0.1% |
| Latin America | 650 | 4.3% |
| Mexico | 76 | 0.5% |
| Netherlands | 19 | 0.1% |
| Northern Europe | 45 | 0.3% |
| Oceania | 59 | 0.4% |
| Pakistan | 134 | 0.9% |
| Peru | 118 | 0.8% |
| Philippines | 33 | 0.2% |
| South America | 118 | 0.8% |
| South Central Asia | 134 | 0.9% |
| South Eastern Asia | 64 | 0.4% |
| Southern Europe | 10 | 0.1% |
| Spain | 10 | 0.1% |
| Sweden | 27 | 0.2% |
| Thailand | 16 | 0.1% |
| Vietnam | 6 | 0.0% |
| Western Europe | 24 | 0.2% | View All 32 Rows |
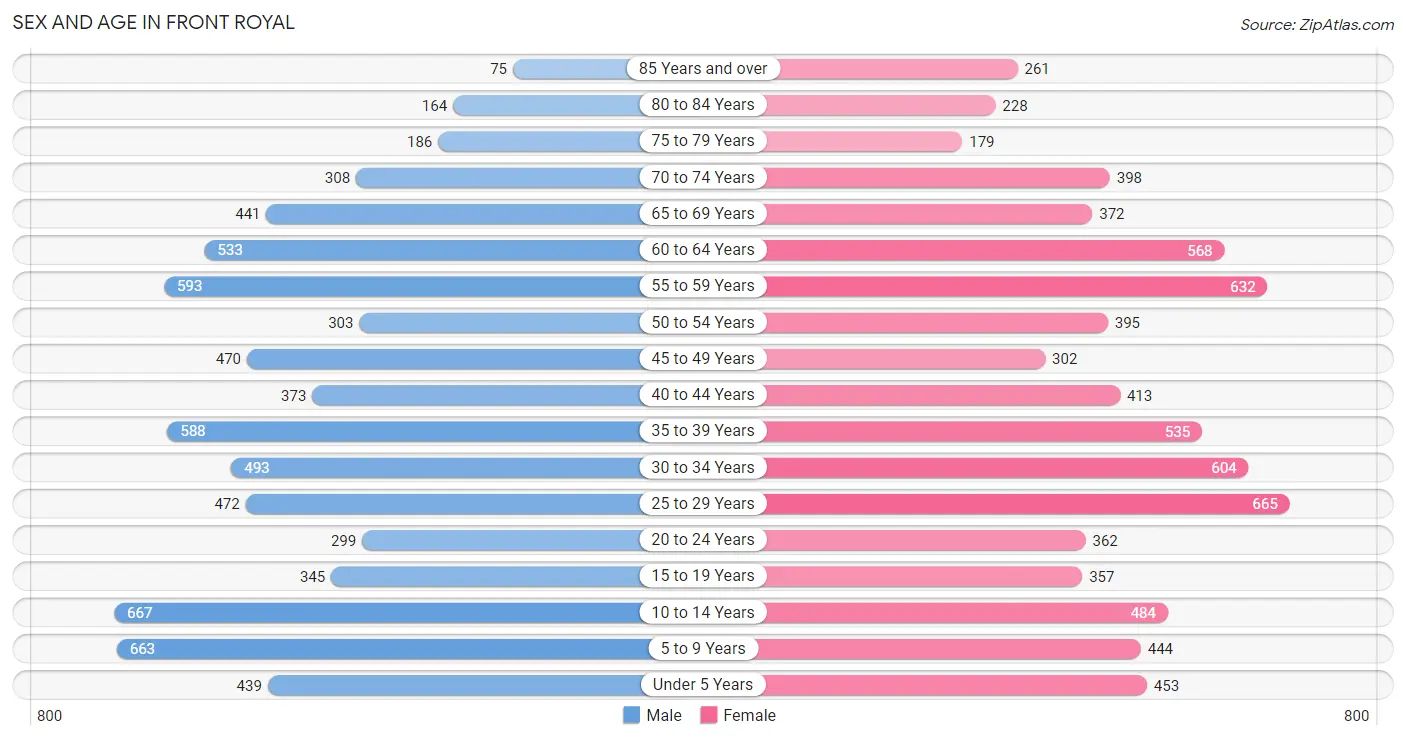
Sex and Age in Front Royal
Sex and Age in Front Royal
The most populous age groups in Front Royal are 10 to 14 Years (667 | 9.0%) for men and 25 to 29 Years (665 | 8.7%) for women.
| Age Bracket | Male | Female |
| Under 5 Years | 439 (5.9%) | 453 (5.9%) |
| 5 to 9 Years | 663 (8.9%) | 444 (5.8%) |
| 10 to 14 Years | 667 (9.0%) | 484 (6.3%) |
| 15 to 19 Years | 345 (4.6%) | 357 (4.7%) |
| 20 to 24 Years | 299 (4.0%) | 362 (4.7%) |
| 25 to 29 Years | 472 (6.4%) | 665 (8.7%) |
| 30 to 34 Years | 493 (6.7%) | 604 (7.9%) |
| 35 to 39 Years | 588 (7.9%) | 535 (7.0%) |
| 40 to 44 Years | 373 (5.0%) | 413 (5.4%) |
| 45 to 49 Years | 470 (6.3%) | 302 (4.0%) |
| 50 to 54 Years | 303 (4.1%) | 395 (5.2%) |
| 55 to 59 Years | 593 (8.0%) | 632 (8.3%) |
| 60 to 64 Years | 533 (7.2%) | 568 (7.4%) |
| 65 to 69 Years | 441 (5.9%) | 372 (4.9%) |
| 70 to 74 Years | 308 (4.2%) | 398 (5.2%) |
| 75 to 79 Years | 186 (2.5%) | 179 (2.3%) |
| 80 to 84 Years | 164 (2.2%) | 228 (3.0%) |
| 85 Years and over | 75 (1.0%) | 261 (3.4%) |
| Total | 7,412 (100.0%) | 7,652 (100.0%) |
Families and Households in Front Royal
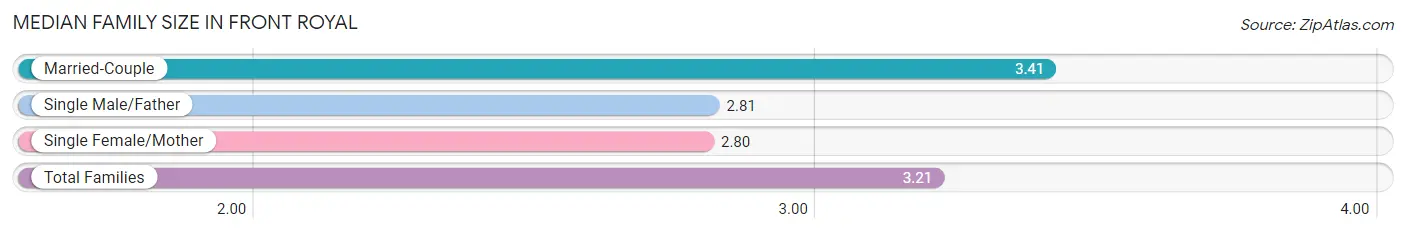
Median Family Size in Front Royal
The median family size in Front Royal is 3.21 persons per family, with married-couple families (2,392 | 67.2%) accounting for the largest median family size of 3.41 persons per family. On the other hand, single female/mother families (734 | 20.6%) represent the smallest median family size with 2.80 persons per family.
| Family Type | # Families | Family Size |
| Married-Couple | 2,392 (67.2%) | 3.41 |
| Single Male/Father | 431 (12.1%) | 2.81 |
| Single Female/Mother | 734 (20.6%) | 2.80 |
| Total Families | 3,557 (100.0%) | 3.21 |
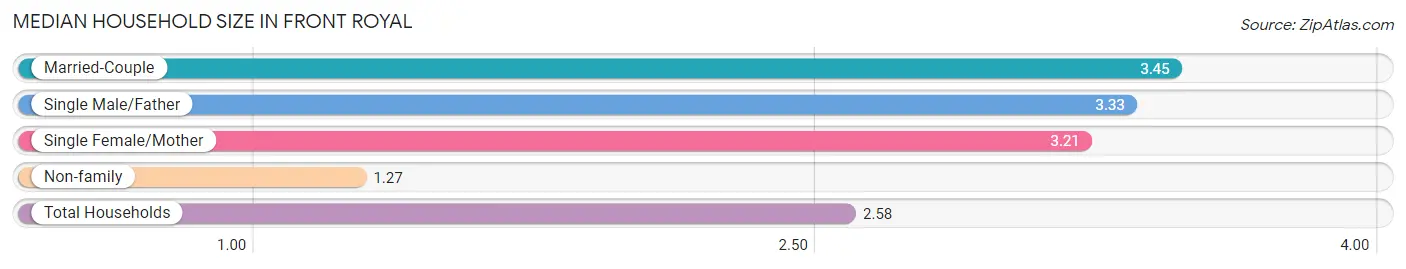
Median Household Size in Front Royal
The median household size in Front Royal is 2.58 persons per household, with married-couple households (2,392 | 41.6%) accounting for the largest median household size of 3.45 persons per household. non-family households (2,193 | 38.1%) represent the smallest median household size with 1.27 persons per household.
| Household Type | # Households | Household Size |
| Married-Couple | 2,392 (41.6%) | 3.45 |
| Single Male/Father | 431 (7.5%) | 3.33 |
| Single Female/Mother | 734 (12.8%) | 3.21 |
| Non-family | 2,193 (38.1%) | 1.27 |
| Total Households | 5,750 (100.0%) | 2.58 |
Household Size by Marriage Status in Front Royal
Out of a total of 5,750 households in Front Royal, 3,557 (61.9%) are family households, while 2,193 (38.1%) are nonfamily households. The most numerous type of family households are 3-person households, comprising 1,192, and the most common type of nonfamily households are 1-person households, comprising 1,678.
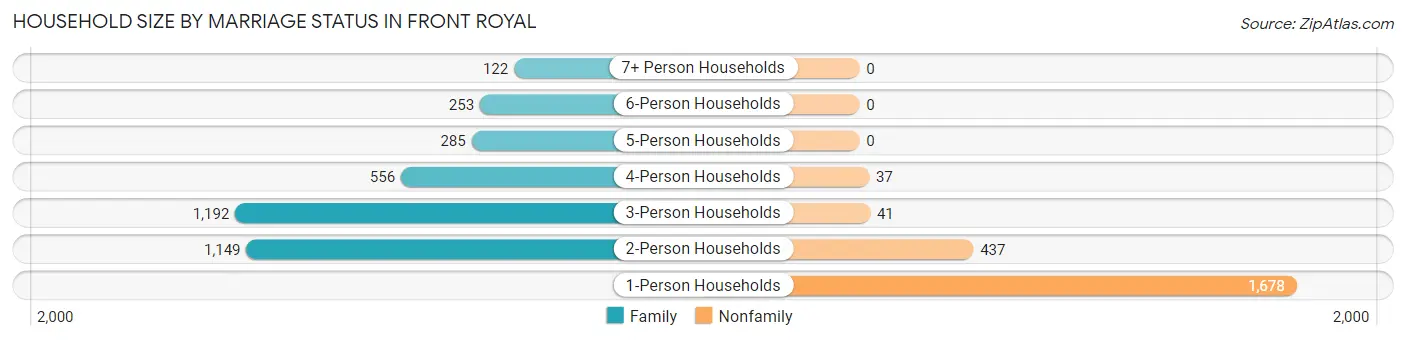
| Household Size | Family Households | Nonfamily Households |
| 1-Person Households | - | 1,678 (29.2%) |
| 2-Person Households | 1,149 (20.0%) | 437 (7.6%) |
| 3-Person Households | 1,192 (20.7%) | 41 (0.7%) |
| 4-Person Households | 556 (9.7%) | 37 (0.6%) |
| 5-Person Households | 285 (5.0%) | 0 (0.0%) |
| 6-Person Households | 253 (4.4%) | 0 (0.0%) |
| 7+ Person Households | 122 (2.1%) | 0 (0.0%) |
| Total | 3,557 (61.9%) | 2,193 (38.1%) |
Female Fertility in Front Royal
Fertility by Age in Front Royal
Average fertility rate in Front Royal is 77.0 births per 1,000 women. Women in the age bracket of 20 to 34 years have the highest fertility rate with 130.0 births per 1,000 women. Women in the age bracket of 20 to 34 years acount for 82.5% of all women with births.
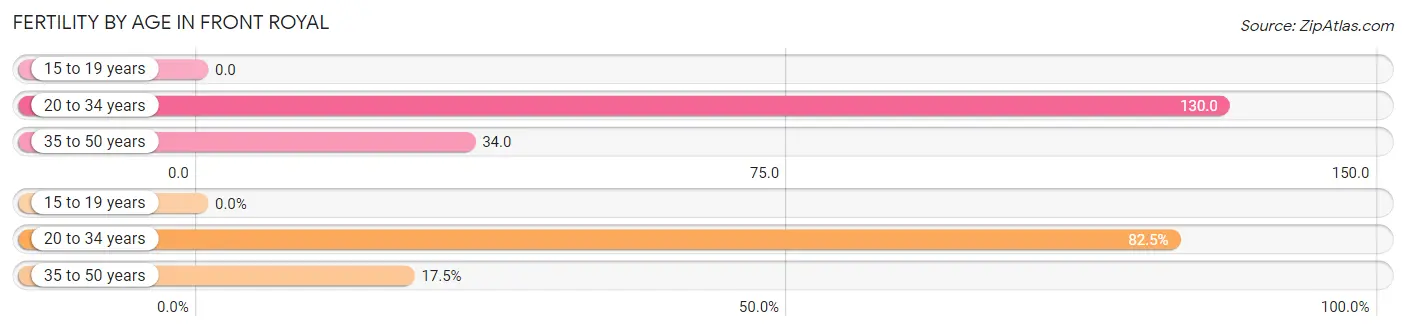
| Age Bracket | Women with Births | Births / 1,000 Women |
| 15 to 19 years | 0 (0.0%) | 0.0 |
| 20 to 34 years | 212 (82.5%) | 130.0 |
| 35 to 50 years | 45 (17.5%) | 34.0 |
| Total | 257 (100.0%) | 77.0 |
Fertility by Age by Marriage Status in Front Royal
85.2% of women with births (257) in Front Royal are married. The highest percentage of unmarried women with births falls into 20 to 34 years age bracket with 15.6% of them unmarried at the time of birth, while the lowest percentage of unmarried women with births belong to 35 to 50 years age bracket with 11.1% of them unmarried.
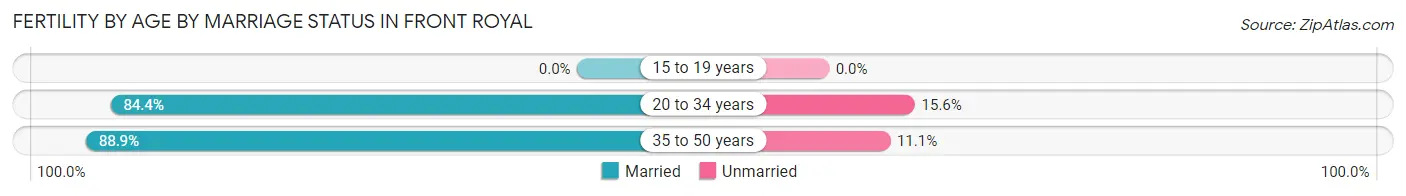
| Age Bracket | Married | Unmarried |
| 15 to 19 years | 0 (0.0%) | 0 (0.0%) |
| 20 to 34 years | 179 (84.4%) | 33 (15.6%) |
| 35 to 50 years | 40 (88.9%) | 5 (11.1%) |
| Total | 219 (85.2%) | 38 (14.8%) |
Fertility by Education in Front Royal
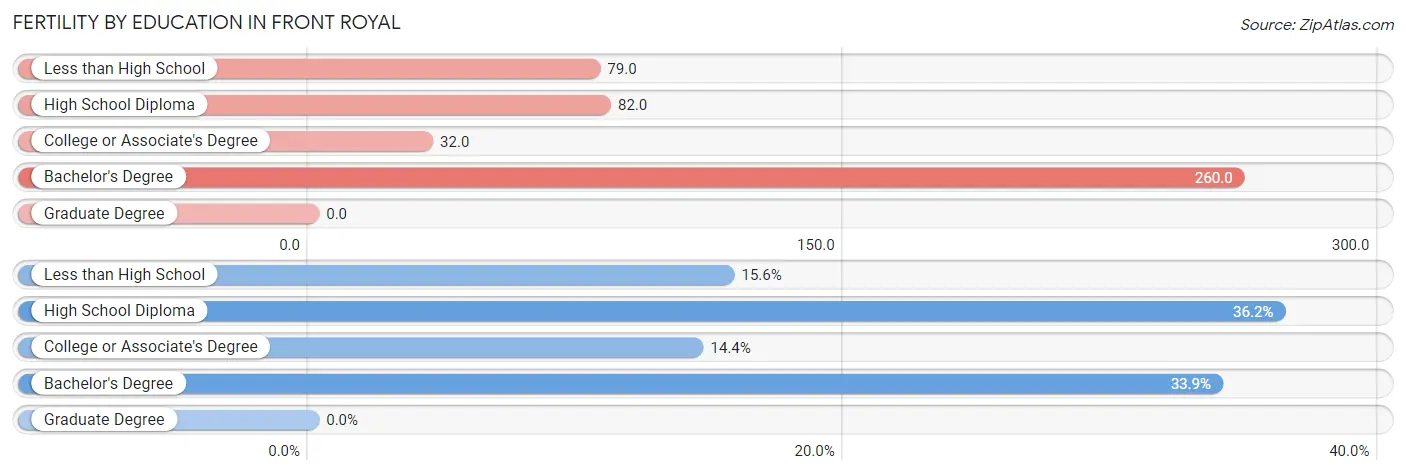
| Educational Attainment | Women with Births | Births / 1,000 Women |
| Less than High School | 40 (15.6%) | 79.0 |
| High School Diploma | 93 (36.2%) | 82.0 |
| College or Associate's Degree | 37 (14.4%) | 32.0 |
| Bachelor's Degree | 87 (33.9%) | 260.0 |
| Graduate Degree | 0 (0.0%) | 0.0 |
| Total | 257 (100.0%) | 77.0 |
Fertility by Education by Marriage Status in Front Royal
14.8% of women with births in Front Royal are unmarried. Women with the educational attainment of less than high school are most likely to be married with 100.0% of them married at childbirth, while women with the educational attainment of bachelor's degree are least likely to be married with 28.7% of them unmarried at childbirth.
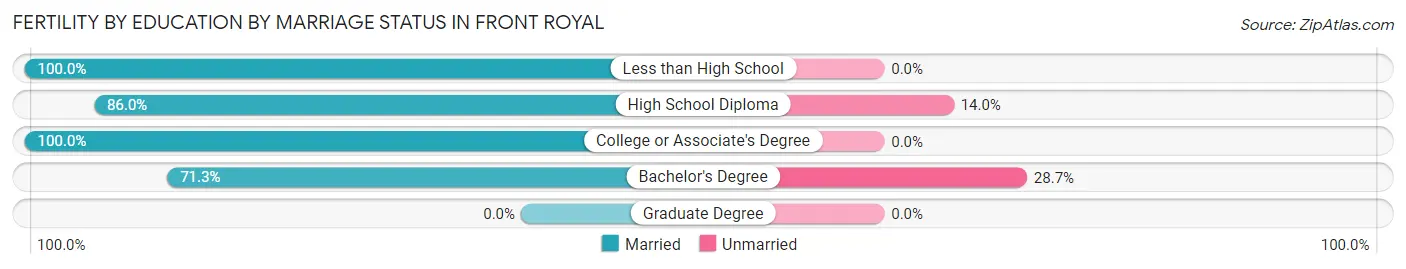
| Educational Attainment | Married | Unmarried |
| Less than High School | 40 (100.0%) | 0 (0.0%) |
| High School Diploma | 80 (86.0%) | 13 (14.0%) |
| College or Associate's Degree | 37 (100.0%) | 0 (0.0%) |
| Bachelor's Degree | 62 (71.3%) | 25 (28.7%) |
| Graduate Degree | 0 (0.0%) | 0 (0.0%) |
| Total | 219 (85.2%) | 38 (14.8%) |
Employment Characteristics in Front Royal
Employment by Class of Employer in Front Royal
Among the 6,953 employed individuals in Front Royal, private company employees (4,784 | 68.8%), local government employees (574 | 8.3%), and not-for-profit organizations (429 | 6.2%) make up the most common classes of employment.
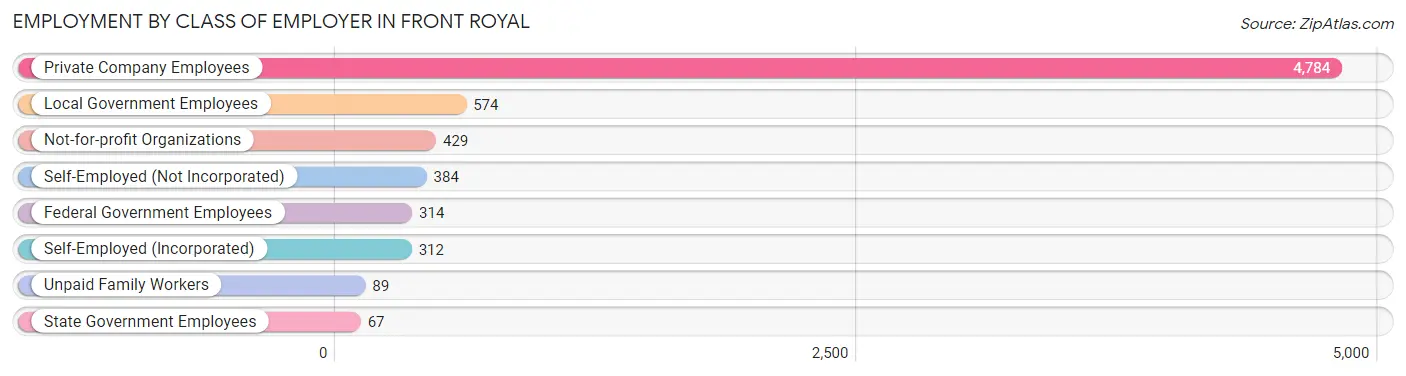
| Employer Class | # Employees | % Employees |
| Private Company Employees | 4,784 | 68.8% |
| Self-Employed (Incorporated) | 312 | 4.5% |
| Self-Employed (Not Incorporated) | 384 | 5.5% |
| Not-for-profit Organizations | 429 | 6.2% |
| Local Government Employees | 574 | 8.3% |
| State Government Employees | 67 | 1.0% |
| Federal Government Employees | 314 | 4.5% |
| Unpaid Family Workers | 89 | 1.3% |
| Total | 6,953 | 100.0% |
Employment Status by Age in Front Royal
According to the labor force statistics for Front Royal, out of the total population over 16 years of age (11,788), 64.5% or 7,603 individuals are in the labor force, with 7.5% or 570 of them unemployed. The age group with the highest labor force participation rate is 20 to 24 years, with 91.4% or 604 individuals in the labor force. Within the labor force, the 60 to 64 years age range has the highest percentage of unemployed individuals, with 26.7% or 153 of them being unemployed.
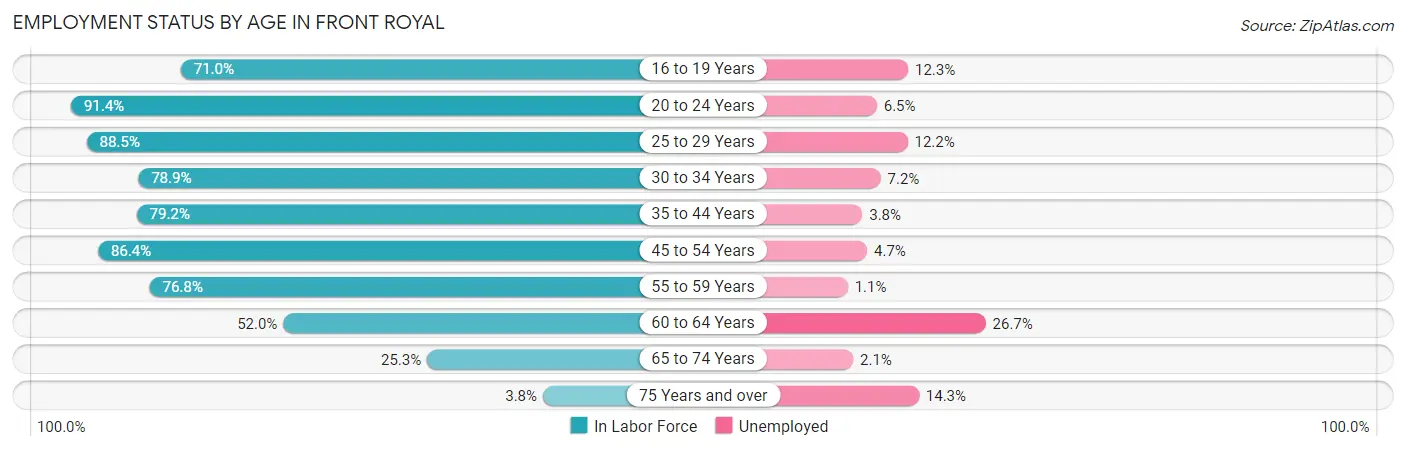
| Age Bracket | In Labor Force | Unemployed |
| 16 to 19 Years | 409 (71.0%) | 50 (12.3%) |
| 20 to 24 Years | 604 (91.4%) | 39 (6.5%) |
| 25 to 29 Years | 1,006 (88.5%) | 123 (12.2%) |
| 30 to 34 Years | 866 (78.9%) | 62 (7.2%) |
| 35 to 44 Years | 1,512 (79.2%) | 57 (3.8%) |
| 45 to 54 Years | 1,270 (86.4%) | 60 (4.7%) |
| 55 to 59 Years | 941 (76.8%) | 10 (1.1%) |
| 60 to 64 Years | 573 (52.0%) | 153 (26.7%) |
| 65 to 74 Years | 384 (25.3%) | 8 (2.1%) |
| 75 Years and over | 42 (3.8%) | 6 (14.3%) |
| Total | 7,603 (64.5%) | 570 (7.5%) |
Employment Status by Educational Attainment in Front Royal
According to labor force statistics for Front Royal, 77.7% of individuals (6,169) out of the total population between 25 and 64 years of age (7,939) are in the labor force, with 7.5% or 463 of them being unemployed. The group with the highest labor force participation rate are those with the educational attainment of college / associate degree, with 82.0% or 1,882 individuals in the labor force. Within the labor force, individuals with high school diploma education have the highest percentage of unemployment, with 12.4% or 296 of them being unemployed.
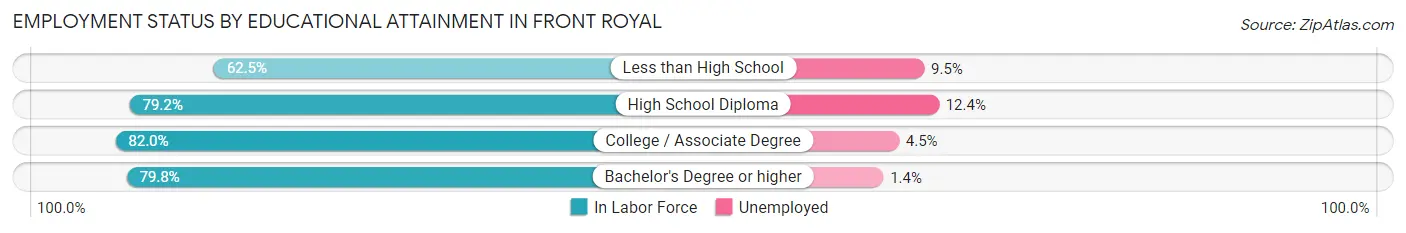
| Educational Attainment | In Labor Force | Unemployed |
| Less than High School | 734 (62.5%) | 112 (9.5%) |
| High School Diploma | 2,386 (79.2%) | 374 (12.4%) |
| College / Associate Degree | 1,882 (82.0%) | 103 (4.5%) |
| Bachelor's Degree or higher | 1,163 (79.8%) | 20 (1.4%) |
| Total | 6,169 (77.7%) | 595 (7.5%) |
Employment Occupations by Sex in Front Royal
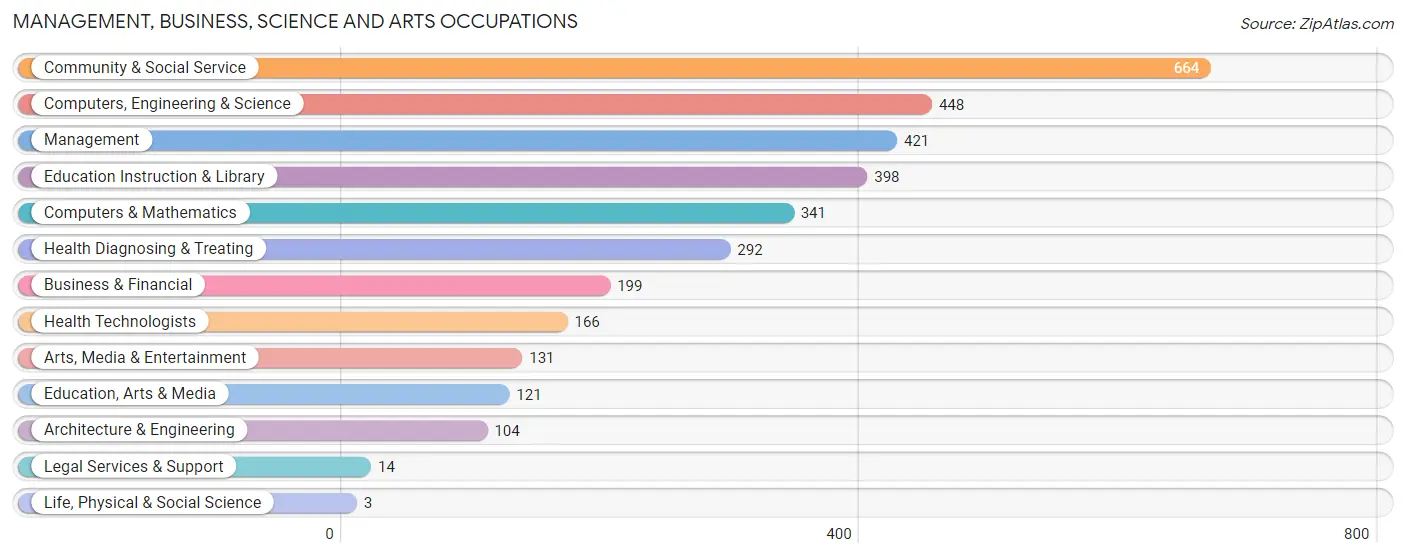
Management, Business, Science and Arts Occupations
The most common Management, Business, Science and Arts occupations in Front Royal are Community & Social Service (664 | 9.5%), Computers, Engineering & Science (448 | 6.4%), Management (421 | 6.0%), Education Instruction & Library (398 | 5.7%), and Computers & Mathematics (341 | 4.9%).
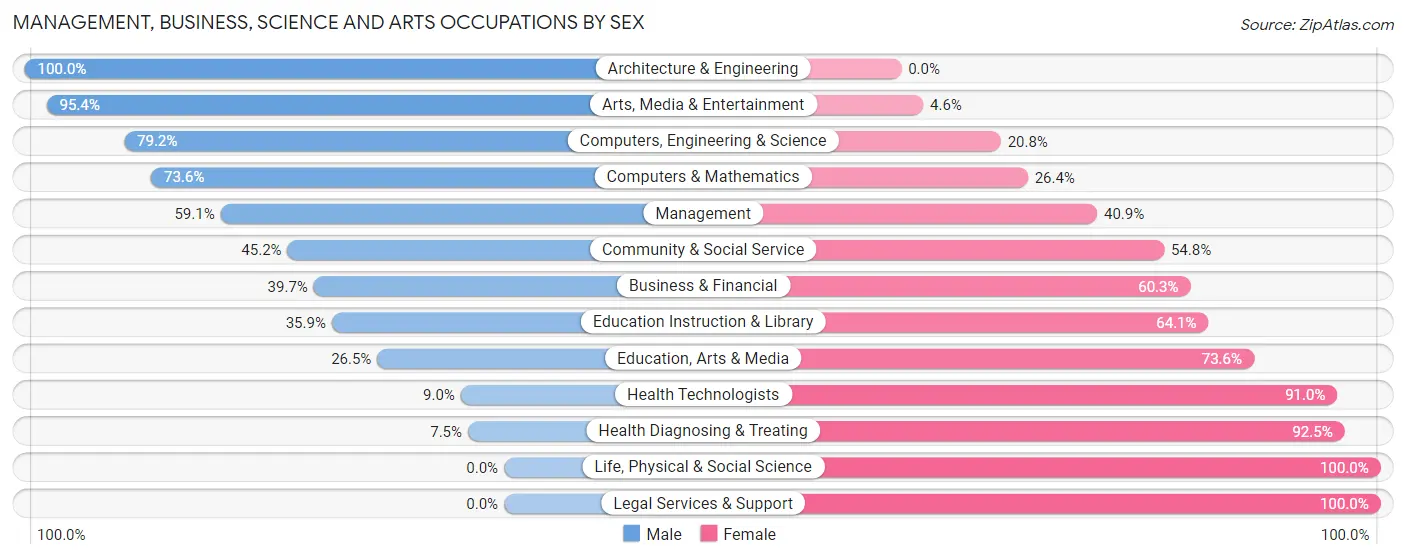
Management, Business, Science and Arts Occupations by Sex
Within the Management, Business, Science and Arts occupations in Front Royal, the most male-oriented occupations are Architecture & Engineering (100.0%), Arts, Media & Entertainment (95.4%), and Computers, Engineering & Science (79.2%), while the most female-oriented occupations are Life, Physical & Social Science (100.0%), Legal Services & Support (100.0%), and Health Diagnosing & Treating (92.5%).
| Occupation | Male | Female |
| Management | 249 (59.1%) | 172 (40.9%) |
| Business & Financial | 79 (39.7%) | 120 (60.3%) |
| Computers, Engineering & Science | 355 (79.2%) | 93 (20.8%) |
| Computers & Mathematics | 251 (73.6%) | 90 (26.4%) |
| Architecture & Engineering | 104 (100.0%) | 0 (0.0%) |
| Life, Physical & Social Science | 0 (0.0%) | 3 (100.0%) |
| Community & Social Service | 300 (45.2%) | 364 (54.8%) |
| Education, Arts & Media | 32 (26.5%) | 89 (73.6%) |
| Legal Services & Support | 0 (0.0%) | 14 (100.0%) |
| Education Instruction & Library | 143 (35.9%) | 255 (64.1%) |
| Arts, Media & Entertainment | 125 (95.4%) | 6 (4.6%) |
| Health Diagnosing & Treating | 22 (7.5%) | 270 (92.5%) |
| Health Technologists | 15 (9.0%) | 151 (91.0%) |
| Total (Category) | 1,005 (49.6%) | 1,019 (50.3%) |
| Total (Overall) | 3,670 (52.2%) | 3,357 (47.8%) |
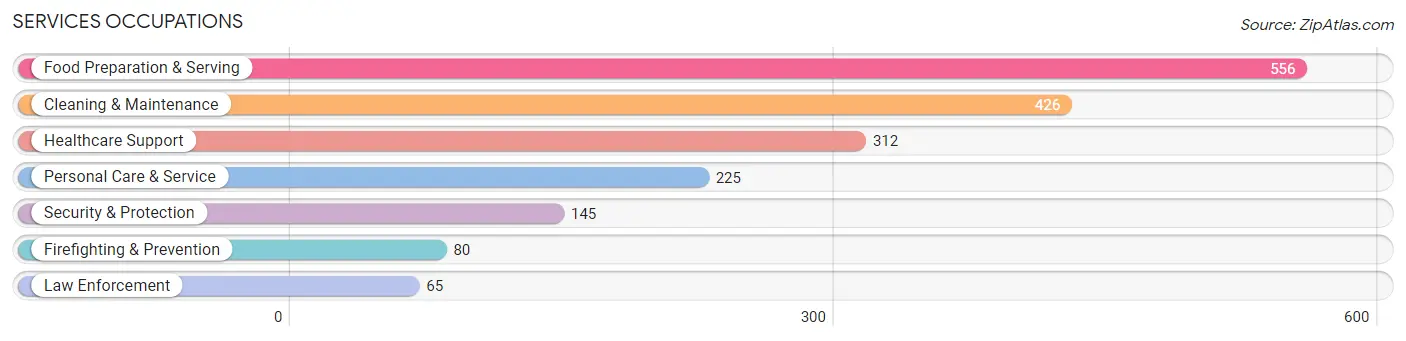
Services Occupations
The most common Services occupations in Front Royal are Food Preparation & Serving (556 | 7.9%), Cleaning & Maintenance (426 | 6.1%), Healthcare Support (312 | 4.4%), Personal Care & Service (225 | 3.2%), and Security & Protection (145 | 2.1%).
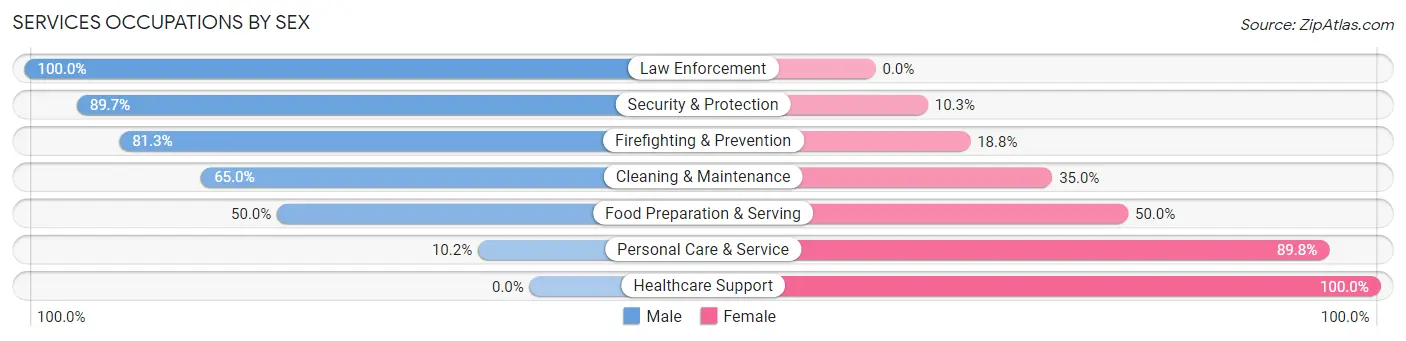
Services Occupations by Sex
Within the Services occupations in Front Royal, the most male-oriented occupations are Law Enforcement (100.0%), Security & Protection (89.7%), and Firefighting & Prevention (81.2%), while the most female-oriented occupations are Healthcare Support (100.0%), Personal Care & Service (89.8%), and Food Preparation & Serving (50.0%).
| Occupation | Male | Female |
| Healthcare Support | 0 (0.0%) | 312 (100.0%) |
| Security & Protection | 130 (89.7%) | 15 (10.3%) |
| Firefighting & Prevention | 65 (81.2%) | 15 (18.8%) |
| Law Enforcement | 65 (100.0%) | 0 (0.0%) |
| Food Preparation & Serving | 278 (50.0%) | 278 (50.0%) |
| Cleaning & Maintenance | 277 (65.0%) | 149 (35.0%) |
| Personal Care & Service | 23 (10.2%) | 202 (89.8%) |
| Total (Category) | 708 (42.5%) | 956 (57.5%) |
| Total (Overall) | 3,670 (52.2%) | 3,357 (47.8%) |
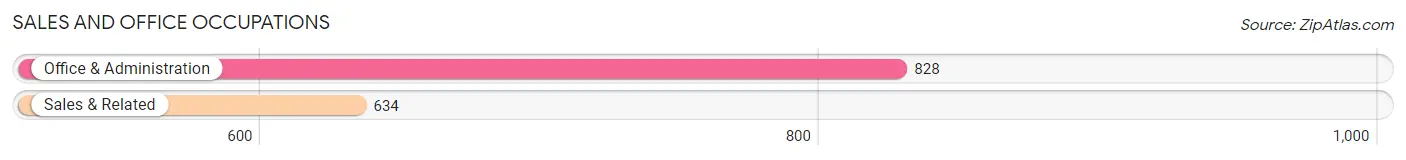
Sales and Office Occupations
The most common Sales and Office occupations in Front Royal are Office & Administration (828 | 11.8%), and Sales & Related (634 | 9.0%).
Sales and Office Occupations by Sex
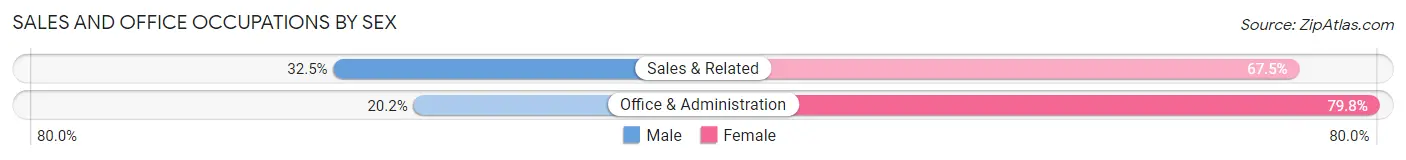
| Occupation | Male | Female |
| Sales & Related | 206 (32.5%) | 428 (67.5%) |
| Office & Administration | 167 (20.2%) | 661 (79.8%) |
| Total (Category) | 373 (25.5%) | 1,089 (74.5%) |
| Total (Overall) | 3,670 (52.2%) | 3,357 (47.8%) |
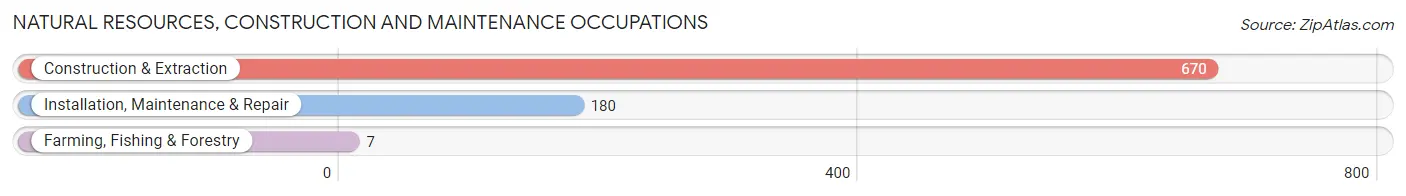
Natural Resources, Construction and Maintenance Occupations
The most common Natural Resources, Construction and Maintenance occupations in Front Royal are Construction & Extraction (670 | 9.5%), Installation, Maintenance & Repair (180 | 2.6%), and Farming, Fishing & Forestry (7 | 0.1%).
Natural Resources, Construction and Maintenance Occupations by Sex
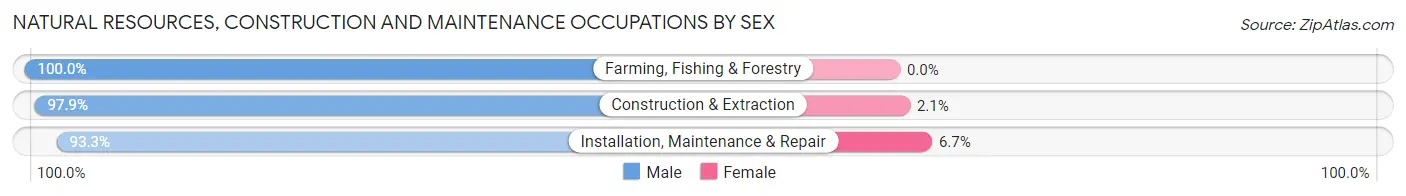
| Occupation | Male | Female |
| Farming, Fishing & Forestry | 7 (100.0%) | 0 (0.0%) |
| Construction & Extraction | 656 (97.9%) | 14 (2.1%) |
| Installation, Maintenance & Repair | 168 (93.3%) | 12 (6.7%) |
| Total (Category) | 831 (97.0%) | 26 (3.0%) |
| Total (Overall) | 3,670 (52.2%) | 3,357 (47.8%) |
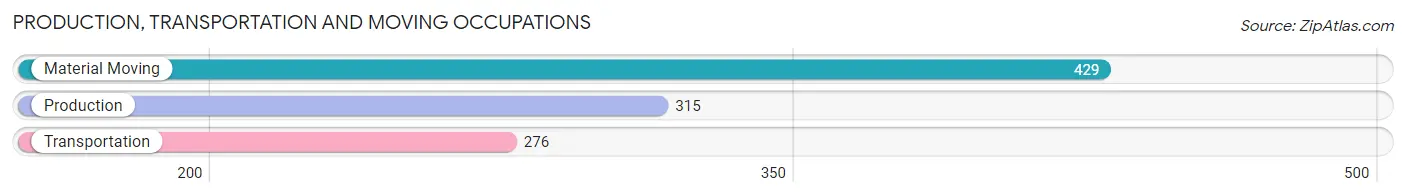
Production, Transportation and Moving Occupations
The most common Production, Transportation and Moving occupations in Front Royal are Material Moving (429 | 6.1%), Production (315 | 4.5%), and Transportation (276 | 3.9%).
Production, Transportation and Moving Occupations by Sex
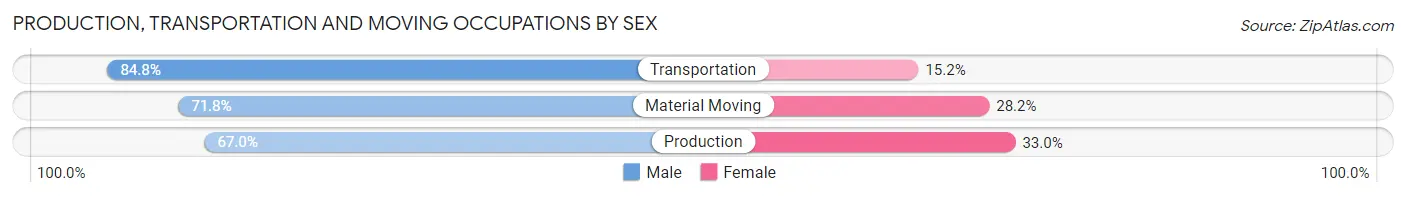
| Occupation | Male | Female |
| Production | 211 (67.0%) | 104 (33.0%) |
| Transportation | 234 (84.8%) | 42 (15.2%) |
| Material Moving | 308 (71.8%) | 121 (28.2%) |
| Total (Category) | 753 (73.8%) | 267 (26.2%) |
| Total (Overall) | 3,670 (52.2%) | 3,357 (47.8%) |
Employment Industries by Sex in Front Royal
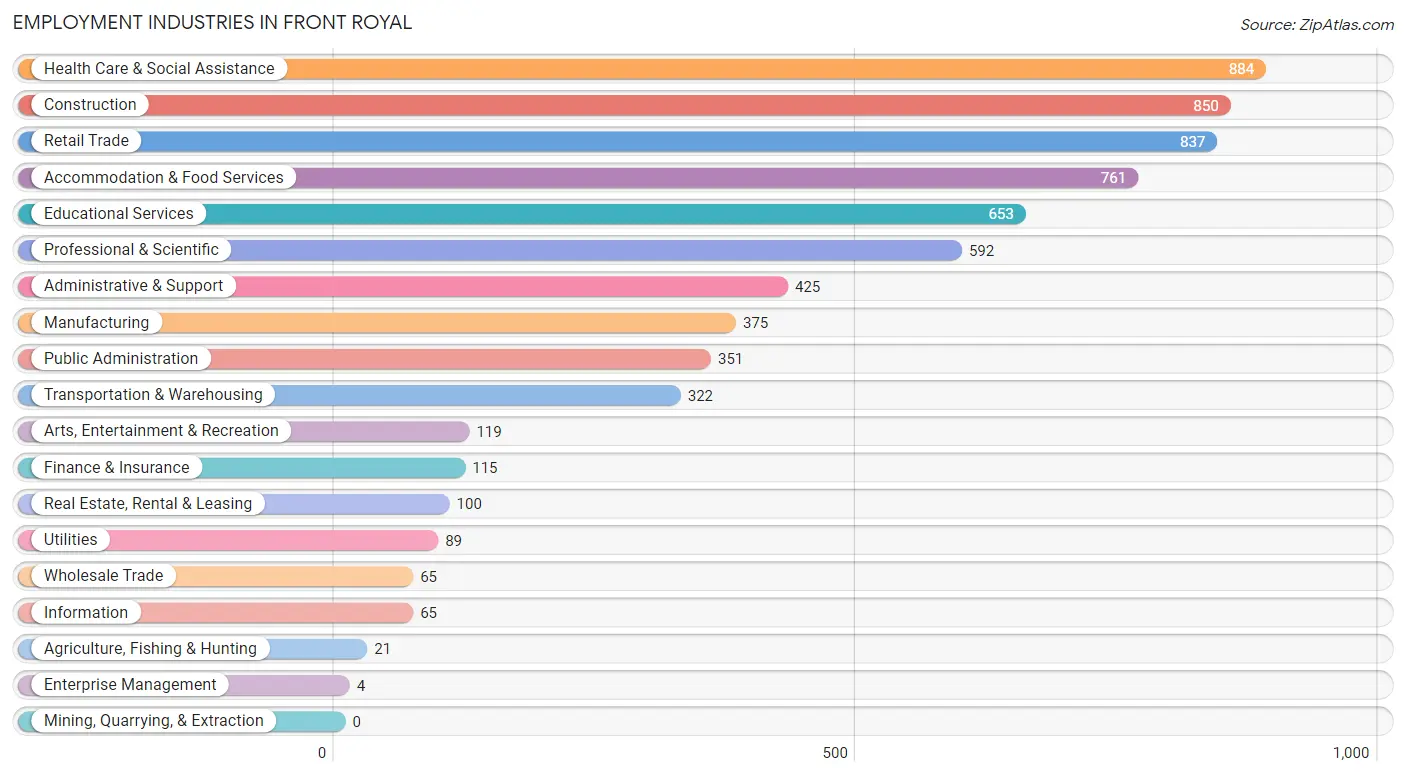
Employment Industries in Front Royal
The major employment industries in Front Royal include Health Care & Social Assistance (884 | 12.6%), Construction (850 | 12.1%), Retail Trade (837 | 11.9%), Accommodation & Food Services (761 | 10.8%), and Educational Services (653 | 9.3%).
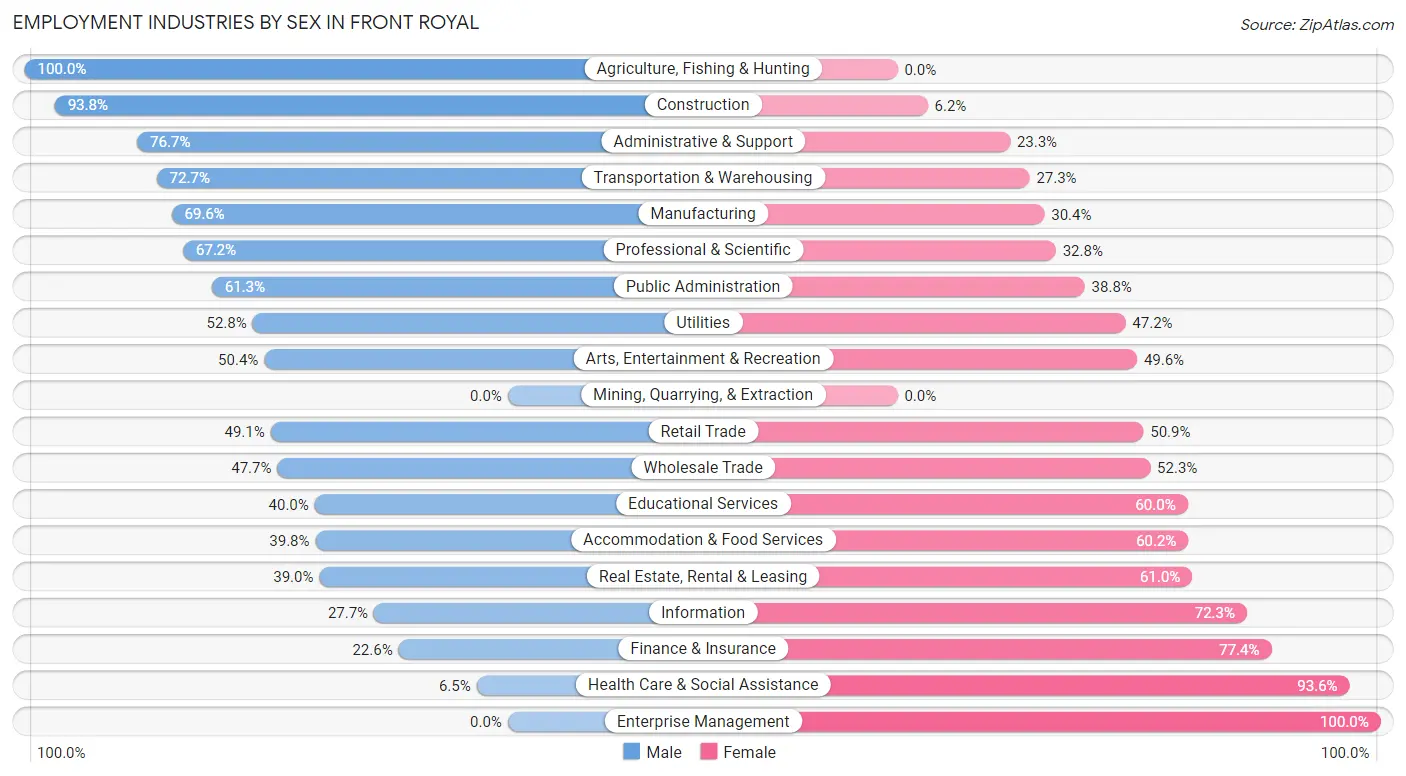
Employment Industries by Sex in Front Royal
The Front Royal industries that see more men than women are Agriculture, Fishing & Hunting (100.0%), Construction (93.8%), and Administrative & Support (76.7%), whereas the industries that tend to have a higher number of women are Enterprise Management (100.0%), Health Care & Social Assistance (93.5%), and Finance & Insurance (77.4%).
| Industry | Male | Female |
| Agriculture, Fishing & Hunting | 21 (100.0%) | 0 (0.0%) |
| Mining, Quarrying, & Extraction | 0 (0.0%) | 0 (0.0%) |
| Construction | 797 (93.8%) | 53 (6.2%) |
| Manufacturing | 261 (69.6%) | 114 (30.4%) |
| Wholesale Trade | 31 (47.7%) | 34 (52.3%) |
| Retail Trade | 411 (49.1%) | 426 (50.9%) |
| Transportation & Warehousing | 234 (72.7%) | 88 (27.3%) |
| Utilities | 47 (52.8%) | 42 (47.2%) |
| Information | 18 (27.7%) | 47 (72.3%) |
| Finance & Insurance | 26 (22.6%) | 89 (77.4%) |
| Real Estate, Rental & Leasing | 39 (39.0%) | 61 (61.0%) |
| Professional & Scientific | 398 (67.2%) | 194 (32.8%) |
| Enterprise Management | 0 (0.0%) | 4 (100.0%) |
| Administrative & Support | 326 (76.7%) | 99 (23.3%) |
| Educational Services | 261 (40.0%) | 392 (60.0%) |
| Health Care & Social Assistance | 57 (6.5%) | 827 (93.5%) |
| Arts, Entertainment & Recreation | 60 (50.4%) | 59 (49.6%) |
| Accommodation & Food Services | 303 (39.8%) | 458 (60.2%) |
| Public Administration | 215 (61.3%) | 136 (38.8%) |
| Total | 3,670 (52.2%) | 3,357 (47.8%) |
Education in Front Royal
School Enrollment in Front Royal
The most common levels of schooling among the 3,280 students in Front Royal are middle school (960 | 29.3%), elementary school (844 | 25.7%), and high school (589 | 18.0%).
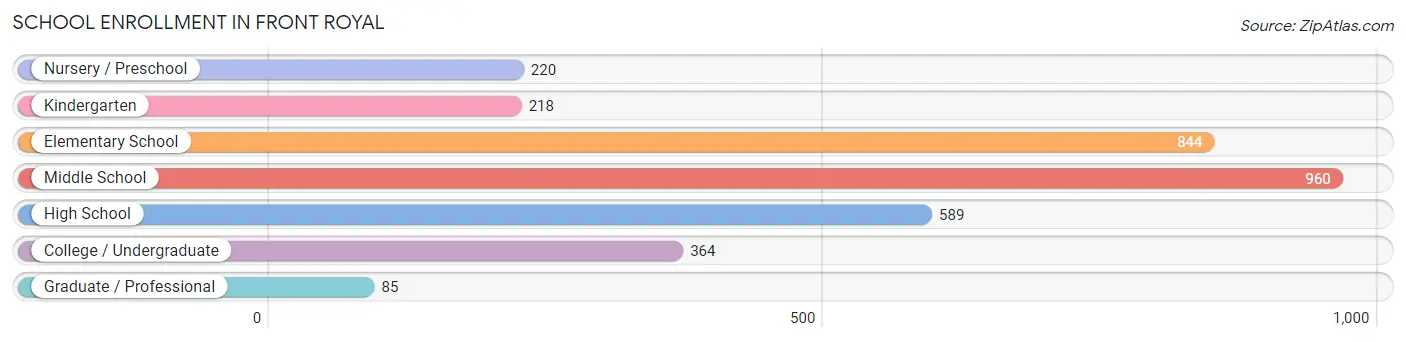
| School Level | # Students | % Students |
| Nursery / Preschool | 220 | 6.7% |
| Kindergarten | 218 | 6.7% |
| Elementary School | 844 | 25.7% |
| Middle School | 960 | 29.3% |
| High School | 589 | 18.0% |
| College / Undergraduate | 364 | 11.1% |
| Graduate / Professional | 85 | 2.6% |
| Total | 3,280 | 100.0% |
School Enrollment by Age by Funding Source in Front Royal
Out of a total of 3,280 students who are enrolled in schools in Front Royal, 266 (8.1%) attend a private institution, while the remaining 3,014 (91.9%) are enrolled in public schools. The age group of 25 to 34 year olds has the highest likelihood of being enrolled in private schools, with 52 (36.6% in the age bracket) enrolled. Conversely, the age group of 10 to 14 year olds has the lowest likelihood of being enrolled in a private school, with 1,151 (100.0% in the age bracket) attending a public institution.
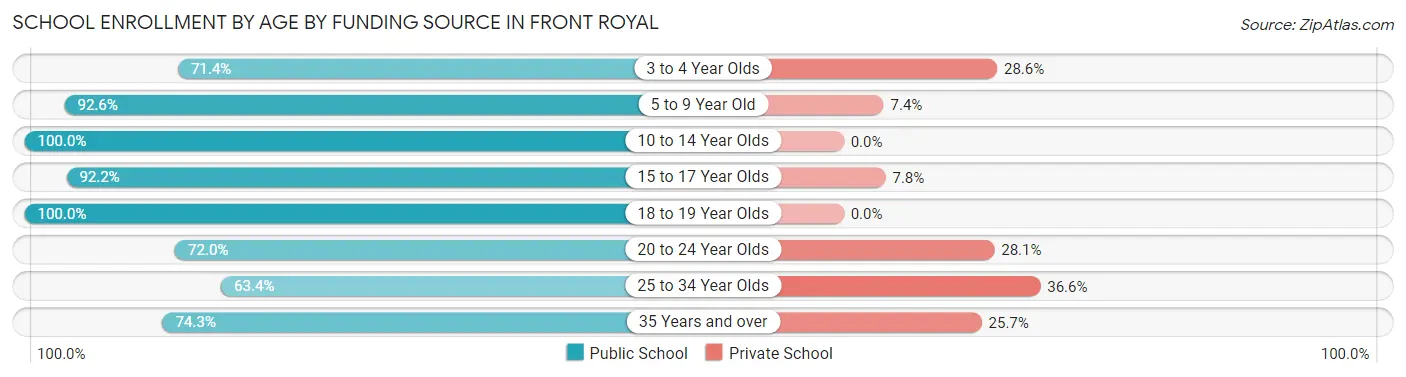
| Age Bracket | Public School | Private School |
| 3 to 4 Year Olds | 120 (71.4%) | 48 (28.6%) |
| 5 to 9 Year Old | 971 (92.6%) | 78 (7.4%) |
| 10 to 14 Year Olds | 1,151 (100.0%) | 0 (0.0%) |
| 15 to 17 Year Olds | 331 (92.2%) | 28 (7.8%) |
| 18 to 19 Year Olds | 185 (100.0%) | 0 (0.0%) |
| 20 to 24 Year Olds | 59 (72.0%) | 23 (28.1%) |
| 25 to 34 Year Olds | 90 (63.4%) | 52 (36.6%) |
| 35 Years and over | 107 (74.3%) | 37 (25.7%) |
| Total | 3,014 (91.9%) | 266 (8.1%) |
Educational Attainment by Field of Study in Front Royal
Education (458 | 23.9%), business (244 | 12.7%), liberal arts & history (241 | 12.6%), arts & humanities (173 | 9.0%), and social sciences (143 | 7.5%) are the most common fields of study among 1,915 individuals in Front Royal who have obtained a bachelor's degree or higher.
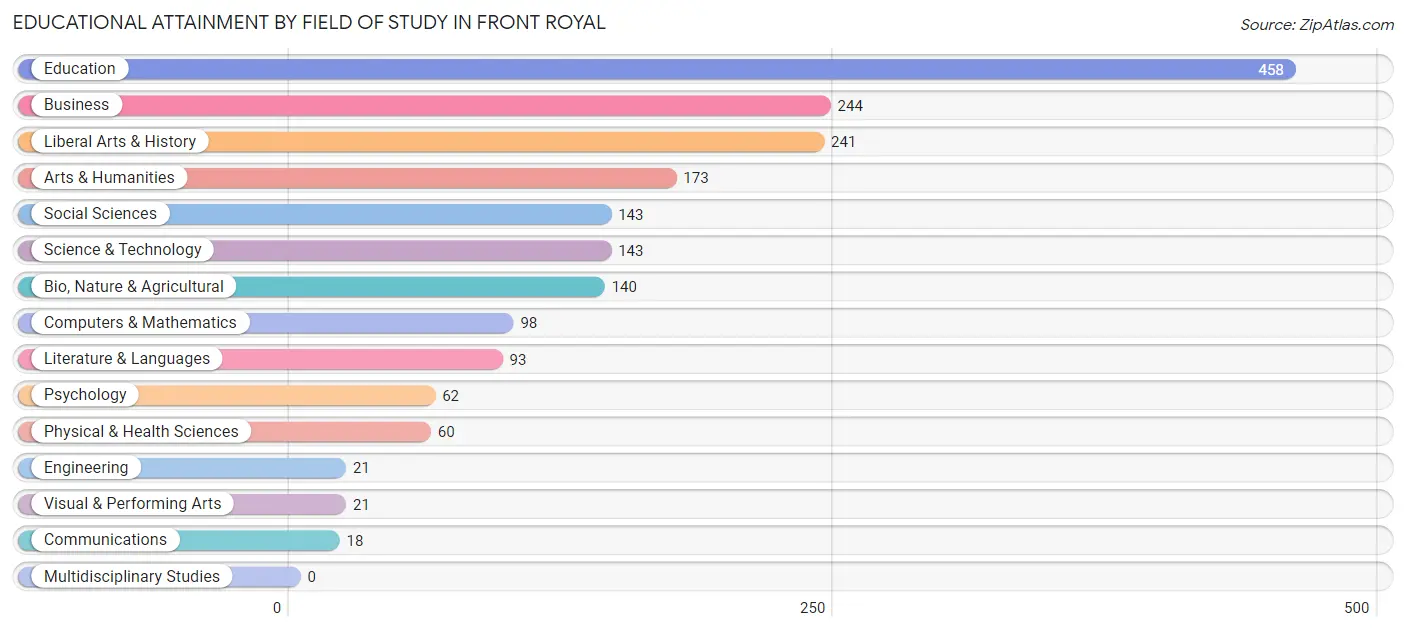
| Field of Study | # Graduates | % Graduates |
| Computers & Mathematics | 98 | 5.1% |
| Bio, Nature & Agricultural | 140 | 7.3% |
| Physical & Health Sciences | 60 | 3.1% |
| Psychology | 62 | 3.2% |
| Social Sciences | 143 | 7.5% |
| Engineering | 21 | 1.1% |
| Multidisciplinary Studies | 0 | 0.0% |
| Science & Technology | 143 | 7.5% |
| Business | 244 | 12.7% |
| Education | 458 | 23.9% |
| Literature & Languages | 93 | 4.9% |
| Liberal Arts & History | 241 | 12.6% |
| Visual & Performing Arts | 21 | 1.1% |
| Communications | 18 | 0.9% |
| Arts & Humanities | 173 | 9.0% |
| Total | 1,915 | 100.0% |
Transportation & Commute in Front Royal
Vehicle Availability by Sex in Front Royal
The most prevalent vehicle ownership categories in Front Royal are males with 2 vehicles (1,270, accounting for 35.2%) and females with 2 vehicles (1,095, making up 38.3%).
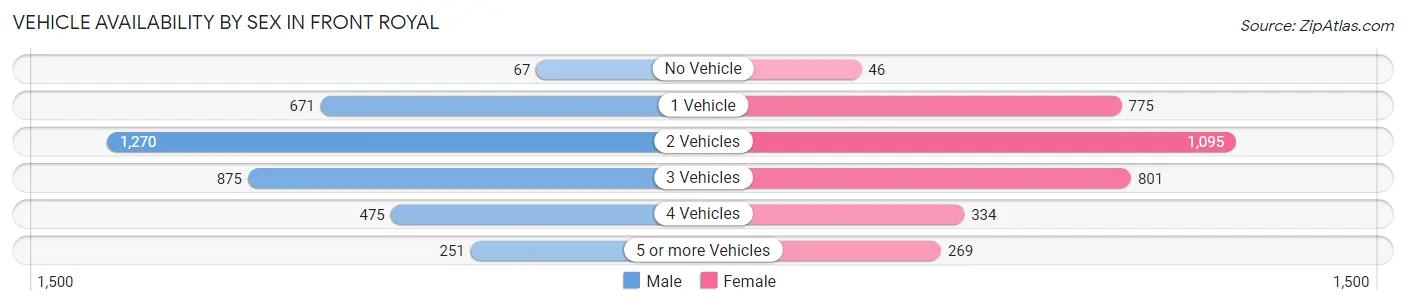
| Vehicles Available | Male | Female |
| No Vehicle | 67 (1.9%) | 46 (1.4%) |
| 1 Vehicle | 671 (18.6%) | 775 (23.3%) |
| 2 Vehicles | 1,270 (35.2%) | 1,095 (33.0%) |
| 3 Vehicles | 875 (24.2%) | 801 (24.1%) |
| 4 Vehicles | 475 (13.2%) | 334 (10.1%) |
| 5 or more Vehicles | 251 (7.0%) | 269 (8.1%) |
| Total | 3,609 (100.0%) | 3,320 (100.0%) |
Commute Time in Front Royal
The most frequently occuring commute durations in Front Royal are 60 to 89 minutes (1,093 commuters, 17.0%), 10 to 14 minutes (841 commuters, 13.1%), and 30 to 34 minutes (840 commuters, 13.1%).
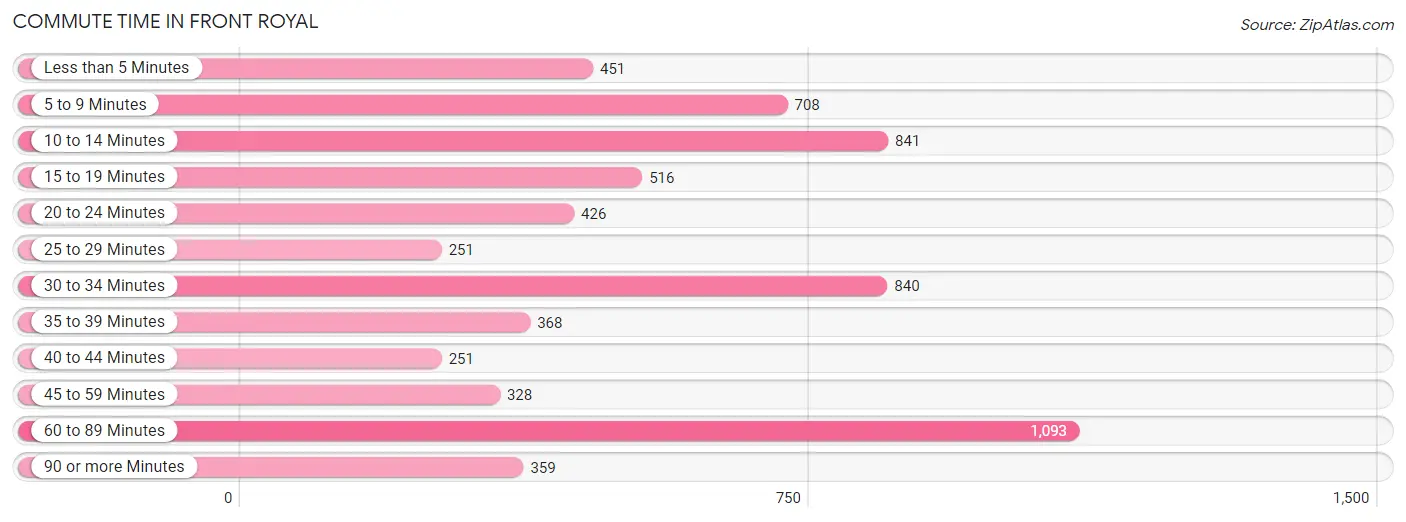
| Commute Time | # Commuters | % Commuters |
| Less than 5 Minutes | 451 | 7.0% |
| 5 to 9 Minutes | 708 | 11.0% |
| 10 to 14 Minutes | 841 | 13.1% |
| 15 to 19 Minutes | 516 | 8.0% |
| 20 to 24 Minutes | 426 | 6.6% |
| 25 to 29 Minutes | 251 | 3.9% |
| 30 to 34 Minutes | 840 | 13.1% |
| 35 to 39 Minutes | 368 | 5.7% |
| 40 to 44 Minutes | 251 | 3.9% |
| 45 to 59 Minutes | 328 | 5.1% |
| 60 to 89 Minutes | 1,093 | 17.0% |
| 90 or more Minutes | 359 | 5.6% |
Commute Time by Sex in Front Royal
The most common commute times in Front Royal are 60 to 89 minutes (760 commuters, 22.3%) for males and 30 to 34 minutes (481 commuters, 15.9%) for females.
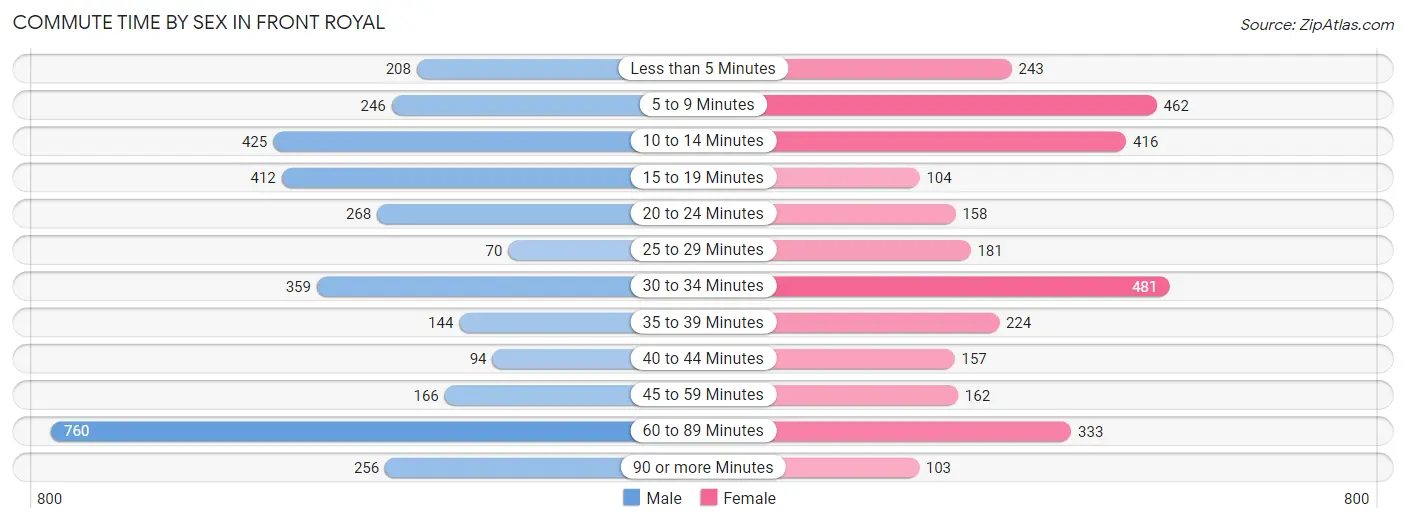
| Commute Time | Male | Female |
| Less than 5 Minutes | 208 (6.1%) | 243 (8.0%) |
| 5 to 9 Minutes | 246 (7.2%) | 462 (15.3%) |
| 10 to 14 Minutes | 425 (12.5%) | 416 (13.8%) |
| 15 to 19 Minutes | 412 (12.1%) | 104 (3.4%) |
| 20 to 24 Minutes | 268 (7.9%) | 158 (5.2%) |
| 25 to 29 Minutes | 70 (2.1%) | 181 (6.0%) |
| 30 to 34 Minutes | 359 (10.5%) | 481 (15.9%) |
| 35 to 39 Minutes | 144 (4.2%) | 224 (7.4%) |
| 40 to 44 Minutes | 94 (2.8%) | 157 (5.2%) |
| 45 to 59 Minutes | 166 (4.9%) | 162 (5.4%) |
| 60 to 89 Minutes | 760 (22.3%) | 333 (11.0%) |
| 90 or more Minutes | 256 (7.5%) | 103 (3.4%) |
Time of Departure to Work by Sex in Front Royal
The most frequent times of departure to work in Front Royal are 12:00 AM to 4:59 AM (499, 14.6%) for males and 8:00 AM to 8:29 AM (441, 14.6%) for females.
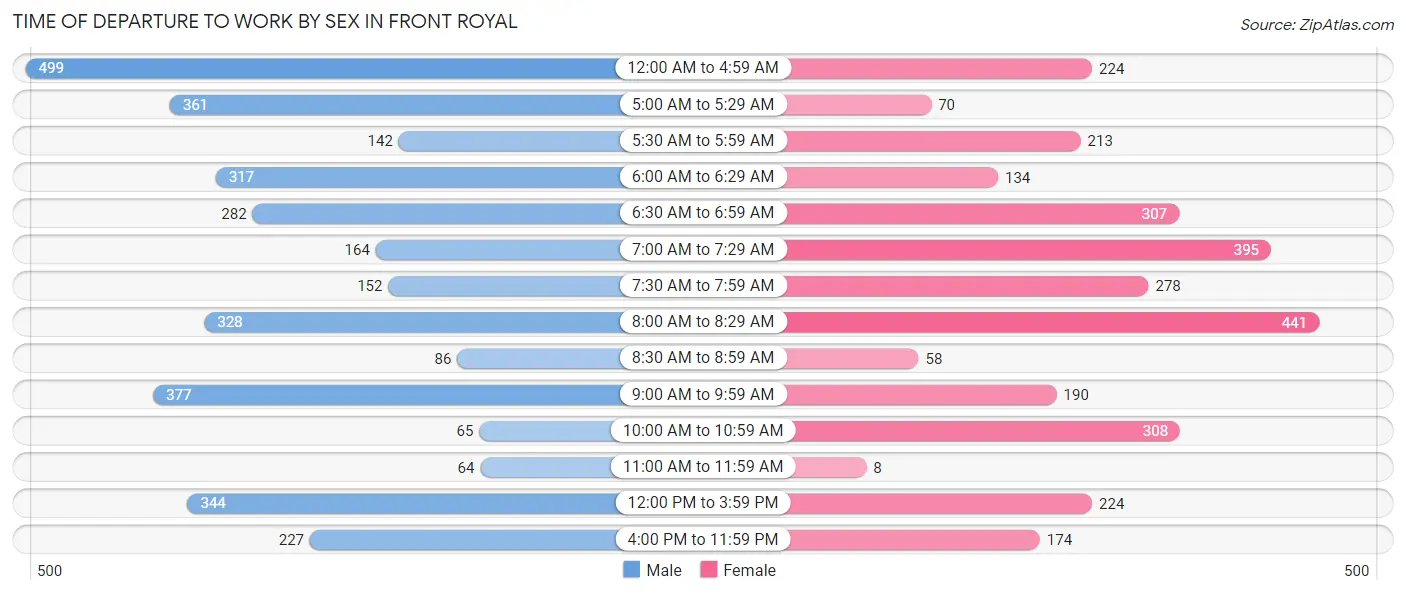
| Time of Departure | Male | Female |
| 12:00 AM to 4:59 AM | 499 (14.6%) | 224 (7.4%) |
| 5:00 AM to 5:29 AM | 361 (10.6%) | 70 (2.3%) |
| 5:30 AM to 5:59 AM | 142 (4.2%) | 213 (7.0%) |
| 6:00 AM to 6:29 AM | 317 (9.3%) | 134 (4.4%) |
| 6:30 AM to 6:59 AM | 282 (8.3%) | 307 (10.2%) |
| 7:00 AM to 7:29 AM | 164 (4.8%) | 395 (13.1%) |
| 7:30 AM to 7:59 AM | 152 (4.5%) | 278 (9.2%) |
| 8:00 AM to 8:29 AM | 328 (9.6%) | 441 (14.6%) |
| 8:30 AM to 8:59 AM | 86 (2.5%) | 58 (1.9%) |
| 9:00 AM to 9:59 AM | 377 (11.1%) | 190 (6.3%) |
| 10:00 AM to 10:59 AM | 65 (1.9%) | 308 (10.2%) |
| 11:00 AM to 11:59 AM | 64 (1.9%) | 8 (0.3%) |
| 12:00 PM to 3:59 PM | 344 (10.1%) | 224 (7.4%) |
| 4:00 PM to 11:59 PM | 227 (6.7%) | 174 (5.8%) |
| Total | 3,408 (100.0%) | 3,024 (100.0%) |
Housing Occupancy in Front Royal
Occupancy by Ownership in Front Royal
Of the total 5,750 dwellings in Front Royal, owner-occupied units account for 3,343 (58.1%), while renter-occupied units make up 2,407 (41.9%).
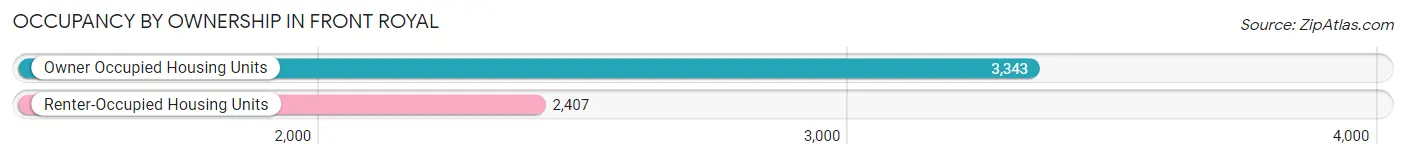
| Occupancy | # Housing Units | % Housing Units |
| Owner Occupied Housing Units | 3,343 | 58.1% |
| Renter-Occupied Housing Units | 2,407 | 41.9% |
| Total Occupied Housing Units | 5,750 | 100.0% |
Occupancy by Household Size in Front Royal
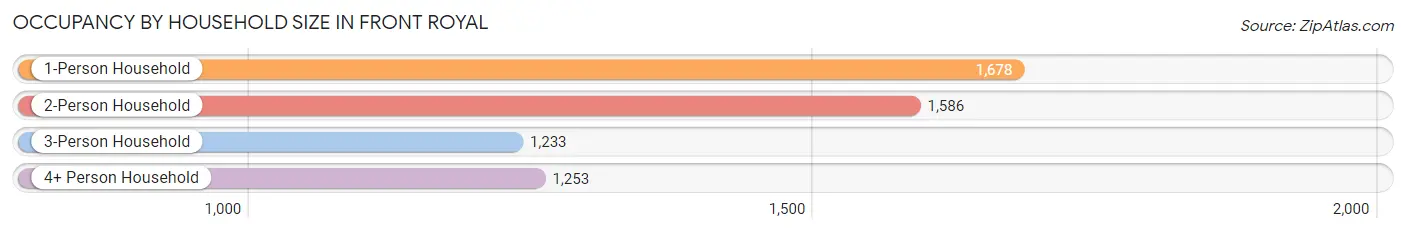
| Household Size | # Housing Units | % Housing Units |
| 1-Person Household | 1,678 | 29.2% |
| 2-Person Household | 1,586 | 27.6% |
| 3-Person Household | 1,233 | 21.4% |
| 4+ Person Household | 1,253 | 21.8% |
| Total Housing Units | 5,750 | 100.0% |
Occupancy by Ownership by Household Size in Front Royal
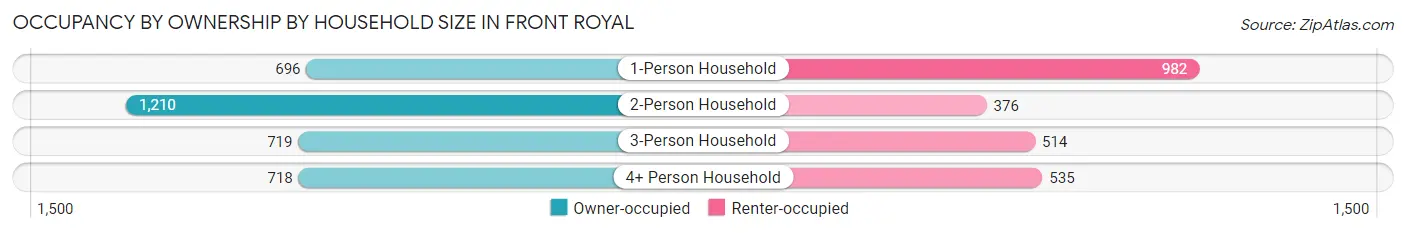
| Household Size | Owner-occupied | Renter-occupied |
| 1-Person Household | 696 (41.5%) | 982 (58.5%) |
| 2-Person Household | 1,210 (76.3%) | 376 (23.7%) |
| 3-Person Household | 719 (58.3%) | 514 (41.7%) |
| 4+ Person Household | 718 (57.3%) | 535 (42.7%) |
| Total Housing Units | 3,343 (58.1%) | 2,407 (41.9%) |
Occupancy by Educational Attainment in Front Royal
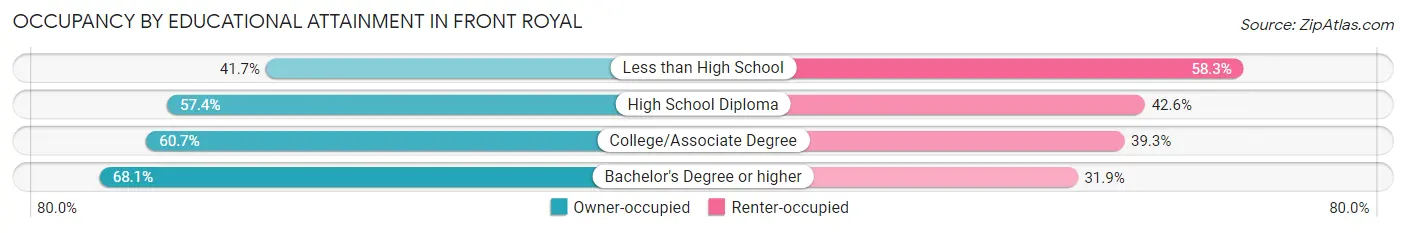
| Household Size | Owner-occupied | Renter-occupied |
| Less than High School | 376 (41.7%) | 525 (58.3%) |
| High School Diploma | 1,167 (57.4%) | 866 (42.6%) |
| College/Associate Degree | 960 (60.7%) | 622 (39.3%) |
| Bachelor's Degree or higher | 840 (68.1%) | 394 (31.9%) |
Occupancy by Age of Householder in Front Royal
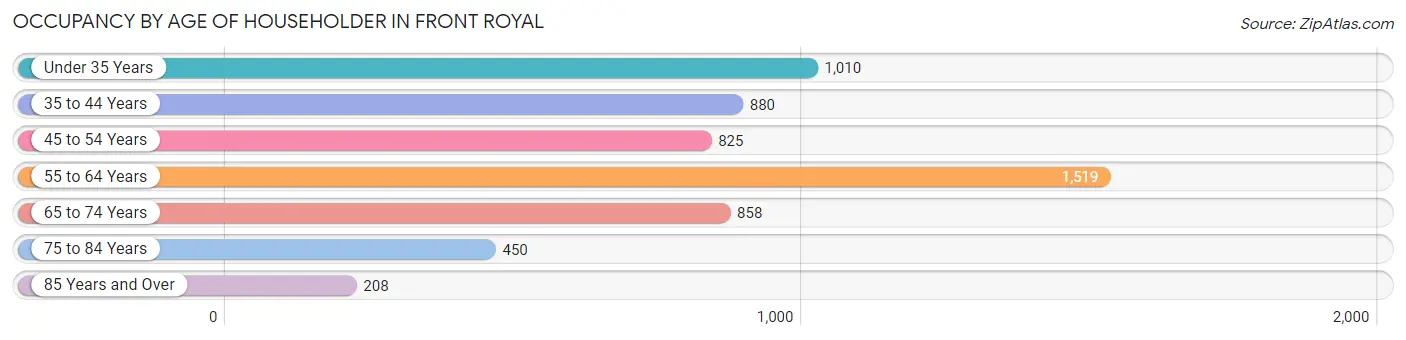
| Age Bracket | # Households | % Households |
| Under 35 Years | 1,010 | 17.6% |
| 35 to 44 Years | 880 | 15.3% |
| 45 to 54 Years | 825 | 14.3% |
| 55 to 64 Years | 1,519 | 26.4% |
| 65 to 74 Years | 858 | 14.9% |
| 75 to 84 Years | 450 | 7.8% |
| 85 Years and Over | 208 | 3.6% |
| Total | 5,750 | 100.0% |
Housing Finances in Front Royal
Median Income by Occupancy in Front Royal
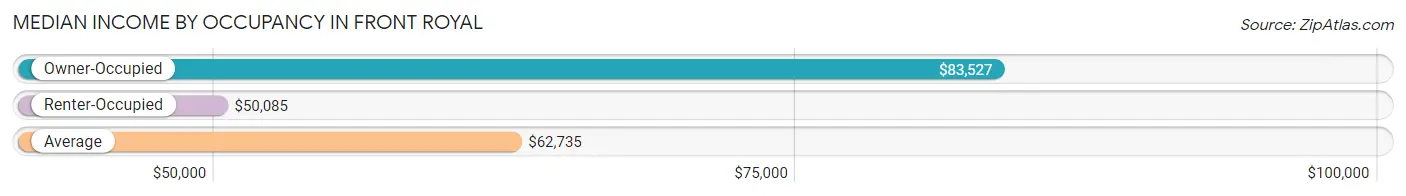
| Occupancy Type | # Households | Median Income |
| Owner-Occupied | 3,343 (58.1%) | $83,527 |
| Renter-Occupied | 2,407 (41.9%) | $50,085 |
| Average | 5,750 (100.0%) | $62,735 |
Occupancy by Householder Income Bracket in Front Royal
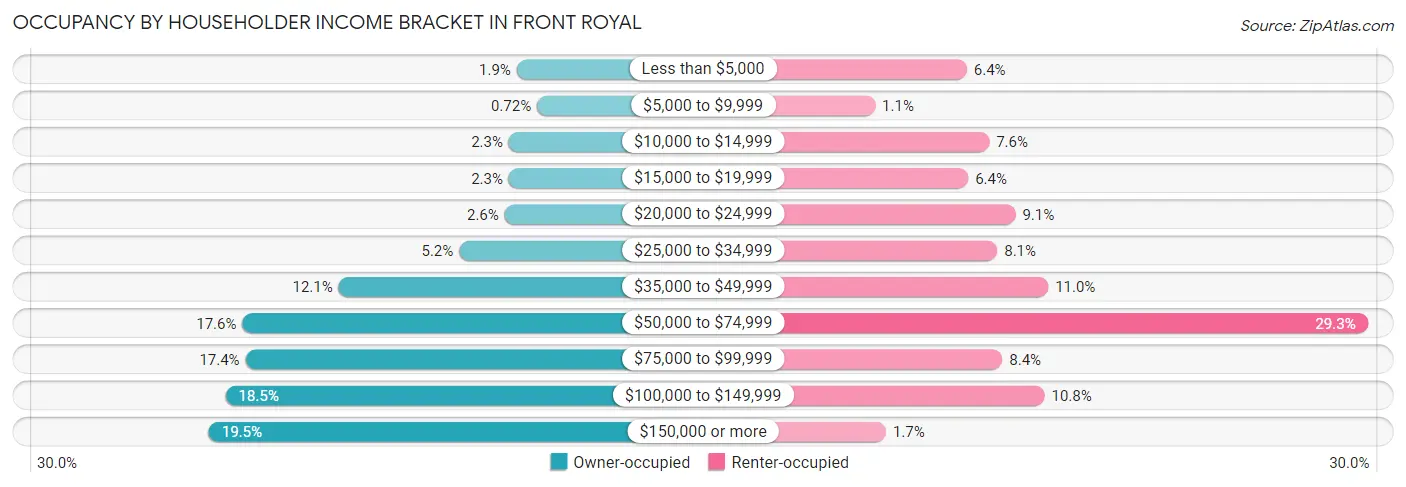
| Income Bracket | Owner-occupied | Renter-occupied |
| Less than $5,000 | 63 (1.9%) | 153 (6.4%) |
| $5,000 to $9,999 | 24 (0.7%) | 27 (1.1%) |
| $10,000 to $14,999 | 78 (2.3%) | 184 (7.6%) |
| $15,000 to $19,999 | 78 (2.3%) | 155 (6.4%) |
| $20,000 to $24,999 | 86 (2.6%) | 220 (9.1%) |
| $25,000 to $34,999 | 173 (5.2%) | 195 (8.1%) |
| $35,000 to $49,999 | 403 (12.1%) | 265 (11.0%) |
| $50,000 to $74,999 | 587 (17.6%) | 704 (29.2%) |
| $75,000 to $99,999 | 581 (17.4%) | 202 (8.4%) |
| $100,000 to $149,999 | 619 (18.5%) | 260 (10.8%) |
| $150,000 or more | 651 (19.5%) | 42 (1.7%) |
| Total | 3,343 (100.0%) | 2,407 (100.0%) |
Monthly Housing Cost Tiers in Front Royal
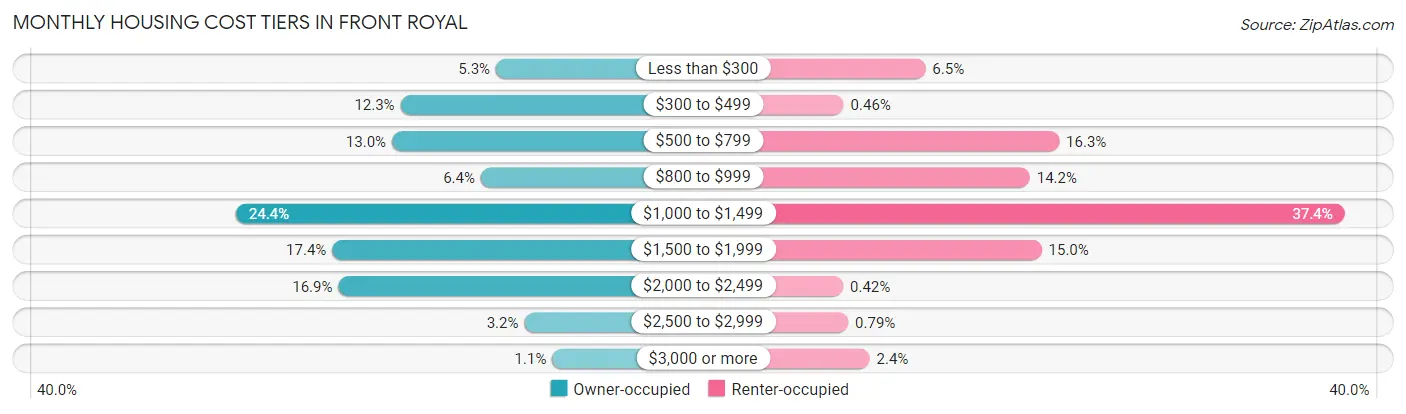
| Monthly Cost | Owner-occupied | Renter-occupied |
| Less than $300 | 177 (5.3%) | 156 (6.5%) |
| $300 to $499 | 412 (12.3%) | 11 (0.5%) |
| $500 to $799 | 433 (13.0%) | 393 (16.3%) |
| $800 to $999 | 214 (6.4%) | 341 (14.2%) |
| $1,000 to $1,499 | 817 (24.4%) | 899 (37.3%) |
| $1,500 to $1,999 | 580 (17.3%) | 362 (15.0%) |
| $2,000 to $2,499 | 565 (16.9%) | 10 (0.4%) |
| $2,500 to $2,999 | 107 (3.2%) | 19 (0.8%) |
| $3,000 or more | 38 (1.1%) | 57 (2.4%) |
| Total | 3,343 (100.0%) | 2,407 (100.0%) |
Physical Housing Characteristics in Front Royal
Housing Structures in Front Royal
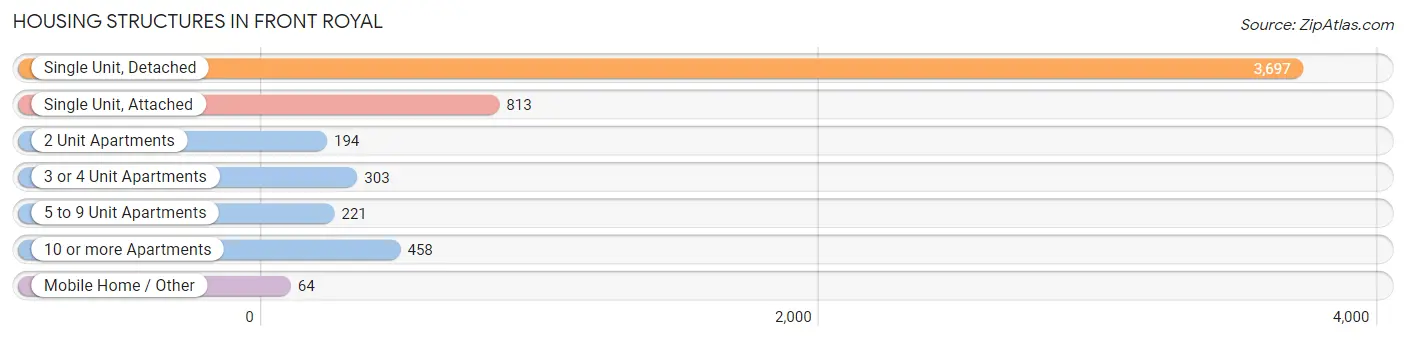
| Structure Type | # Housing Units | % Housing Units |
| Single Unit, Detached | 3,697 | 64.3% |
| Single Unit, Attached | 813 | 14.1% |
| 2 Unit Apartments | 194 | 3.4% |
| 3 or 4 Unit Apartments | 303 | 5.3% |
| 5 to 9 Unit Apartments | 221 | 3.8% |
| 10 or more Apartments | 458 | 8.0% |
| Mobile Home / Other | 64 | 1.1% |
| Total | 5,750 | 100.0% |
Housing Structures by Occupancy in Front Royal
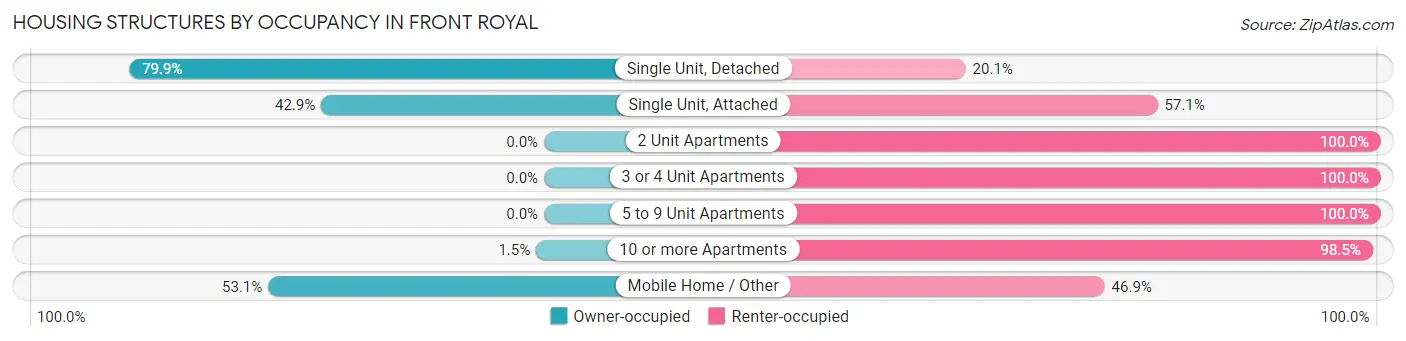
| Structure Type | Owner-occupied | Renter-occupied |
| Single Unit, Detached | 2,953 (79.9%) | 744 (20.1%) |
| Single Unit, Attached | 349 (42.9%) | 464 (57.1%) |
| 2 Unit Apartments | 0 (0.0%) | 194 (100.0%) |
| 3 or 4 Unit Apartments | 0 (0.0%) | 303 (100.0%) |
| 5 to 9 Unit Apartments | 0 (0.0%) | 221 (100.0%) |
| 10 or more Apartments | 7 (1.5%) | 451 (98.5%) |
| Mobile Home / Other | 34 (53.1%) | 30 (46.9%) |
| Total | 3,343 (58.1%) | 2,407 (41.9%) |
Housing Structures by Number of Rooms in Front Royal
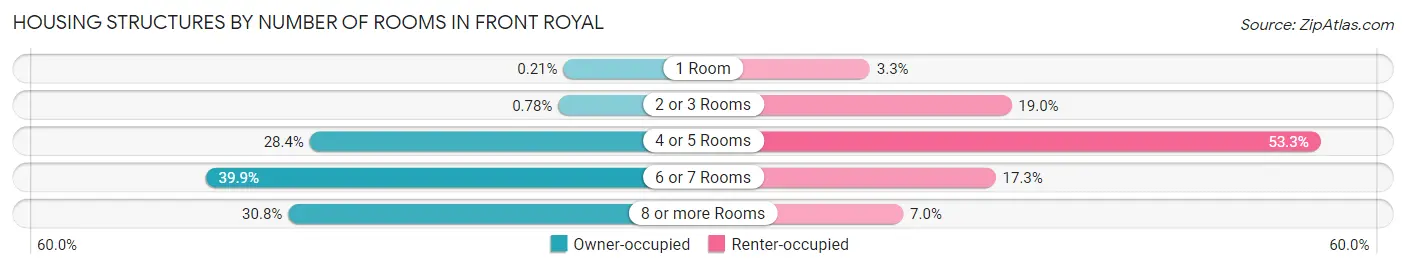
| Number of Rooms | Owner-occupied | Renter-occupied |
| 1 Room | 7 (0.2%) | 80 (3.3%) |
| 2 or 3 Rooms | 26 (0.8%) | 458 (19.0%) |
| 4 or 5 Rooms | 948 (28.4%) | 1,284 (53.3%) |
| 6 or 7 Rooms | 1,334 (39.9%) | 416 (17.3%) |
| 8 or more Rooms | 1,028 (30.7%) | 169 (7.0%) |
| Total | 3,343 (100.0%) | 2,407 (100.0%) |
Housing Structure by Heating Type in Front Royal
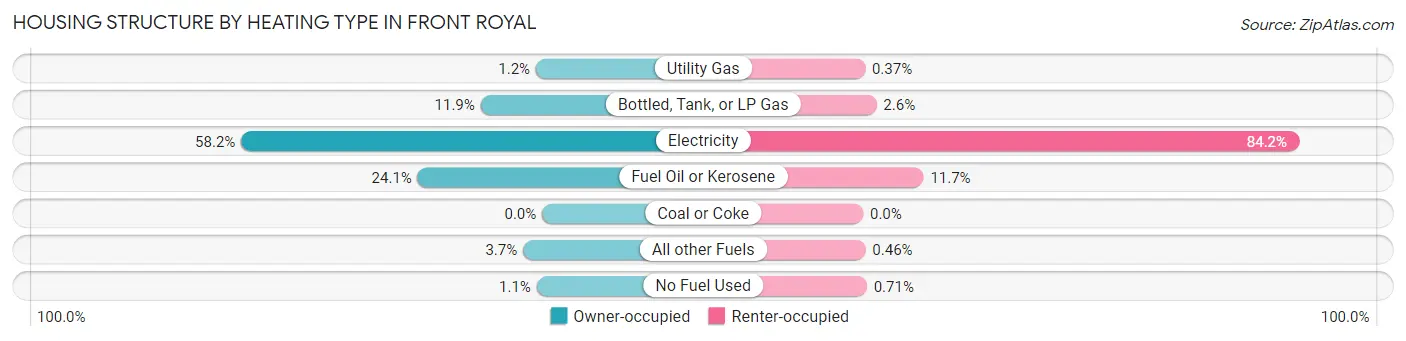
| Heating Type | Owner-occupied | Renter-occupied |
| Utility Gas | 40 (1.2%) | 9 (0.4%) |
| Bottled, Tank, or LP Gas | 397 (11.9%) | 62 (2.6%) |
| Electricity | 1,944 (58.2%) | 2,027 (84.2%) |
| Fuel Oil or Kerosene | 804 (24.0%) | 281 (11.7%) |
| Coal or Coke | 0 (0.0%) | 0 (0.0%) |
| All other Fuels | 123 (3.7%) | 11 (0.5%) |
| No Fuel Used | 35 (1.1%) | 17 (0.7%) |
| Total | 3,343 (100.0%) | 2,407 (100.0%) |
Household Vehicle Usage in Front Royal
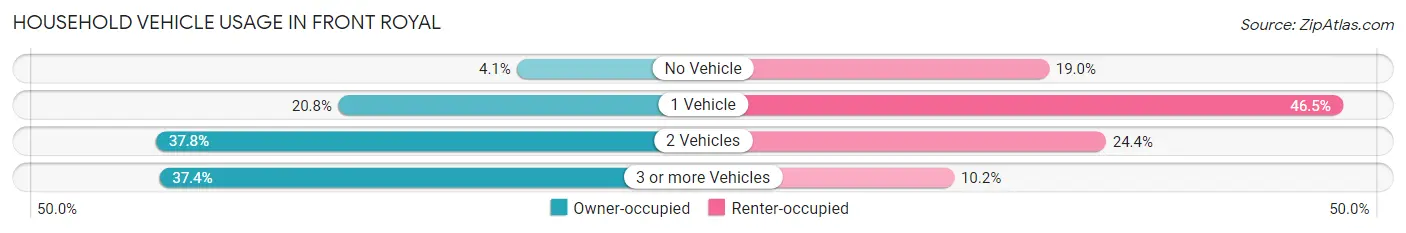
| Vehicles per Household | Owner-occupied | Renter-occupied |
| No Vehicle | 136 (4.1%) | 458 (19.0%) |
| 1 Vehicle | 694 (20.8%) | 1,118 (46.5%) |
| 2 Vehicles | 1,262 (37.8%) | 586 (24.3%) |
| 3 or more Vehicles | 1,251 (37.4%) | 245 (10.2%) |
| Total | 3,343 (100.0%) | 2,407 (100.0%) |
Real Estate & Mortgages in Front Royal
Real Estate and Mortgage Overview in Front Royal
| Characteristic | Without Mortgage | With Mortgage |
| Housing Units | 956 | 2,387 |
| Median Property Value | $235,100 | $279,100 |
| Median Household Income | $61,071 | $567 |
| Monthly Housing Costs | $447 | $38 |
| Real Estate Taxes | $1,364 | $100 |
Property Value by Mortgage Status in Front Royal
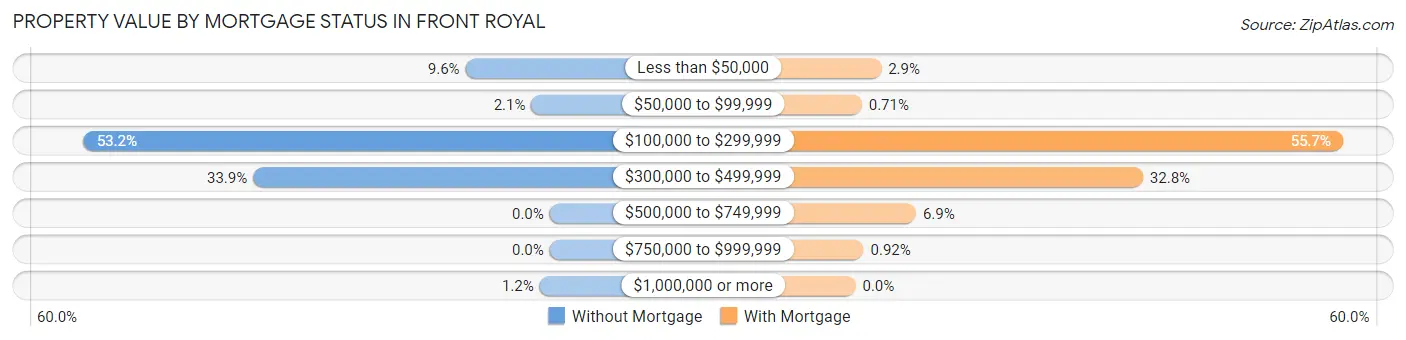
| Property Value | Without Mortgage | With Mortgage |
| Less than $50,000 | 92 (9.6%) | 70 (2.9%) |
| $50,000 to $99,999 | 20 (2.1%) | 17 (0.7%) |
| $100,000 to $299,999 | 509 (53.2%) | 1,329 (55.7%) |
| $300,000 to $499,999 | 324 (33.9%) | 784 (32.8%) |
| $500,000 to $749,999 | 0 (0.0%) | 165 (6.9%) |
| $750,000 to $999,999 | 0 (0.0%) | 22 (0.9%) |
| $1,000,000 or more | 11 (1.1%) | 0 (0.0%) |
| Total | 956 (100.0%) | 2,387 (100.0%) |
Household Income by Mortgage Status in Front Royal
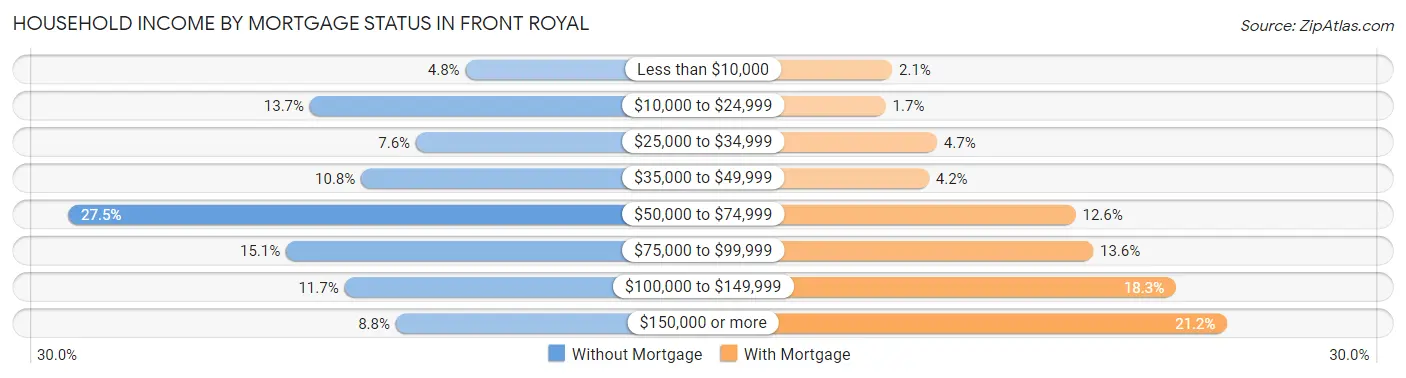
| Household Income | Without Mortgage | With Mortgage |
| Less than $10,000 | 46 (4.8%) | 50 (2.1%) |
| $10,000 to $24,999 | 131 (13.7%) | 41 (1.7%) |
| $25,000 to $34,999 | 73 (7.6%) | 111 (4.6%) |
| $35,000 to $49,999 | 103 (10.8%) | 100 (4.2%) |
| $50,000 to $74,999 | 263 (27.5%) | 300 (12.6%) |
| $75,000 to $99,999 | 144 (15.1%) | 324 (13.6%) |
| $100,000 to $149,999 | 112 (11.7%) | 437 (18.3%) |
| $150,000 or more | 84 (8.8%) | 507 (21.2%) |
| Total | 956 (100.0%) | 2,387 (100.0%) |
Property Value to Household Income Ratio in Front Royal
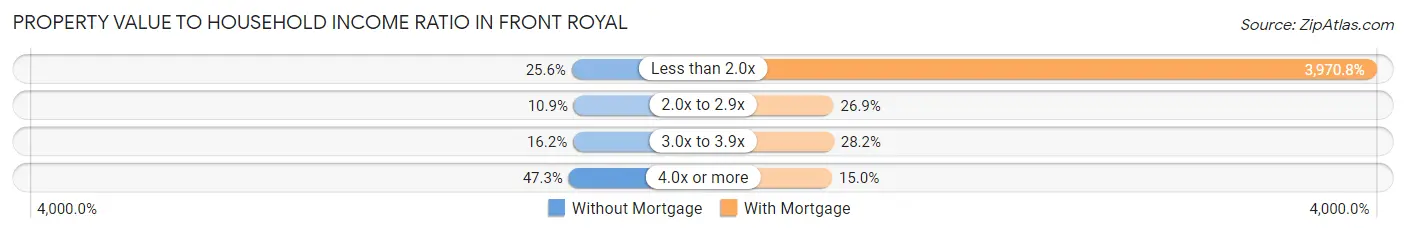
| Value-to-Income Ratio | Without Mortgage | With Mortgage |
| Less than 2.0x | 245 (25.6%) | 94,783 (3,970.8%) |
| 2.0x to 2.9x | 104 (10.9%) | 641 (26.9%) |
| 3.0x to 3.9x | 155 (16.2%) | 673 (28.2%) |
| 4.0x or more | 452 (47.3%) | 357 (15.0%) |
| Total | 956 (100.0%) | 2,387 (100.0%) |
Real Estate Taxes by Mortgage Status in Front Royal
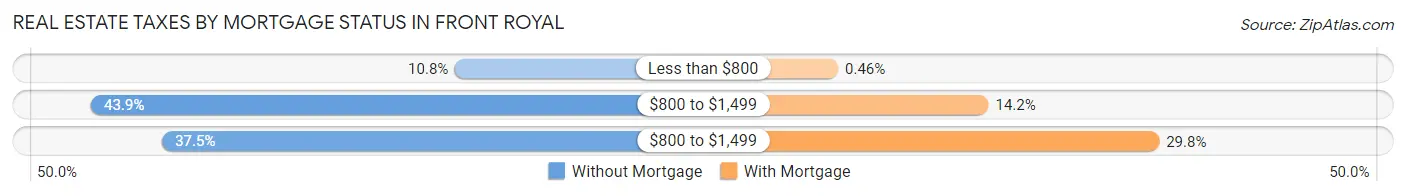
| Property Taxes | Without Mortgage | With Mortgage |
| Less than $800 | 103 (10.8%) | 11 (0.5%) |
| $800 to $1,499 | 420 (43.9%) | 339 (14.2%) |
| $800 to $1,499 | 358 (37.4%) | 711 (29.8%) |
| Total | 956 (100.0%) | 2,387 (100.0%) |
Health & Disability in Front Royal
Health Insurance Coverage by Age in Front Royal
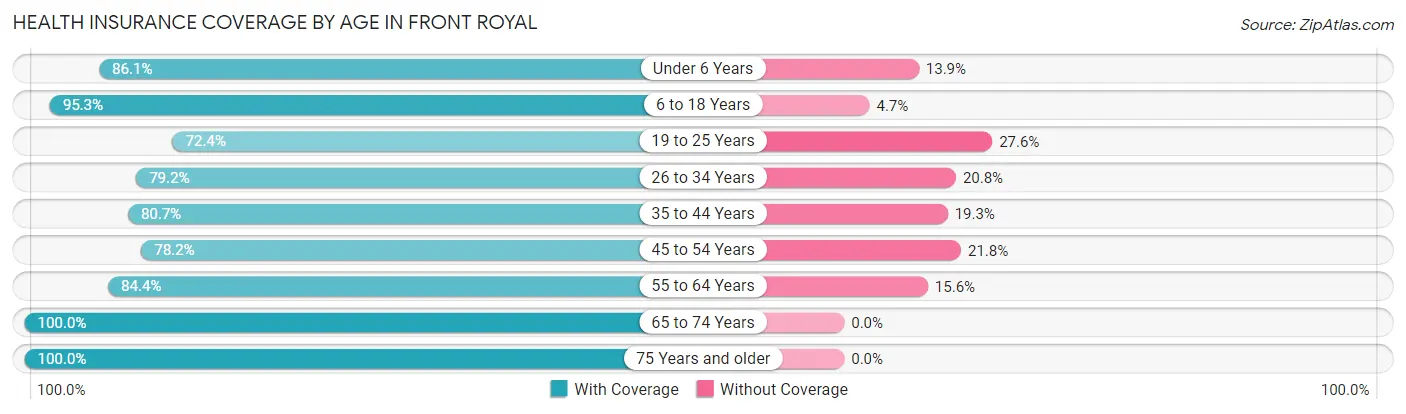
| Age Bracket | With Coverage | Without Coverage |
| Under 6 Years | 979 (86.1%) | 158 (13.9%) |
| 6 to 18 Years | 2,426 (95.3%) | 120 (4.7%) |
| 19 to 25 Years | 772 (72.4%) | 294 (27.6%) |
| 26 to 34 Years | 1,574 (79.2%) | 414 (20.8%) |
| 35 to 44 Years | 1,541 (80.7%) | 368 (19.3%) |
| 45 to 54 Years | 1,150 (78.2%) | 320 (21.8%) |
| 55 to 64 Years | 1,954 (84.4%) | 361 (15.6%) |
| 65 to 74 Years | 1,496 (100.0%) | 0 (0.0%) |
| 75 Years and older | 946 (100.0%) | 0 (0.0%) |
| Total | 12,838 (86.3%) | 2,035 (13.7%) |
Health Insurance Coverage by Citizenship Status in Front Royal
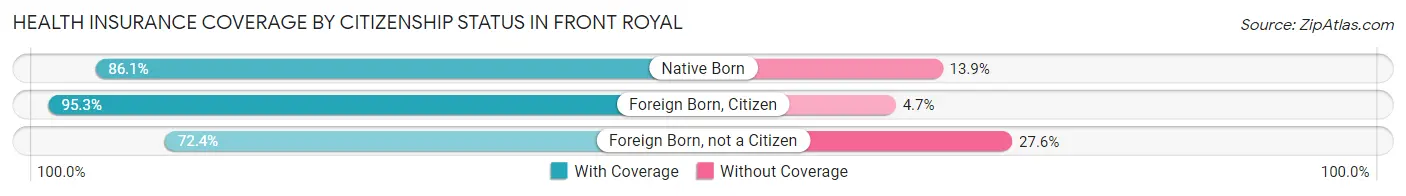
| Citizenship Status | With Coverage | Without Coverage |
| Native Born | 979 (86.1%) | 158 (13.9%) |
| Foreign Born, Citizen | 2,426 (95.3%) | 120 (4.7%) |
| Foreign Born, not a Citizen | 772 (72.4%) | 294 (27.6%) |
Health Insurance Coverage by Household Income in Front Royal
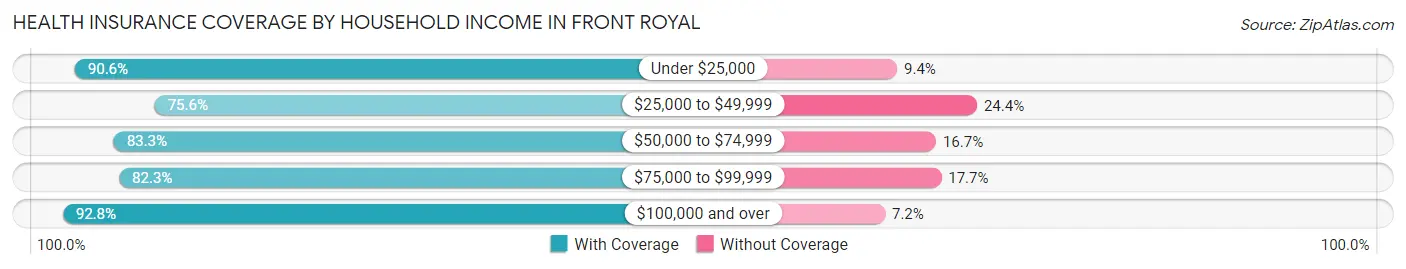
| Household Income | With Coverage | Without Coverage |
| Under $25,000 | 1,635 (90.6%) | 170 (9.4%) |
| $25,000 to $49,999 | 1,776 (75.6%) | 573 (24.4%) |
| $50,000 to $74,999 | 2,567 (83.3%) | 515 (16.7%) |
| $75,000 to $99,999 | 1,715 (82.3%) | 369 (17.7%) |
| $100,000 and over | 5,111 (92.8%) | 394 (7.2%) |
Public vs Private Health Insurance Coverage by Age in Front Royal
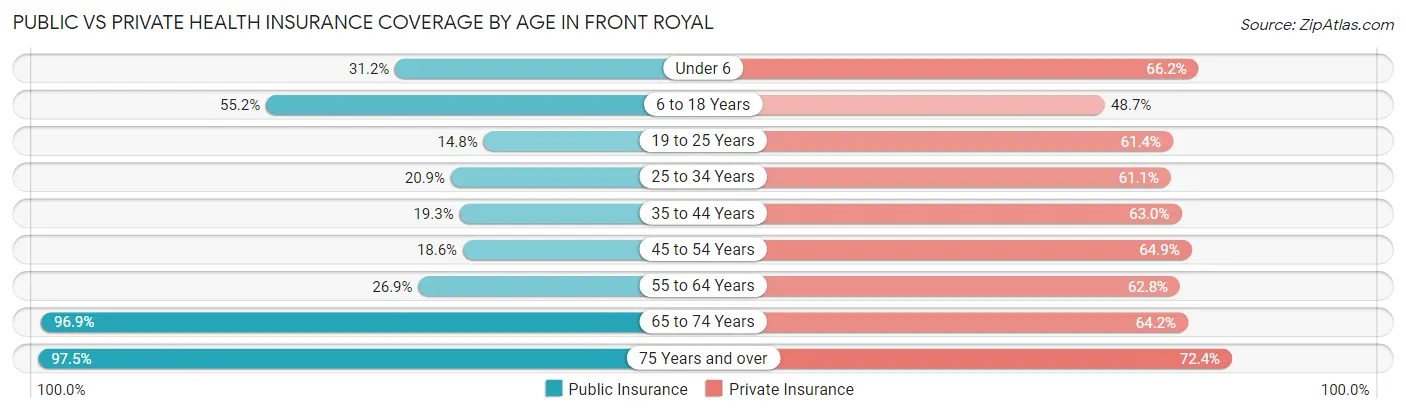
| Age Bracket | Public Insurance | Private Insurance |
| Under 6 | 355 (31.2%) | 753 (66.2%) |
| 6 to 18 Years | 1,405 (55.2%) | 1,240 (48.7%) |
| 19 to 25 Years | 158 (14.8%) | 655 (61.4%) |
| 25 to 34 Years | 415 (20.9%) | 1,214 (61.1%) |
| 35 to 44 Years | 368 (19.3%) | 1,203 (63.0%) |
| 45 to 54 Years | 274 (18.6%) | 954 (64.9%) |
| 55 to 64 Years | 623 (26.9%) | 1,453 (62.8%) |
| 65 to 74 Years | 1,450 (96.9%) | 961 (64.2%) |
| 75 Years and over | 922 (97.5%) | 685 (72.4%) |
| Total | 5,970 (40.1%) | 9,118 (61.3%) |
Disability Status by Sex by Age in Front Royal
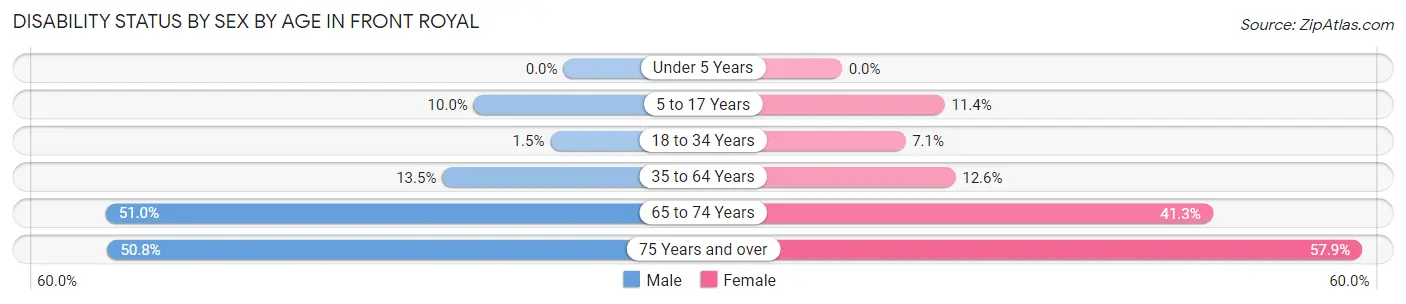
| Age Bracket | Male | Female |
| Under 5 Years | 0 (0.0%) | 0 (0.0%) |
| 5 to 17 Years | 156 (10.0%) | 123 (11.4%) |
| 18 to 34 Years | 20 (1.5%) | 130 (7.1%) |
| 35 to 64 Years | 385 (13.5%) | 359 (12.6%) |
| 65 to 74 Years | 376 (50.9%) | 313 (41.3%) |
| 75 Years and over | 199 (50.8%) | 321 (57.9%) |
Disability Class by Sex by Age in Front Royal
Disability Class: Hearing Difficulty
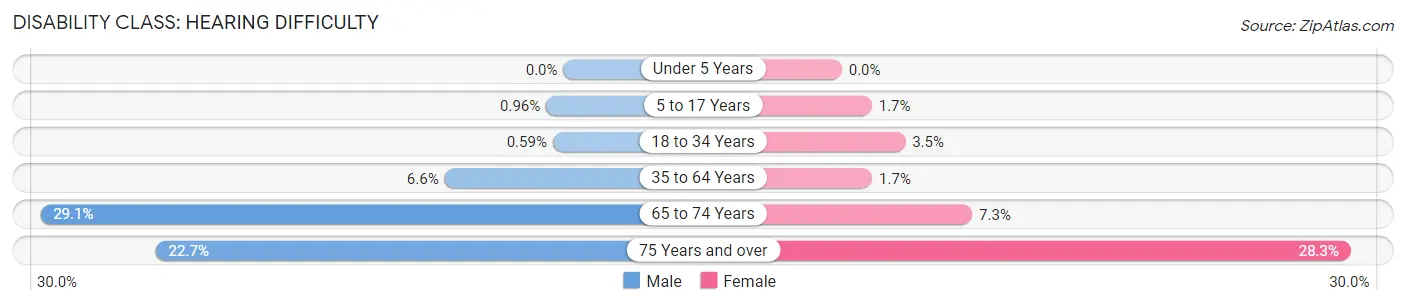
| Age Bracket | Male | Female |
| Under 5 Years | 0 (0.0%) | 0 (0.0%) |
| 5 to 17 Years | 15 (1.0%) | 18 (1.7%) |
| 18 to 34 Years | 8 (0.6%) | 65 (3.5%) |
| 35 to 64 Years | 189 (6.6%) | 48 (1.7%) |
| 65 to 74 Years | 215 (29.1%) | 55 (7.3%) |
| 75 Years and over | 89 (22.7%) | 157 (28.3%) |
Disability Class: Vision Difficulty
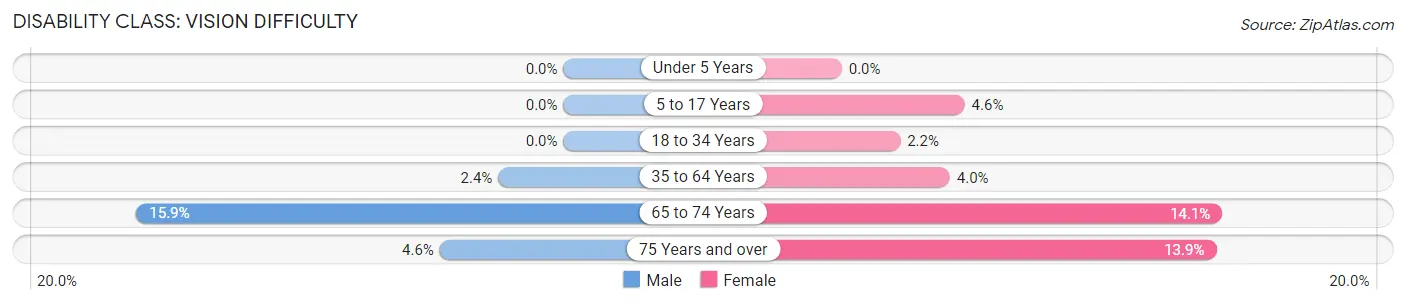
| Age Bracket | Male | Female |
| Under 5 Years | 0 (0.0%) | 0 (0.0%) |
| 5 to 17 Years | 0 (0.0%) | 49 (4.6%) |
| 18 to 34 Years | 0 (0.0%) | 40 (2.2%) |
| 35 to 64 Years | 69 (2.4%) | 114 (4.0%) |
| 65 to 74 Years | 117 (15.9%) | 107 (14.1%) |
| 75 Years and over | 18 (4.6%) | 77 (13.9%) |
Disability Class: Cognitive Difficulty
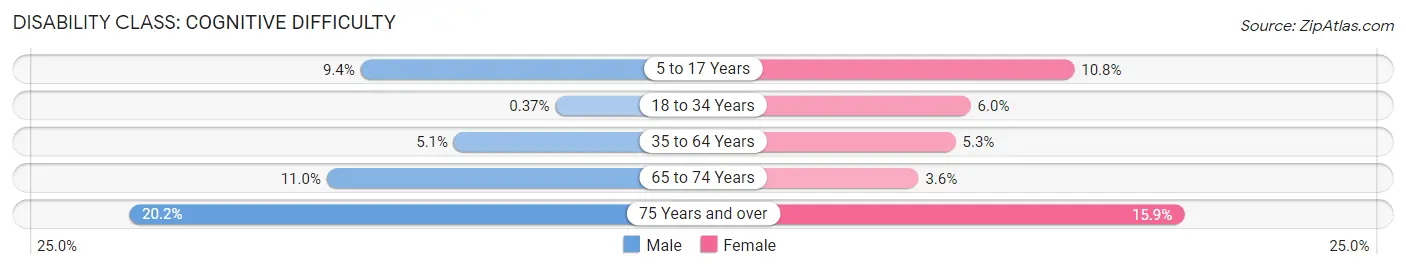
| Age Bracket | Male | Female |
| 5 to 17 Years | 147 (9.4%) | 116 (10.8%) |
| 18 to 34 Years | 5 (0.4%) | 110 (6.0%) |
| 35 to 64 Years | 145 (5.1%) | 150 (5.3%) |
| 65 to 74 Years | 81 (11.0%) | 27 (3.6%) |
| 75 Years and over | 79 (20.2%) | 88 (15.9%) |
Disability Class: Ambulatory Difficulty
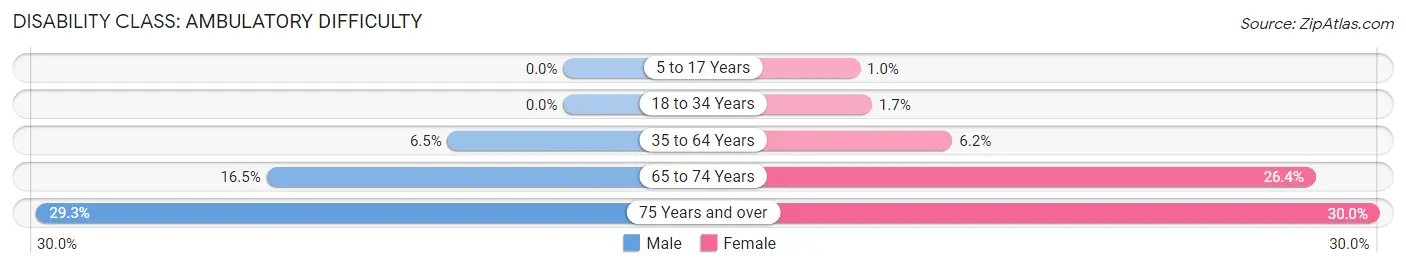
| Age Bracket | Male | Female |
| 5 to 17 Years | 0 (0.0%) | 11 (1.0%) |
| 18 to 34 Years | 0 (0.0%) | 31 (1.7%) |
| 35 to 64 Years | 184 (6.5%) | 175 (6.2%) |
| 65 to 74 Years | 122 (16.5%) | 200 (26.4%) |
| 75 Years and over | 115 (29.3%) | 166 (30.0%) |
Disability Class: Self-Care Difficulty
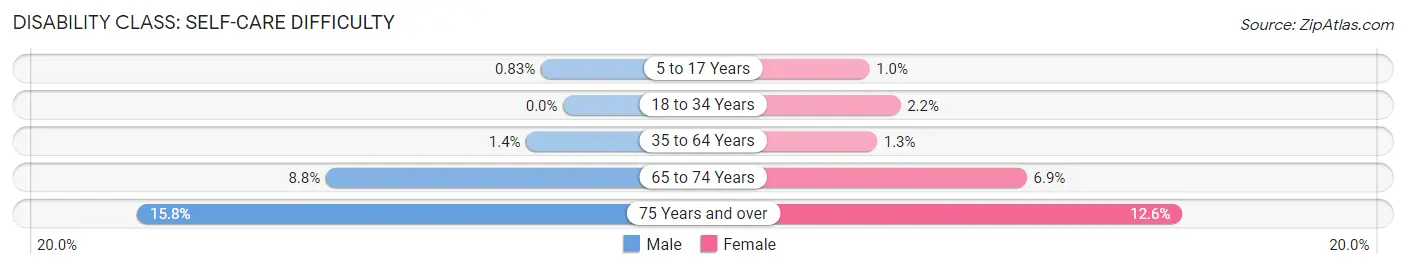
| Age Bracket | Male | Female |
| 5 to 17 Years | 13 (0.8%) | 11 (1.0%) |
| 18 to 34 Years | 0 (0.0%) | 40 (2.2%) |
| 35 to 64 Years | 39 (1.4%) | 37 (1.3%) |
| 65 to 74 Years | 65 (8.8%) | 52 (6.9%) |
| 75 Years and over | 62 (15.8%) | 70 (12.6%) |
Technology Access in Front Royal
Computing Device Access in Front Royal
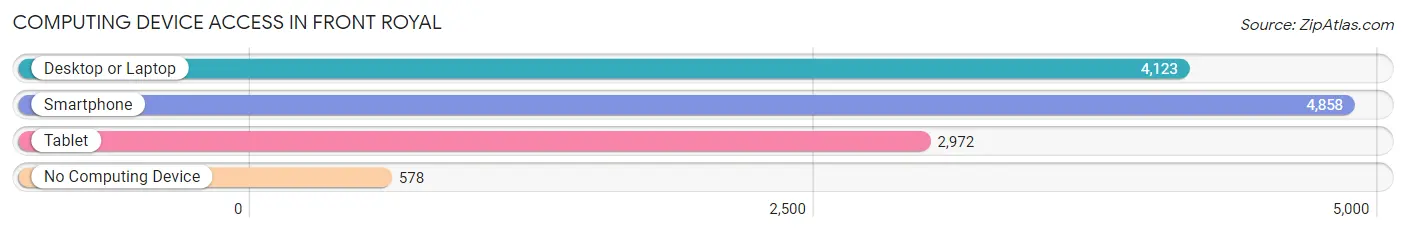
| Device Type | # Households | % Households |
| Desktop or Laptop | 4,123 | 71.7% |
| Smartphone | 4,858 | 84.5% |
| Tablet | 2,972 | 51.7% |
| No Computing Device | 578 | 10.1% |
| Total | 5,750 | 100.0% |
Internet Access in Front Royal
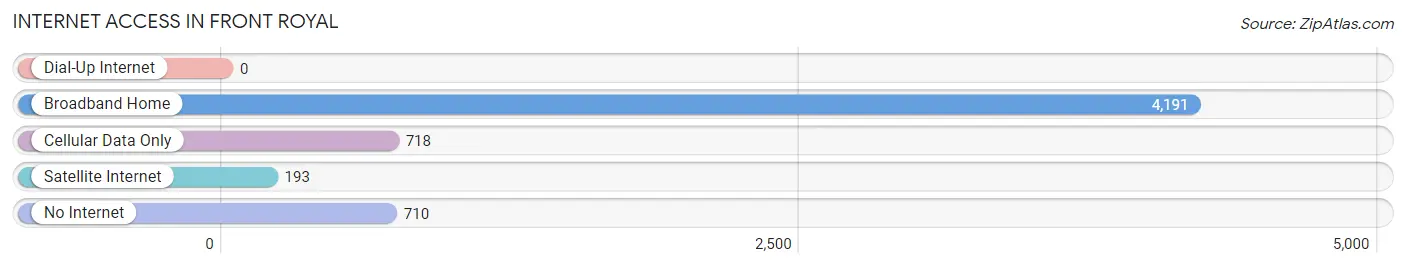
| Internet Type | # Households | % Households |
| Dial-Up Internet | 0 | 0.0% |
| Broadband Home | 4,191 | 72.9% |
| Cellular Data Only | 718 | 12.5% |
| Satellite Internet | 193 | 3.4% |
| No Internet | 710 | 12.3% |
| Total | 5,750 | 100.0% |
Front Royal Summary
Royal, Virginia is a town located in the northern part of the Shenandoah Valley in Warren County, Virginia. It is the county seat of Warren County and is located at the confluence of the North and South Forks of the Shenandoah River. The town is situated at the base of the Blue Ridge Mountains and is the gateway to the Shenandoah National Park. The population of Royal, Virginia was estimated to be 14,440 in 2019.
History
The area that is now Royal, Virginia was first settled in the early 1700s by German and Scots-Irish immigrants. The town was originally known as LeHewtown, named after the LeHew family who were among the first settlers. In 1786, the town was renamed Royal, Virginia in honor of the Royal Governor of Virginia, Lord Dunmore.
During the Civil War, Royal, Virginia was the site of several battles, including the Battle of Front Royal in 1862. The town was occupied by Union forces during the war and was the site of a major Confederate victory in 1864.
After the Civil War, Royal, Virginia became an important center for the timber industry. The town was also home to several large mills, including the Royal Woolen Mills, which was the largest woolen mill in the United States at the time.
Geography
Royal, Virginia is located in the northern part of the Shenandoah Valley in Warren County, Virginia. The town is situated at the base of the Blue Ridge Mountains and is the gateway to the Shenandoah National Park. The town is located at the confluence of the North and South Forks of the Shenandoah River.
The climate in Royal, Virginia is humid subtropical, with hot, humid summers and mild winters. The average annual temperature is 57°F (14°C). The average annual precipitation is 43 inches (109 cm).
Economy
The economy of Royal, Virginia is largely based on tourism, agriculture, and manufacturing. The town is home to several wineries, including the Royal Wine Company, which produces award-winning wines. The town is also home to several large manufacturing companies, including the Royal Woolen Mills, which produces woolen fabrics.
The town is also home to several large retail stores, including Walmart, Lowe’s, and Target. The town is also home to several restaurants, including the popular Front Royal Diner.
Demographics
The population of Royal, Virginia was estimated to be 14,440 in 2019. The racial makeup of the town is 87.3% White, 8.2% African American, 0.7% Asian, 0.3% Native American, and 3.5% from other races. The median household income in Royal, Virginia is $50,945. The median age of the population is 38.7 years.
Common Questions
What is Per Capita Income in Front Royal?
Per Capita income in Front Royal is $30,837.
What is the Median Family Income in Front Royal?
Median Family Income in Front Royal is $73,897.
What is the Median Household income in Front Royal?
Median Household Income in Front Royal is $62,735.
What is Income or Wage Gap in Front Royal?
Income or Wage Gap in Front Royal is 16.4%.
Women in Front Royal earn 83.6 cents for every dollar earned by a man.
What is Inequality or Gini Index in Front Royal?
Inequality or Gini Index in Front Royal is 0.42.
What is the Total Population of Front Royal?
Total Population of Front Royal is 15,064.
What is the Total Male Population of Front Royal?
Total Male Population of Front Royal is 7,412.
What is the Total Female Population of Front Royal?
Total Female Population of Front Royal is 7,652.
What is the Ratio of Males per 100 Females in Front Royal?
There are 96.86 Males per 100 Females in Front Royal.
What is the Ratio of Females per 100 Males in Front Royal?
There are 103.24 Females per 100 Males in Front Royal.
What is the Median Population Age in Front Royal?
Median Population Age in Front Royal is 37.7 Years.
What is the Average Family Size in Front Royal
Average Family Size in Front Royal is 3.2 People.
What is the Average Household Size in Front Royal
Average Household Size in Front Royal is 2.6 People.
How Large is the Labor Force in Front Royal?
There are 7,603 People in the Labor Forcein in Front Royal.
What is the Percentage of People in the Labor Force in Front Royal?
64.5% of People are in the Labor Force in Front Royal.
What is the Unemployment Rate in Front Royal?
Unemployment Rate in Front Royal is 7.5%.