Cities with the Fewest Births per 1,000 Women Receiving Public Assitance in Mississippi
RELATED REPORTS & OPTIONS
Lowest Birth Rate | Public Income
Mississippi
Compare Cities
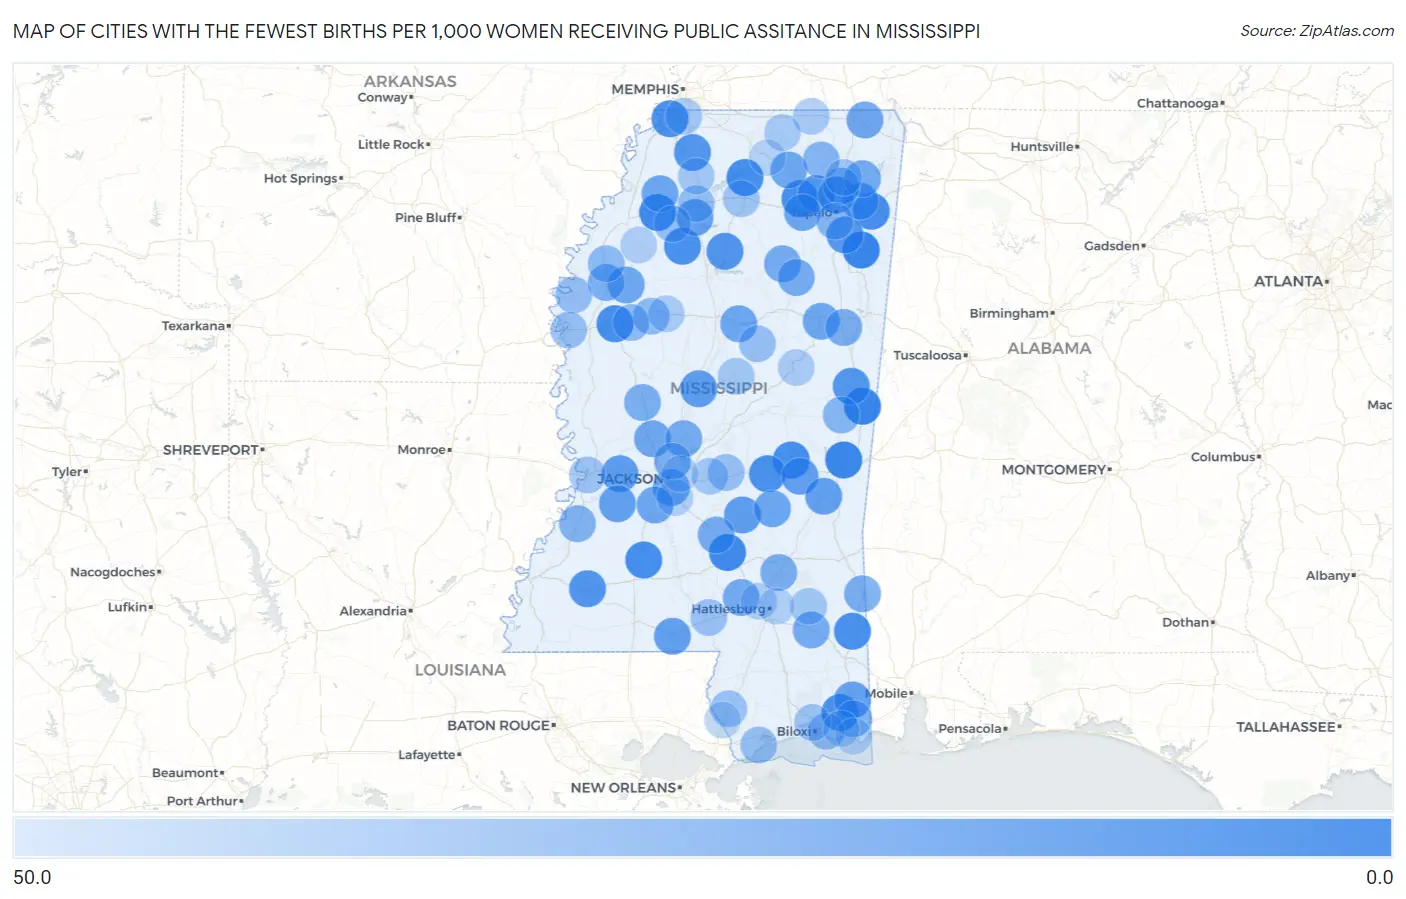
Map of Cities with the Fewest Births per 1,000 Women Receiving Public Assitance in Mississippi
50.0
0.0
Cities with the Fewest Births per 1,000 Women Receiving Public Assitance in Mississippi
| City | Births / 1,000 Women | vs State | vs National | |
| 1. | Amory | 4.0 | 55.0(-51.0)#1 | 52.0(-48.0)#56 |
| 2. | Scooba | 4.0 | 55.0(-51.0)#2 | 52.0(-48.0)#80 |
| 3. | Marion | 5.0 | 55.0(-50.0)#3 | 52.0(-47.0)#109 |
| 4. | Marks | 7.0 | 55.0(-48.0)#4 | 52.0(-45.0)#242 |
| 5. | Mount Olive | 7.0 | 55.0(-48.0)#5 | 52.0(-45.0)#252 |
| 6. | Indianola | 8.0 | 55.0(-47.0)#6 | 52.0(-44.0)#289 |
| 7. | Decatur | 8.0 | 55.0(-47.0)#7 | 52.0(-44.0)#327 |
| 8. | Wesson | 8.0 | 55.0(-47.0)#8 | 52.0(-44.0)#328 |
| 9. | Ecru | 8.0 | 55.0(-47.0)#9 | 52.0(-44.0)#351 |
| 10. | Abbeville | 8.0 | 55.0(-47.0)#10 | 52.0(-44.0)#374 |
| 11. | Fulton | 9.0 | 55.0(-46.0)#11 | 52.0(-43.0)#407 |
| 12. | Leakesville | 10.0 | 55.0(-45.0)#12 | 52.0(-42.0)#500 |
| 13. | Vancleave | 10.0 | 55.0(-45.0)#13 | 52.0(-42.0)#503 |
| 14. | Charleston | 10.0 | 55.0(-45.0)#14 | 52.0(-42.0)#526 |
| 15. | Walls | 10.0 | 55.0(-45.0)#15 | 52.0(-42.0)#553 |
| 16. | Lake | 10.0 | 55.0(-45.0)#16 | 52.0(-42.0)#590 |
| 17. | Coffeeville | 12.0 | 55.0(-43.0)#17 | 52.0(-40.0)#801 |
| 18. | Meadville | 12.0 | 55.0(-43.0)#18 | 52.0(-40.0)#824 |
| 19. | Blue Springs | 12.0 | 55.0(-43.0)#19 | 52.0(-40.0)#845 |
| 20. | Coldwater | 13.0 | 55.0(-42.0)#20 | 52.0(-39.0)#927 |
| 21. | Shuqualak | 13.0 | 55.0(-42.0)#21 | 52.0(-39.0)#972 |
| 22. | Saltillo | 14.0 | 55.0(-41.0)#22 | 52.0(-38.0)#1,017 |
| 23. | Nettleton | 14.0 | 55.0(-41.0)#23 | 52.0(-38.0)#1,057 |
| 24. | Goodman | 16.0 | 55.0(-39.0)#24 | 52.0(-36.0)#1,400 |
| 25. | Raleigh | 16.0 | 55.0(-39.0)#25 | 52.0(-36.0)#1,415 |
| 26. | Edwards | 16.0 | 55.0(-39.0)#26 | 52.0(-36.0)#1,423 |
| 27. | Hickory | 17.0 | 55.0(-38.0)#27 | 52.0(-35.0)#1,625 |
| 28. | Tylertown | 18.0 | 55.0(-37.0)#28 | 52.0(-34.0)#1,727 |
| 29. | Mantachie | 18.0 | 55.0(-37.0)#29 | 52.0(-34.0)#1,742 |
| 30. | Utica | 18.0 | 55.0(-37.0)#30 | 52.0(-34.0)#1,777 |
| 31. | Enterprise | 18.0 | 55.0(-37.0)#31 | 52.0(-34.0)#1,807 |
| 32. | Wade | 19.0 | 55.0(-36.0)#32 | 52.0(-33.0)#1,915 |
| 33. | Pope | 19.0 | 55.0(-36.0)#33 | 52.0(-33.0)#1,963 |
| 34. | Starkville | 21.0 | 55.0(-34.0)#34 | 52.0(-31.0)#2,186 |
| 35. | Richland | 21.0 | 55.0(-34.0)#35 | 52.0(-31.0)#2,217 |
| 36. | Terry | 21.0 | 55.0(-34.0)#36 | 52.0(-31.0)#2,275 |
| 37. | Kilmichael | 21.0 | 55.0(-34.0)#37 | 52.0(-31.0)#2,309 |
| 38. | Myrtle | 21.0 | 55.0(-34.0)#38 | 52.0(-31.0)#2,318 |
| 39. | Louin | 21.0 | 55.0(-34.0)#39 | 52.0(-31.0)#2,337 |
| 40. | Falcon | 21.0 | 55.0(-34.0)#40 | 52.0(-31.0)#2,355 |
| 41. | Pontotoc | 22.0 | 55.0(-33.0)#41 | 52.0(-30.0)#2,396 |
| 42. | Ruleville | 22.0 | 55.0(-33.0)#42 | 52.0(-30.0)#2,433 |
| 43. | Farmington | 22.0 | 55.0(-33.0)#43 | 52.0(-30.0)#2,434 |
| 44. | Oak Grove | 22.0 | 55.0(-33.0)#44 | 52.0(-30.0)#2,459 |
| 45. | Kearney Park | 22.0 | 55.0(-33.0)#45 | 52.0(-30.0)#2,494 |
| 46. | Marietta | 23.0 | 55.0(-32.0)#46 | 52.0(-29.0)#2,740 |
| 47. | Canton | 24.0 | 55.0(-31.0)#47 | 52.0(-28.0)#2,766 |
| 48. | Magee | 24.0 | 55.0(-31.0)#48 | 52.0(-28.0)#2,806 |
| 49. | Sumrall | 24.0 | 55.0(-31.0)#49 | 52.0(-28.0)#2,836 |
| 50. | Vardaman | 24.0 | 55.0(-31.0)#50 | 52.0(-28.0)#2,885 |
| 51. | Beaumont | 24.0 | 55.0(-31.0)#51 | 52.0(-28.0)#2,888 |
| 52. | Woodland | 24.0 | 55.0(-31.0)#52 | 52.0(-28.0)#2,950 |
| 53. | Ridgeland | 25.0 | 55.0(-30.0)#53 | 52.0(-27.0)#2,965 |
| 54. | Ellisville | 25.0 | 55.0(-30.0)#54 | 52.0(-27.0)#3,007 |
| 55. | State Line | 25.0 | 55.0(-30.0)#55 | 52.0(-27.0)#3,107 |
| 56. | Artesia | 25.0 | 55.0(-30.0)#56 | 52.0(-27.0)#3,141 |
| 57. | Cleveland | 26.0 | 55.0(-29.0)#57 | 52.0(-26.0)#3,196 |
| 58. | Yazoo City | 26.0 | 55.0(-29.0)#58 | 52.0(-26.0)#3,197 |
| 59. | Escatawpa | 27.0 | 55.0(-28.0)#59 | 52.0(-25.0)#3,446 |
| 60. | Port Gibson | 28.0 | 55.0(-27.0)#60 | 52.0(-24.0)#3,709 |
| 61. | Guntown | 29.0 | 55.0(-26.0)#61 | 52.0(-23.0)#3,883 |
| 62. | De Kalb | 29.0 | 55.0(-26.0)#62 | 52.0(-23.0)#3,936 |
| 63. | Dumas | 29.0 | 55.0(-26.0)#63 | 52.0(-23.0)#3,976 |
| 64. | Verona | 30.0 | 55.0(-25.0)#64 | 52.0(-22.0)#4,115 |
| 65. | Mound Bayou | 31.0 | 55.0(-24.0)#65 | 52.0(-21.0)#4,380 |
| 66. | Itta Bena | 31.0 | 55.0(-24.0)#66 | 52.0(-21.0)#4,382 |
| 67. | Ocean Springs | 33.0 | 55.0(-22.0)#67 | 52.0(-19.0)#4,696 |
| 68. | Moorhead | 33.0 | 55.0(-22.0)#68 | 52.0(-19.0)#4,822 |
| 69. | Batesville | 34.0 | 55.0(-21.0)#69 | 52.0(-18.0)#4,990 |
| 70. | Crowder | 34.0 | 55.0(-21.0)#70 | 52.0(-18.0)#5,127 |
| 71. | Benoit | 34.0 | 55.0(-21.0)#71 | 52.0(-18.0)#5,135 |
| 72. | Greenville | 35.0 | 55.0(-20.0)#72 | 52.0(-17.0)#5,184 |
| 73. | Waveland | 35.0 | 55.0(-20.0)#73 | 52.0(-17.0)#5,249 |
| 74. | Morton | 35.0 | 55.0(-20.0)#74 | 52.0(-17.0)#5,275 |
| 75. | French Camp | 35.0 | 55.0(-20.0)#75 | 52.0(-17.0)#5,377 |
| 76. | Columbia | 36.0 | 55.0(-19.0)#76 | 52.0(-16.0)#5,478 |
| 77. | Hide A Way Lake | 36.0 | 55.0(-19.0)#77 | 52.0(-16.0)#5,529 |
| 78. | Oxford | 37.0 | 55.0(-18.0)#78 | 52.0(-15.0)#5,667 |
| 79. | Vicksburg | 37.0 | 55.0(-18.0)#79 | 52.0(-15.0)#5,672 |
| 80. | D Iberville | 37.0 | 55.0(-18.0)#80 | 52.0(-15.0)#5,689 |
| 81. | Baldwyn | 38.0 | 55.0(-17.0)#81 | 52.0(-14.0)#6,003 |
| 82. | Pelahatchie | 38.0 | 55.0(-17.0)#82 | 52.0(-14.0)#6,044 |
| 83. | Bogue Chitto Cdp Kemper And Neshoba Counties | 38.0 | 55.0(-17.0)#83 | 52.0(-14.0)#6,122 |
| 84. | Horn Lake | 39.0 | 55.0(-16.0)#84 | 52.0(-13.0)#6,180 |
| 85. | Kosciusko | 39.0 | 55.0(-16.0)#85 | 52.0(-13.0)#6,236 |
| 86. | Como | 39.0 | 55.0(-16.0)#86 | 52.0(-13.0)#6,304 |
| 87. | Richton | 39.0 | 55.0(-16.0)#87 | 52.0(-13.0)#6,322 |
| 88. | Walnut | 40.0 | 55.0(-15.0)#88 | 52.0(-12.0)#6,579 |
| 89. | Ashland | 40.0 | 55.0(-15.0)#89 | 52.0(-12.0)#6,584 |
| 90. | Greenwood | 41.0 | 55.0(-14.0)#90 | 52.0(-11.0)#6,705 |
| 91. | Louisville | 41.0 | 55.0(-14.0)#91 | 52.0(-11.0)#6,755 |
| 92. | Tutwiler | 42.0 | 55.0(-13.0)#92 | 52.0(-10.00)#7,023 |
| 93. | Rawls Springs | 42.0 | 55.0(-13.0)#93 | 52.0(-10.00)#7,034 |
| 94. | Petal | 43.0 | 55.0(-12.0)#94 | 52.0(-9.00)#7,197 |
| 95. | Florence | 43.0 | 55.0(-12.0)#95 | 52.0(-9.00)#7,242 |
| 96. | Pascagoula | 44.0 | 55.0(-11.0)#96 | 52.0(-8.00)#7,448 |
| 97. | Flowood | 44.0 | 55.0(-11.0)#97 | 52.0(-8.00)#7,472 |
| 98. | Potts Camp | 44.0 | 55.0(-11.0)#98 | 52.0(-8.00)#7,620 |
| 99. | Gautier | 45.0 | 55.0(-10.00)#99 | 52.0(-7.00)#7,679 |
| 100. | Nicholson | 45.0 | 55.0(-10.00)#100 | 52.0(-7.00)#7,786 |
Common Questions
What are the Top 10 Cities with the Fewest Births per 1,000 Women Receiving Public Assitance in Mississippi?
Top 10 Cities with the Fewest Births per 1,000 Women Receiving Public Assitance in Mississippi are:
What city has the Fewest Births per 1,000 Women Receiving Public Assitance in Mississippi?
Amory has the Fewest Births per 1,000 Women Receiving Public Assitance in Mississippi with 4.0.
What is the Number of Births per 1,000 Women Receiving Public Assitance in the State of Mississippi?
Number of Births per 1,000 Women Receiving Public Assitance in Mississippi is 55.0.
What is the Number of Births per 1,000 Women Receiving Public Assitance in the United States?
Number of Births per 1,000 Women Receiving Public Assitance in the United States is 52.0.