Cities with the Fewest Births per 1,000 Women Receiving Public Assitance in Iowa
RELATED REPORTS & OPTIONS
Lowest Birth Rate | Public Income
Iowa
Compare Cities
Map of Cities with the Fewest Births per 1,000 Women Receiving Public Assitance in Iowa
30.0
0.0
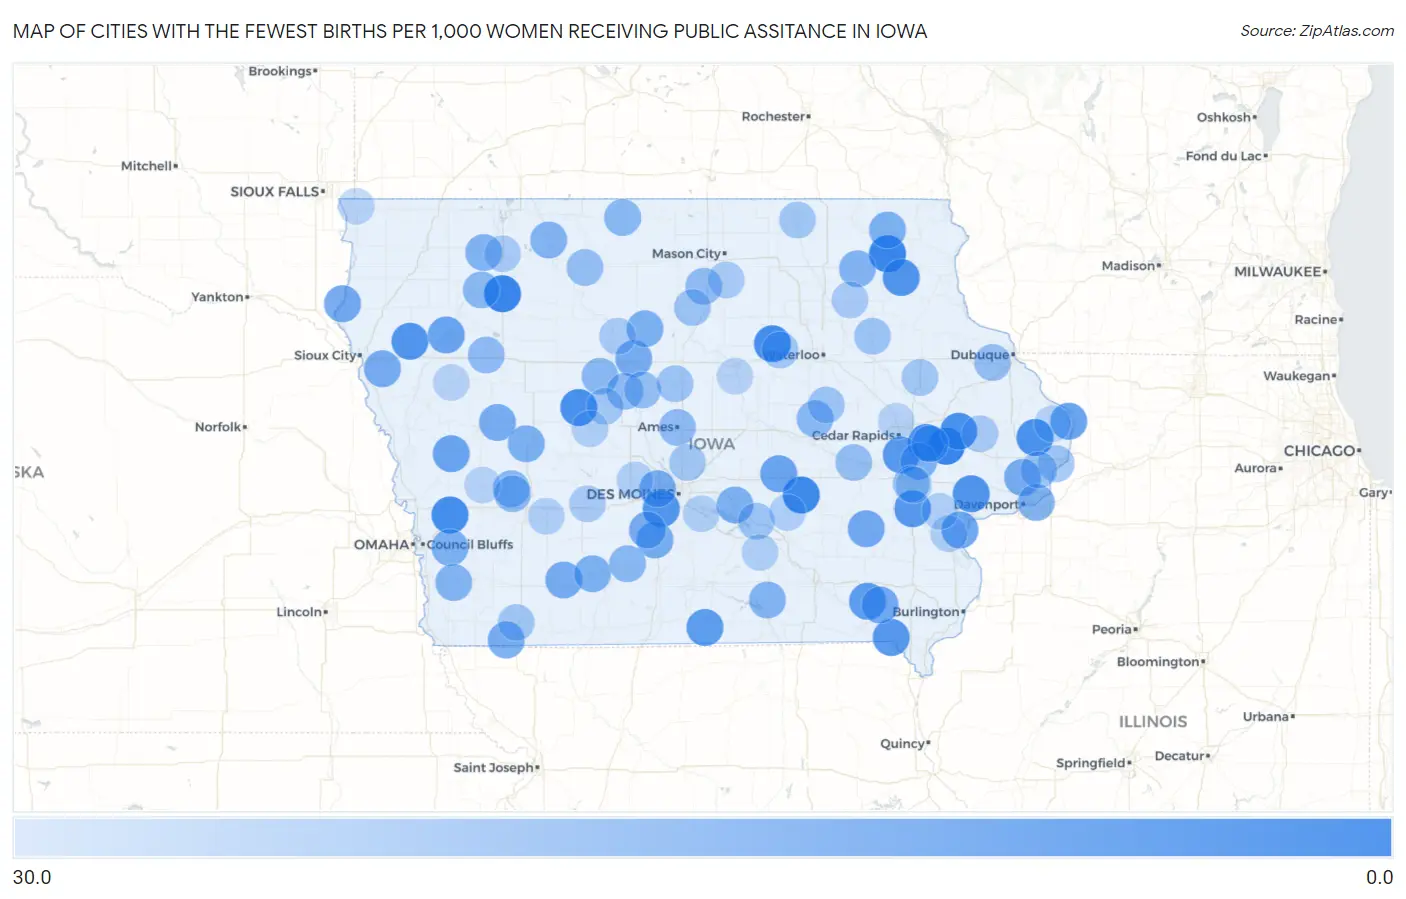
Cities with the Fewest Births per 1,000 Women Receiving Public Assitance in Iowa
| City | Births / 1,000 Women | vs State | vs National | |
| 1. | Mechanicsville | 6.0 | 57.0(-51.0)#1 | 52.0(-46.0)#181 |
| 2. | Ossian | 6.0 | 57.0(-51.0)#2 | 52.0(-46.0)#182 |
| 3. | Sioux Rapids | 6.0 | 57.0(-51.0)#3 | 52.0(-46.0)#184 |
| 4. | Montezuma | 7.0 | 57.0(-50.0)#4 | 52.0(-45.0)#254 |
| 5. | Mount Vernon | 8.0 | 57.0(-49.0)#5 | 52.0(-44.0)#313 |
| 6. | Parkersburg | 8.0 | 57.0(-49.0)#6 | 52.0(-44.0)#345 |
| 7. | Neola | 8.0 | 57.0(-49.0)#7 | 52.0(-44.0)#360 |
| 8. | Olin | 9.0 | 57.0(-48.0)#8 | 52.0(-43.0)#459 |
| 9. | Churdan | 9.0 | 57.0(-48.0)#9 | 52.0(-43.0)#467 |
| 10. | Charlotte | 9.0 | 57.0(-48.0)#10 | 52.0(-43.0)#474 |
| 11. | Wilton | 10.0 | 57.0(-47.0)#11 | 52.0(-42.0)#518 |
| 12. | Kingsley | 10.0 | 57.0(-47.0)#12 | 52.0(-42.0)#554 |
| 13. | Cumming | 10.0 | 57.0(-47.0)#13 | 52.0(-42.0)#585 |
| 14. | Clermont | 10.0 | 57.0(-47.0)#14 | 52.0(-42.0)#592 |
| 15. | Riverside | 11.0 | 57.0(-46.0)#15 | 52.0(-41.0)#672 |
| 16. | Shueyville | 11.0 | 57.0(-46.0)#16 | 52.0(-41.0)#682 |
| 17. | Farmington | 11.0 | 57.0(-46.0)#17 | 52.0(-41.0)#699 |
| 18. | Birmingham | 12.0 | 57.0(-45.0)#18 | 52.0(-40.0)#830 |
| 19. | Allerton | 12.0 | 57.0(-45.0)#19 | 52.0(-40.0)#835 |
| 20. | Sabula | 13.0 | 57.0(-44.0)#20 | 52.0(-39.0)#966 |
| 21. | Grinnell | 14.0 | 57.0(-43.0)#21 | 52.0(-38.0)#999 |
| 22. | Dunlap | 14.0 | 57.0(-43.0)#22 | 52.0(-38.0)#1,066 |
| 23. | Fruitland | 14.0 | 57.0(-43.0)#23 | 52.0(-38.0)#1,081 |
| 24. | Quimby | 14.0 | 57.0(-43.0)#24 | 52.0(-38.0)#1,131 |
| 25. | Akron | 15.0 | 57.0(-42.0)#25 | 52.0(-37.0)#1,235 |
| 26. | Keota | 15.0 | 57.0(-42.0)#26 | 52.0(-37.0)#1,258 |
| 27. | Stockport | 15.0 | 57.0(-42.0)#27 | 52.0(-37.0)#1,296 |
| 28. | Clive | 16.0 | 57.0(-41.0)#28 | 52.0(-36.0)#1,306 |
| 29. | St Charles | 16.0 | 57.0(-41.0)#29 | 52.0(-36.0)#1,422 |
| 30. | Long Grove | 16.0 | 57.0(-41.0)#30 | 52.0(-36.0)#1,438 |
| 31. | Vail | 16.0 | 57.0(-41.0)#31 | 52.0(-36.0)#1,454 |
| 32. | Duncombe | 16.0 | 57.0(-41.0)#32 | 52.0(-36.0)#1,465 |
| 33. | Patterson | 16.0 | 57.0(-41.0)#33 | 52.0(-36.0)#1,468 |
| 34. | Prescott | 16.0 | 57.0(-41.0)#34 | 52.0(-36.0)#1,469 |
| 35. | Bronson | 16.0 | 57.0(-41.0)#35 | 52.0(-36.0)#1,470 |
| 36. | College Springs | 16.0 | 57.0(-41.0)#36 | 52.0(-36.0)#1,481 |
| 37. | Decorah | 17.0 | 57.0(-40.0)#37 | 52.0(-35.0)#1,504 |
| 38. | Creston | 17.0 | 57.0(-40.0)#38 | 52.0(-35.0)#1,505 |
| 39. | Eagle Grove | 17.0 | 57.0(-40.0)#39 | 52.0(-35.0)#1,540 |
| 40. | Solon | 17.0 | 57.0(-40.0)#40 | 52.0(-35.0)#1,549 |
| 41. | Monroe | 17.0 | 57.0(-40.0)#41 | 52.0(-35.0)#1,570 |
| 42. | Treynor | 17.0 | 57.0(-40.0)#42 | 52.0(-35.0)#1,588 |
| 43. | Riverdale | 17.0 | 57.0(-40.0)#43 | 52.0(-35.0)#1,624 |
| 44. | Templeton | 17.0 | 57.0(-40.0)#44 | 52.0(-35.0)#1,635 |
| 45. | Lisbon | 18.0 | 57.0(-39.0)#45 | 52.0(-34.0)#1,740 |
| 46. | Malvern | 18.0 | 57.0(-39.0)#46 | 52.0(-34.0)#1,763 |
| 47. | Graettinger | 18.0 | 57.0(-39.0)#47 | 52.0(-34.0)#1,771 |
| 48. | Everly | 18.0 | 57.0(-39.0)#48 | 52.0(-34.0)#1,797 |
| 49. | Moravia | 18.0 | 57.0(-39.0)#49 | 52.0(-34.0)#1,799 |
| 50. | Waucoma | 18.0 | 57.0(-39.0)#50 | 52.0(-34.0)#1,820 |
| 51. | Callender | 19.0 | 57.0(-38.0)#51 | 52.0(-33.0)#1,976 |
| 52. | Peterson | 19.0 | 57.0(-38.0)#52 | 52.0(-33.0)#1,978 |
| 53. | Lorimor | 19.0 | 57.0(-38.0)#53 | 52.0(-33.0)#1,979 |
| 54. | Kimballton | 19.0 | 57.0(-38.0)#54 | 52.0(-33.0)#1,984 |
| 55. | Lakota | 19.0 | 57.0(-38.0)#55 | 52.0(-33.0)#1,985 |
| 56. | Clutier | 19.0 | 57.0(-38.0)#56 | 52.0(-33.0)#1,987 |
| 57. | Ames | 20.0 | 57.0(-37.0)#57 | 52.0(-32.0)#1,997 |
| 58. | Schaller | 20.0 | 57.0(-37.0)#58 | 52.0(-32.0)#2,135 |
| 59. | Dayton | 20.0 | 57.0(-37.0)#59 | 52.0(-32.0)#2,137 |
| 60. | Elk Horn | 20.0 | 57.0(-37.0)#60 | 52.0(-32.0)#2,152 |
| 61. | Thornton | 20.0 | 57.0(-37.0)#61 | 52.0(-32.0)#2,156 |
| 62. | Marengo | 21.0 | 57.0(-36.0)#62 | 52.0(-31.0)#2,238 |
| 63. | Peosta | 21.0 | 57.0(-36.0)#63 | 52.0(-31.0)#2,264 |
| 64. | University Heights | 21.0 | 57.0(-36.0)#64 | 52.0(-31.0)#2,283 |
| 65. | Stratford | 21.0 | 57.0(-36.0)#65 | 52.0(-31.0)#2,310 |
| 66. | Whittemore | 21.0 | 57.0(-36.0)#66 | 52.0(-31.0)#2,331 |
| 67. | Pella | 22.0 | 57.0(-35.0)#67 | 52.0(-30.0)#2,374 |
| 68. | Camanche | 22.0 | 57.0(-35.0)#68 | 52.0(-30.0)#2,406 |
| 69. | Dysart | 22.0 | 57.0(-35.0)#69 | 52.0(-30.0)#2,462 |
| 70. | Jewell Junction | 22.0 | 57.0(-35.0)#70 | 52.0(-30.0)#2,475 |
| 71. | Hazleton | 22.0 | 57.0(-35.0)#71 | 52.0(-30.0)#2,505 |
| 72. | Mccausland | 22.0 | 57.0(-35.0)#72 | 52.0(-30.0)#2,531 |
| 73. | Alexander | 22.0 | 57.0(-35.0)#73 | 52.0(-30.0)#2,549 |
| 74. | Clarinda | 23.0 | 57.0(-34.0)#74 | 52.0(-29.0)#2,619 |
| 75. | Riceville | 23.0 | 57.0(-34.0)#75 | 52.0(-29.0)#2,696 |
| 76. | Elkhart | 23.0 | 57.0(-34.0)#76 | 52.0(-29.0)#2,717 |
| 77. | Ryan | 23.0 | 57.0(-34.0)#77 | 52.0(-29.0)#2,727 |
| 78. | Stout | 23.0 | 57.0(-34.0)#78 | 52.0(-29.0)#2,732 |
| 79. | Paton | 23.0 | 57.0(-34.0)#79 | 52.0(-29.0)#2,736 |
| 80. | Spencer | 24.0 | 57.0(-33.0)#80 | 52.0(-28.0)#2,762 |
| 81. | Sumner | 24.0 | 57.0(-33.0)#81 | 52.0(-28.0)#2,837 |
| 82. | Rockwell | 24.0 | 57.0(-33.0)#82 | 52.0(-28.0)#2,883 |
| 83. | Oxford Junction | 24.0 | 57.0(-33.0)#83 | 52.0(-28.0)#2,903 |
| 84. | Badger | 24.0 | 57.0(-33.0)#84 | 52.0(-28.0)#2,908 |
| 85. | Menlo | 24.0 | 57.0(-33.0)#85 | 52.0(-28.0)#2,924 |
| 86. | Jefferson | 25.0 | 57.0(-32.0)#86 | 52.0(-27.0)#3,015 |
| 87. | Dallas Center | 25.0 | 57.0(-32.0)#87 | 52.0(-27.0)#3,059 |
| 88. | New Sharon | 25.0 | 57.0(-32.0)#88 | 52.0(-27.0)#3,084 |
| 89. | Anita | 25.0 | 57.0(-32.0)#89 | 52.0(-27.0)#3,095 |
| 90. | Hartford | 25.0 | 57.0(-32.0)#90 | 52.0(-27.0)#3,124 |
| 91. | Bussey | 25.0 | 57.0(-32.0)#91 | 52.0(-27.0)#3,138 |
| 92. | Letts | 25.0 | 57.0(-32.0)#92 | 52.0(-27.0)#3,143 |
| 93. | Nichols | 25.0 | 57.0(-32.0)#93 | 52.0(-27.0)#3,147 |
| 94. | Iowa City | 26.0 | 57.0(-31.0)#94 | 52.0(-26.0)#3,156 |
| 95. | Hiawatha | 26.0 | 57.0(-31.0)#95 | 52.0(-26.0)#3,217 |
| 96. | Harlan | 26.0 | 57.0(-31.0)#96 | 52.0(-26.0)#3,230 |
| 97. | Eldora | 26.0 | 57.0(-31.0)#97 | 52.0(-26.0)#3,258 |
| 98. | Larchwood | 26.0 | 57.0(-31.0)#98 | 52.0(-26.0)#3,299 |
| 99. | Battle Creek | 26.0 | 57.0(-31.0)#99 | 52.0(-26.0)#3,308 |
| 100. | Miles | 26.0 | 57.0(-31.0)#100 | 52.0(-26.0)#3,332 |
Common Questions
What are the Top 10 Cities with the Fewest Births per 1,000 Women Receiving Public Assitance in Iowa?
Top 10 Cities with the Fewest Births per 1,000 Women Receiving Public Assitance in Iowa are:
#1
6.0
#2
6.0
#3
6.0
#4
7.0
#5
8.0
#6
8.0
#7
8.0
#8
9.0
#9
9.0
#10
9.0
What city has the Fewest Births per 1,000 Women Receiving Public Assitance in Iowa?
Mechanicsville has the Fewest Births per 1,000 Women Receiving Public Assitance in Iowa with 6.0.
What is the Number of Births per 1,000 Women Receiving Public Assitance in the State of Iowa?
Number of Births per 1,000 Women Receiving Public Assitance in Iowa is 57.0.
What is the Number of Births per 1,000 Women Receiving Public Assitance in the United States?
Number of Births per 1,000 Women Receiving Public Assitance in the United States is 52.0.