Cities with the Fewest Births per 1,000 Women Receiving Public Assitance in North Carolina
RELATED REPORTS & OPTIONS
Lowest Birth Rate | Public Income
North Carolina
Compare Cities
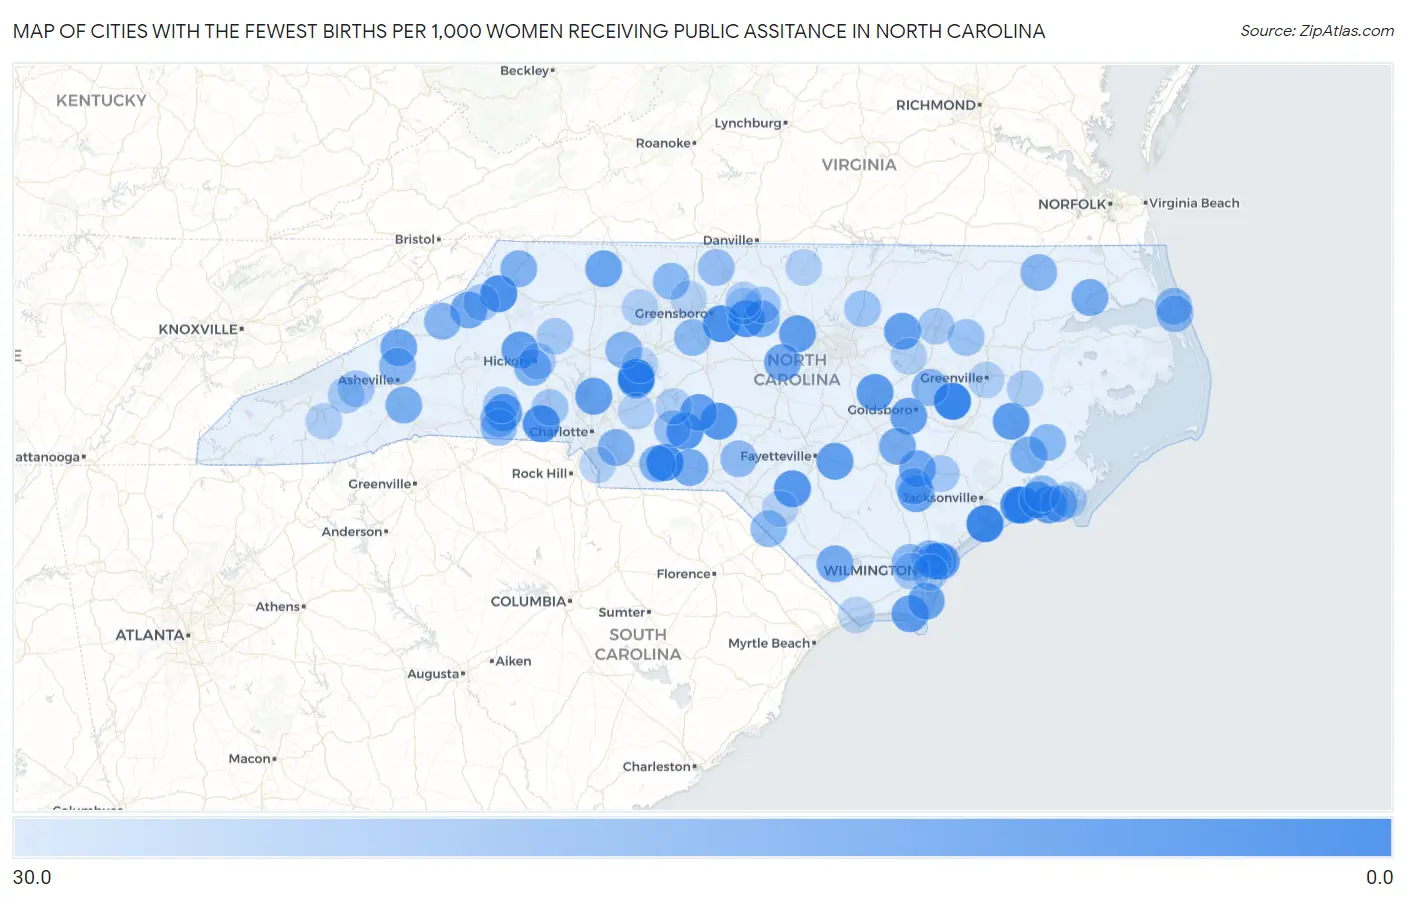
Map of Cities with the Fewest Births per 1,000 Women Receiving Public Assitance in North Carolina
30.0
0.0
Cities with the Fewest Births per 1,000 Women Receiving Public Assitance in North Carolina
| City | Births / 1,000 Women | vs State | vs National | |
| 1. | Granite Quarry | 2.0 | 50.0(-48.0)#1 | 52.0(-50.0)#18 |
| 2. | Snow Hill | 2.0 | 50.0(-48.0)#2 | 52.0(-50.0)#21 |
| 3. | Sneads Ferry | 3.0 | 50.0(-47.0)#3 | 52.0(-49.0)#38 |
| 4. | Polkton | 4.0 | 50.0(-46.0)#4 | 52.0(-48.0)#64 |
| 5. | Boone | 6.0 | 50.0(-44.0)#5 | 52.0(-46.0)#130 |
| 6. | Bessemer City | 6.0 | 50.0(-44.0)#6 | 52.0(-46.0)#147 |
| 7. | Forest Oaks | 6.0 | 50.0(-44.0)#7 | 52.0(-46.0)#151 |
| 8. | Cape Carteret | 7.0 | 50.0(-43.0)#8 | 52.0(-45.0)#227 |
| 9. | Cedar Point | 7.0 | 50.0(-43.0)#9 | 52.0(-45.0)#232 |
| 10. | Alamance | 7.0 | 50.0(-43.0)#10 | 52.0(-45.0)#256 |
| 11. | Candor | 8.0 | 50.0(-42.0)#11 | 52.0(-44.0)#358 |
| 12. | Mount Gilead | 8.0 | 50.0(-42.0)#12 | 52.0(-44.0)#363 |
| 13. | Rennert | 8.0 | 50.0(-42.0)#13 | 52.0(-44.0)#377 |
| 14. | Smithfield | 9.0 | 50.0(-41.0)#14 | 52.0(-43.0)#381 |
| 15. | Porters Neck | 9.0 | 50.0(-41.0)#15 | 52.0(-43.0)#388 |
| 16. | Pine Knoll Shores | 9.0 | 50.0(-41.0)#16 | 52.0(-43.0)#443 |
| 17. | Vanceboro | 9.0 | 50.0(-41.0)#17 | 52.0(-43.0)#454 |
| 18. | Chapel Hill | 10.0 | 50.0(-40.0)#18 | 52.0(-42.0)#480 |
| 19. | Broad Creek | 10.0 | 50.0(-40.0)#19 | 52.0(-42.0)#537 |
| 20. | Stedman | 10.0 | 50.0(-40.0)#20 | 52.0(-42.0)#546 |
| 21. | Kingstown | 10.0 | 50.0(-40.0)#21 | 52.0(-42.0)#587 |
| 22. | Davidson | 11.0 | 50.0(-39.0)#22 | 52.0(-41.0)#605 |
| 23. | Sawmills | 11.0 | 50.0(-39.0)#23 | 52.0(-41.0)#632 |
| 24. | Troy | 11.0 | 50.0(-39.0)#24 | 52.0(-41.0)#646 |
| 25. | Mar Mac | 11.0 | 50.0(-39.0)#25 | 52.0(-41.0)#651 |
| 26. | Spring Hope | 11.0 | 50.0(-39.0)#26 | 52.0(-41.0)#667 |
| 27. | Caswell Beach | 11.0 | 50.0(-39.0)#27 | 52.0(-41.0)#700 |
| 28. | Kure Beach | 12.0 | 50.0(-38.0)#28 | 52.0(-40.0)#772 |
| 29. | Dobson | 12.0 | 50.0(-38.0)#29 | 52.0(-40.0)#783 |
| 30. | Teachey | 12.0 | 50.0(-38.0)#30 | 52.0(-40.0)#828 |
| 31. | Pittsboro | 13.0 | 50.0(-37.0)#31 | 52.0(-39.0)#878 |
| 32. | Mars Hill | 13.0 | 50.0(-37.0)#32 | 52.0(-39.0)#897 |
| 33. | Kenansville | 13.0 | 50.0(-37.0)#33 | 52.0(-39.0)#942 |
| 34. | Newland | 13.0 | 50.0(-37.0)#34 | 52.0(-39.0)#952 |
| 35. | Swepsonville | 14.0 | 50.0(-36.0)#35 | 52.0(-38.0)#1,044 |
| 36. | Hertford | 14.0 | 50.0(-36.0)#36 | 52.0(-38.0)#1,050 |
| 37. | Brunswick | 14.0 | 50.0(-36.0)#37 | 52.0(-38.0)#1,074 |
| 38. | Faith | 14.0 | 50.0(-36.0)#38 | 52.0(-38.0)#1,082 |
| 39. | Faison | 14.0 | 50.0(-36.0)#39 | 52.0(-38.0)#1,089 |
| 40. | Lilesville | 14.0 | 50.0(-36.0)#40 | 52.0(-38.0)#1,097 |
| 41. | Fletcher | 15.0 | 50.0(-35.0)#41 | 52.0(-37.0)#1,165 |
| 42. | James City | 15.0 | 50.0(-35.0)#42 | 52.0(-37.0)#1,184 |
| 43. | Lattimore | 15.0 | 50.0(-35.0)#43 | 52.0(-37.0)#1,276 |
| 44. | Peachland | 15.0 | 50.0(-35.0)#44 | 52.0(-37.0)#1,282 |
| 45. | Mountain View | 16.0 | 50.0(-34.0)#45 | 52.0(-36.0)#1,359 |
| 46. | Bayshore | 16.0 | 50.0(-34.0)#46 | 52.0(-36.0)#1,365 |
| 47. | Hemby Bridge | 16.0 | 50.0(-34.0)#47 | 52.0(-36.0)#1,384 |
| 48. | Atlantic Beach | 16.0 | 50.0(-34.0)#48 | 52.0(-36.0)#1,386 |
| 49. | West Jefferson | 16.0 | 50.0(-34.0)#49 | 52.0(-36.0)#1,393 |
| 50. | Springdale | 16.0 | 50.0(-34.0)#50 | 52.0(-36.0)#1,408 |
| 51. | Northchase | 17.0 | 50.0(-33.0)#51 | 52.0(-35.0)#1,516 |
| 52. | Weaverville | 17.0 | 50.0(-33.0)#52 | 52.0(-35.0)#1,522 |
| 53. | Southern Shores | 17.0 | 50.0(-33.0)#53 | 52.0(-35.0)#1,546 |
| 54. | Cooleemee | 17.0 | 50.0(-33.0)#54 | 52.0(-35.0)#1,593 |
| 55. | Bakersville | 17.0 | 50.0(-33.0)#55 | 52.0(-35.0)#1,604 |
| 56. | Cofield | 17.0 | 50.0(-33.0)#56 | 52.0(-35.0)#1,630 |
| 57. | Eureka | 17.0 | 50.0(-33.0)#57 | 52.0(-35.0)#1,644 |
| 58. | Archdale | 18.0 | 50.0(-32.0)#58 | 52.0(-34.0)#1,661 |
| 59. | Walnut Cove | 18.0 | 50.0(-32.0)#59 | 52.0(-34.0)#1,737 |
| 60. | Navassa | 18.0 | 50.0(-32.0)#60 | 52.0(-34.0)#1,738 |
| 61. | Rose Hill | 18.0 | 50.0(-32.0)#61 | 52.0(-34.0)#1,744 |
| 62. | Rowland | 18.0 | 50.0(-32.0)#62 | 52.0(-34.0)#1,772 |
| 63. | Grantsboro | 18.0 | 50.0(-32.0)#63 | 52.0(-34.0)#1,803 |
| 64. | Kitty Hawk | 19.0 | 50.0(-31.0)#64 | 52.0(-33.0)#1,885 |
| 65. | Hoffman | 19.0 | 50.0(-31.0)#65 | 52.0(-33.0)#1,942 |
| 66. | Murraysville | 20.0 | 50.0(-30.0)#66 | 52.0(-32.0)#2,004 |
| 67. | Boiling Springs | 20.0 | 50.0(-30.0)#67 | 52.0(-32.0)#2,049 |
| 68. | Newport | 20.0 | 50.0(-30.0)#68 | 52.0(-32.0)#2,053 |
| 69. | Norwood | 20.0 | 50.0(-30.0)#69 | 52.0(-32.0)#2,077 |
| 70. | Wentworth | 20.0 | 50.0(-30.0)#70 | 52.0(-32.0)#2,083 |
| 71. | Tarboro | 21.0 | 50.0(-29.0)#71 | 52.0(-31.0)#2,206 |
| 72. | Franklinton | 21.0 | 50.0(-29.0)#72 | 52.0(-31.0)#2,247 |
| 73. | Green Level | 22.0 | 50.0(-28.0)#73 | 52.0(-30.0)#2,423 |
| 74. | Clyde | 22.0 | 50.0(-28.0)#74 | 52.0(-30.0)#2,467 |
| 75. | High Shoals | 22.0 | 50.0(-28.0)#75 | 52.0(-30.0)#2,504 |
| 76. | Polkville | 22.0 | 50.0(-28.0)#76 | 52.0(-30.0)#2,517 |
| 77. | Seven Devils | 22.0 | 50.0(-28.0)#77 | 52.0(-30.0)#2,524 |
| 78. | Rocky Mount | 23.0 | 50.0(-27.0)#78 | 52.0(-29.0)#2,553 |
| 79. | Hickory | 23.0 | 50.0(-27.0)#79 | 52.0(-29.0)#2,556 |
| 80. | Leland | 23.0 | 50.0(-27.0)#80 | 52.0(-29.0)#2,564 |
| 81. | Waynesville | 23.0 | 50.0(-27.0)#81 | 52.0(-29.0)#2,596 |
| 82. | Taylorsville | 23.0 | 50.0(-27.0)#82 | 52.0(-29.0)#2,649 |
| 83. | Beulaville | 23.0 | 50.0(-27.0)#83 | 52.0(-29.0)#2,676 |
| 84. | Wilmington | 24.0 | 50.0(-26.0)#84 | 52.0(-28.0)#2,743 |
| 85. | Beaufort | 24.0 | 50.0(-26.0)#85 | 52.0(-28.0)#2,798 |
| 86. | Washington Park | 24.0 | 50.0(-26.0)#86 | 52.0(-28.0)#2,912 |
| 87. | Greenville | 25.0 | 50.0(-25.0)#87 | 52.0(-27.0)#2,953 |
| 88. | Lewisville | 25.0 | 50.0(-25.0)#88 | 52.0(-27.0)#2,977 |
| 89. | Elon | 25.0 | 50.0(-25.0)#89 | 52.0(-27.0)#2,980 |
| 90. | Roxboro | 25.0 | 50.0(-25.0)#90 | 52.0(-27.0)#2,991 |
| 91. | Marvin | 25.0 | 50.0(-25.0)#91 | 52.0(-27.0)#2,996 |
| 92. | Badin | 25.0 | 50.0(-25.0)#92 | 52.0(-27.0)#3,048 |
| 93. | Mount Pleasant | 25.0 | 50.0(-25.0)#93 | 52.0(-27.0)#3,058 |
| 94. | Ossipee | 25.0 | 50.0(-25.0)#94 | 52.0(-27.0)#3,131 |
| 95. | Sims | 25.0 | 50.0(-25.0)#95 | 52.0(-27.0)#3,139 |
| 96. | Forest Hills | 25.0 | 50.0(-25.0)#96 | 52.0(-27.0)#3,145 |
| 97. | Oak Ridge | 26.0 | 50.0(-24.0)#97 | 52.0(-26.0)#3,214 |
| 98. | Sunset Beach | 26.0 | 50.0(-24.0)#98 | 52.0(-26.0)#3,242 |
| 99. | Spencer | 26.0 | 50.0(-24.0)#99 | 52.0(-26.0)#3,250 |
| 100. | Pembroke | 26.0 | 50.0(-24.0)#100 | 52.0(-26.0)#3,254 |
Common Questions
What are the Top 10 Cities with the Fewest Births per 1,000 Women Receiving Public Assitance in North Carolina?
Top 10 Cities with the Fewest Births per 1,000 Women Receiving Public Assitance in North Carolina are:
#1
2.0
#2
2.0
#3
3.0
#4
4.0
#5
6.0
#6
6.0
#7
6.0
#8
7.0
#9
7.0
#10
7.0
What city has the Fewest Births per 1,000 Women Receiving Public Assitance in North Carolina?
Granite Quarry has the Fewest Births per 1,000 Women Receiving Public Assitance in North Carolina with 2.0.
What is the Number of Births per 1,000 Women Receiving Public Assitance in the State of North Carolina?
Number of Births per 1,000 Women Receiving Public Assitance in North Carolina is 50.0.
What is the Number of Births per 1,000 Women Receiving Public Assitance in the United States?
Number of Births per 1,000 Women Receiving Public Assitance in the United States is 52.0.