Cities with the Fewest Births per 1,000 Women Receiving Public Assitance in Arizona
RELATED REPORTS & OPTIONS
Lowest Birth Rate | Public Income
Arizona
Compare Cities
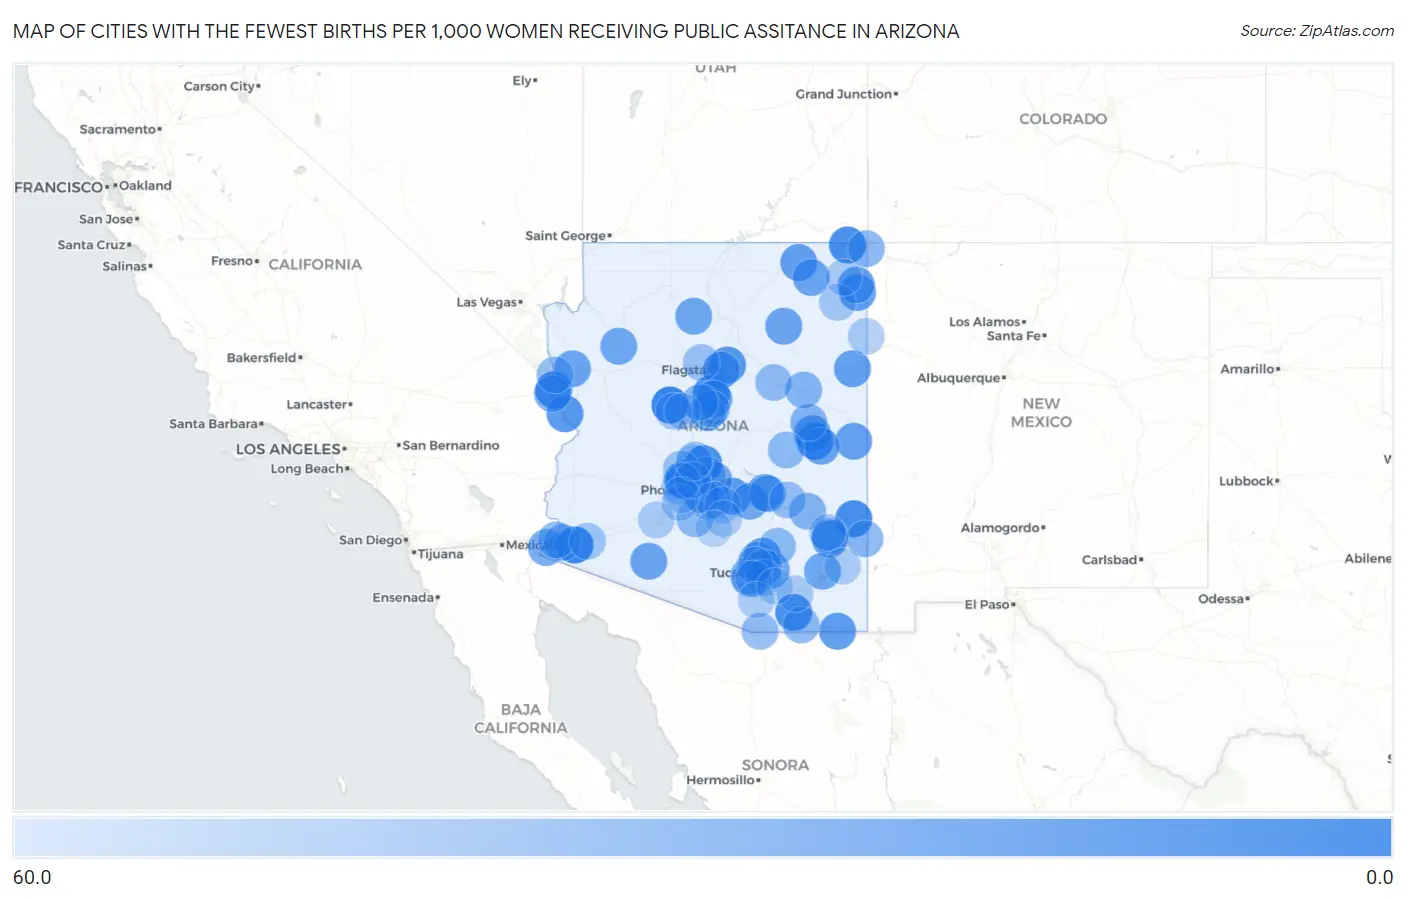
Map of Cities with the Fewest Births per 1,000 Women Receiving Public Assitance in Arizona
60.0
0.0
Cities with the Fewest Births per 1,000 Women Receiving Public Assitance in Arizona
| City | Births / 1,000 Women | vs State | vs National | |
| 1. | Williamson | 2.0 | 55.0(-53.0)#1 | 52.0(-50.0)#16 |
| 2. | Wellton | 3.0 | 55.0(-52.0)#2 | 52.0(-49.0)#35 |
| 3. | Sedona | 6.0 | 55.0(-49.0)#3 | 52.0(-46.0)#138 |
| 4. | Carefree | 7.0 | 55.0(-48.0)#4 | 52.0(-45.0)#217 |
| 5. | Pinetop Lakeside | 8.0 | 55.0(-47.0)#5 | 52.0(-44.0)#316 |
| 6. | Clifton | 9.0 | 55.0(-46.0)#6 | 52.0(-43.0)#411 |
| 7. | Mohave Valley | 9.0 | 55.0(-46.0)#7 | 52.0(-43.0)#420 |
| 8. | Red Mesa | 9.0 | 55.0(-46.0)#8 | 52.0(-43.0)#469 |
| 9. | Huachuca City | 10.0 | 55.0(-45.0)#9 | 52.0(-42.0)#539 |
| 10. | Swift Trail Junction | 13.0 | 55.0(-42.0)#10 | 52.0(-39.0)#894 |
| 11. | Doney Park | 15.0 | 55.0(-40.0)#11 | 52.0(-37.0)#1,187 |
| 12. | Sun City | 16.0 | 55.0(-39.0)#12 | 52.0(-36.0)#1,301 |
| 13. | Gold Canyon | 16.0 | 55.0(-39.0)#13 | 52.0(-36.0)#1,313 |
| 14. | Desert Hills | 16.0 | 55.0(-39.0)#14 | 52.0(-36.0)#1,373 |
| 15. | Catalina | 17.0 | 55.0(-38.0)#15 | 52.0(-35.0)#1,512 |
| 16. | Pirtleville | 18.0 | 55.0(-37.0)#16 | 52.0(-34.0)#1,753 |
| 17. | Flagstaff | 20.0 | 55.0(-35.0)#17 | 52.0(-32.0)#1,996 |
| 18. | Kayenta | 20.0 | 55.0(-35.0)#18 | 52.0(-32.0)#2,041 |
| 19. | Tsaile | 21.0 | 55.0(-34.0)#19 | 52.0(-31.0)#2,278 |
| 20. | Sanders | 21.0 | 55.0(-34.0)#20 | 52.0(-31.0)#2,320 |
| 21. | Show Low | 22.0 | 55.0(-33.0)#21 | 52.0(-30.0)#2,373 |
| 22. | Village Of Oak Creek Big Park | 22.0 | 55.0(-33.0)#22 | 52.0(-30.0)#2,395 |
| 23. | Springerville | 22.0 | 55.0(-33.0)#23 | 52.0(-30.0)#2,446 |
| 24. | Red Rock Cdp Pinal County | 23.0 | 55.0(-32.0)#24 | 52.0(-29.0)#2,639 |
| 25. | Lukachukai | 23.0 | 55.0(-32.0)#25 | 52.0(-29.0)#2,666 |
| 26. | Claypool | 23.0 | 55.0(-32.0)#26 | 52.0(-29.0)#2,681 |
| 27. | Ajo | 24.0 | 55.0(-31.0)#27 | 52.0(-28.0)#2,819 |
| 28. | Shongopovi | 24.0 | 55.0(-31.0)#28 | 52.0(-28.0)#2,877 |
| 29. | Golden Valley | 25.0 | 55.0(-30.0)#29 | 52.0(-27.0)#2,992 |
| 30. | Mcnary | 25.0 | 55.0(-30.0)#30 | 52.0(-27.0)#3,094 |
| 31. | Chilchinbito | 25.0 | 55.0(-30.0)#31 | 52.0(-27.0)#3,105 |
| 32. | Tucson Mountains | 26.0 | 55.0(-29.0)#32 | 52.0(-26.0)#3,195 |
| 33. | Willcox | 26.0 | 55.0(-29.0)#33 | 52.0(-26.0)#3,252 |
| 34. | Peach Springs | 26.0 | 55.0(-29.0)#34 | 52.0(-26.0)#3,286 |
| 35. | Tusayan | 26.0 | 55.0(-29.0)#35 | 52.0(-26.0)#3,333 |
| 36. | Fountain Hills | 27.0 | 55.0(-28.0)#36 | 52.0(-25.0)#3,377 |
| 37. | Tanque Verde | 27.0 | 55.0(-28.0)#37 | 52.0(-25.0)#3,386 |
| 38. | Superior | 27.0 | 55.0(-28.0)#38 | 52.0(-25.0)#3,460 |
| 39. | Tucson Estates | 28.0 | 55.0(-27.0)#39 | 52.0(-24.0)#3,596 |
| 40. | Somerton | 30.0 | 55.0(-25.0)#40 | 52.0(-22.0)#4,024 |
| 41. | Camp Verde | 30.0 | 55.0(-25.0)#41 | 52.0(-22.0)#4,033 |
| 42. | Oro Valley | 32.0 | 55.0(-23.0)#42 | 52.0(-20.0)#4,472 |
| 43. | Lake Montezuma | 32.0 | 55.0(-23.0)#43 | 52.0(-20.0)#4,560 |
| 44. | Central Heights Midland City | 32.0 | 55.0(-23.0)#44 | 52.0(-20.0)#4,585 |
| 45. | Bellemont | 33.0 | 55.0(-22.0)#45 | 52.0(-19.0)#4,830 |
| 46. | Tempe | 34.0 | 55.0(-21.0)#46 | 52.0(-18.0)#4,915 |
| 47. | Taylor | 34.0 | 55.0(-21.0)#47 | 52.0(-18.0)#5,027 |
| 48. | Arizona Village | 34.0 | 55.0(-21.0)#48 | 52.0(-18.0)#5,133 |
| 49. | Bylas | 35.0 | 55.0(-20.0)#49 | 52.0(-17.0)#5,308 |
| 50. | Holbrook | 36.0 | 55.0(-19.0)#50 | 52.0(-16.0)#5,484 |
| 51. | Teec Nos Pos | 36.0 | 55.0(-19.0)#51 | 52.0(-16.0)#5,582 |
| 52. | Fortuna Foothills | 37.0 | 55.0(-18.0)#52 | 52.0(-15.0)#5,661 |
| 53. | Verde Village | 37.0 | 55.0(-18.0)#53 | 52.0(-15.0)#5,693 |
| 54. | Duncan | 37.0 | 55.0(-18.0)#54 | 52.0(-15.0)#5,831 |
| 55. | El Prado Estates | 39.0 | 55.0(-16.0)#55 | 52.0(-13.0)#6,354 |
| 56. | Sierra Vista Southeast | 40.0 | 55.0(-15.0)#56 | 52.0(-12.0)#6,440 |
| 57. | San Manuel | 40.0 | 55.0(-15.0)#57 | 52.0(-12.0)#6,494 |
| 58. | Cibecue | 40.0 | 55.0(-15.0)#58 | 52.0(-12.0)#6,547 |
| 59. | Ak Chin Village | 40.0 | 55.0(-15.0)#59 | 52.0(-12.0)#6,554 |
| 60. | Bullhead City | 41.0 | 55.0(-14.0)#60 | 52.0(-11.0)#6,653 |
| 61. | Winslow | 41.0 | 55.0(-14.0)#61 | 52.0(-11.0)#6,735 |
| 62. | Scottsdale | 42.0 | 55.0(-13.0)#62 | 52.0(-10.00)#6,895 |
| 63. | Catalina Foothills | 42.0 | 55.0(-13.0)#63 | 52.0(-10.00)#6,912 |
| 64. | Nogales | 42.0 | 55.0(-13.0)#64 | 52.0(-10.00)#6,937 |
| 65. | Circle | 42.0 | 55.0(-13.0)#65 | 52.0(-10.00)#7,088 |
| 66. | Peridot | 44.0 | 55.0(-11.0)#66 | 52.0(-8.00)#7,562 |
| 67. | New River | 45.0 | 55.0(-10.00)#67 | 52.0(-7.00)#7,680 |
| 68. | Parks | 46.0 | 55.0(-9.00)#68 | 52.0(-6.00)#8,044 |
| 69. | Peoria | 47.0 | 55.0(-8.00)#69 | 52.0(-5.00)#8,100 |
| 70. | Valencia West | 47.0 | 55.0(-8.00)#70 | 52.0(-5.00)#8,169 |
| 71. | Chandler | 48.0 | 55.0(-7.00)#71 | 52.0(-4.00)#8,348 |
| 72. | Litchfield Park | 48.0 | 55.0(-7.00)#72 | 52.0(-4.00)#8,457 |
| 73. | Guadalupe | 48.0 | 55.0(-7.00)#73 | 52.0(-4.00)#8,469 |
| 74. | Cactus Flats | 48.0 | 55.0(-7.00)#74 | 52.0(-4.00)#8,535 |
| 75. | Tacna | 48.0 | 55.0(-7.00)#75 | 52.0(-4.00)#8,571 |
| 76. | Prescott | 49.0 | 55.0(-6.00)#76 | 52.0(-3.00)#8,634 |
| 77. | Red Lake | 49.0 | 55.0(-6.00)#77 | 52.0(-3.00)#8,779 |
| 78. | Tucson | 50.0 | 55.0(-5.00)#78 | 52.0(-2.00)#8,840 |
| 79. | Casas Adobes | 50.0 | 55.0(-5.00)#79 | 52.0(-2.00)#8,856 |
| 80. | Drexel Heights | 50.0 | 55.0(-5.00)#80 | 52.0(-2.00)#8,879 |
| 81. | Chinle | 50.0 | 55.0(-5.00)#81 | 52.0(-2.00)#8,981 |
| 82. | El Mirage | 51.0 | 55.0(-4.00)#82 | 52.0(-1.000)#9,139 |
| 83. | Youngtown | 51.0 | 55.0(-4.00)#83 | 52.0(-1.000)#9,200 |
| 84. | Goodyear | 52.0 | 55.0(-3.00)#84 | 52.0(=0.000)#9,348 |
| 85. | Benson | 52.0 | 55.0(-3.00)#85 | 52.0(=0.000)#9,437 |
| 86. | Thatcher | 52.0 | 55.0(-3.00)#86 | 52.0(=0.000)#9,439 |
| 87. | Window Rock | 52.0 | 55.0(-3.00)#87 | 52.0(=0.000)#9,482 |
| 88. | Gilbert | 53.0 | 55.0(-2.00)#88 | 52.0(+1.000)#9,558 |
| 89. | Queen Creek | 53.0 | 55.0(-2.00)#89 | 52.0(+1.000)#9,572 |
| 90. | Gila Bend | 53.0 | 55.0(-2.00)#90 | 52.0(+1.000)#9,712 |
| 91. | Round Rock | 53.0 | 55.0(-2.00)#91 | 52.0(+1.000)#9,760 |
| 92. | Prescott Valley | 54.0 | 55.0(-1.000)#92 | 52.0(+2.00)#9,828 |
| 93. | Green Valley | 54.0 | 55.0(-1.000)#93 | 52.0(+2.00)#9,850 |
| 94. | Blackwater | 54.0 | 55.0(-1.000)#94 | 52.0(+2.00)#9,953 |
| 95. | Bowie | 54.0 | 55.0(-1.000)#95 | 52.0(+2.00)#10,012 |
| 96. | Phoenix | 55.0 | 55.0(=0.000)#96 | 52.0(+3.00)#10,032 |
| 97. | Avondale | 57.0 | 55.0(+2.00)#97 | 52.0(+5.00)#10,501 |
| 98. | Vail | 58.0 | 55.0(+3.00)#98 | 52.0(+6.00)#10,741 |
| 99. | Casa Grande | 59.0 | 55.0(+4.00)#99 | 52.0(+7.00)#10,908 |
| 100. | Anthem | 59.0 | 55.0(+4.00)#100 | 52.0(+7.00)#10,937 |
Common Questions
What are the Top 10 Cities with the Fewest Births per 1,000 Women Receiving Public Assitance in Arizona?
Top 10 Cities with the Fewest Births per 1,000 Women Receiving Public Assitance in Arizona are:
#1
2.0
#2
3.0
#3
6.0
#4
7.0
#5
8.0
#6
9.0
#7
9.0
#8
9.0
#9
10.0
#10
13.0
What city has the Fewest Births per 1,000 Women Receiving Public Assitance in Arizona?
Williamson has the Fewest Births per 1,000 Women Receiving Public Assitance in Arizona with 2.0.
What is the Number of Births per 1,000 Women Receiving Public Assitance in the State of Arizona?
Number of Births per 1,000 Women Receiving Public Assitance in Arizona is 55.0.
What is the Number of Births per 1,000 Women Receiving Public Assitance in the United States?
Number of Births per 1,000 Women Receiving Public Assitance in the United States is 52.0.