Cities with the Fewest Births per 1,000 Women Receiving Public Assitance in Tennessee
RELATED REPORTS & OPTIONS
Lowest Birth Rate | Public Income
Tennessee
Compare Cities
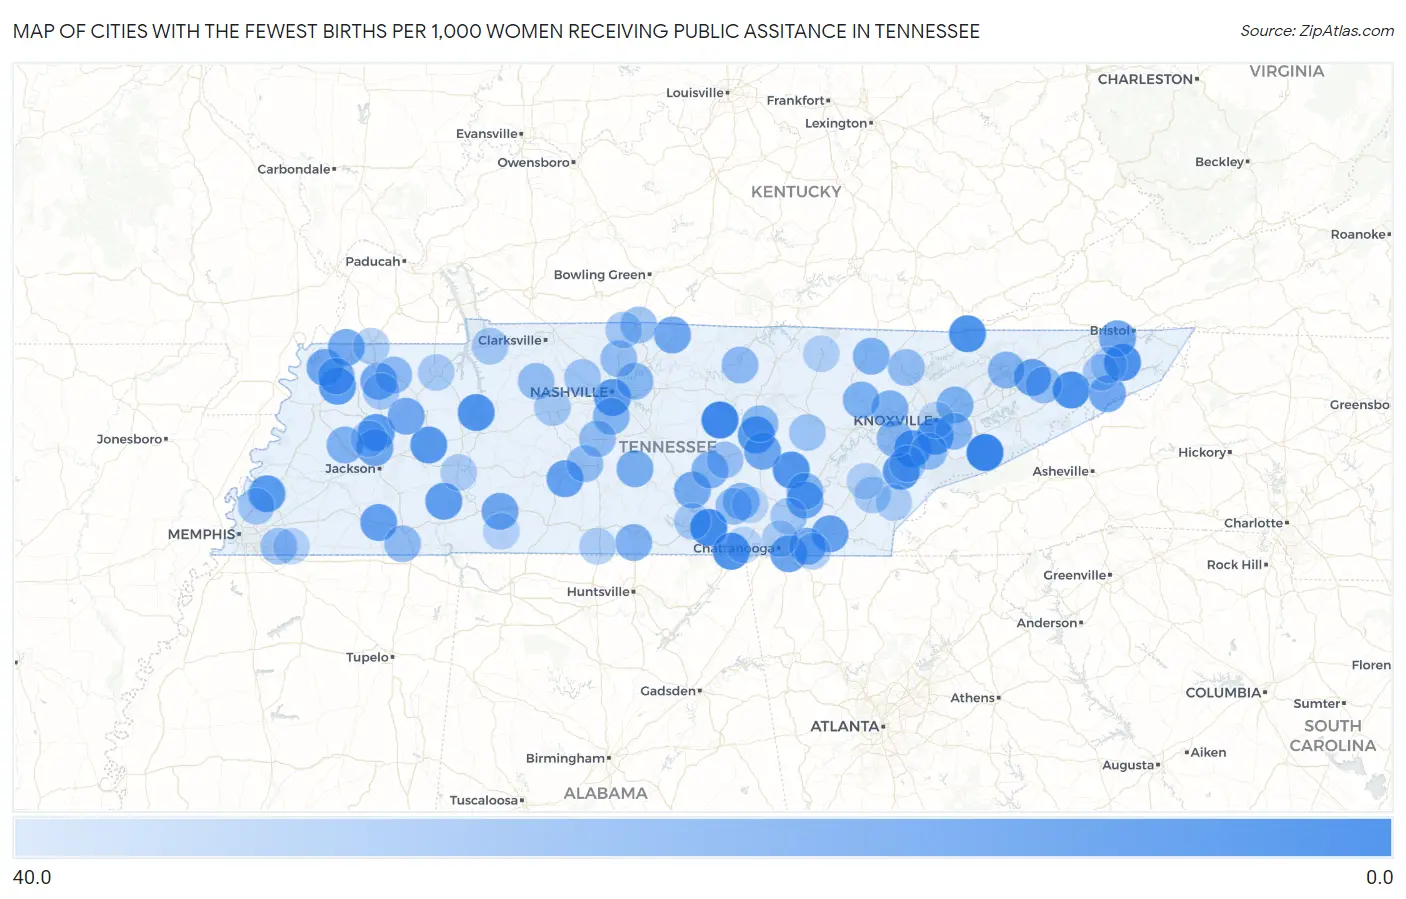
Map of Cities with the Fewest Births per 1,000 Women Receiving Public Assitance in Tennessee
40.0
0.0
Cities with the Fewest Births per 1,000 Women Receiving Public Assitance in Tennessee
| City | Births / 1,000 Women | vs State | vs National | |
| 1. | Gatlinburg | 1.0 | 52.0(-51.0)#1 | 52.0(-51.0)#6 |
| 2. | Smithville | 3.0 | 52.0(-49.0)#2 | 52.0(-49.0)#30 |
| 3. | Sewanee | 4.0 | 52.0(-48.0)#3 | 52.0(-48.0)#65 |
| 4. | Tusculum | 6.0 | 52.0(-46.0)#4 | 52.0(-46.0)#155 |
| 5. | Harrogate | 7.0 | 52.0(-45.0)#5 | 52.0(-45.0)#211 |
| 6. | South Pittsburg | 7.0 | 52.0(-45.0)#6 | 52.0(-45.0)#223 |
| 7. | Watauga | 7.0 | 52.0(-45.0)#7 | 52.0(-45.0)#270 |
| 8. | Pikeville | 8.0 | 52.0(-44.0)#8 | 52.0(-44.0)#325 |
| 9. | Gladeville | 8.0 | 52.0(-44.0)#9 | 52.0(-44.0)#335 |
| 10. | New Johnsonville | 8.0 | 52.0(-44.0)#10 | 52.0(-44.0)#340 |
| 11. | Friendsville | 8.0 | 52.0(-44.0)#11 | 52.0(-44.0)#362 |
| 12. | Vonore | 9.0 | 52.0(-43.0)#12 | 52.0(-43.0)#437 |
| 13. | Rockford | 10.0 | 52.0(-42.0)#13 | 52.0(-42.0)#576 |
| 14. | Parker S Crossroads | 10.0 | 52.0(-42.0)#14 | 52.0(-42.0)#584 |
| 15. | Doyle | 10.0 | 52.0(-42.0)#15 | 52.0(-42.0)#586 |
| 16. | Berry Hill | 11.0 | 52.0(-41.0)#16 | 52.0(-41.0)#658 |
| 17. | Trimble | 11.0 | 52.0(-41.0)#17 | 52.0(-41.0)#693 |
| 18. | Gibson | 11.0 | 52.0(-41.0)#18 | 52.0(-41.0)#697 |
| 19. | Saltillo | 12.0 | 52.0(-40.0)#19 | 52.0(-40.0)#821 |
| 20. | Mount Pleasant | 13.0 | 52.0(-39.0)#20 | 52.0(-39.0)#876 |
| 21. | Hornsby | 13.0 | 52.0(-39.0)#21 | 52.0(-39.0)#977 |
| 22. | East Ridge | 14.0 | 52.0(-38.0)#22 | 52.0(-38.0)#988 |
| 23. | East Cleveland | 14.0 | 52.0(-38.0)#23 | 52.0(-38.0)#1,049 |
| 24. | Bulls Gap | 14.0 | 52.0(-38.0)#24 | 52.0(-38.0)#1,095 |
| 25. | Sale Creek | 15.0 | 52.0(-37.0)#25 | 52.0(-37.0)#1,211 |
| 26. | Biltmore | 15.0 | 52.0(-37.0)#26 | 52.0(-37.0)#1,230 |
| 27. | Blountville | 16.0 | 52.0(-36.0)#27 | 52.0(-36.0)#1,360 |
| 28. | Waynesboro | 16.0 | 52.0(-36.0)#28 | 52.0(-36.0)#1,379 |
| 29. | Spencer | 16.0 | 52.0(-36.0)#29 | 52.0(-36.0)#1,394 |
| 30. | Hornbeak | 16.0 | 52.0(-36.0)#30 | 52.0(-36.0)#1,456 |
| 31. | Erwin | 17.0 | 52.0(-35.0)#31 | 52.0(-35.0)#1,513 |
| 32. | Westmoreland | 17.0 | 52.0(-35.0)#32 | 52.0(-35.0)#1,556 |
| 33. | Three Way | 17.0 | 52.0(-35.0)#33 | 52.0(-35.0)#1,572 |
| 34. | Sharon | 17.0 | 52.0(-35.0)#34 | 52.0(-35.0)#1,585 |
| 35. | Mclemoresville | 17.0 | 52.0(-35.0)#35 | 52.0(-35.0)#1,637 |
| 36. | Manchester | 18.0 | 52.0(-34.0)#36 | 52.0(-34.0)#1,660 |
| 37. | Collegedale | 18.0 | 52.0(-34.0)#37 | 52.0(-34.0)#1,666 |
| 38. | Woodland Mills | 18.0 | 52.0(-34.0)#38 | 52.0(-34.0)#1,800 |
| 39. | Unionville | 19.0 | 52.0(-33.0)#39 | 52.0(-33.0)#1,906 |
| 40. | Obion | 19.0 | 52.0(-33.0)#40 | 52.0(-33.0)#1,930 |
| 41. | Oliver Springs | 20.0 | 52.0(-32.0)#41 | 52.0(-32.0)#2,060 |
| 42. | Mascot | 20.0 | 52.0(-32.0)#42 | 52.0(-32.0)#2,081 |
| 43. | Huntsville | 20.0 | 52.0(-32.0)#43 | 52.0(-32.0)#2,101 |
| 44. | Wartburg | 20.0 | 52.0(-32.0)#44 | 52.0(-32.0)#2,118 |
| 45. | Park City | 21.0 | 52.0(-31.0)#45 | 52.0(-31.0)#2,228 |
| 46. | Alamo | 21.0 | 52.0(-31.0)#46 | 52.0(-31.0)#2,249 |
| 47. | Morrison | 21.0 | 52.0(-31.0)#47 | 52.0(-31.0)#2,316 |
| 48. | Brentwood | 22.0 | 52.0(-30.0)#48 | 52.0(-30.0)#2,359 |
| 49. | Bean Station | 22.0 | 52.0(-30.0)#49 | 52.0(-30.0)#2,425 |
| 50. | Rocky Top | 22.0 | 52.0(-30.0)#50 | 52.0(-30.0)#2,453 |
| 51. | Gruetli Laager | 22.0 | 52.0(-30.0)#51 | 52.0(-30.0)#2,458 |
| 52. | Seymour | 23.0 | 52.0(-29.0)#52 | 52.0(-29.0)#2,579 |
| 53. | Lenoir City | 23.0 | 52.0(-29.0)#53 | 52.0(-29.0)#2,597 |
| 54. | Graysville | 23.0 | 52.0(-29.0)#54 | 52.0(-29.0)#2,673 |
| 55. | Maryville | 24.0 | 52.0(-28.0)#55 | 52.0(-28.0)#2,748 |
| 56. | Green Hill | 24.0 | 52.0(-28.0)#56 | 52.0(-28.0)#2,780 |
| 57. | Munford | 24.0 | 52.0(-28.0)#57 | 52.0(-28.0)#2,781 |
| 58. | Sparta | 24.0 | 52.0(-28.0)#58 | 52.0(-28.0)#2,790 |
| 59. | Dresden | 25.0 | 52.0(-27.0)#59 | 52.0(-27.0)#3,034 |
| 60. | Gainesboro | 25.0 | 52.0(-27.0)#60 | 52.0(-27.0)#3,088 |
| 61. | Ramer | 25.0 | 52.0(-27.0)#61 | 52.0(-27.0)#3,140 |
| 62. | Columbia | 26.0 | 52.0(-26.0)#62 | 52.0(-26.0)#3,160 |
| 63. | Atoka | 26.0 | 52.0(-26.0)#63 | 52.0(-26.0)#3,199 |
| 64. | Thompson S Station | 26.0 | 52.0(-26.0)#64 | 52.0(-26.0)#3,215 |
| 65. | Millersville | 26.0 | 52.0(-26.0)#65 | 52.0(-26.0)#3,227 |
| 66. | Jacksboro | 26.0 | 52.0(-26.0)#66 | 52.0(-26.0)#3,255 |
| 67. | Mosheim | 26.0 | 52.0(-26.0)#67 | 52.0(-26.0)#3,261 |
| 68. | Coalmont | 26.0 | 52.0(-26.0)#68 | 52.0(-26.0)#3,303 |
| 69. | Vanleer | 26.0 | 52.0(-26.0)#69 | 52.0(-26.0)#3,315 |
| 70. | Mitchellville | 27.0 | 52.0(-25.0)#70 | 52.0(-25.0)#3,554 |
| 71. | Collierville | 28.0 | 52.0(-24.0)#71 | 52.0(-24.0)#3,560 |
| 72. | Mcminnville | 28.0 | 52.0(-24.0)#72 | 52.0(-24.0)#3,595 |
| 73. | Millington | 29.0 | 52.0(-23.0)#73 | 52.0(-23.0)#3,806 |
| 74. | Ashland City | 29.0 | 52.0(-23.0)#74 | 52.0(-23.0)#3,835 |
| 75. | Lake Tansi | 29.0 | 52.0(-23.0)#75 | 52.0(-23.0)#3,851 |
| 76. | Jonesborough | 30.0 | 52.0(-22.0)#76 | 52.0(-22.0)#4,066 |
| 77. | Greenfield | 30.0 | 52.0(-22.0)#77 | 52.0(-22.0)#4,129 |
| 78. | Dover | 30.0 | 52.0(-22.0)#78 | 52.0(-22.0)#4,133 |
| 79. | Greenback | 30.0 | 52.0(-22.0)#79 | 52.0(-22.0)#4,150 |
| 80. | Orlinda | 30.0 | 52.0(-22.0)#80 | 52.0(-22.0)#4,168 |
| 81. | Decherd | 31.0 | 52.0(-21.0)#81 | 52.0(-21.0)#4,347 |
| 82. | Mowbray Mountain | 31.0 | 52.0(-21.0)#82 | 52.0(-21.0)#4,370 |
| 83. | Burns | 31.0 | 52.0(-21.0)#83 | 52.0(-21.0)#4,376 |
| 84. | Paris | 32.0 | 52.0(-20.0)#84 | 52.0(-20.0)#4,518 |
| 85. | Humboldt | 32.0 | 52.0(-20.0)#85 | 52.0(-20.0)#4,535 |
| 86. | Apison | 32.0 | 52.0(-20.0)#86 | 52.0(-20.0)#4,563 |
| 87. | Englewood | 32.0 | 52.0(-20.0)#87 | 52.0(-20.0)#4,598 |
| 88. | Red Bank | 33.0 | 52.0(-19.0)#88 | 52.0(-19.0)#4,715 |
| 89. | South Fulton | 33.0 | 52.0(-19.0)#89 | 52.0(-19.0)#4,792 |
| 90. | Tellico Plains | 33.0 | 52.0(-19.0)#90 | 52.0(-19.0)#4,829 |
| 91. | Decaturville | 33.0 | 52.0(-19.0)#91 | 52.0(-19.0)#4,841 |
| 92. | Elkton | 33.0 | 52.0(-19.0)#92 | 52.0(-19.0)#4,879 |
| 93. | Jamestown | 34.0 | 52.0(-18.0)#93 | 52.0(-18.0)#5,069 |
| 94. | Niota | 34.0 | 52.0(-18.0)#94 | 52.0(-18.0)#5,129 |
| 95. | Johnson City | 35.0 | 52.0(-17.0)#95 | 52.0(-17.0)#5,169 |
| 96. | Piperton | 35.0 | 52.0(-17.0)#96 | 52.0(-17.0)#5,293 |
| 97. | Collinwood | 35.0 | 52.0(-17.0)#97 | 52.0(-17.0)#5,325 |
| 98. | Knoxville | 36.0 | 52.0(-16.0)#98 | 52.0(-16.0)#5,384 |
| 99. | Jasper | 36.0 | 52.0(-16.0)#99 | 52.0(-16.0)#5,499 |
| 100. | Palmer | 36.0 | 52.0(-16.0)#100 | 52.0(-16.0)#5,584 |
Common Questions
What are the Top 10 Cities with the Fewest Births per 1,000 Women Receiving Public Assitance in Tennessee?
Top 10 Cities with the Fewest Births per 1,000 Women Receiving Public Assitance in Tennessee are:
#1
1.0
#2
3.0
#3
4.0
#4
6.0
#5
7.0
#6
7.0
#7
7.0
#8
8.0
#9
8.0
#10
8.0
What city has the Fewest Births per 1,000 Women Receiving Public Assitance in Tennessee?
Gatlinburg has the Fewest Births per 1,000 Women Receiving Public Assitance in Tennessee with 1.0.
What is the Number of Births per 1,000 Women Receiving Public Assitance in the State of Tennessee?
Number of Births per 1,000 Women Receiving Public Assitance in Tennessee is 52.0.
What is the Number of Births per 1,000 Women Receiving Public Assitance in the United States?
Number of Births per 1,000 Women Receiving Public Assitance in the United States is 52.0.