Cities with the Fewest Births per 1,000 Women Receiving Public Assitance in Indiana
RELATED REPORTS & OPTIONS
Lowest Birth Rate | Public Income
Indiana
Compare Cities
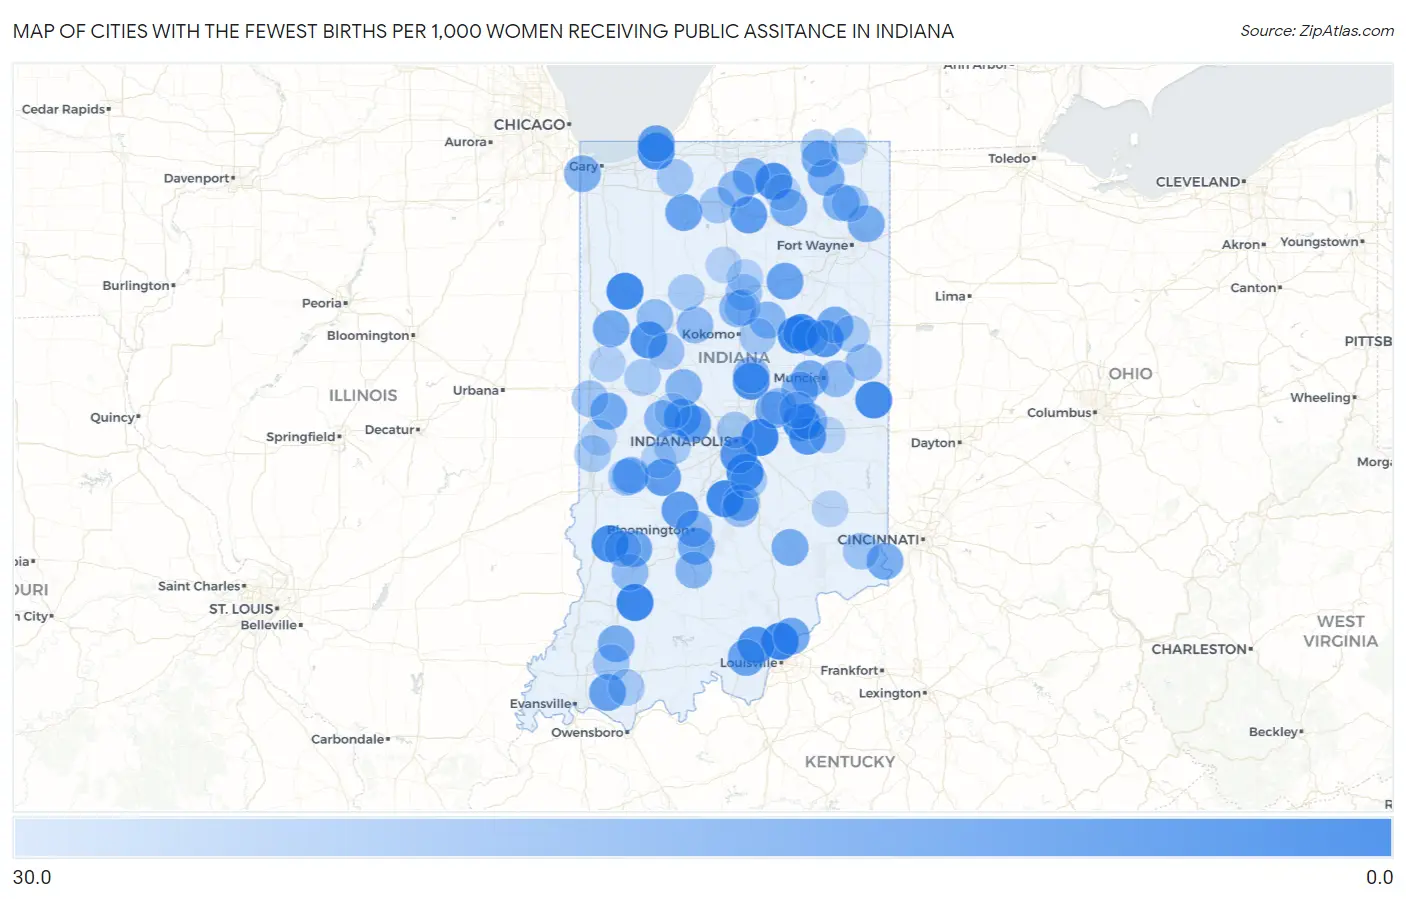
Map of Cities with the Fewest Births per 1,000 Women Receiving Public Assitance in Indiana
30.0
0.0
Cities with the Fewest Births per 1,000 Women Receiving Public Assitance in Indiana
| City | Births / 1,000 Women | vs State | vs National | |
| 1. | Cumberland | 4.0 | 54.0(-50.0)#1 | 52.0(-48.0)#58 |
| 2. | Sellersburg | 5.0 | 54.0(-49.0)#2 | 52.0(-47.0)#88 |
| 3. | Montgomery | 5.0 | 54.0(-49.0)#3 | 52.0(-47.0)#118 |
| 4. | Whiteland | 6.0 | 54.0(-48.0)#4 | 52.0(-46.0)#150 |
| 5. | Jonesboro | 6.0 | 54.0(-48.0)#5 | 52.0(-46.0)#172 |
| 6. | Remington | 6.0 | 54.0(-48.0)#6 | 52.0(-46.0)#173 |
| 7. | Morgantown | 6.0 | 54.0(-48.0)#7 | 52.0(-46.0)#174 |
| 8. | Gas City | 7.0 | 54.0(-47.0)#8 | 52.0(-45.0)#205 |
| 9. | Lynn | 7.0 | 54.0(-47.0)#9 | 52.0(-45.0)#257 |
| 10. | Shirley | 7.0 | 54.0(-47.0)#10 | 52.0(-45.0)#260 |
| 11. | Dugger | 7.0 | 54.0(-47.0)#11 | 52.0(-45.0)#266 |
| 12. | Trail Creek | 8.0 | 54.0(-46.0)#12 | 52.0(-44.0)#336 |
| 13. | New Paris | 8.0 | 54.0(-46.0)#13 | 52.0(-44.0)#348 |
| 14. | Arcadia | 8.0 | 54.0(-46.0)#14 | 52.0(-44.0)#349 |
| 15. | West Lafayette | 9.0 | 54.0(-45.0)#15 | 52.0(-43.0)#378 |
| 16. | Hartford City | 10.0 | 54.0(-44.0)#16 | 52.0(-42.0)#496 |
| 17. | Knightstown | 10.0 | 54.0(-44.0)#17 | 52.0(-42.0)#531 |
| 18. | Greenville | 10.0 | 54.0(-44.0)#18 | 52.0(-42.0)#545 |
| 19. | Homecroft | 10.0 | 54.0(-44.0)#19 | 52.0(-42.0)#580 |
| 20. | Jamestown | 11.0 | 54.0(-43.0)#20 | 52.0(-41.0)#673 |
| 21. | Cloverdale | 12.0 | 54.0(-42.0)#21 | 52.0(-40.0)#775 |
| 22. | Etna Green | 12.0 | 54.0(-42.0)#22 | 52.0(-40.0)#829 |
| 23. | Stinesville | 12.0 | 54.0(-42.0)#23 | 52.0(-40.0)#842 |
| 24. | Boonville | 13.0 | 54.0(-41.0)#24 | 52.0(-39.0)#866 |
| 25. | Long Beach | 13.0 | 54.0(-41.0)#25 | 52.0(-39.0)#931 |
| 26. | Lizton | 13.0 | 54.0(-41.0)#26 | 52.0(-39.0)#956 |
| 27. | Knox | 14.0 | 54.0(-40.0)#27 | 52.0(-38.0)#1,026 |
| 28. | Lagro | 14.0 | 54.0(-40.0)#28 | 52.0(-38.0)#1,126 |
| 29. | Crandall | 14.0 | 54.0(-40.0)#29 | 52.0(-38.0)#1,134 |
| 30. | Charlestown | 15.0 | 54.0(-39.0)#30 | 52.0(-37.0)#1,166 |
| 31. | Switz City | 15.0 | 54.0(-39.0)#31 | 52.0(-37.0)#1,294 |
| 32. | Smithville Sanders | 16.0 | 54.0(-38.0)#32 | 52.0(-36.0)#1,364 |
| 33. | Rising Sun | 16.0 | 54.0(-38.0)#33 | 52.0(-36.0)#1,378 |
| 34. | Oxford | 16.0 | 54.0(-38.0)#34 | 52.0(-36.0)#1,389 |
| 35. | North Webster | 16.0 | 54.0(-38.0)#35 | 52.0(-36.0)#1,417 |
| 36. | Kingman | 16.0 | 54.0(-38.0)#36 | 52.0(-36.0)#1,445 |
| 37. | Yorktown | 17.0 | 54.0(-37.0)#37 | 52.0(-35.0)#1,496 |
| 38. | Leo Cedarville | 17.0 | 54.0(-37.0)#38 | 52.0(-35.0)#1,536 |
| 39. | Country Squire Lakes | 17.0 | 54.0(-37.0)#39 | 52.0(-35.0)#1,548 |
| 40. | Lagrange | 17.0 | 54.0(-37.0)#40 | 52.0(-35.0)#1,552 |
| 41. | Ingalls | 17.0 | 54.0(-37.0)#41 | 52.0(-35.0)#1,561 |
| 42. | Montpelier | 17.0 | 54.0(-37.0)#42 | 52.0(-35.0)#1,577 |
| 43. | Prince S Lakes | 17.0 | 54.0(-37.0)#43 | 52.0(-35.0)#1,582 |
| 44. | Winslow | 17.0 | 54.0(-37.0)#44 | 52.0(-35.0)#1,603 |
| 45. | Munster | 18.0 | 54.0(-36.0)#45 | 52.0(-34.0)#1,653 |
| 46. | Avilla | 18.0 | 54.0(-36.0)#46 | 52.0(-34.0)#1,716 |
| 47. | Wakarusa | 18.0 | 54.0(-36.0)#47 | 52.0(-34.0)#1,725 |
| 48. | Wolcottville | 18.0 | 54.0(-36.0)#48 | 52.0(-34.0)#1,766 |
| 49. | Bloomington | 19.0 | 54.0(-35.0)#49 | 52.0(-33.0)#1,828 |
| 50. | Chesterfield | 19.0 | 54.0(-35.0)#50 | 52.0(-33.0)#1,895 |
| 51. | Grissom Afb | 20.0 | 54.0(-34.0)#51 | 52.0(-32.0)#2,084 |
| 52. | Oolitic | 20.0 | 54.0(-34.0)#52 | 52.0(-32.0)#2,113 |
| 53. | Ladoga | 20.0 | 54.0(-34.0)#53 | 52.0(-32.0)#2,123 |
| 54. | Thorntown | 20.0 | 54.0(-34.0)#54 | 52.0(-32.0)#2,126 |
| 55. | Converse | 20.0 | 54.0(-34.0)#55 | 52.0(-32.0)#2,132 |
| 56. | Knightsville | 20.0 | 54.0(-34.0)#56 | 52.0(-32.0)#2,148 |
| 57. | Kennard | 20.0 | 54.0(-34.0)#57 | 52.0(-32.0)#2,154 |
| 58. | Bremen | 21.0 | 54.0(-33.0)#58 | 52.0(-31.0)#2,221 |
| 59. | Flora | 21.0 | 54.0(-33.0)#59 | 52.0(-31.0)#2,258 |
| 60. | Atlanta | 21.0 | 54.0(-33.0)#60 | 52.0(-31.0)#2,313 |
| 61. | Brookston | 22.0 | 54.0(-32.0)#61 | 52.0(-30.0)#2,456 |
| 62. | Selma | 22.0 | 54.0(-32.0)#62 | 52.0(-30.0)#2,495 |
| 63. | Elnora | 22.0 | 54.0(-32.0)#63 | 52.0(-30.0)#2,512 |
| 64. | Pendleton | 23.0 | 54.0(-31.0)#64 | 52.0(-29.0)#2,623 |
| 65. | Cordry Sweetwater Lakes | 23.0 | 54.0(-31.0)#65 | 52.0(-29.0)#2,678 |
| 66. | Dayton | 23.0 | 54.0(-31.0)#66 | 52.0(-29.0)#2,686 |
| 67. | Markleville | 23.0 | 54.0(-31.0)#67 | 52.0(-29.0)#2,711 |
| 68. | Ridgeville | 23.0 | 54.0(-31.0)#68 | 52.0(-29.0)#2,714 |
| 69. | Dillsboro | 24.0 | 54.0(-30.0)#69 | 52.0(-28.0)#2,852 |
| 70. | Altona | 24.0 | 54.0(-30.0)#70 | 52.0(-28.0)#2,922 |
| 71. | Spurgeon | 24.0 | 54.0(-30.0)#71 | 52.0(-28.0)#2,949 |
| 72. | Peru | 25.0 | 54.0(-29.0)#72 | 52.0(-27.0)#2,983 |
| 73. | Plymouth | 25.0 | 54.0(-29.0)#73 | 52.0(-27.0)#2,985 |
| 74. | Linton | 25.0 | 54.0(-29.0)#74 | 52.0(-27.0)#3,002 |
| 75. | Upland | 25.0 | 54.0(-29.0)#75 | 52.0(-27.0)#3,017 |
| 76. | Greentown | 25.0 | 54.0(-29.0)#76 | 52.0(-27.0)#3,050 |
| 77. | Rocky Ripple | 25.0 | 54.0(-29.0)#77 | 52.0(-27.0)#3,127 |
| 78. | Perrysville | 25.0 | 54.0(-29.0)#78 | 52.0(-27.0)#3,132 |
| 79. | Kingsbury | 25.0 | 54.0(-29.0)#79 | 52.0(-27.0)#3,151 |
| 80. | Franklin | 26.0 | 54.0(-28.0)#80 | 52.0(-26.0)#3,169 |
| 81. | Brazil | 26.0 | 54.0(-28.0)#81 | 52.0(-26.0)#3,206 |
| 82. | Heritage Lake | 26.0 | 54.0(-28.0)#82 | 52.0(-26.0)#3,256 |
| 83. | Fairview Park | 26.0 | 54.0(-28.0)#83 | 52.0(-26.0)#3,288 |
| 84. | Bunker Hill | 26.0 | 54.0(-28.0)#84 | 52.0(-26.0)#3,306 |
| 85. | Harmony | 26.0 | 54.0(-28.0)#85 | 52.0(-26.0)#3,312 |
| 86. | Pennville | 26.0 | 54.0(-28.0)#86 | 52.0(-26.0)#3,314 |
| 87. | New Richmond | 26.0 | 54.0(-28.0)#87 | 52.0(-26.0)#3,331 |
| 88. | Burnettsville | 26.0 | 54.0(-28.0)#88 | 52.0(-26.0)#3,341 |
| 89. | Tennyson | 26.0 | 54.0(-28.0)#89 | 52.0(-26.0)#3,362 |
| 90. | Howe | 27.0 | 54.0(-27.0)#90 | 52.0(-25.0)#3,514 |
| 91. | Greencastle | 28.0 | 54.0(-26.0)#91 | 52.0(-24.0)#3,605 |
| 92. | Syracuse | 28.0 | 54.0(-26.0)#92 | 52.0(-24.0)#3,657 |
| 93. | Williamsport | 28.0 | 54.0(-26.0)#93 | 52.0(-24.0)#3,687 |
| 94. | Denver | 28.0 | 54.0(-26.0)#94 | 52.0(-24.0)#3,727 |
| 95. | Montezuma | 29.0 | 54.0(-25.0)#95 | 52.0(-23.0)#3,927 |
| 96. | New Ross | 29.0 | 54.0(-25.0)#96 | 52.0(-23.0)#3,961 |
| 97. | Orland | 29.0 | 54.0(-25.0)#97 | 52.0(-23.0)#3,964 |
| 98. | Lewisville | 29.0 | 54.0(-25.0)#98 | 52.0(-23.0)#3,970 |
| 99. | New Point | 29.0 | 54.0(-25.0)#99 | 52.0(-23.0)#3,974 |
| 100. | Fulton | 29.0 | 54.0(-25.0)#100 | 52.0(-23.0)#3,984 |
Common Questions
What are the Top 10 Cities with the Fewest Births per 1,000 Women Receiving Public Assitance in Indiana?
Top 10 Cities with the Fewest Births per 1,000 Women Receiving Public Assitance in Indiana are:
#1
4.0
#2
5.0
#3
5.0
#4
6.0
#5
6.0
#6
6.0
#7
6.0
#8
7.0
#9
7.0
#10
7.0
What city has the Fewest Births per 1,000 Women Receiving Public Assitance in Indiana?
Cumberland has the Fewest Births per 1,000 Women Receiving Public Assitance in Indiana with 4.0.
What is the Number of Births per 1,000 Women Receiving Public Assitance in the State of Indiana?
Number of Births per 1,000 Women Receiving Public Assitance in Indiana is 54.0.
What is the Number of Births per 1,000 Women Receiving Public Assitance in the United States?
Number of Births per 1,000 Women Receiving Public Assitance in the United States is 52.0.