Mackinac Island, MI Map & Demographics
Mackinac Island Map
Mackinac Island Overview
$46,343
PER CAPITA INCOME
$87,321
AVG FAMILY INCOME
$79,500
AVG HOUSEHOLD INCOME
28.1%
WAGE / INCOME GAP [ % ]
71.9¢/ $1
WAGE / INCOME GAP [ $ ]
0.40
INEQUALITY / GINI INDEX
836
TOTAL POPULATION
543
MALE POPULATION
293
FEMALE POPULATION
185.32
MALES / 100 FEMALES
53.96
FEMALES / 100 MALES
39.1
MEDIAN AGE
2.8
AVG FAMILY SIZE
1.9
AVG HOUSEHOLD SIZE
609
LABOR FORCE [ PEOPLE ]
80.7%
PERCENT IN LABOR FORCE
8.5%
UNEMPLOYMENT RATE
Mackinac Island Zip Codes
Income in Mackinac Island
Income Overview in Mackinac Island
Per Capita Income in Mackinac Island is $46,343, while median incomes of families and households are $87,321 and $79,500 respectively.
| Characteristic | Number | Measure |
| Per Capita Income | 836 | $46,343 |
| Median Family Income | 115 | $87,321 |
| Mean Family Income | 115 | $129,402 |
| Median Household Income | 344 | $79,500 |
| Mean Household Income | 344 | $107,031 |
| Income Deficit | 115 | $0 |
| Wage / Income Gap (%) | 836 | 28.13% |
| Wage / Income Gap ($) | 836 | 71.87¢ per $1 |
| Gini / Inequality Index | 836 | 0.40 |
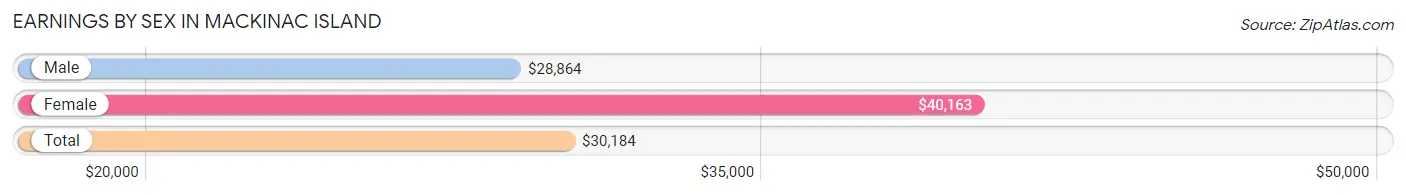
Earnings by Sex in Mackinac Island
Average Earnings in Mackinac Island are $30,184, $28,864 for men and $40,163 for women, a difference of 28.1%.
| Sex | Number | Average Earnings |
| Male | 456 (68.6%) | $28,864 |
| Female | 209 (31.4%) | $40,163 |
| Total | 665 (100.0%) | $30,184 |
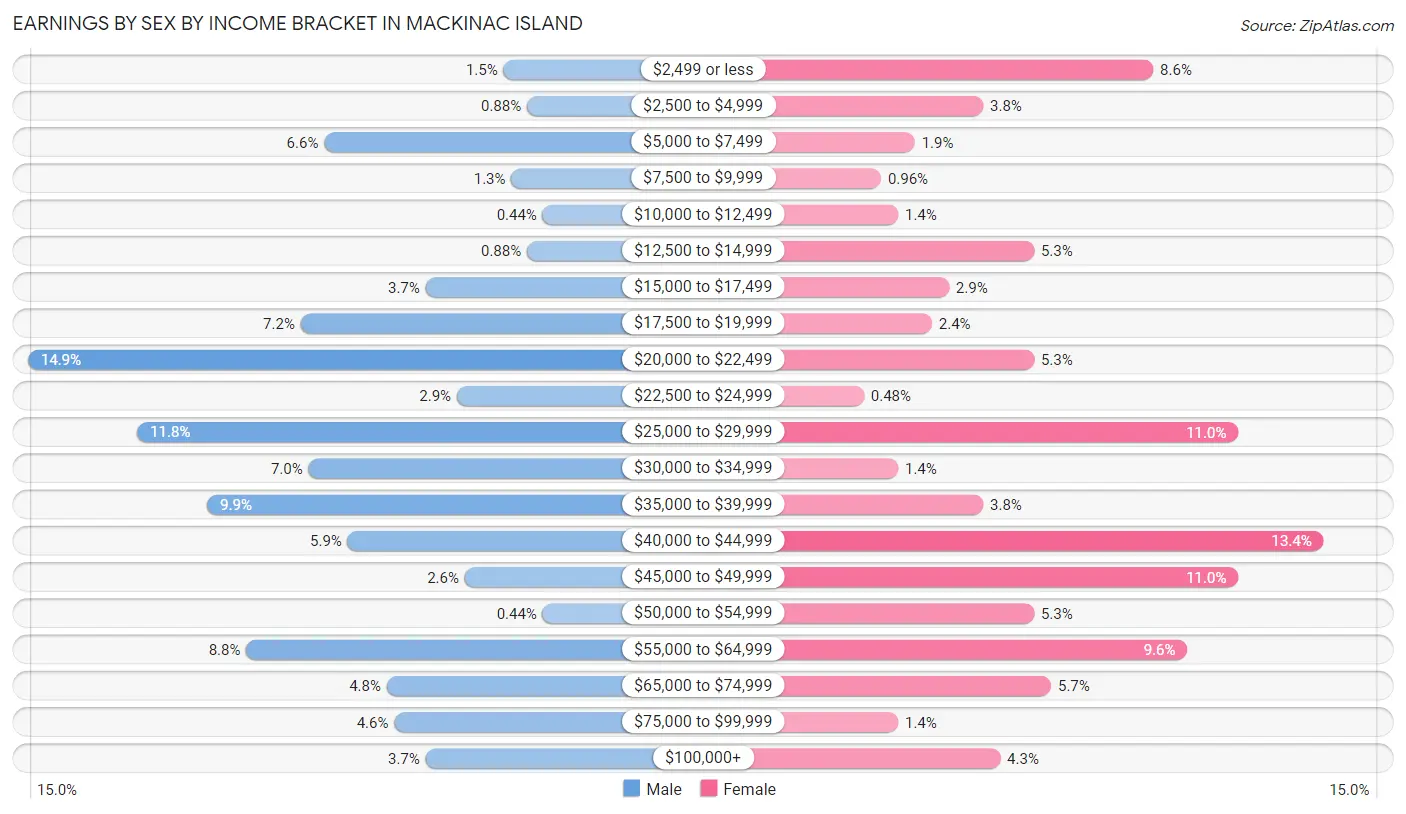
Earnings by Sex by Income Bracket in Mackinac Island
The most common earnings brackets in Mackinac Island are $20,000 to $22,499 for men (68 | 14.9%) and $40,000 to $44,999 for women (28 | 13.4%).
| Income | Male | Female |
| $2,499 or less | 7 (1.5%) | 18 (8.6%) |
| $2,500 to $4,999 | 4 (0.9%) | 8 (3.8%) |
| $5,000 to $7,499 | 30 (6.6%) | 4 (1.9%) |
| $7,500 to $9,999 | 6 (1.3%) | 2 (1.0%) |
| $10,000 to $12,499 | 2 (0.4%) | 3 (1.4%) |
| $12,500 to $14,999 | 4 (0.9%) | 11 (5.3%) |
| $15,000 to $17,499 | 17 (3.7%) | 6 (2.9%) |
| $17,500 to $19,999 | 33 (7.2%) | 5 (2.4%) |
| $20,000 to $22,499 | 68 (14.9%) | 11 (5.3%) |
| $22,500 to $24,999 | 13 (2.9%) | 1 (0.5%) |
| $25,000 to $29,999 | 54 (11.8%) | 23 (11.0%) |
| $30,000 to $34,999 | 32 (7.0%) | 3 (1.4%) |
| $35,000 to $39,999 | 45 (9.9%) | 8 (3.8%) |
| $40,000 to $44,999 | 27 (5.9%) | 28 (13.4%) |
| $45,000 to $49,999 | 12 (2.6%) | 23 (11.0%) |
| $50,000 to $54,999 | 2 (0.4%) | 11 (5.3%) |
| $55,000 to $64,999 | 40 (8.8%) | 20 (9.6%) |
| $65,000 to $74,999 | 22 (4.8%) | 12 (5.7%) |
| $75,000 to $99,999 | 21 (4.6%) | 3 (1.4%) |
| $100,000+ | 17 (3.7%) | 9 (4.3%) |
| Total | 456 (100.0%) | 209 (100.0%) |
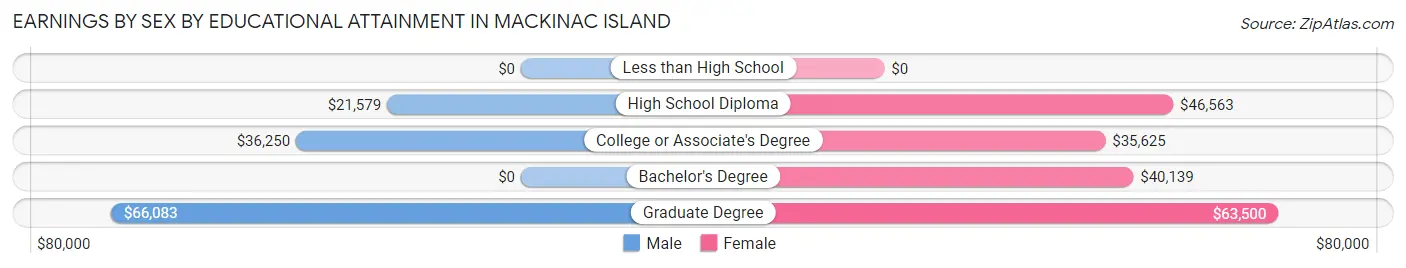
Earnings by Sex by Educational Attainment in Mackinac Island
Average earnings in Mackinac Island are $27,266 for men and $43,750 for women, a difference of 37.7%. Men with an educational attainment of graduate degree enjoy the highest average annual earnings of $66,083, while those with high school diploma education earn the least with $21,579. Women with an educational attainment of graduate degree earn the most with the average annual earnings of $63,500, while those with college or associate's degree education have the smallest earnings of $35,625.
| Educational Attainment | Male Income | Female Income |
| Less than High School | - | - |
| High School Diploma | $21,579 | $46,563 |
| College or Associate's Degree | $36,250 | $35,625 |
| Bachelor's Degree | - | - |
| Graduate Degree | $66,083 | $63,500 |
| Total | $27,266 | $43,750 |
Family Income in Mackinac Island
Family Income Brackets in Mackinac Island
According to the Mackinac Island family income data, there are 29 families falling into the $50,000 to $74,999 income range, which is the most common income bracket and makes up 25.2% of all families.
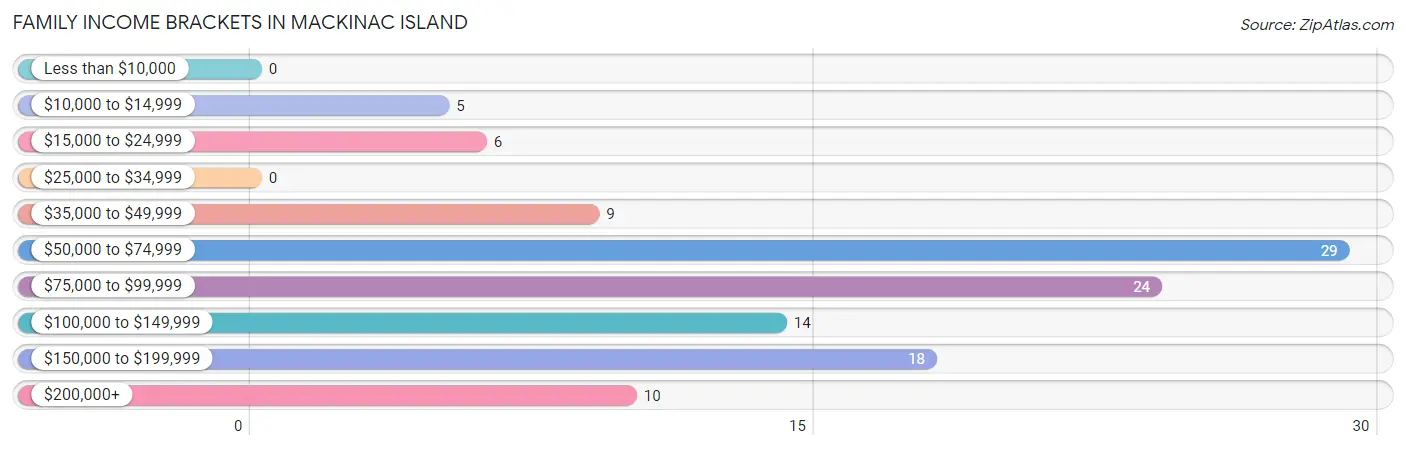
| Income Bracket | # Families | % Families |
| Less than $10,000 | 0 | 0.0% |
| $10,000 to $14,999 | 5 | 4.3% |
| $15,000 to $24,999 | 6 | 5.2% |
| $25,000 to $34,999 | 0 | 0.0% |
| $35,000 to $49,999 | 9 | 7.8% |
| $50,000 to $74,999 | 29 | 25.2% |
| $75,000 to $99,999 | 24 | 20.9% |
| $100,000 to $149,999 | 14 | 12.2% |
| $150,000 to $199,999 | 18 | 15.7% |
| $200,000+ | 10 | 8.7% |
Family Income by Famaliy Size in Mackinac Island
4-person families (10 | 8.7%) account for the highest median family income in Mackinac Island with $106,250 per family, while 2-person families (56 | 48.7%) have the highest median income of $36,250 per family member.
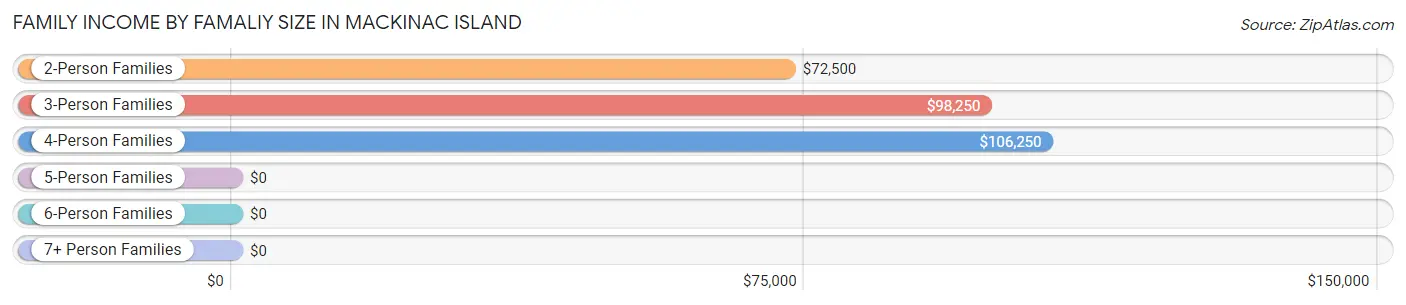
| Income Bracket | # Families | Median Income |
| 2-Person Families | 56 (48.7%) | $72,500 |
| 3-Person Families | 38 (33.0%) | $98,250 |
| 4-Person Families | 10 (8.7%) | $106,250 |
| 5-Person Families | 6 (5.2%) | $0 |
| 6-Person Families | 5 (4.3%) | $0 |
| 7+ Person Families | 0 (0.0%) | $0 |
| Total | 115 (100.0%) | $87,321 |
Family Income by Number of Earners in Mackinac Island
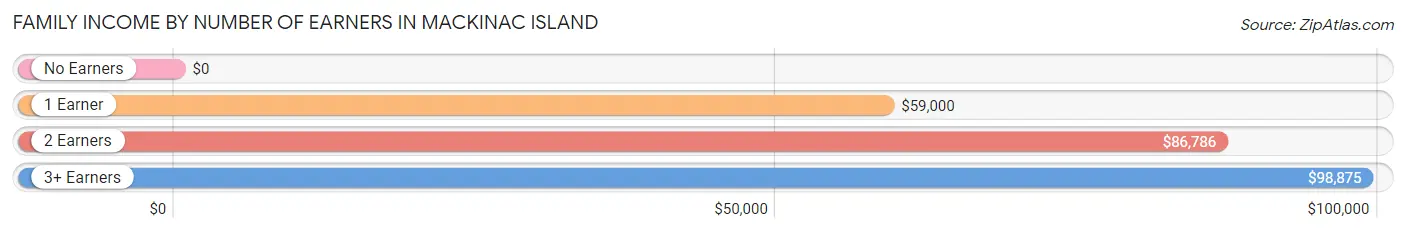
| Number of Earners | # Families | Median Income |
| No Earners | 16 (13.9%) | $0 |
| 1 Earner | 42 (36.5%) | $59,000 |
| 2 Earners | 40 (34.8%) | $86,786 |
| 3+ Earners | 17 (14.8%) | $98,875 |
| Total | 115 (100.0%) | $87,321 |
Household Income in Mackinac Island
Household Income Brackets in Mackinac Island
With 88 households falling in the category, the $75,000 to $99,999 income range is the most frequent in Mackinac Island, accounting for 25.6% of all households.
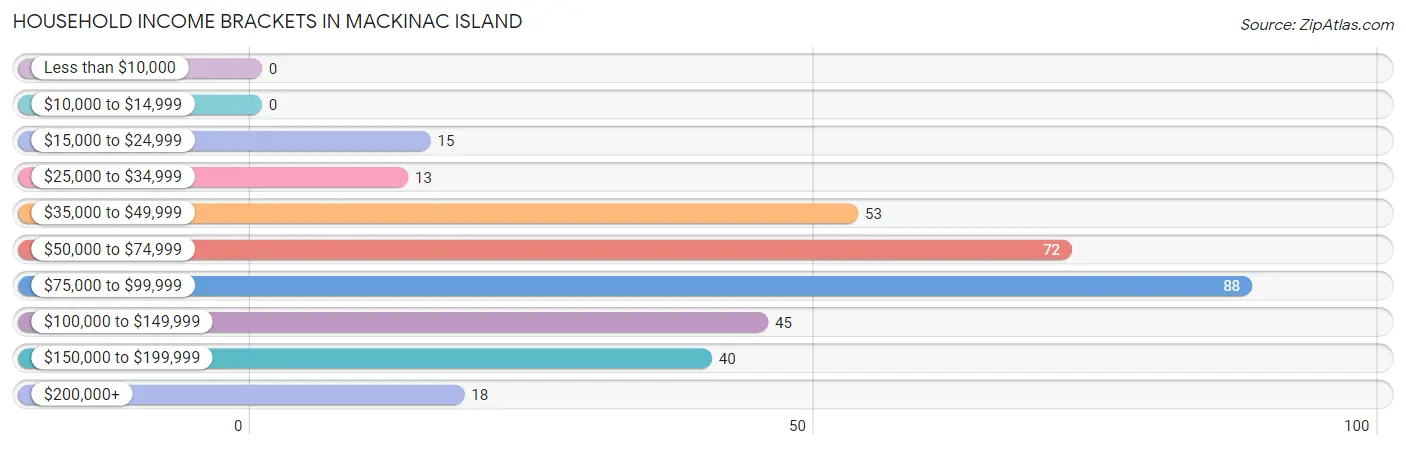
| Income Bracket | # Households | % Households |
| Less than $10,000 | 0 | 0.0% |
| $10,000 to $14,999 | 0 | 0.0% |
| $15,000 to $24,999 | 15 | 4.4% |
| $25,000 to $34,999 | 13 | 3.8% |
| $35,000 to $49,999 | 53 | 15.4% |
| $50,000 to $74,999 | 72 | 20.9% |
| $75,000 to $99,999 | 88 | 25.6% |
| $100,000 to $149,999 | 45 | 13.1% |
| $150,000 to $199,999 | 40 | 11.6% |
| $200,000+ | 18 | 5.2% |
Household Income by Householder Age in Mackinac Island
The median household income in Mackinac Island is $79,500, with the highest median household income of $97,875 found in the 45 to 64 years age bracket for the primary householder. A total of 87 households (25.3%) fall into this category. Meanwhile, the 15 to 24 years age bracket for the primary householder has the lowest median household income of $0, with 69 households (20.1%) in this group.
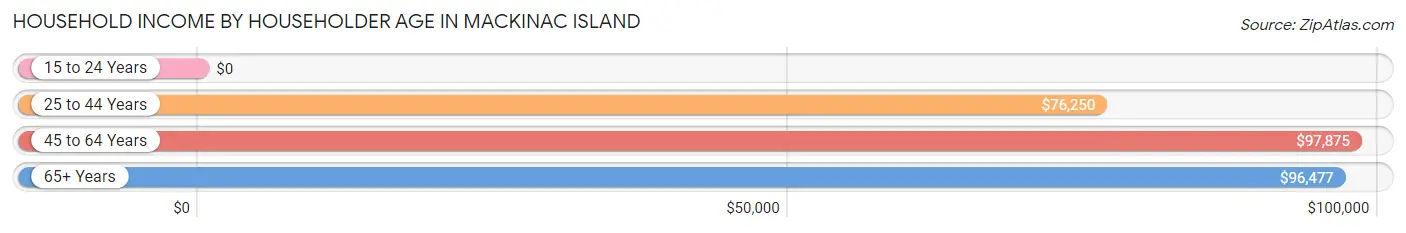
| Income Bracket | # Households | Median Income |
| 15 to 24 Years | 69 (20.1%) | $0 |
| 25 to 44 Years | 109 (31.7%) | $76,250 |
| 45 to 64 Years | 87 (25.3%) | $97,875 |
| 65+ Years | 79 (23.0%) | $96,477 |
| Total | 344 (100.0%) | $79,500 |
Poverty in Mackinac Island
Income Below Poverty by Sex and Age in Mackinac Island
With 7.2% poverty level for males and 10.3% for females among the residents of Mackinac Island, 12 to 14 year old males and 18 to 24 year old females are the most vulnerable to poverty, with 7 males (100.0%) and 14 females (40.0%) in their respective age groups living below the poverty level.
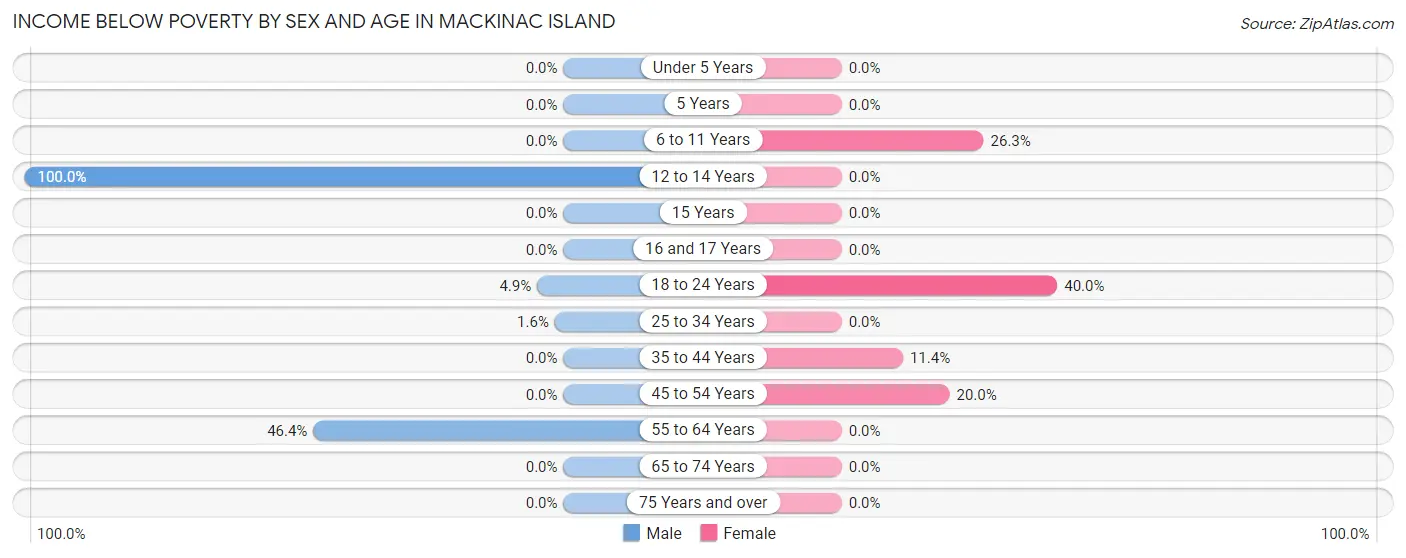
| Age Bracket | Male | Female |
| Under 5 Years | 0 (0.0%) | 0 (0.0%) |
| 5 Years | 0 (0.0%) | 0 (0.0%) |
| 6 to 11 Years | 0 (0.0%) | 5 (26.3%) |
| 12 to 14 Years | 7 (100.0%) | 0 (0.0%) |
| 15 Years | 0 (0.0%) | 0 (0.0%) |
| 16 and 17 Years | 0 (0.0%) | 0 (0.0%) |
| 18 to 24 Years | 4 (4.9%) | 14 (40.0%) |
| 25 to 34 Years | 2 (1.6%) | 0 (0.0%) |
| 35 to 44 Years | 0 (0.0%) | 5 (11.4%) |
| 45 to 54 Years | 0 (0.0%) | 6 (20.0%) |
| 55 to 64 Years | 26 (46.4%) | 0 (0.0%) |
| 65 to 74 Years | 0 (0.0%) | 0 (0.0%) |
| 75 Years and over | 0 (0.0%) | 0 (0.0%) |
| Total | 39 (7.2%) | 30 (10.3%) |
Income Above Poverty by Sex and Age in Mackinac Island
According to the poverty statistics in Mackinac Island, males aged under 5 years and females aged under 5 years are the age groups that are most secure financially, with 100.0% of males and 100.0% of females in these age groups living above the poverty line.
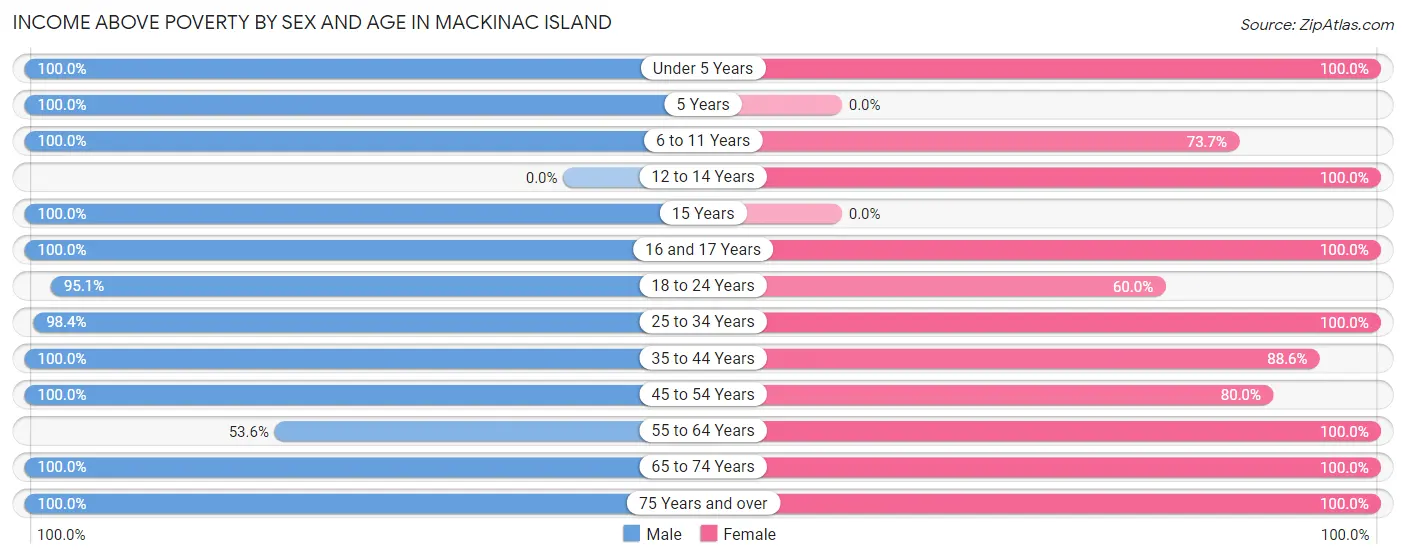
| Age Bracket | Male | Female |
| Under 5 Years | 7 (100.0%) | 5 (100.0%) |
| 5 Years | 10 (100.0%) | 0 (0.0%) |
| 6 to 11 Years | 15 (100.0%) | 14 (73.7%) |
| 12 to 14 Years | 0 (0.0%) | 12 (100.0%) |
| 15 Years | 6 (100.0%) | 0 (0.0%) |
| 16 and 17 Years | 3 (100.0%) | 14 (100.0%) |
| 18 to 24 Years | 78 (95.1%) | 21 (60.0%) |
| 25 to 34 Years | 123 (98.4%) | 51 (100.0%) |
| 35 to 44 Years | 78 (100.0%) | 39 (88.6%) |
| 45 to 54 Years | 88 (100.0%) | 24 (80.0%) |
| 55 to 64 Years | 30 (53.6%) | 37 (100.0%) |
| 65 to 74 Years | 49 (100.0%) | 27 (100.0%) |
| 75 Years and over | 16 (100.0%) | 16 (100.0%) |
| Total | 503 (92.8%) | 260 (89.7%) |
Income Below Poverty Among Married-Couple Families in Mackinac Island
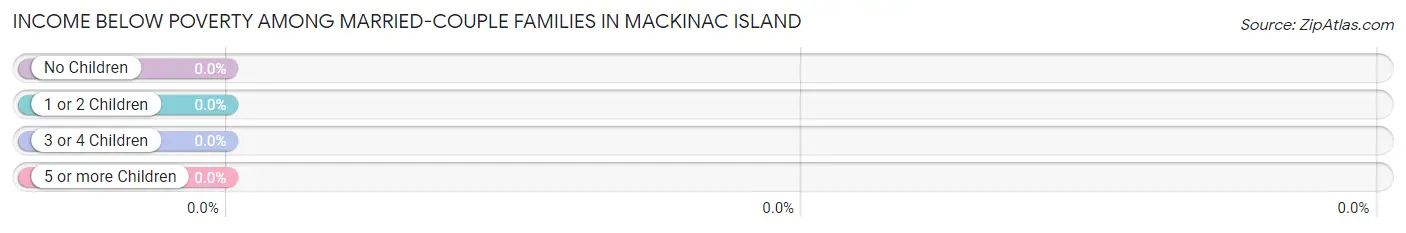
| Children | Above Poverty | Below Poverty |
| No Children | 49 (100.0%) | 0 (0.0%) |
| 1 or 2 Children | 25 (100.0%) | 0 (0.0%) |
| 3 or 4 Children | 11 (100.0%) | 0 (0.0%) |
| 5 or more Children | 0 (0.0%) | 0 (0.0%) |
| Total | 85 (100.0%) | 0 (0.0%) |
Income Below Poverty Among Single-Parent Households in Mackinac Island
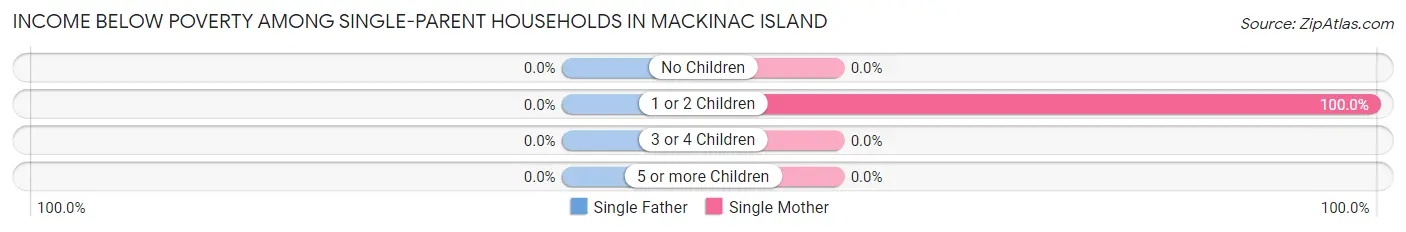
| Children | Single Father | Single Mother |
| No Children | 0 (0.0%) | 0 (0.0%) |
| 1 or 2 Children | 0 (0.0%) | 11 (100.0%) |
| 3 or 4 Children | 0 (0.0%) | 0 (0.0%) |
| 5 or more Children | 0 (0.0%) | 0 (0.0%) |
| Total | 0 (0.0%) | 11 (73.3%) |
Income Below Poverty Among Married-Couple vs Single-Parent Households in Mackinac Island
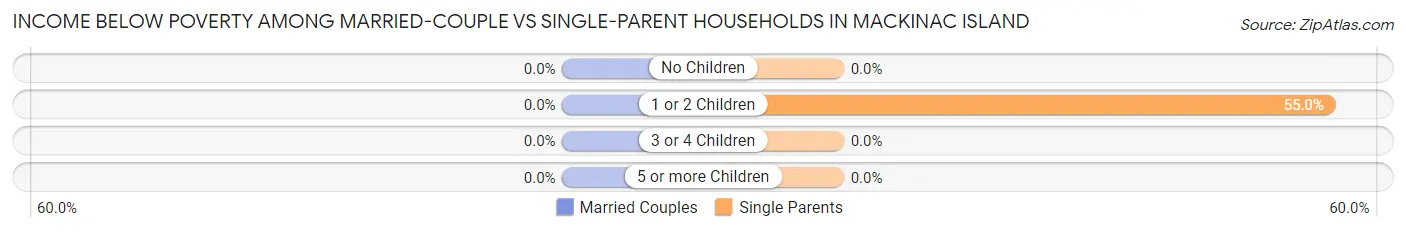
| Children | Married-Couple Families | Single-Parent Households |
| No Children | 0 (0.0%) | 0 (0.0%) |
| 1 or 2 Children | 0 (0.0%) | 11 (55.0%) |
| 3 or 4 Children | 0 (0.0%) | 0 (0.0%) |
| 5 or more Children | 0 (0.0%) | 0 (0.0%) |
| Total | 0 (0.0%) | 11 (36.7%) |
Race in Mackinac Island
The most populous races in Mackinac Island are White / Caucasian (485 | 58.0%), Two or more Races (117 | 14.0%), and Black / African American (102 | 12.2%).
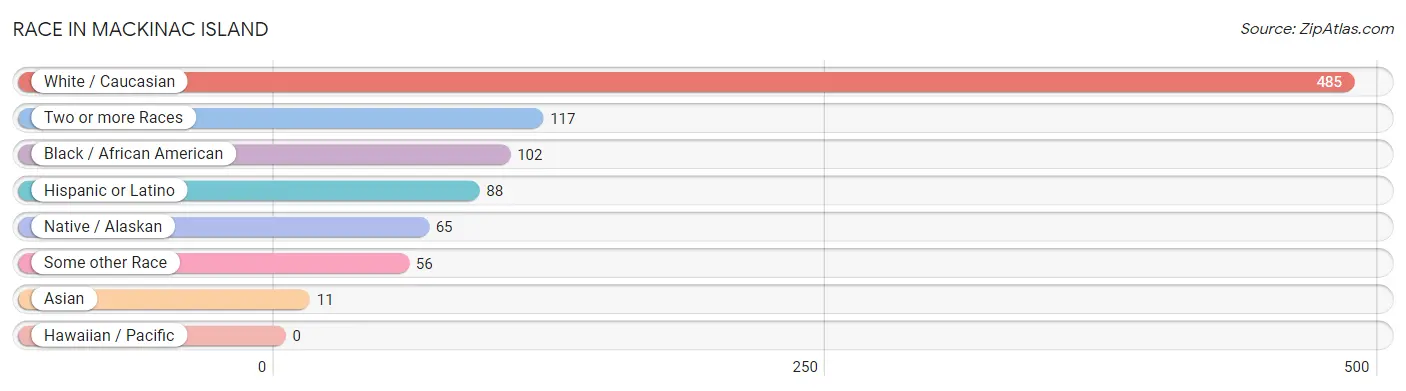
| Race | # Population | % Population |
| Asian | 11 | 1.3% |
| Black / African American | 102 | 12.2% |
| Hawaiian / Pacific | 0 | 0.0% |
| Hispanic or Latino | 88 | 10.5% |
| Native / Alaskan | 65 | 7.8% |
| White / Caucasian | 485 | 58.0% |
| Two or more Races | 117 | 14.0% |
| Some other Race | 56 | 6.7% |
| Total | 836 | 100.0% |
Ancestry in Mackinac Island
The most populous ancestries reported in Mackinac Island are English (102 | 12.2%), Irish (95 | 11.4%), Mexican (88 | 10.5%), German (69 | 8.3%), and Polish (64 | 7.7%), together accounting for 50.0% of all Mackinac Island residents.
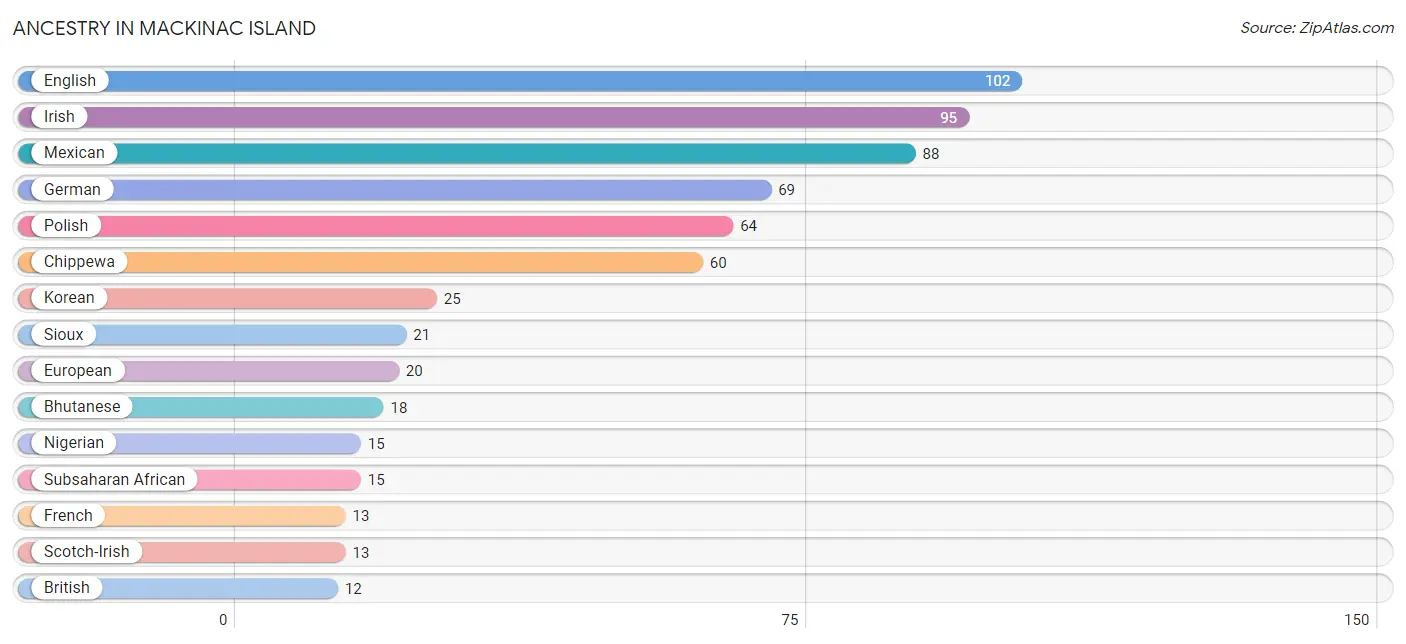
| Ancestry | # Population | % Population |
| American | 7 | 0.8% |
| Austrian | 4 | 0.5% |
| Belgian | 2 | 0.2% |
| Bhutanese | 18 | 2.1% |
| British | 12 | 1.4% |
| Chippewa | 60 | 7.2% |
| Czech | 3 | 0.4% |
| Dutch | 10 | 1.2% |
| English | 102 | 12.2% |
| European | 20 | 2.4% |
| French | 13 | 1.6% |
| French Canadian | 6 | 0.7% |
| German | 69 | 8.3% |
| Greek | 3 | 0.4% |
| Hungarian | 7 | 0.8% |
| Irish | 95 | 11.4% |
| Italian | 6 | 0.7% |
| Korean | 25 | 3.0% |
| Mexican | 88 | 10.5% |
| Nigerian | 15 | 1.8% |
| Northern European | 4 | 0.5% |
| Norwegian | 2 | 0.2% |
| Polish | 64 | 7.7% |
| Portuguese | 3 | 0.4% |
| Russian | 5 | 0.6% |
| Scandinavian | 12 | 1.4% |
| Scotch-Irish | 13 | 1.6% |
| Scottish | 11 | 1.3% |
| Sioux | 21 | 2.5% |
| Subsaharan African | 15 | 1.8% |
| Swedish | 2 | 0.2% |
| Swiss | 2 | 0.2% |
| Welsh | 7 | 0.8% | View All 33 Rows |
Immigrants in Mackinac Island
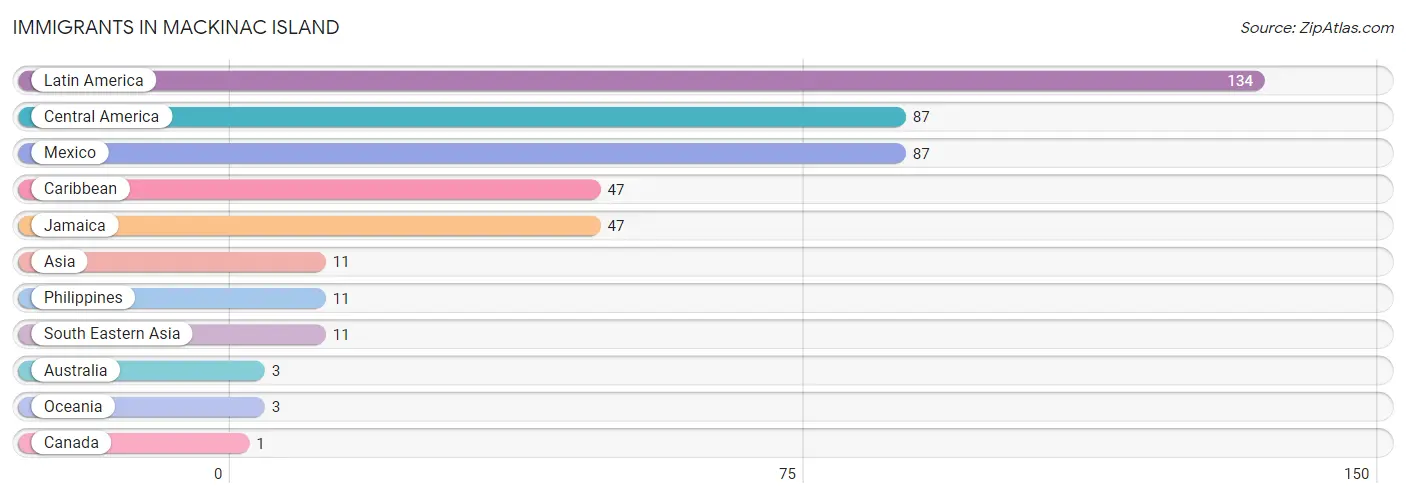
The most numerous immigrant groups reported in Mackinac Island came from Latin America (134 | 16.0%), Central America (87 | 10.4%), Mexico (87 | 10.4%), Caribbean (47 | 5.6%), and Jamaica (47 | 5.6%), together accounting for 48.1% of all Mackinac Island residents.
| Immigration Origin | # Population | % Population |
| Asia | 11 | 1.3% |
| Australia | 3 | 0.4% |
| Canada | 1 | 0.1% |
| Caribbean | 47 | 5.6% |
| Central America | 87 | 10.4% |
| Jamaica | 47 | 5.6% |
| Latin America | 134 | 16.0% |
| Mexico | 87 | 10.4% |
| Oceania | 3 | 0.4% |
| Philippines | 11 | 1.3% |
| South Eastern Asia | 11 | 1.3% | View All 11 Rows |
Sex and Age in Mackinac Island
Sex and Age in Mackinac Island
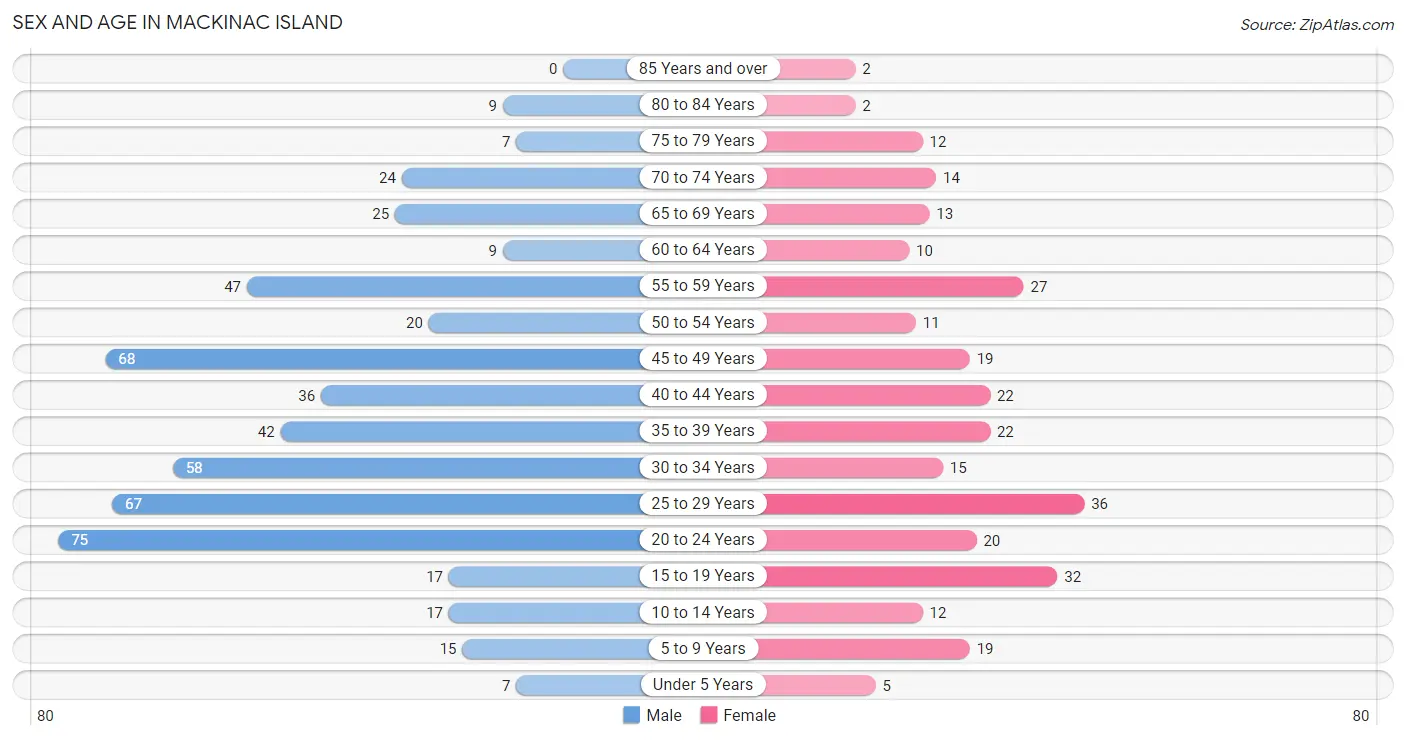
The most populous age groups in Mackinac Island are 20 to 24 Years (75 | 13.8%) for men and 25 to 29 Years (36 | 12.3%) for women.
| Age Bracket | Male | Female |
| Under 5 Years | 7 (1.3%) | 5 (1.7%) |
| 5 to 9 Years | 15 (2.8%) | 19 (6.5%) |
| 10 to 14 Years | 17 (3.1%) | 12 (4.1%) |
| 15 to 19 Years | 17 (3.1%) | 32 (10.9%) |
| 20 to 24 Years | 75 (13.8%) | 20 (6.8%) |
| 25 to 29 Years | 67 (12.3%) | 36 (12.3%) |
| 30 to 34 Years | 58 (10.7%) | 15 (5.1%) |
| 35 to 39 Years | 42 (7.7%) | 22 (7.5%) |
| 40 to 44 Years | 36 (6.6%) | 22 (7.5%) |
| 45 to 49 Years | 68 (12.5%) | 19 (6.5%) |
| 50 to 54 Years | 20 (3.7%) | 11 (3.7%) |
| 55 to 59 Years | 47 (8.7%) | 27 (9.2%) |
| 60 to 64 Years | 9 (1.7%) | 10 (3.4%) |
| 65 to 69 Years | 25 (4.6%) | 13 (4.4%) |
| 70 to 74 Years | 24 (4.4%) | 14 (4.8%) |
| 75 to 79 Years | 7 (1.3%) | 12 (4.1%) |
| 80 to 84 Years | 9 (1.7%) | 2 (0.7%) |
| 85 Years and over | 0 (0.0%) | 2 (0.7%) |
| Total | 543 (100.0%) | 293 (100.0%) |
Families and Households in Mackinac Island
Median Family Size in Mackinac Island
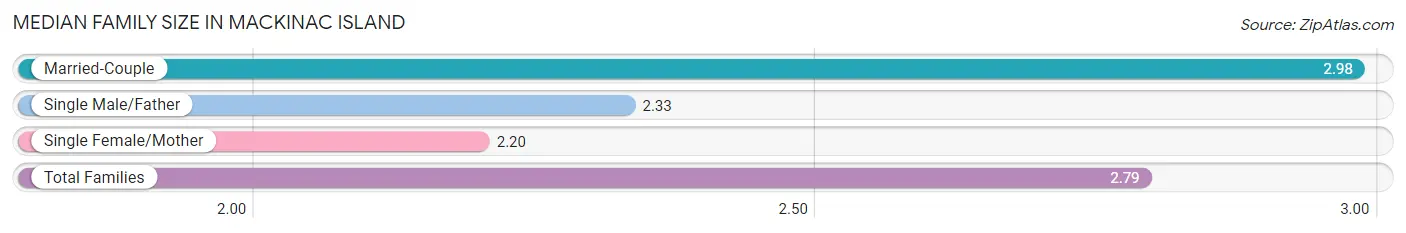
The median family size in Mackinac Island is 2.79 persons per family, with married-couple families (85 | 73.9%) accounting for the largest median family size of 2.98 persons per family. On the other hand, single female/mother families (15 | 13.0%) represent the smallest median family size with 2.20 persons per family.
| Family Type | # Families | Family Size |
| Married-Couple | 85 (73.9%) | 2.98 |
| Single Male/Father | 15 (13.0%) | 2.33 |
| Single Female/Mother | 15 (13.0%) | 2.20 |
| Total Families | 115 (100.0%) | 2.79 |
Median Household Size in Mackinac Island
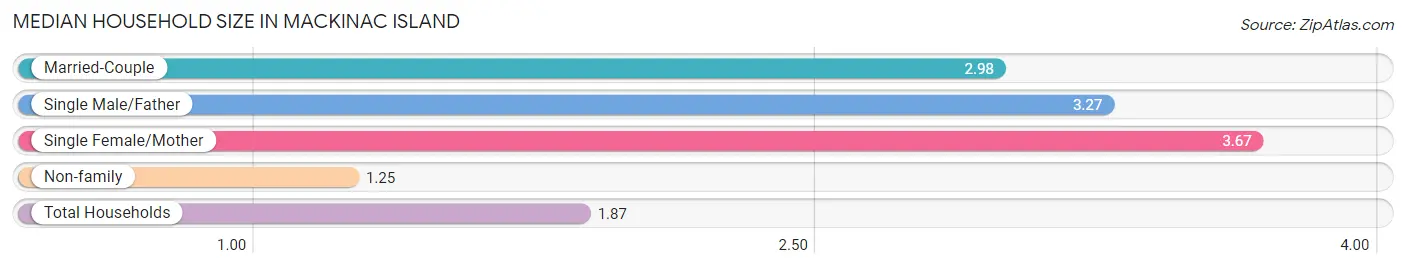
The median household size in Mackinac Island is 1.87 persons per household, with single female/mother households (15 | 4.4%) accounting for the largest median household size of 3.67 persons per household. non-family households (229 | 66.6%) represent the smallest median household size with 1.25 persons per household.
| Household Type | # Households | Household Size |
| Married-Couple | 85 (24.7%) | 2.98 |
| Single Male/Father | 15 (4.4%) | 3.27 |
| Single Female/Mother | 15 (4.4%) | 3.67 |
| Non-family | 229 (66.6%) | 1.25 |
| Total Households | 344 (100.0%) | 1.87 |
Household Size by Marriage Status in Mackinac Island
Out of a total of 344 households in Mackinac Island, 115 (33.4%) are family households, while 229 (66.6%) are nonfamily households. The most numerous type of family households are 2-person households, comprising 44, and the most common type of nonfamily households are 1-person households, comprising 151.
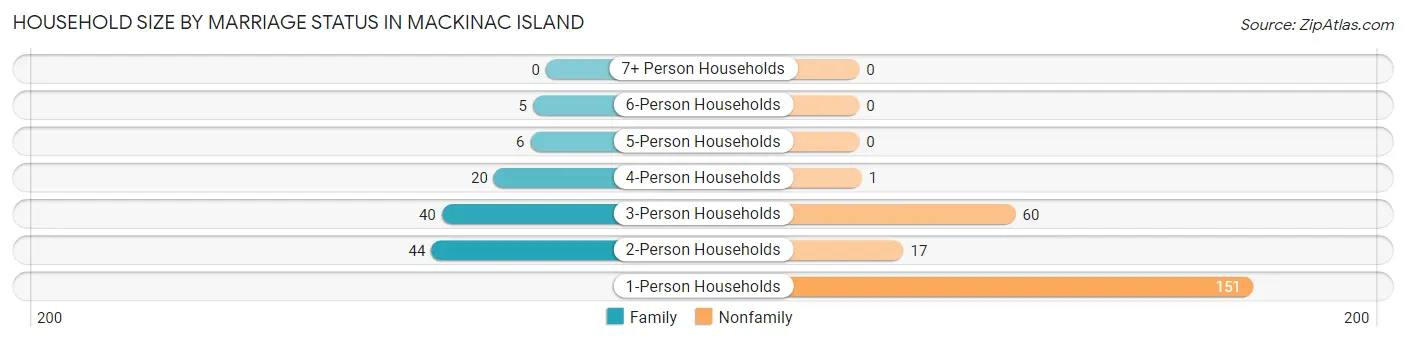
| Household Size | Family Households | Nonfamily Households |
| 1-Person Households | - | 151 (43.9%) |
| 2-Person Households | 44 (12.8%) | 17 (4.9%) |
| 3-Person Households | 40 (11.6%) | 60 (17.4%) |
| 4-Person Households | 20 (5.8%) | 1 (0.3%) |
| 5-Person Households | 6 (1.7%) | 0 (0.0%) |
| 6-Person Households | 5 (1.5%) | 0 (0.0%) |
| 7+ Person Households | 0 (0.0%) | 0 (0.0%) |
| Total | 115 (33.4%) | 229 (66.6%) |
Female Fertility in Mackinac Island
Fertility by Age in Mackinac Island
Average fertility rate in Mackinac Island is 24.0 births per 1,000 women. Women in the age bracket of 20 to 34 years have the highest fertility rate with 56.0 births per 1,000 women. Women in the age bracket of 20 to 34 years acount for 100.0% of all women with births.
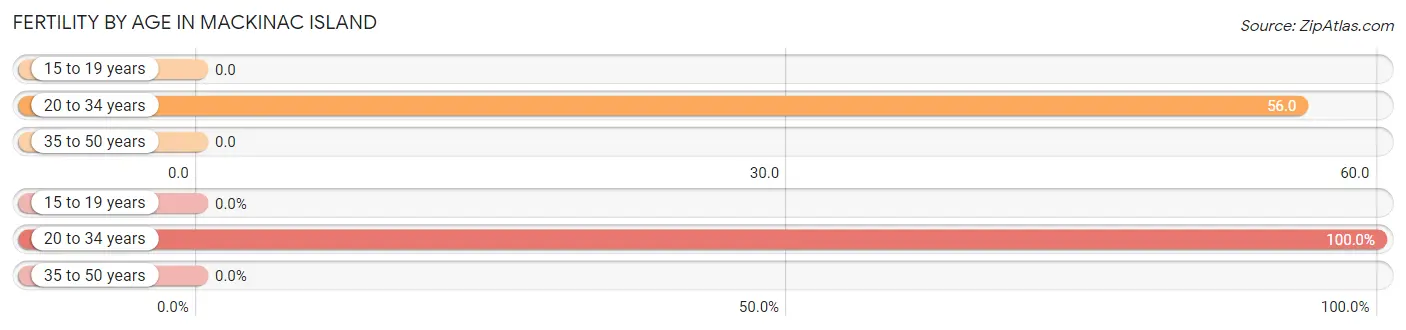
| Age Bracket | Women with Births | Births / 1,000 Women |
| 15 to 19 years | 0 (0.0%) | 0.0 |
| 20 to 34 years | 4 (100.0%) | 56.0 |
| 35 to 50 years | 0 (0.0%) | 0.0 |
| Total | 4 (100.0%) | 24.0 |
Fertility by Age by Marriage Status in Mackinac Island
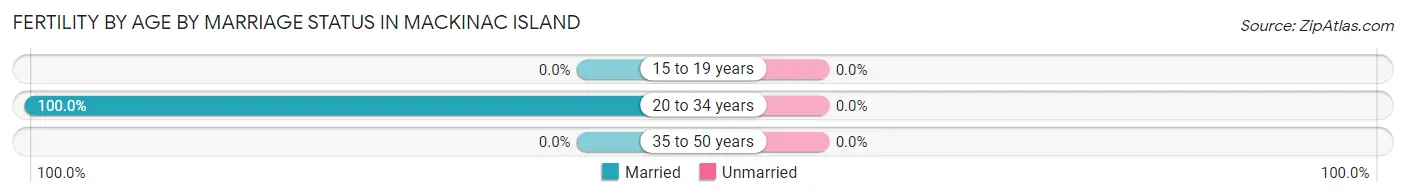
| Age Bracket | Married | Unmarried |
| 15 to 19 years | 0 (0.0%) | 0 (0.0%) |
| 20 to 34 years | 4 (100.0%) | 0 (0.0%) |
| 35 to 50 years | 0 (0.0%) | 0 (0.0%) |
| Total | 4 (100.0%) | 0 (0.0%) |
Fertility by Education in Mackinac Island
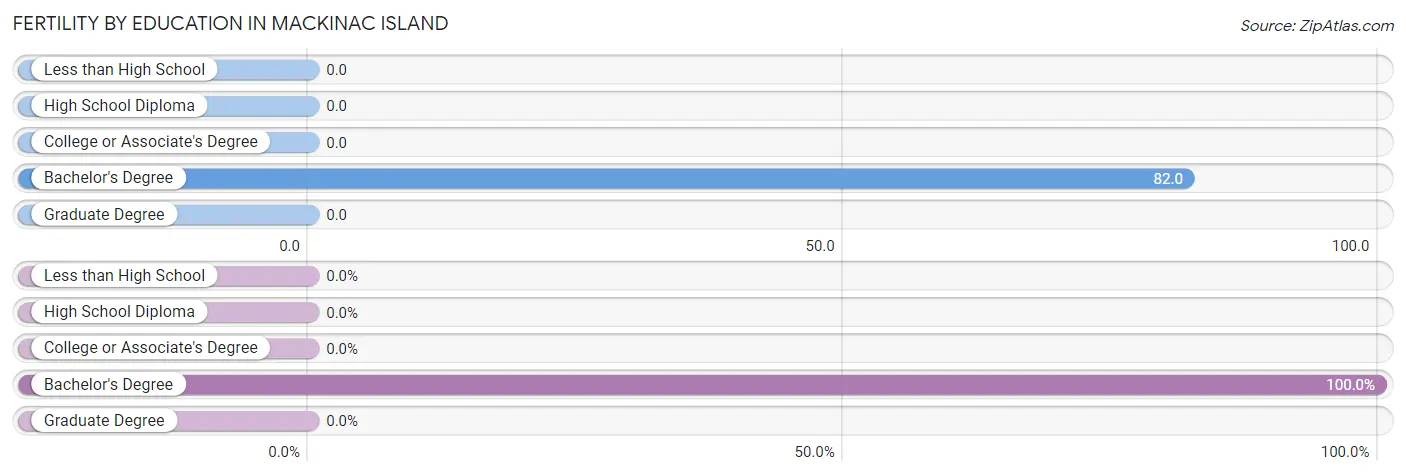
| Educational Attainment | Women with Births | Births / 1,000 Women |
| Less than High School | 0 (0.0%) | 0.0 |
| High School Diploma | 0 (0.0%) | 0.0 |
| College or Associate's Degree | 0 (0.0%) | 0.0 |
| Bachelor's Degree | 4 (100.0%) | 82.0 |
| Graduate Degree | 0 (0.0%) | 0.0 |
| Total | 4 (100.0%) | 24.0 |
Fertility by Education by Marriage Status in Mackinac Island
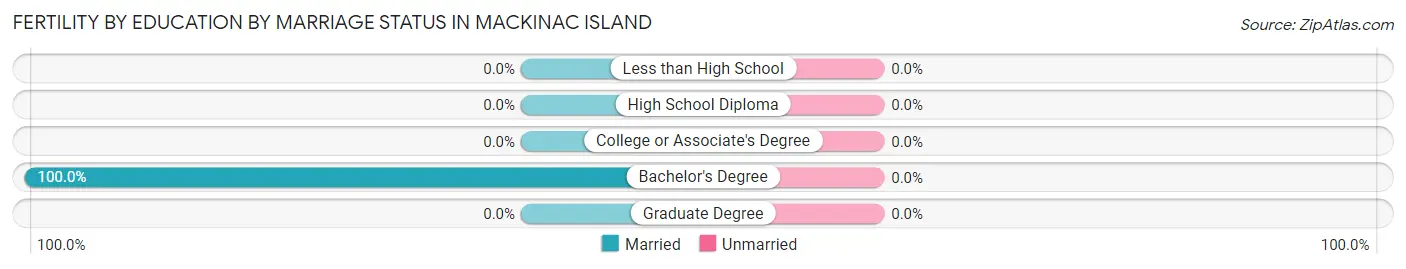
| Educational Attainment | Married | Unmarried |
| Less than High School | 0 (0.0%) | 0 (0.0%) |
| High School Diploma | 0 (0.0%) | 0 (0.0%) |
| College or Associate's Degree | 0 (0.0%) | 0 (0.0%) |
| Bachelor's Degree | 4 (100.0%) | 0 (0.0%) |
| Graduate Degree | 0 (0.0%) | 0 (0.0%) |
| Total | 4 (100.0%) | 0 (0.0%) |
Employment Characteristics in Mackinac Island
Employment by Class of Employer in Mackinac Island
Among the 552 employed individuals in Mackinac Island, private company employees (372 | 67.4%), not-for-profit organizations (98 | 17.7%), and self-employed (incorporated) (34 | 6.2%) make up the most common classes of employment.
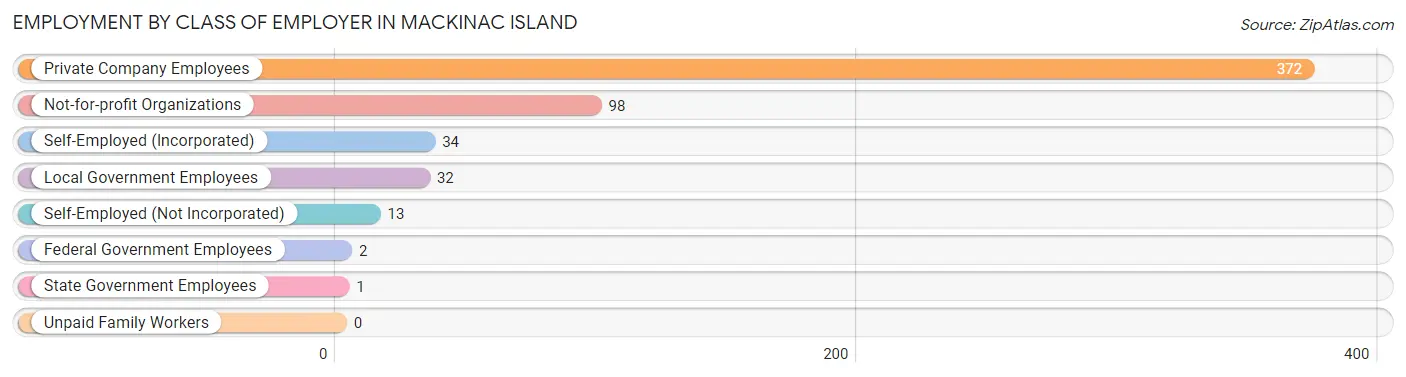
| Employer Class | # Employees | % Employees |
| Private Company Employees | 372 | 67.4% |
| Self-Employed (Incorporated) | 34 | 6.2% |
| Self-Employed (Not Incorporated) | 13 | 2.4% |
| Not-for-profit Organizations | 98 | 17.7% |
| Local Government Employees | 32 | 5.8% |
| State Government Employees | 1 | 0.2% |
| Federal Government Employees | 2 | 0.4% |
| Unpaid Family Workers | 0 | 0.0% |
| Total | 552 | 100.0% |
Employment Status by Age in Mackinac Island
According to the labor force statistics for Mackinac Island, out of the total population over 16 years of age (755), 80.7% or 609 individuals are in the labor force, with 8.5% or 52 of them unemployed. The age group with the highest labor force participation rate is 25 to 29 years, with 100.0% or 103 individuals in the labor force. Within the labor force, the 35 to 44 years age range has the highest percentage of unemployed individuals, with 32.1% or 36 of them being unemployed.
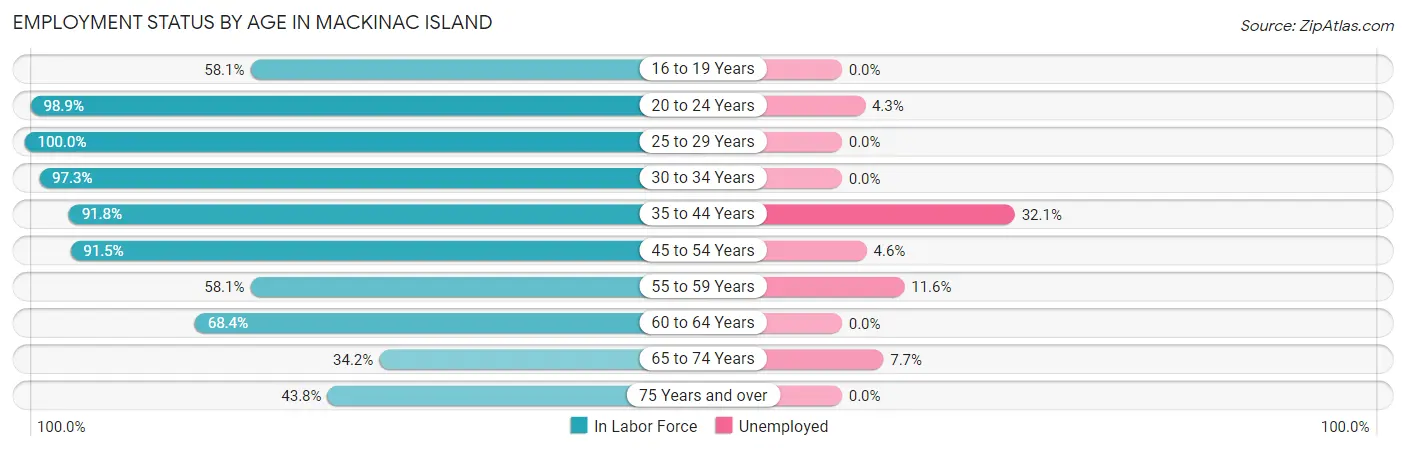
| Age Bracket | In Labor Force | Unemployed |
| 16 to 19 Years | 25 (58.1%) | 0 (0.0%) |
| 20 to 24 Years | 94 (98.9%) | 4 (4.3%) |
| 25 to 29 Years | 103 (100.0%) | 0 (0.0%) |
| 30 to 34 Years | 71 (97.3%) | 0 (0.0%) |
| 35 to 44 Years | 112 (91.8%) | 36 (32.1%) |
| 45 to 54 Years | 108 (91.5%) | 5 (4.6%) |
| 55 to 59 Years | 43 (58.1%) | 5 (11.6%) |
| 60 to 64 Years | 13 (68.4%) | 0 (0.0%) |
| 65 to 74 Years | 26 (34.2%) | 2 (7.7%) |
| 75 Years and over | 14 (43.8%) | 0 (0.0%) |
| Total | 609 (80.7%) | 52 (8.5%) |
Employment Status by Educational Attainment in Mackinac Island
According to labor force statistics for Mackinac Island, 88.4% of individuals (450) out of the total population between 25 and 64 years of age (509) are in the labor force, with 10.2% or 46 of them being unemployed. The group with the highest labor force participation rate are those with the educational attainment of less than high school, with 98.1% or 52 individuals in the labor force. Within the labor force, individuals with bachelor's degree or higher education have the highest percentage of unemployment, with 21.9% or 32 of them being unemployed.
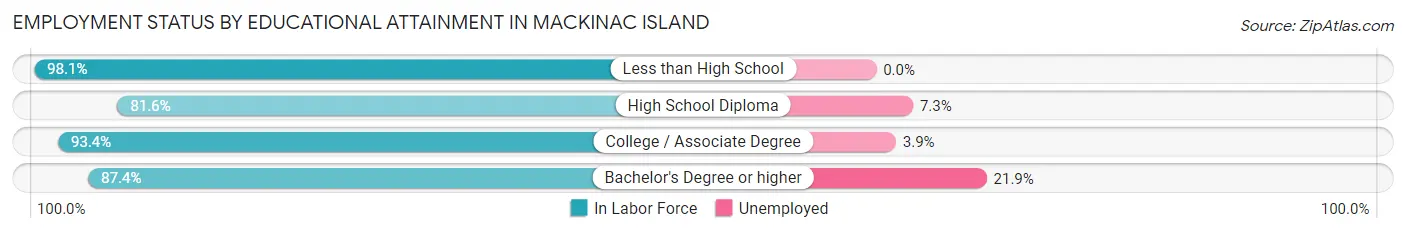
| Educational Attainment | In Labor Force | Unemployed |
| Less than High School | 52 (98.1%) | 0 (0.0%) |
| High School Diploma | 124 (81.6%) | 11 (7.3%) |
| College / Associate Degree | 128 (93.4%) | 5 (3.9%) |
| Bachelor's Degree or higher | 146 (87.4%) | 37 (21.9%) |
| Total | 450 (88.4%) | 52 (10.2%) |
Employment Occupations by Sex in Mackinac Island
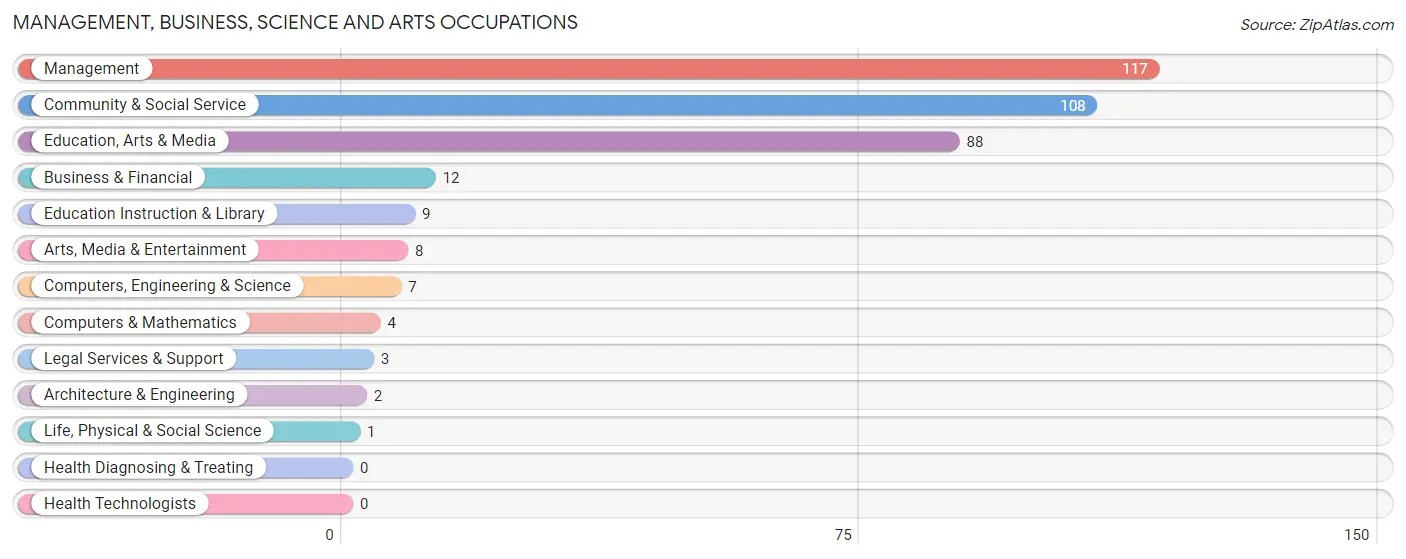
Management, Business, Science and Arts Occupations
The most common Management, Business, Science and Arts occupations in Mackinac Island are Management (117 | 21.0%), Community & Social Service (108 | 19.4%), Education, Arts & Media (88 | 15.8%), Business & Financial (12 | 2.1%), and Education Instruction & Library (9 | 1.6%).
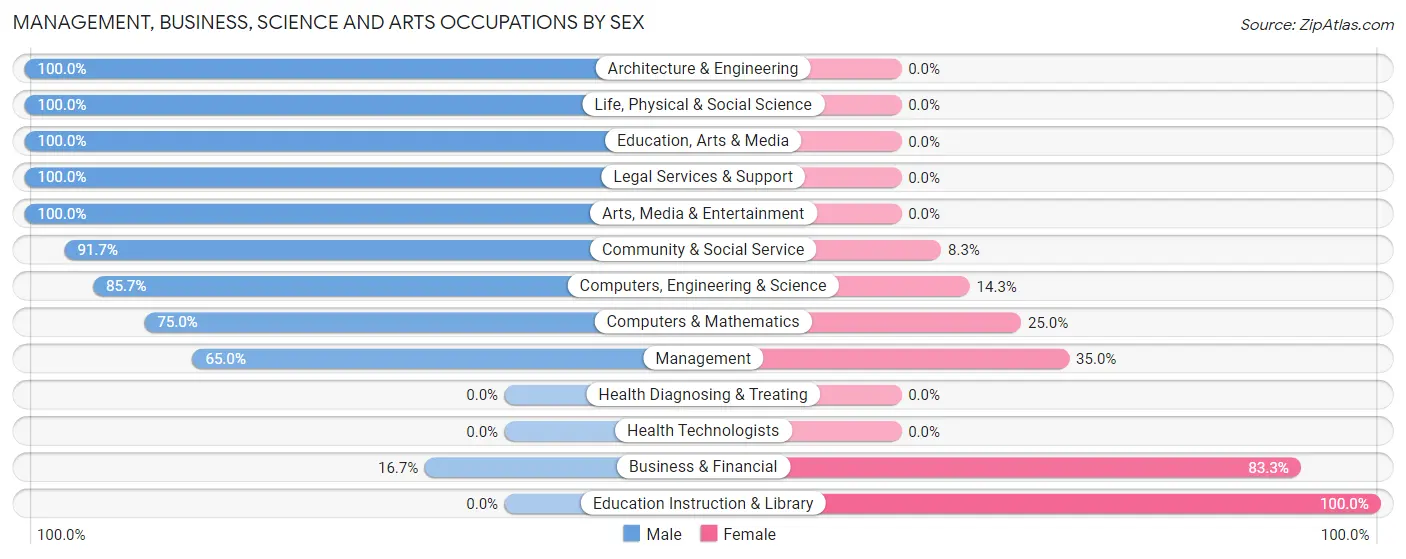
Management, Business, Science and Arts Occupations by Sex
Within the Management, Business, Science and Arts occupations in Mackinac Island, the most male-oriented occupations are Architecture & Engineering (100.0%), Life, Physical & Social Science (100.0%), and Education, Arts & Media (100.0%), while the most female-oriented occupations are Education Instruction & Library (100.0%), Business & Financial (83.3%), and Management (35.0%).
| Occupation | Male | Female |
| Management | 76 (65.0%) | 41 (35.0%) |
| Business & Financial | 2 (16.7%) | 10 (83.3%) |
| Computers, Engineering & Science | 6 (85.7%) | 1 (14.3%) |
| Computers & Mathematics | 3 (75.0%) | 1 (25.0%) |
| Architecture & Engineering | 2 (100.0%) | 0 (0.0%) |
| Life, Physical & Social Science | 1 (100.0%) | 0 (0.0%) |
| Community & Social Service | 99 (91.7%) | 9 (8.3%) |
| Education, Arts & Media | 88 (100.0%) | 0 (0.0%) |
| Legal Services & Support | 3 (100.0%) | 0 (0.0%) |
| Education Instruction & Library | 0 (0.0%) | 9 (100.0%) |
| Arts, Media & Entertainment | 8 (100.0%) | 0 (0.0%) |
| Health Diagnosing & Treating | 0 (0.0%) | 0 (0.0%) |
| Health Technologists | 0 (0.0%) | 0 (0.0%) |
| Total (Category) | 183 (75.0%) | 61 (25.0%) |
| Total (Overall) | 382 (68.6%) | 175 (31.4%) |
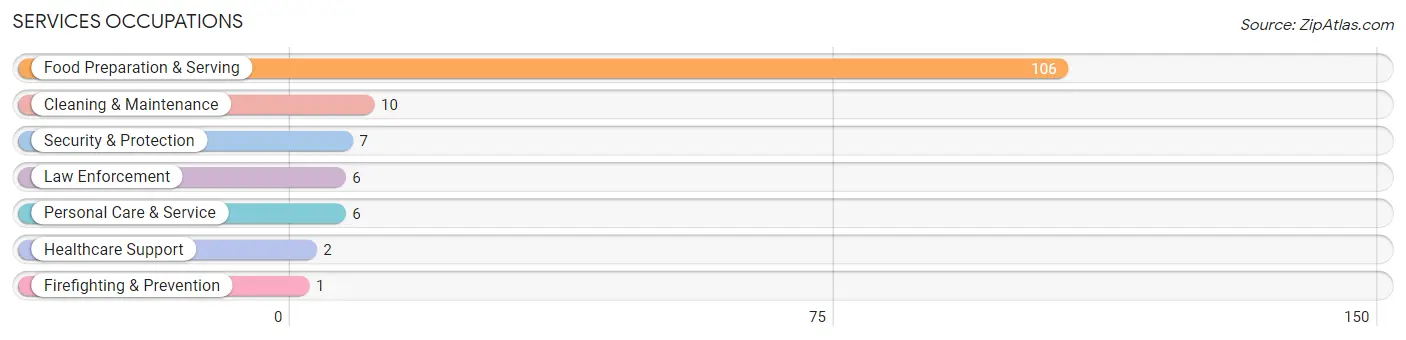
Services Occupations
The most common Services occupations in Mackinac Island are Food Preparation & Serving (106 | 19.0%), Cleaning & Maintenance (10 | 1.8%), Security & Protection (7 | 1.3%), Law Enforcement (6 | 1.1%), and Personal Care & Service (6 | 1.1%).
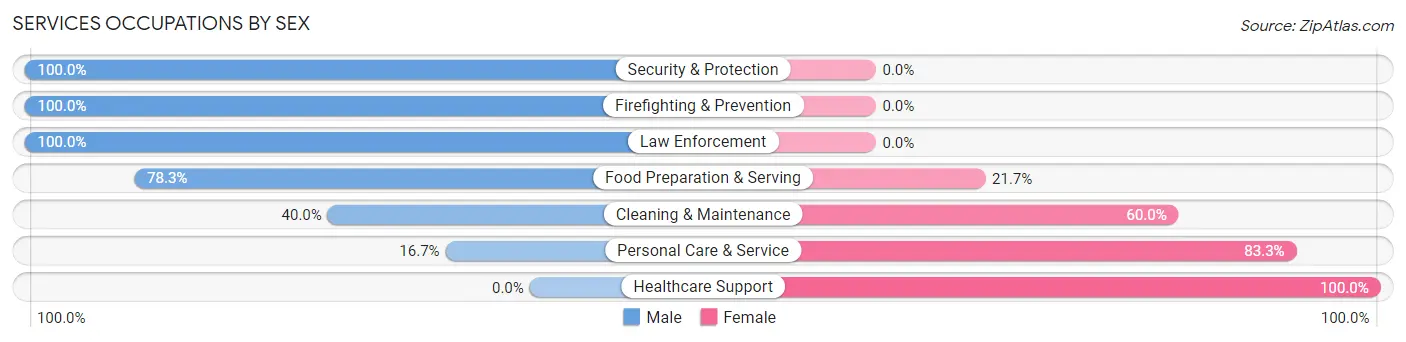
Services Occupations by Sex
Within the Services occupations in Mackinac Island, the most male-oriented occupations are Security & Protection (100.0%), Firefighting & Prevention (100.0%), and Law Enforcement (100.0%), while the most female-oriented occupations are Healthcare Support (100.0%), Personal Care & Service (83.3%), and Cleaning & Maintenance (60.0%).
| Occupation | Male | Female |
| Healthcare Support | 0 (0.0%) | 2 (100.0%) |
| Security & Protection | 7 (100.0%) | 0 (0.0%) |
| Firefighting & Prevention | 1 (100.0%) | 0 (0.0%) |
| Law Enforcement | 6 (100.0%) | 0 (0.0%) |
| Food Preparation & Serving | 83 (78.3%) | 23 (21.7%) |
| Cleaning & Maintenance | 4 (40.0%) | 6 (60.0%) |
| Personal Care & Service | 1 (16.7%) | 5 (83.3%) |
| Total (Category) | 95 (72.5%) | 36 (27.5%) |
| Total (Overall) | 382 (68.6%) | 175 (31.4%) |
Sales and Office Occupations
The most common Sales and Office occupations in Mackinac Island are Sales & Related (62 | 11.1%), and Office & Administration (21 | 3.8%).
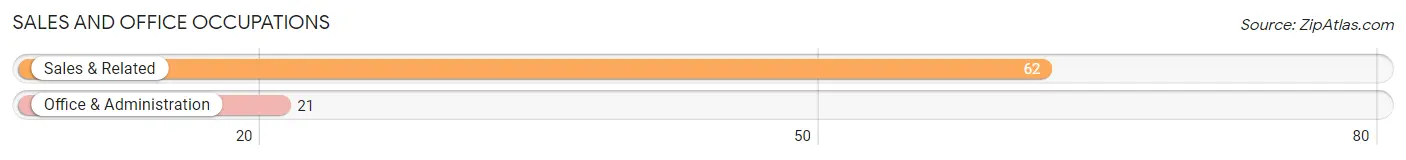
Sales and Office Occupations by Sex

| Occupation | Male | Female |
| Sales & Related | 27 (43.5%) | 35 (56.5%) |
| Office & Administration | 0 (0.0%) | 21 (100.0%) |
| Total (Category) | 27 (32.5%) | 56 (67.5%) |
| Total (Overall) | 382 (68.6%) | 175 (31.4%) |
Natural Resources, Construction and Maintenance Occupations
The most common Natural Resources, Construction and Maintenance occupations in Mackinac Island are Construction & Extraction (36 | 6.5%), and Installation, Maintenance & Repair (11 | 2.0%).
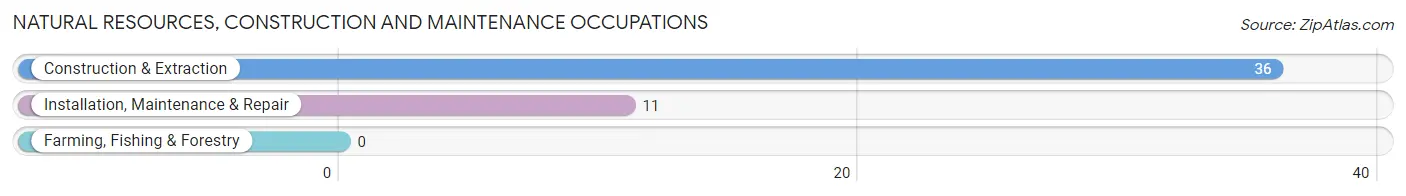
Natural Resources, Construction and Maintenance Occupations by Sex
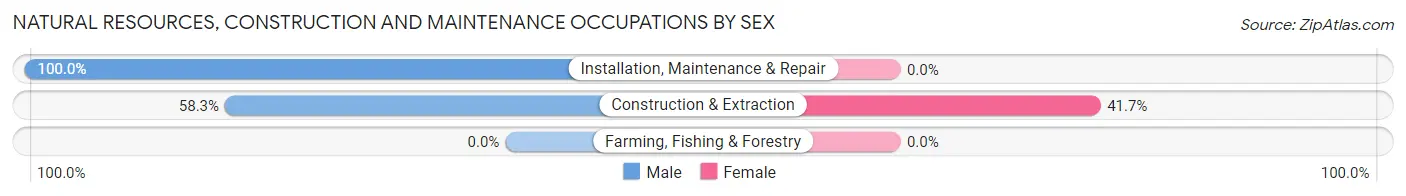
| Occupation | Male | Female |
| Farming, Fishing & Forestry | 0 (0.0%) | 0 (0.0%) |
| Construction & Extraction | 21 (58.3%) | 15 (41.7%) |
| Installation, Maintenance & Repair | 11 (100.0%) | 0 (0.0%) |
| Total (Category) | 32 (68.1%) | 15 (31.9%) |
| Total (Overall) | 382 (68.6%) | 175 (31.4%) |
Production, Transportation and Moving Occupations
The most common Production, Transportation and Moving occupations in Mackinac Island are Production (28 | 5.0%), Transportation (19 | 3.4%), and Material Moving (5 | 0.9%).
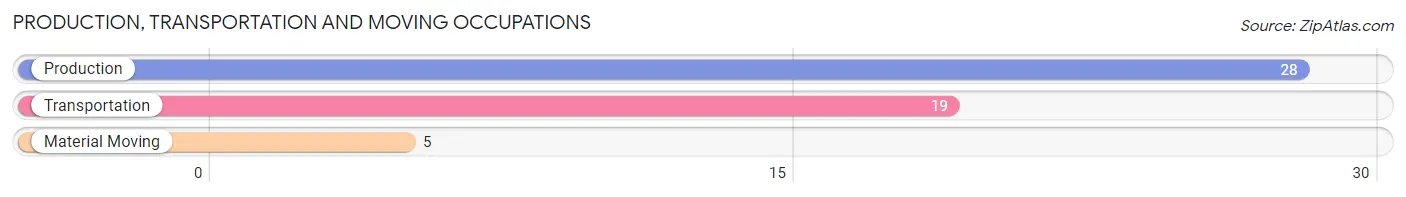
Production, Transportation and Moving Occupations by Sex
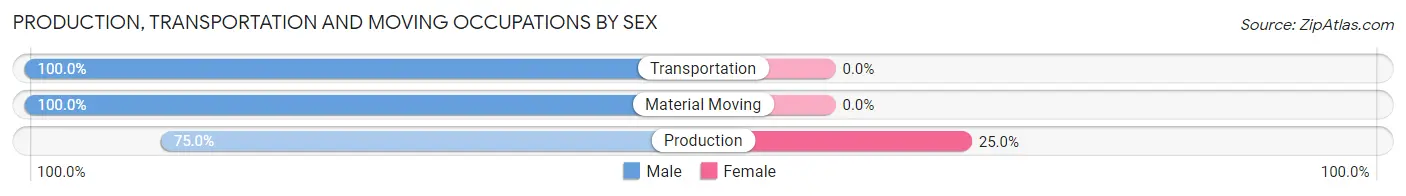
| Occupation | Male | Female |
| Production | 21 (75.0%) | 7 (25.0%) |
| Transportation | 19 (100.0%) | 0 (0.0%) |
| Material Moving | 5 (100.0%) | 0 (0.0%) |
| Total (Category) | 45 (86.5%) | 7 (13.5%) |
| Total (Overall) | 382 (68.6%) | 175 (31.4%) |
Employment Industries by Sex in Mackinac Island
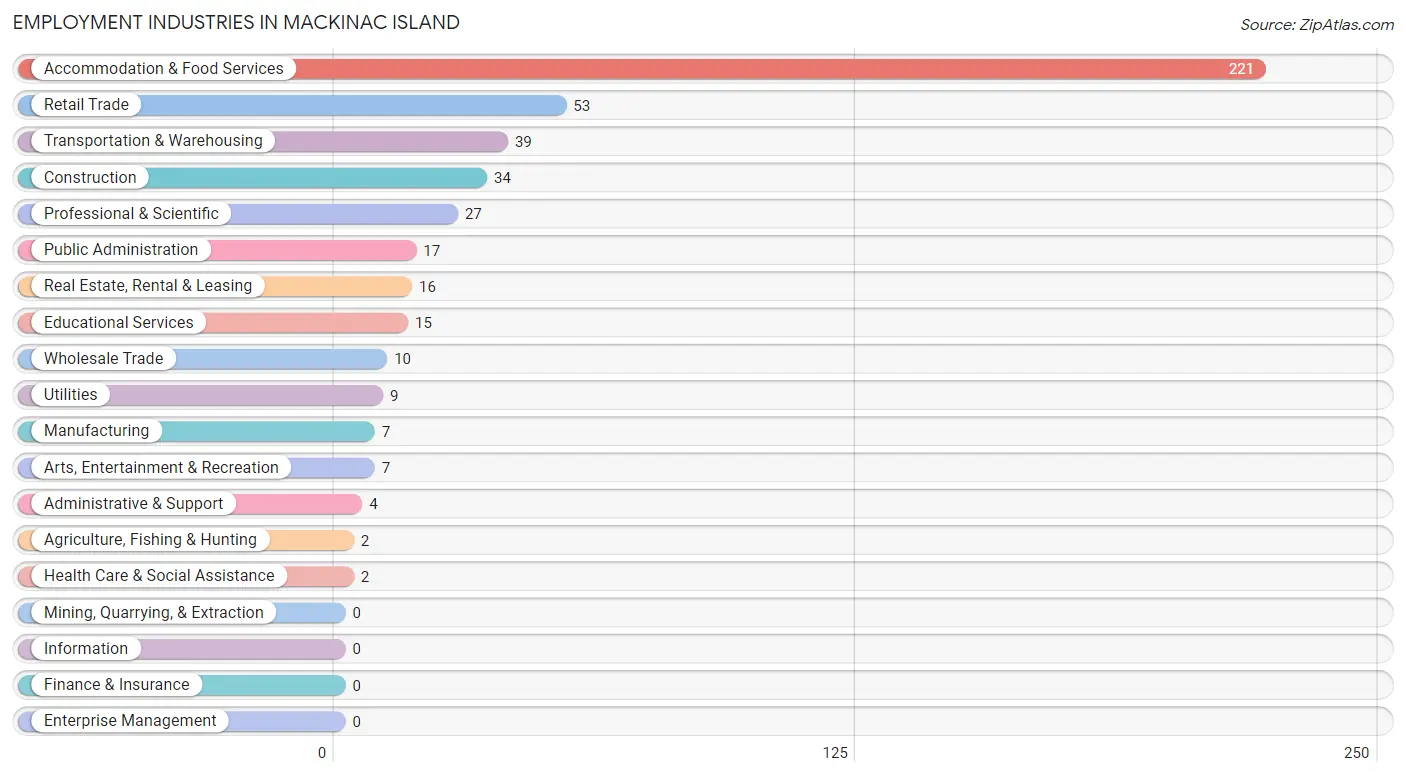
Employment Industries in Mackinac Island
The major employment industries in Mackinac Island include Accommodation & Food Services (221 | 39.7%), Retail Trade (53 | 9.5%), Transportation & Warehousing (39 | 7.0%), Construction (34 | 6.1%), and Professional & Scientific (27 | 4.9%).
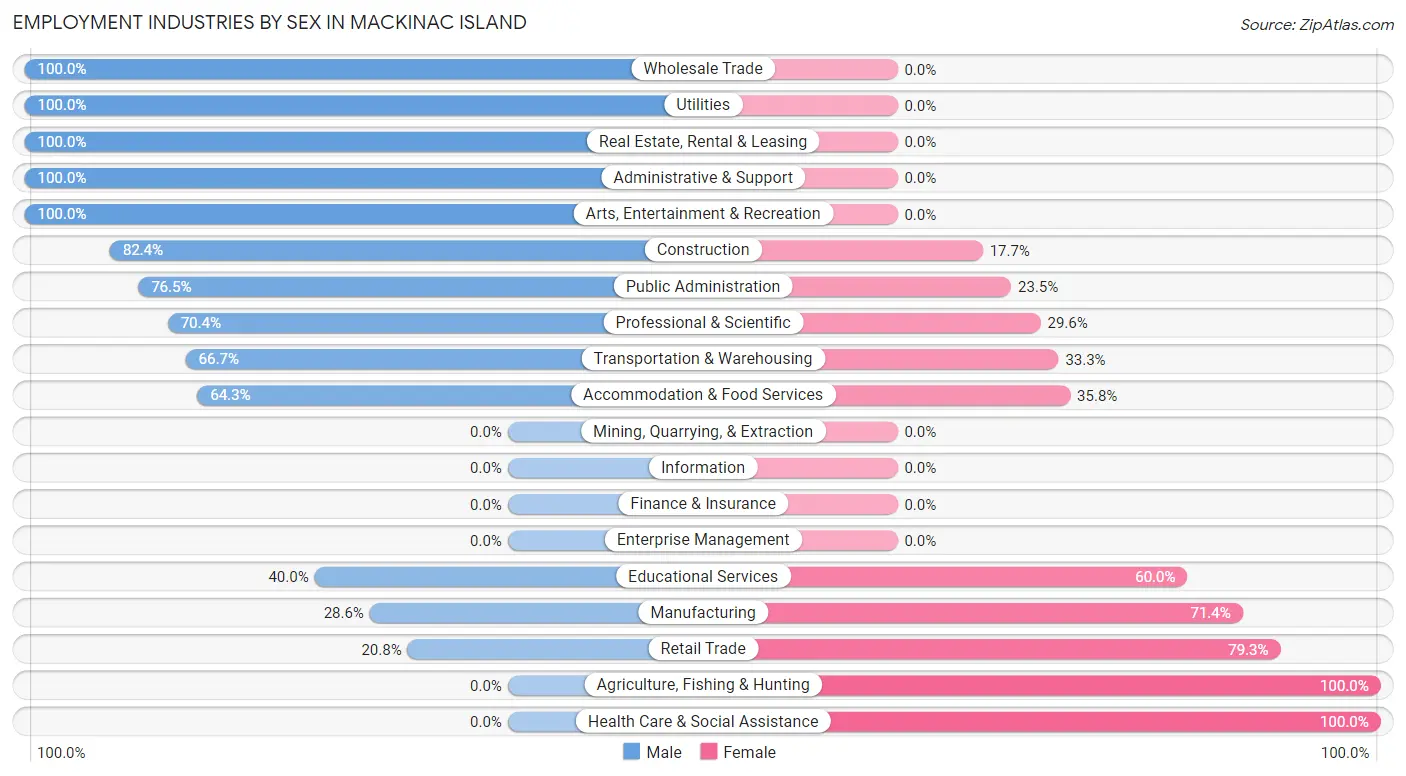
Employment Industries by Sex in Mackinac Island
The Mackinac Island industries that see more men than women are Wholesale Trade (100.0%), Utilities (100.0%), and Real Estate, Rental & Leasing (100.0%), whereas the industries that tend to have a higher number of women are Agriculture, Fishing & Hunting (100.0%), Health Care & Social Assistance (100.0%), and Retail Trade (79.2%).
| Industry | Male | Female |
| Agriculture, Fishing & Hunting | 0 (0.0%) | 2 (100.0%) |
| Mining, Quarrying, & Extraction | 0 (0.0%) | 0 (0.0%) |
| Construction | 28 (82.4%) | 6 (17.6%) |
| Manufacturing | 2 (28.6%) | 5 (71.4%) |
| Wholesale Trade | 10 (100.0%) | 0 (0.0%) |
| Retail Trade | 11 (20.7%) | 42 (79.2%) |
| Transportation & Warehousing | 26 (66.7%) | 13 (33.3%) |
| Utilities | 9 (100.0%) | 0 (0.0%) |
| Information | 0 (0.0%) | 0 (0.0%) |
| Finance & Insurance | 0 (0.0%) | 0 (0.0%) |
| Real Estate, Rental & Leasing | 16 (100.0%) | 0 (0.0%) |
| Professional & Scientific | 19 (70.4%) | 8 (29.6%) |
| Enterprise Management | 0 (0.0%) | 0 (0.0%) |
| Administrative & Support | 4 (100.0%) | 0 (0.0%) |
| Educational Services | 6 (40.0%) | 9 (60.0%) |
| Health Care & Social Assistance | 0 (0.0%) | 2 (100.0%) |
| Arts, Entertainment & Recreation | 7 (100.0%) | 0 (0.0%) |
| Accommodation & Food Services | 142 (64.2%) | 79 (35.7%) |
| Public Administration | 13 (76.5%) | 4 (23.5%) |
| Total | 382 (68.6%) | 175 (31.4%) |
Education in Mackinac Island
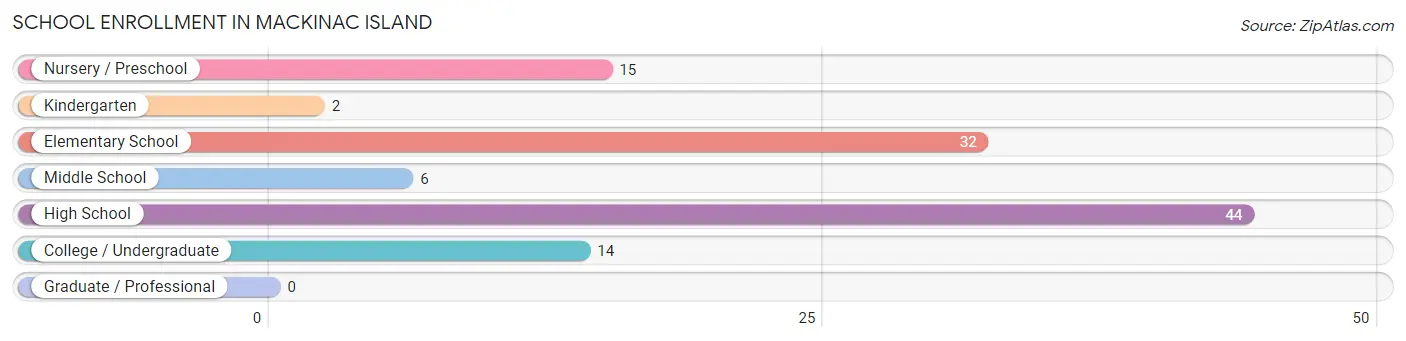
School Enrollment in Mackinac Island
The most common levels of schooling among the 113 students in Mackinac Island are high school (44 | 38.9%), elementary school (32 | 28.3%), and nursery / preschool (15 | 13.3%).
| School Level | # Students | % Students |
| Nursery / Preschool | 15 | 13.3% |
| Kindergarten | 2 | 1.8% |
| Elementary School | 32 | 28.3% |
| Middle School | 6 | 5.3% |
| High School | 44 | 38.9% |
| College / Undergraduate | 14 | 12.4% |
| Graduate / Professional | 0 | 0.0% |
| Total | 113 | 100.0% |
School Enrollment by Age by Funding Source in Mackinac Island
Out of a total of 113 students who are enrolled in schools in Mackinac Island, 8 (7.1%) attend a private institution, while the remaining 105 (92.9%) are enrolled in public schools. The age group of 20 to 24 year olds has the highest likelihood of being enrolled in private schools, with 1 (25.0% in the age bracket) enrolled. Conversely, the age group of 3 to 4 year olds has the lowest likelihood of being enrolled in a private school, with 7 (100.0% in the age bracket) attending a public institution.
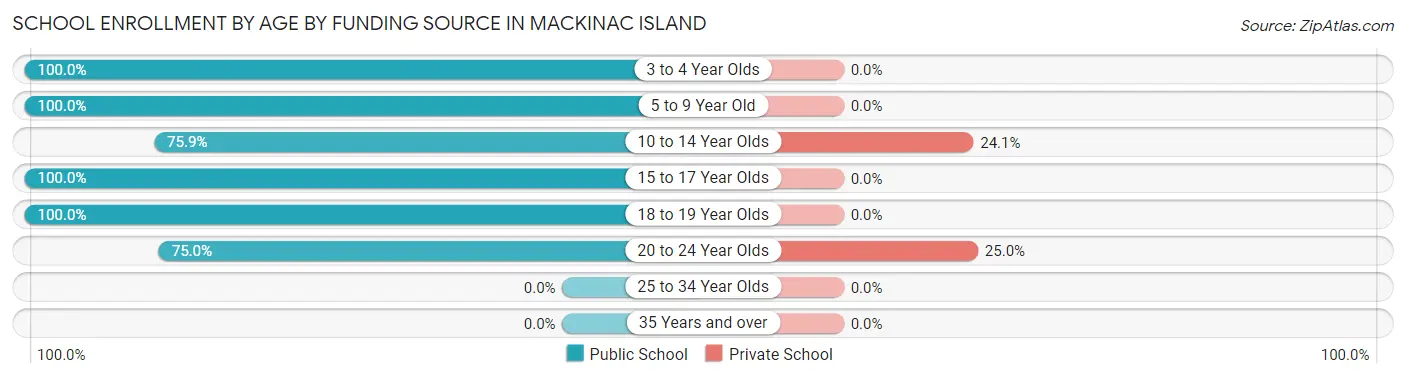
| Age Bracket | Public School | Private School |
| 3 to 4 Year Olds | 7 (100.0%) | 0 (0.0%) |
| 5 to 9 Year Old | 34 (100.0%) | 0 (0.0%) |
| 10 to 14 Year Olds | 22 (75.9%) | 7 (24.1%) |
| 15 to 17 Year Olds | 18 (100.0%) | 0 (0.0%) |
| 18 to 19 Year Olds | 21 (100.0%) | 0 (0.0%) |
| 20 to 24 Year Olds | 3 (75.0%) | 1 (25.0%) |
| 25 to 34 Year Olds | 0 (0.0%) | 0 (0.0%) |
| 35 Years and over | 0 (0.0%) | 0 (0.0%) |
| Total | 105 (92.9%) | 8 (7.1%) |
Educational Attainment by Field of Study in Mackinac Island
Business (82 | 34.6%), social sciences (36 | 15.2%), education (35 | 14.8%), bio, nature & agricultural (20 | 8.4%), and liberal arts & history (18 | 7.6%) are the most common fields of study among 237 individuals in Mackinac Island who have obtained a bachelor's degree or higher.
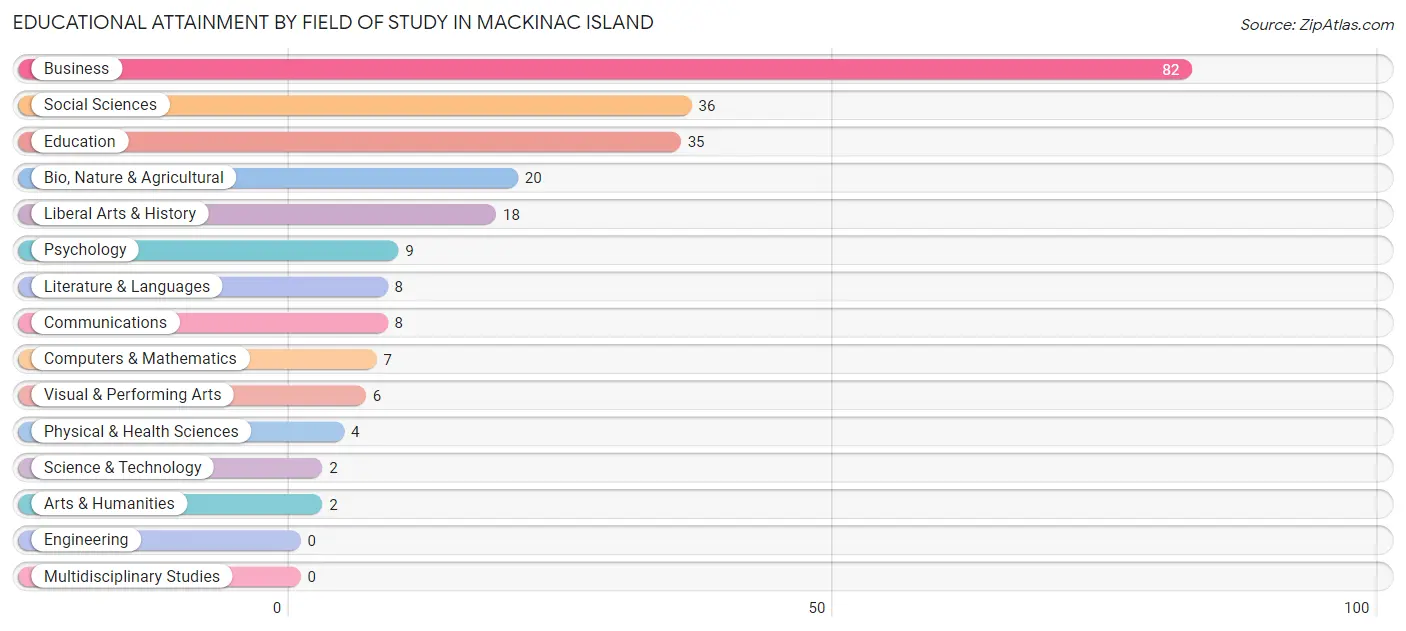
| Field of Study | # Graduates | % Graduates |
| Computers & Mathematics | 7 | 2.9% |
| Bio, Nature & Agricultural | 20 | 8.4% |
| Physical & Health Sciences | 4 | 1.7% |
| Psychology | 9 | 3.8% |
| Social Sciences | 36 | 15.2% |
| Engineering | 0 | 0.0% |
| Multidisciplinary Studies | 0 | 0.0% |
| Science & Technology | 2 | 0.8% |
| Business | 82 | 34.6% |
| Education | 35 | 14.8% |
| Literature & Languages | 8 | 3.4% |
| Liberal Arts & History | 18 | 7.6% |
| Visual & Performing Arts | 6 | 2.5% |
| Communications | 8 | 3.4% |
| Arts & Humanities | 2 | 0.8% |
| Total | 237 | 100.0% |
Transportation & Commute in Mackinac Island
Vehicle Availability by Sex in Mackinac Island
The most prevalent vehicle ownership categories in Mackinac Island are males with no vehicle (226, accounting for 78.5%) and females with no vehicle (74, making up 171.2%).
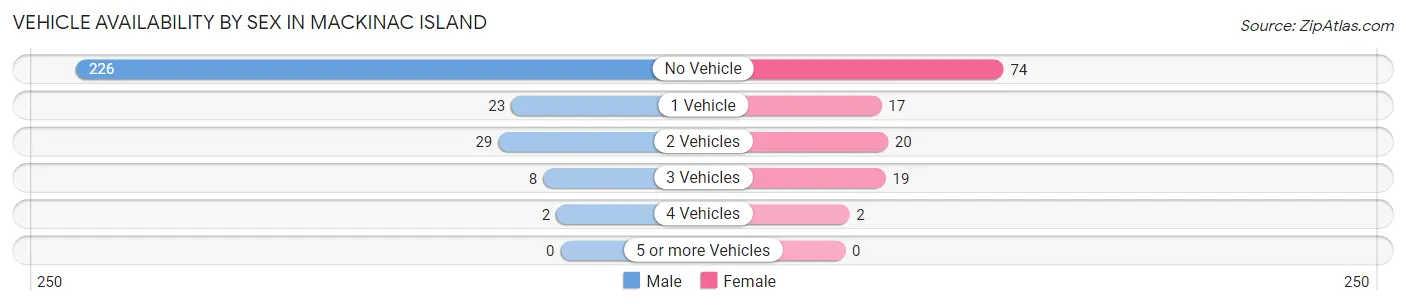
| Vehicles Available | Male | Female |
| No Vehicle | 226 (78.5%) | 74 (56.1%) |
| 1 Vehicle | 23 (8.0%) | 17 (12.9%) |
| 2 Vehicles | 29 (10.1%) | 20 (15.1%) |
| 3 Vehicles | 8 (2.8%) | 19 (14.4%) |
| 4 Vehicles | 2 (0.7%) | 2 (1.5%) |
| 5 or more Vehicles | 0 (0.0%) | 0 (0.0%) |
| Total | 288 (100.0%) | 132 (100.0%) |
Commute Time in Mackinac Island
The most frequently occuring commute durations in Mackinac Island are 5 to 9 minutes (224 commuters, 43.8%), less than 5 minutes (120 commuters, 23.4%), and 10 to 14 minutes (103 commuters, 20.1%).
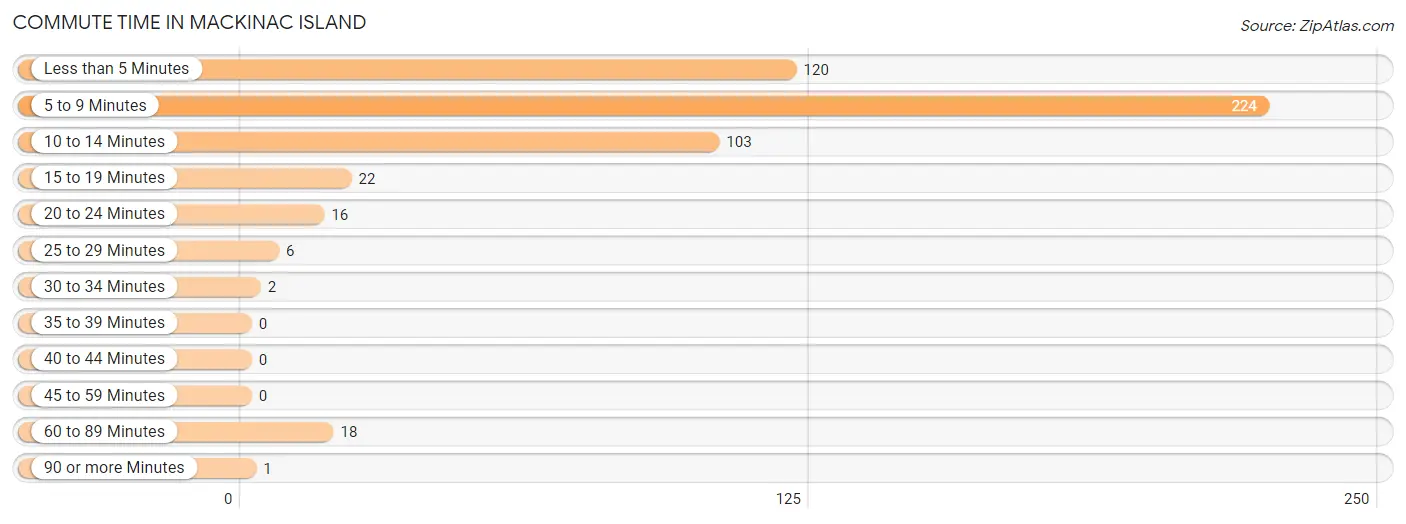
| Commute Time | # Commuters | % Commuters |
| Less than 5 Minutes | 120 | 23.4% |
| 5 to 9 Minutes | 224 | 43.8% |
| 10 to 14 Minutes | 103 | 20.1% |
| 15 to 19 Minutes | 22 | 4.3% |
| 20 to 24 Minutes | 16 | 3.1% |
| 25 to 29 Minutes | 6 | 1.2% |
| 30 to 34 Minutes | 2 | 0.4% |
| 35 to 39 Minutes | 0 | 0.0% |
| 40 to 44 Minutes | 0 | 0.0% |
| 45 to 59 Minutes | 0 | 0.0% |
| 60 to 89 Minutes | 18 | 3.5% |
| 90 or more Minutes | 1 | 0.2% |
Commute Time by Sex in Mackinac Island
The most common commute times in Mackinac Island are 5 to 9 minutes (158 commuters, 44.3%) for males and 5 to 9 minutes (66 commuters, 42.6%) for females.
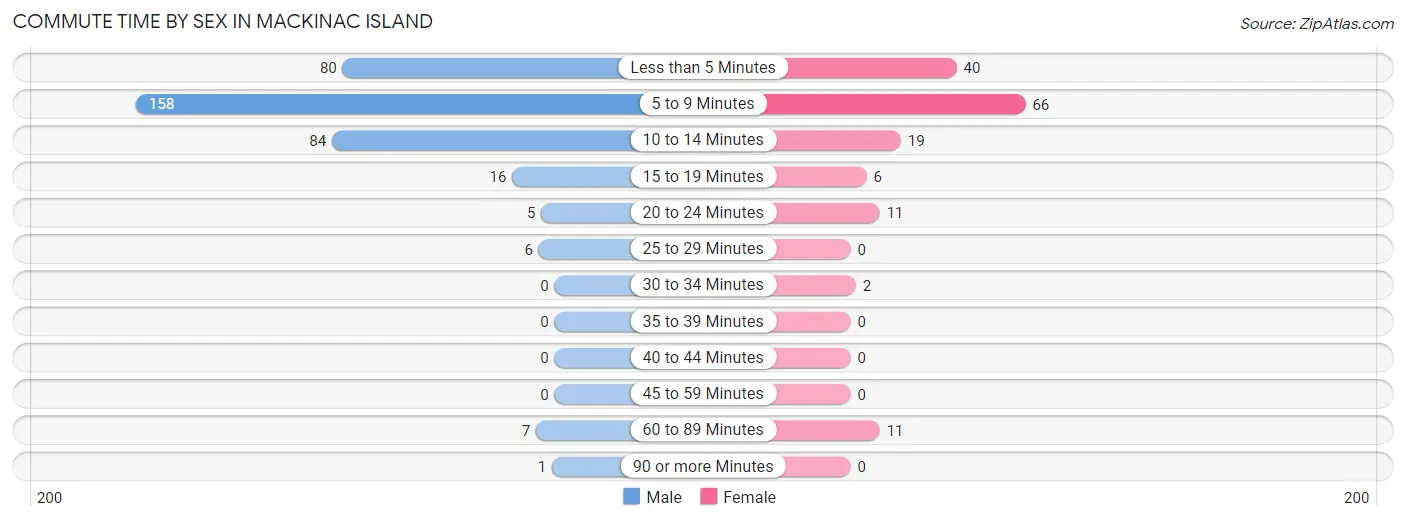
| Commute Time | Male | Female |
| Less than 5 Minutes | 80 (22.4%) | 40 (25.8%) |
| 5 to 9 Minutes | 158 (44.3%) | 66 (42.6%) |
| 10 to 14 Minutes | 84 (23.5%) | 19 (12.3%) |
| 15 to 19 Minutes | 16 (4.5%) | 6 (3.9%) |
| 20 to 24 Minutes | 5 (1.4%) | 11 (7.1%) |
| 25 to 29 Minutes | 6 (1.7%) | 0 (0.0%) |
| 30 to 34 Minutes | 0 (0.0%) | 2 (1.3%) |
| 35 to 39 Minutes | 0 (0.0%) | 0 (0.0%) |
| 40 to 44 Minutes | 0 (0.0%) | 0 (0.0%) |
| 45 to 59 Minutes | 0 (0.0%) | 0 (0.0%) |
| 60 to 89 Minutes | 7 (2.0%) | 11 (7.1%) |
| 90 or more Minutes | 1 (0.3%) | 0 (0.0%) |
Time of Departure to Work by Sex in Mackinac Island
The most frequent times of departure to work in Mackinac Island are 7:30 AM to 7:59 AM (86, 24.1%) for males and 7:30 AM to 7:59 AM (55, 35.5%) for females.
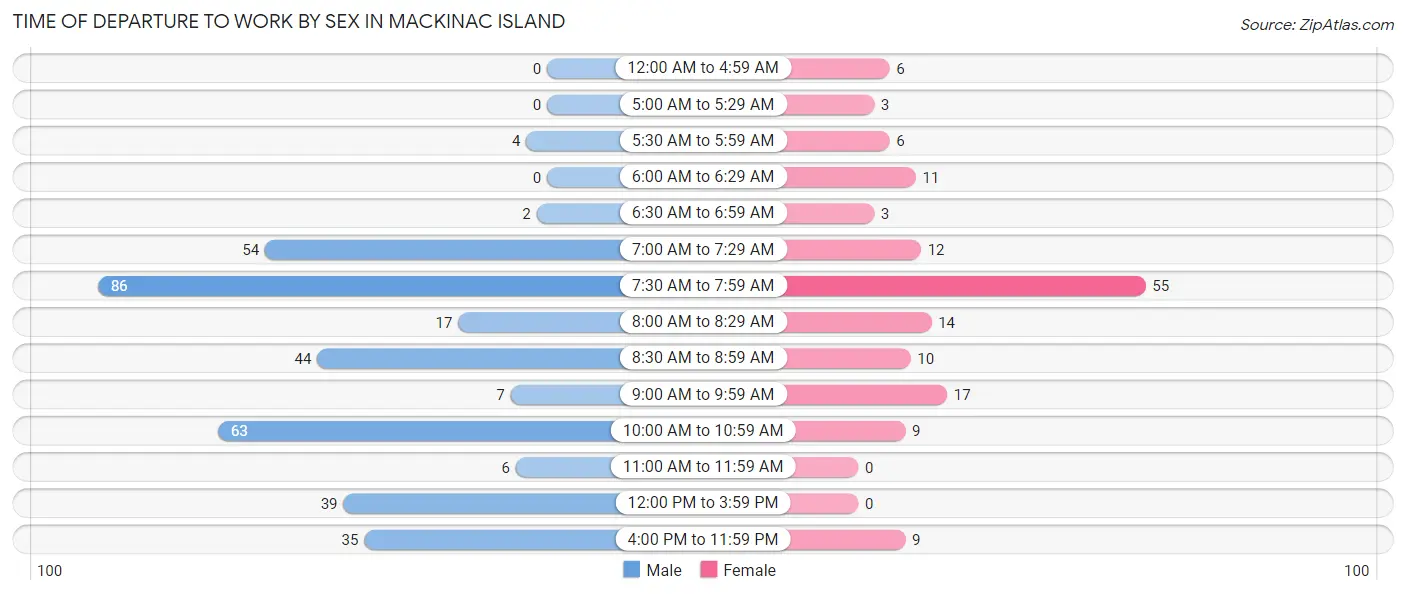
| Time of Departure | Male | Female |
| 12:00 AM to 4:59 AM | 0 (0.0%) | 6 (3.9%) |
| 5:00 AM to 5:29 AM | 0 (0.0%) | 3 (1.9%) |
| 5:30 AM to 5:59 AM | 4 (1.1%) | 6 (3.9%) |
| 6:00 AM to 6:29 AM | 0 (0.0%) | 11 (7.1%) |
| 6:30 AM to 6:59 AM | 2 (0.6%) | 3 (1.9%) |
| 7:00 AM to 7:29 AM | 54 (15.1%) | 12 (7.7%) |
| 7:30 AM to 7:59 AM | 86 (24.1%) | 55 (35.5%) |
| 8:00 AM to 8:29 AM | 17 (4.8%) | 14 (9.0%) |
| 8:30 AM to 8:59 AM | 44 (12.3%) | 10 (6.5%) |
| 9:00 AM to 9:59 AM | 7 (2.0%) | 17 (11.0%) |
| 10:00 AM to 10:59 AM | 63 (17.6%) | 9 (5.8%) |
| 11:00 AM to 11:59 AM | 6 (1.7%) | 0 (0.0%) |
| 12:00 PM to 3:59 PM | 39 (10.9%) | 0 (0.0%) |
| 4:00 PM to 11:59 PM | 35 (9.8%) | 9 (5.8%) |
| Total | 357 (100.0%) | 155 (100.0%) |
Housing Occupancy in Mackinac Island
Occupancy by Ownership in Mackinac Island
Of the total 344 dwellings in Mackinac Island, owner-occupied units account for 134 (39.0%), while renter-occupied units make up 210 (61.1%).
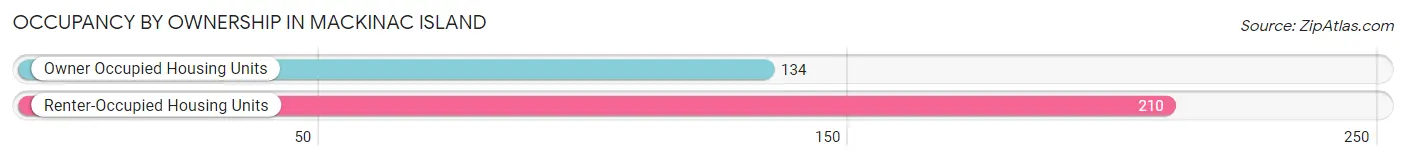
| Occupancy | # Housing Units | % Housing Units |
| Owner Occupied Housing Units | 134 | 39.0% |
| Renter-Occupied Housing Units | 210 | 61.1% |
| Total Occupied Housing Units | 344 | 100.0% |
Occupancy by Household Size in Mackinac Island
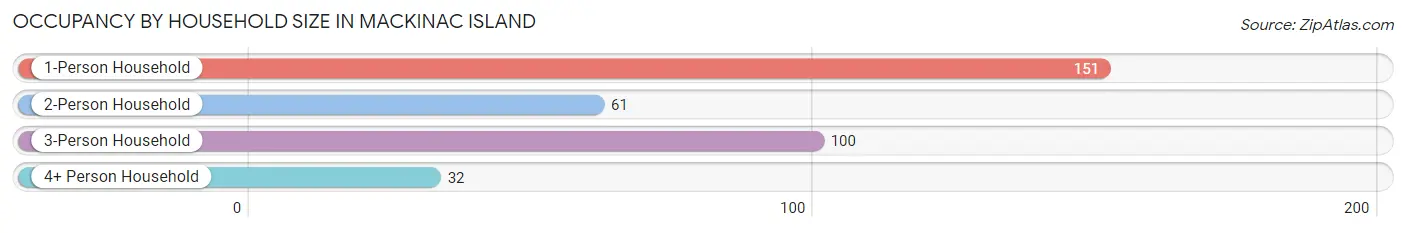
| Household Size | # Housing Units | % Housing Units |
| 1-Person Household | 151 | 43.9% |
| 2-Person Household | 61 | 17.7% |
| 3-Person Household | 100 | 29.1% |
| 4+ Person Household | 32 | 9.3% |
| Total Housing Units | 344 | 100.0% |
Occupancy by Ownership by Household Size in Mackinac Island
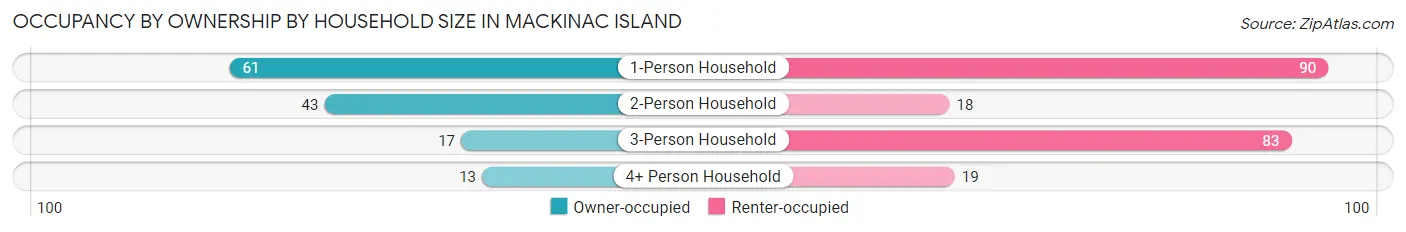
| Household Size | Owner-occupied | Renter-occupied |
| 1-Person Household | 61 (40.4%) | 90 (59.6%) |
| 2-Person Household | 43 (70.5%) | 18 (29.5%) |
| 3-Person Household | 17 (17.0%) | 83 (83.0%) |
| 4+ Person Household | 13 (40.6%) | 19 (59.4%) |
| Total Housing Units | 134 (39.0%) | 210 (61.1%) |
Occupancy by Educational Attainment in Mackinac Island
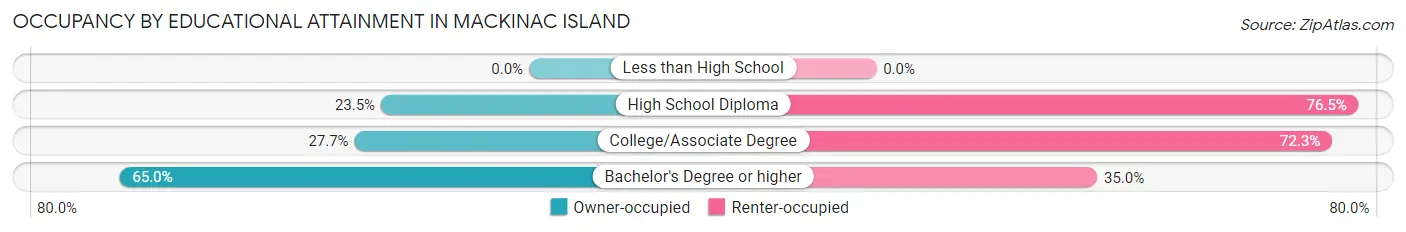
| Household Size | Owner-occupied | Renter-occupied |
| Less than High School | 0 (0.0%) | 0 (0.0%) |
| High School Diploma | 27 (23.5%) | 88 (76.5%) |
| College/Associate Degree | 31 (27.7%) | 81 (72.3%) |
| Bachelor's Degree or higher | 76 (65.0%) | 41 (35.0%) |
Occupancy by Age of Householder in Mackinac Island
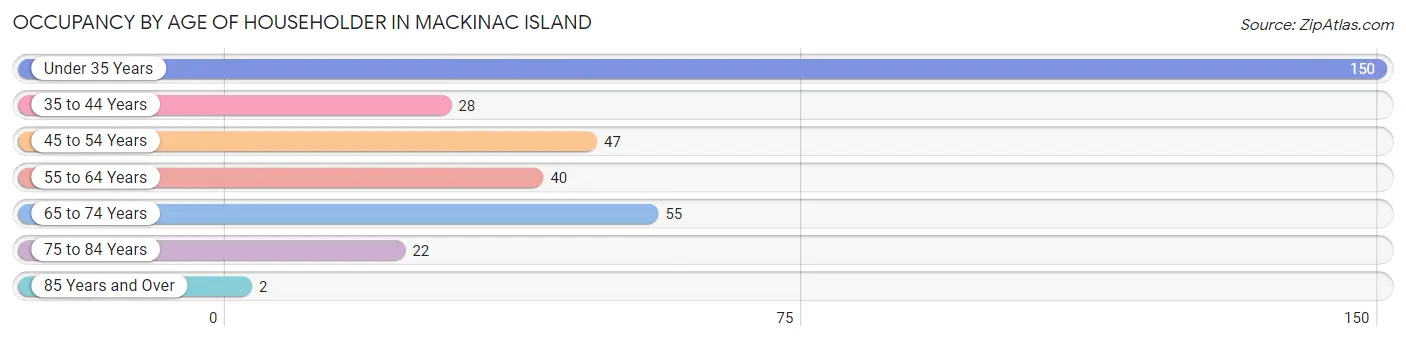
| Age Bracket | # Households | % Households |
| Under 35 Years | 150 | 43.6% |
| 35 to 44 Years | 28 | 8.1% |
| 45 to 54 Years | 47 | 13.7% |
| 55 to 64 Years | 40 | 11.6% |
| 65 to 74 Years | 55 | 16.0% |
| 75 to 84 Years | 22 | 6.4% |
| 85 Years and Over | 2 | 0.6% |
| Total | 344 | 100.0% |
Housing Finances in Mackinac Island
Median Income by Occupancy in Mackinac Island
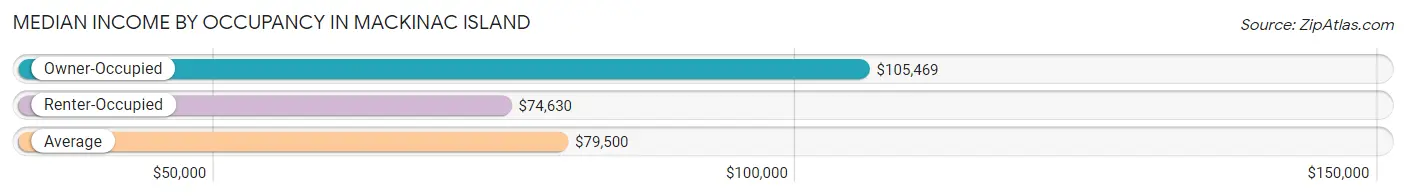
| Occupancy Type | # Households | Median Income |
| Owner-Occupied | 134 (39.0%) | $105,469 |
| Renter-Occupied | 210 (61.1%) | $74,630 |
| Average | 344 (100.0%) | $79,500 |
Occupancy by Householder Income Bracket in Mackinac Island
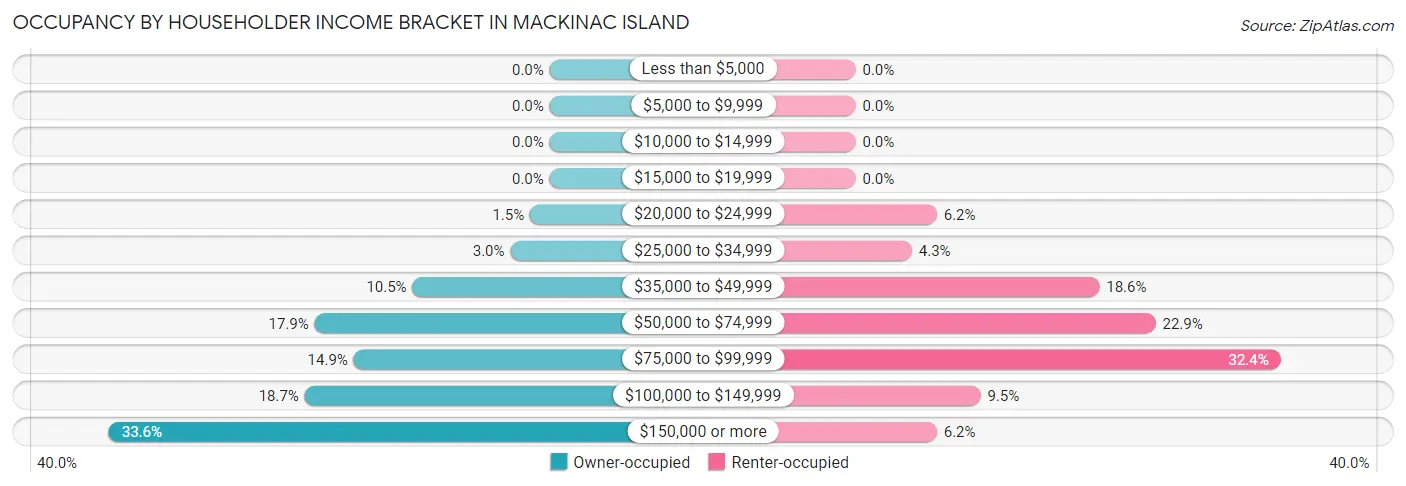
| Income Bracket | Owner-occupied | Renter-occupied |
| Less than $5,000 | 0 (0.0%) | 0 (0.0%) |
| $5,000 to $9,999 | 0 (0.0%) | 0 (0.0%) |
| $10,000 to $14,999 | 0 (0.0%) | 0 (0.0%) |
| $15,000 to $19,999 | 0 (0.0%) | 0 (0.0%) |
| $20,000 to $24,999 | 2 (1.5%) | 13 (6.2%) |
| $25,000 to $34,999 | 4 (3.0%) | 9 (4.3%) |
| $35,000 to $49,999 | 14 (10.4%) | 39 (18.6%) |
| $50,000 to $74,999 | 24 (17.9%) | 48 (22.9%) |
| $75,000 to $99,999 | 20 (14.9%) | 68 (32.4%) |
| $100,000 to $149,999 | 25 (18.7%) | 20 (9.5%) |
| $150,000 or more | 45 (33.6%) | 13 (6.2%) |
| Total | 134 (100.0%) | 210 (100.0%) |
Monthly Housing Cost Tiers in Mackinac Island
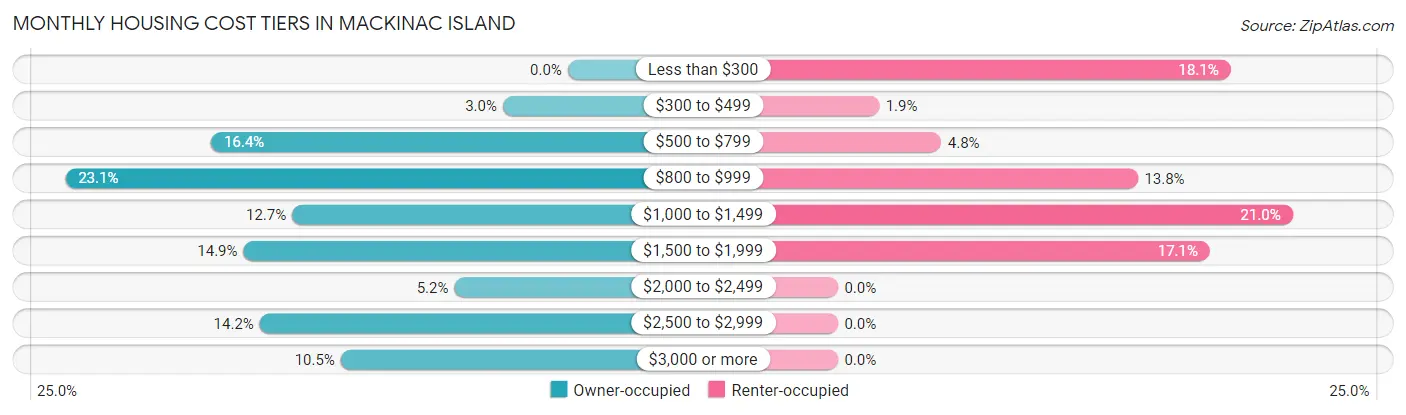
| Monthly Cost | Owner-occupied | Renter-occupied |
| Less than $300 | 0 (0.0%) | 38 (18.1%) |
| $300 to $499 | 4 (3.0%) | 4 (1.9%) |
| $500 to $799 | 22 (16.4%) | 10 (4.8%) |
| $800 to $999 | 31 (23.1%) | 29 (13.8%) |
| $1,000 to $1,499 | 17 (12.7%) | 44 (20.9%) |
| $1,500 to $1,999 | 20 (14.9%) | 36 (17.1%) |
| $2,000 to $2,499 | 7 (5.2%) | 0 (0.0%) |
| $2,500 to $2,999 | 19 (14.2%) | 0 (0.0%) |
| $3,000 or more | 14 (10.4%) | 0 (0.0%) |
| Total | 134 (100.0%) | 210 (100.0%) |
Physical Housing Characteristics in Mackinac Island
Housing Structures in Mackinac Island
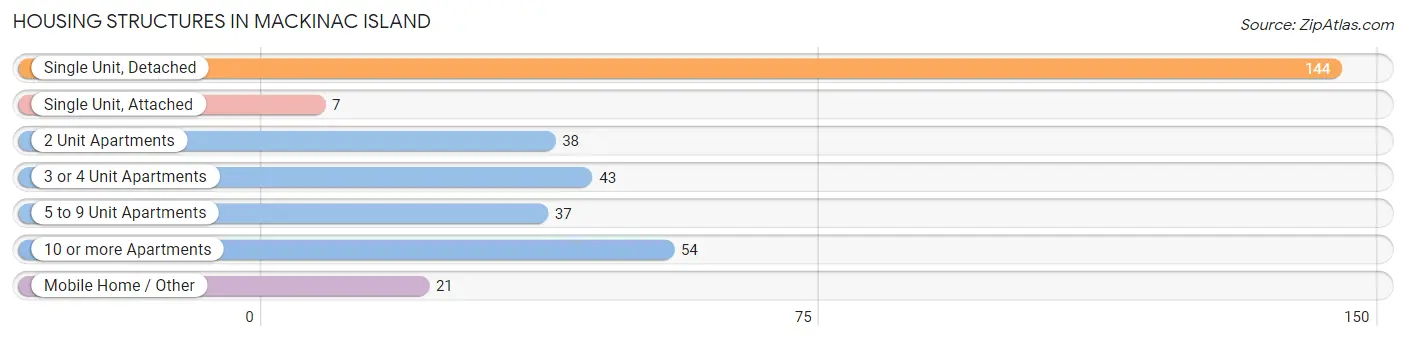
| Structure Type | # Housing Units | % Housing Units |
| Single Unit, Detached | 144 | 41.9% |
| Single Unit, Attached | 7 | 2.0% |
| 2 Unit Apartments | 38 | 11.1% |
| 3 or 4 Unit Apartments | 43 | 12.5% |
| 5 to 9 Unit Apartments | 37 | 10.8% |
| 10 or more Apartments | 54 | 15.7% |
| Mobile Home / Other | 21 | 6.1% |
| Total | 344 | 100.0% |
Housing Structures by Occupancy in Mackinac Island
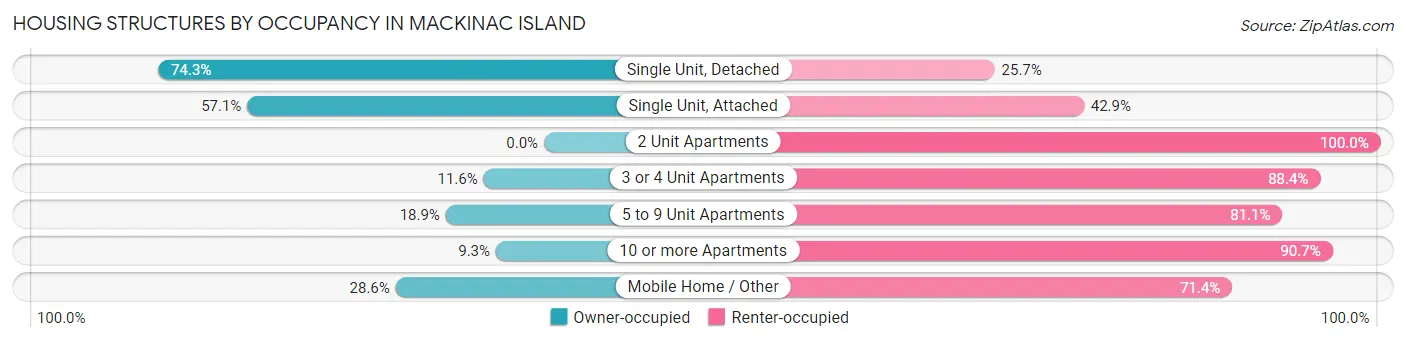
| Structure Type | Owner-occupied | Renter-occupied |
| Single Unit, Detached | 107 (74.3%) | 37 (25.7%) |
| Single Unit, Attached | 4 (57.1%) | 3 (42.9%) |
| 2 Unit Apartments | 0 (0.0%) | 38 (100.0%) |
| 3 or 4 Unit Apartments | 5 (11.6%) | 38 (88.4%) |
| 5 to 9 Unit Apartments | 7 (18.9%) | 30 (81.1%) |
| 10 or more Apartments | 5 (9.3%) | 49 (90.7%) |
| Mobile Home / Other | 6 (28.6%) | 15 (71.4%) |
| Total | 134 (39.0%) | 210 (61.1%) |
Housing Structures by Number of Rooms in Mackinac Island
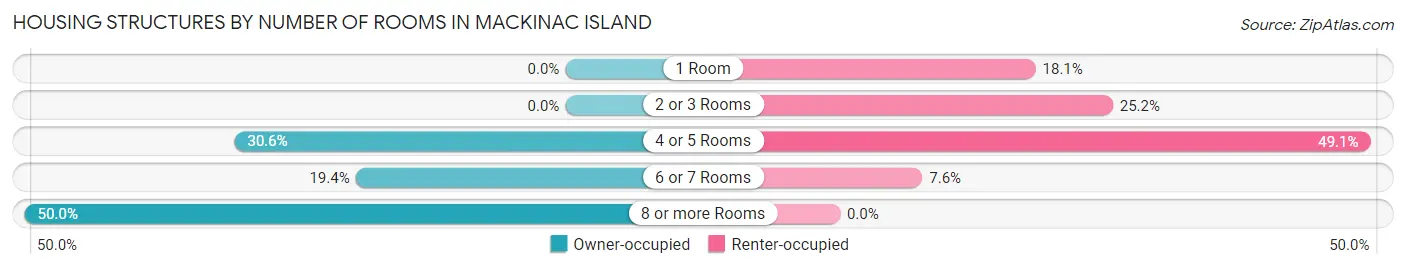
| Number of Rooms | Owner-occupied | Renter-occupied |
| 1 Room | 0 (0.0%) | 38 (18.1%) |
| 2 or 3 Rooms | 0 (0.0%) | 53 (25.2%) |
| 4 or 5 Rooms | 41 (30.6%) | 103 (49.0%) |
| 6 or 7 Rooms | 26 (19.4%) | 16 (7.6%) |
| 8 or more Rooms | 67 (50.0%) | 0 (0.0%) |
| Total | 134 (100.0%) | 210 (100.0%) |
Housing Structure by Heating Type in Mackinac Island
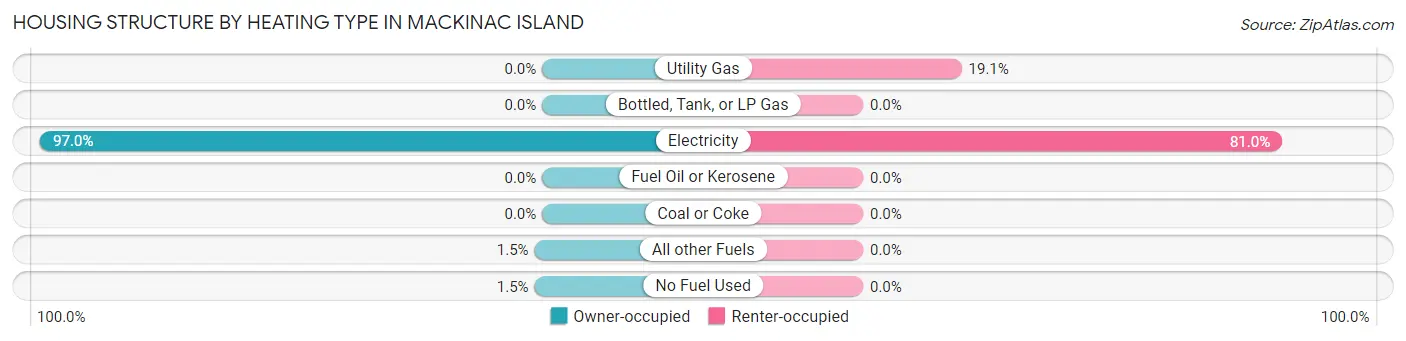
| Heating Type | Owner-occupied | Renter-occupied |
| Utility Gas | 0 (0.0%) | 40 (19.1%) |
| Bottled, Tank, or LP Gas | 0 (0.0%) | 0 (0.0%) |
| Electricity | 130 (97.0%) | 170 (80.9%) |
| Fuel Oil or Kerosene | 0 (0.0%) | 0 (0.0%) |
| Coal or Coke | 0 (0.0%) | 0 (0.0%) |
| All other Fuels | 2 (1.5%) | 0 (0.0%) |
| No Fuel Used | 2 (1.5%) | 0 (0.0%) |
| Total | 134 (100.0%) | 210 (100.0%) |
Household Vehicle Usage in Mackinac Island
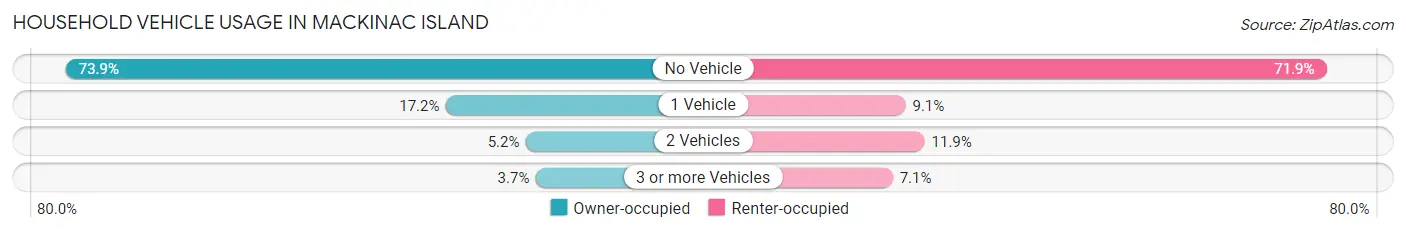
| Vehicles per Household | Owner-occupied | Renter-occupied |
| No Vehicle | 99 (73.9%) | 151 (71.9%) |
| 1 Vehicle | 23 (17.2%) | 19 (9.0%) |
| 2 Vehicles | 7 (5.2%) | 25 (11.9%) |
| 3 or more Vehicles | 5 (3.7%) | 15 (7.1%) |
| Total | 134 (100.0%) | 210 (100.0%) |
Real Estate & Mortgages in Mackinac Island
Real Estate and Mortgage Overview in Mackinac Island
| Characteristic | Without Mortgage | With Mortgage |
| Housing Units | 86 | 48 |
| Median Property Value | - | - |
| Median Household Income | $106,591 | $15 |
| Monthly Housing Costs | $955 | $14 |
| Real Estate Taxes | $4,900 | $0 |
Property Value by Mortgage Status in Mackinac Island
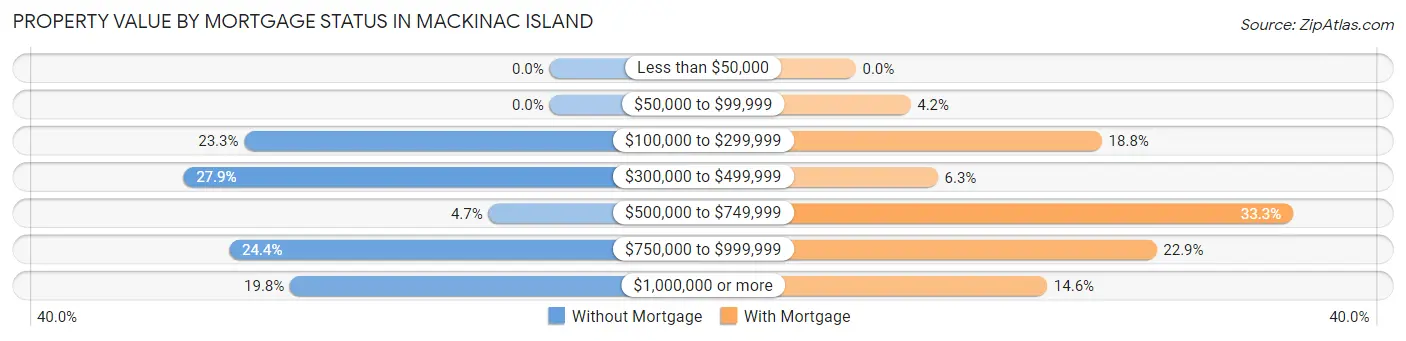
| Property Value | Without Mortgage | With Mortgage |
| Less than $50,000 | 0 (0.0%) | 0 (0.0%) |
| $50,000 to $99,999 | 0 (0.0%) | 2 (4.2%) |
| $100,000 to $299,999 | 20 (23.3%) | 9 (18.8%) |
| $300,000 to $499,999 | 24 (27.9%) | 3 (6.2%) |
| $500,000 to $749,999 | 4 (4.6%) | 16 (33.3%) |
| $750,000 to $999,999 | 21 (24.4%) | 11 (22.9%) |
| $1,000,000 or more | 17 (19.8%) | 7 (14.6%) |
| Total | 86 (100.0%) | 48 (100.0%) |
Household Income by Mortgage Status in Mackinac Island
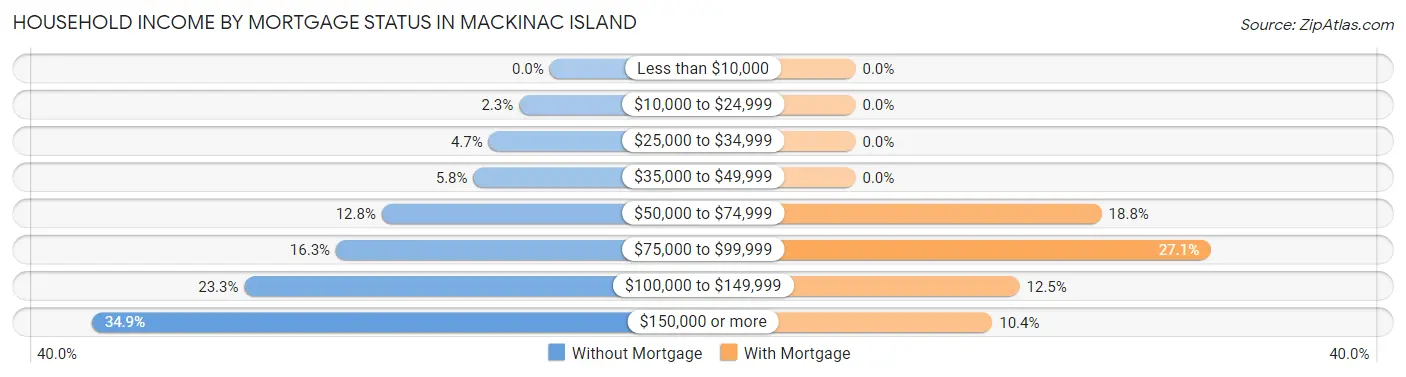
| Household Income | Without Mortgage | With Mortgage |
| Less than $10,000 | 0 (0.0%) | 0 (0.0%) |
| $10,000 to $24,999 | 2 (2.3%) | 0 (0.0%) |
| $25,000 to $34,999 | 4 (4.6%) | 0 (0.0%) |
| $35,000 to $49,999 | 5 (5.8%) | 0 (0.0%) |
| $50,000 to $74,999 | 11 (12.8%) | 9 (18.8%) |
| $75,000 to $99,999 | 14 (16.3%) | 13 (27.1%) |
| $100,000 to $149,999 | 20 (23.3%) | 6 (12.5%) |
| $150,000 or more | 30 (34.9%) | 5 (10.4%) |
| Total | 86 (100.0%) | 48 (100.0%) |
Property Value to Household Income Ratio in Mackinac Island
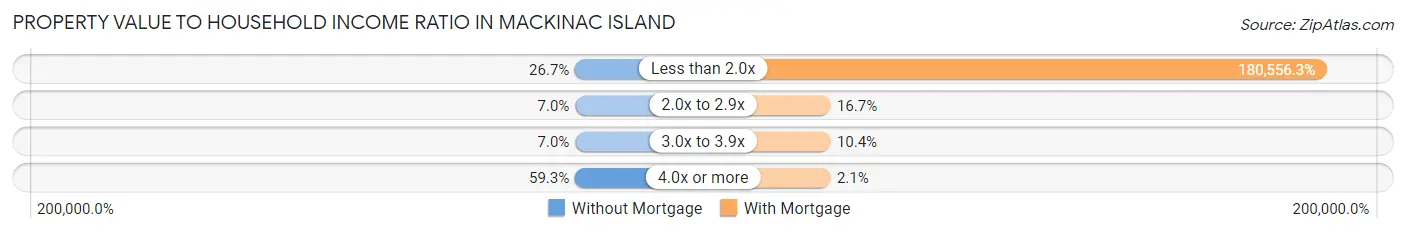
| Value-to-Income Ratio | Without Mortgage | With Mortgage |
| Less than 2.0x | 23 (26.7%) | 86,667 (180,556.2%) |
| 2.0x to 2.9x | 6 (7.0%) | 8 (16.7%) |
| 3.0x to 3.9x | 6 (7.0%) | 5 (10.4%) |
| 4.0x or more | 51 (59.3%) | 1 (2.1%) |
| Total | 86 (100.0%) | 48 (100.0%) |
Real Estate Taxes by Mortgage Status in Mackinac Island
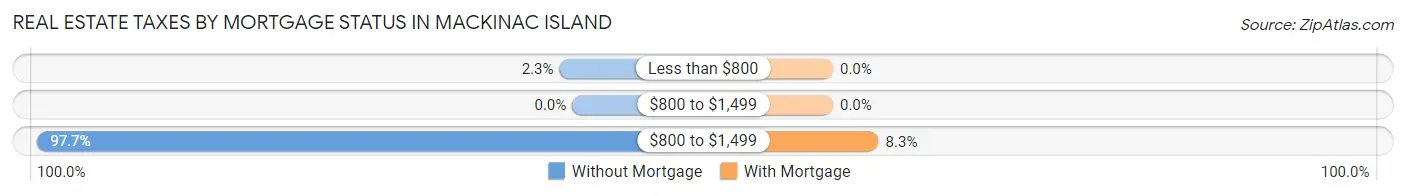
| Property Taxes | Without Mortgage | With Mortgage |
| Less than $800 | 2 (2.3%) | 0 (0.0%) |
| $800 to $1,499 | 0 (0.0%) | 0 (0.0%) |
| $800 to $1,499 | 84 (97.7%) | 4 (8.3%) |
| Total | 86 (100.0%) | 48 (100.0%) |
Health & Disability in Mackinac Island
Health Insurance Coverage by Age in Mackinac Island
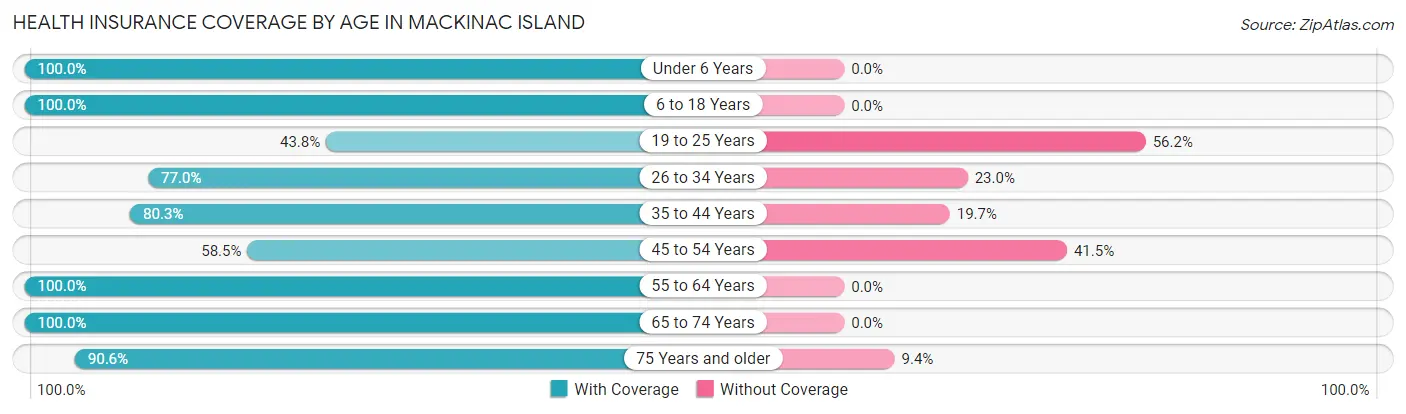
| Age Bracket | With Coverage | Without Coverage |
| Under 6 Years | 22 (100.0%) | 0 (0.0%) |
| 6 to 18 Years | 94 (100.0%) | 0 (0.0%) |
| 19 to 25 Years | 67 (43.8%) | 86 (56.2%) |
| 26 to 34 Years | 97 (77.0%) | 29 (23.0%) |
| 35 to 44 Years | 98 (80.3%) | 24 (19.7%) |
| 45 to 54 Years | 69 (58.5%) | 49 (41.5%) |
| 55 to 64 Years | 93 (100.0%) | 0 (0.0%) |
| 65 to 74 Years | 76 (100.0%) | 0 (0.0%) |
| 75 Years and older | 29 (90.6%) | 3 (9.4%) |
| Total | 645 (77.1%) | 191 (22.9%) |
Health Insurance Coverage by Citizenship Status in Mackinac Island

| Citizenship Status | With Coverage | Without Coverage |
| Native Born | 22 (100.0%) | 0 (0.0%) |
| Foreign Born, Citizen | 94 (100.0%) | 0 (0.0%) |
| Foreign Born, not a Citizen | 67 (43.8%) | 86 (56.2%) |
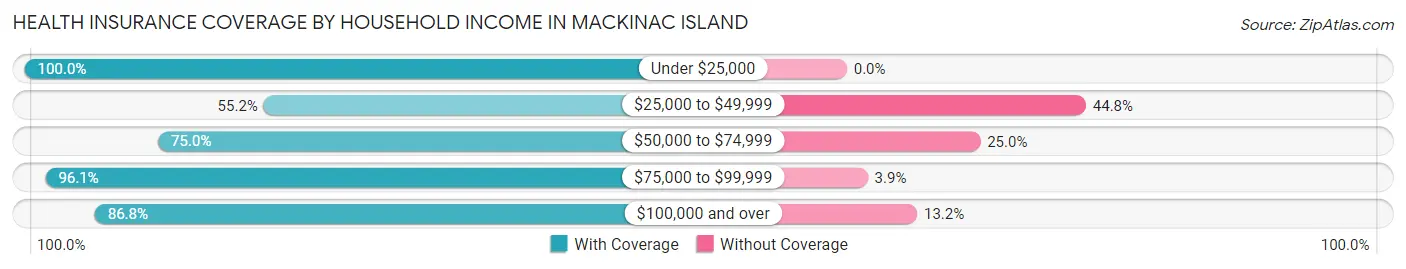
Health Insurance Coverage by Household Income in Mackinac Island
| Household Income | With Coverage | Without Coverage |
| Under $25,000 | 15 (100.0%) | 0 (0.0%) |
| $25,000 to $49,999 | 53 (55.2%) | 43 (44.8%) |
| $50,000 to $74,999 | 123 (75.0%) | 41 (25.0%) |
| $75,000 to $99,999 | 172 (96.1%) | 7 (3.9%) |
| $100,000 and over | 165 (86.8%) | 25 (13.2%) |
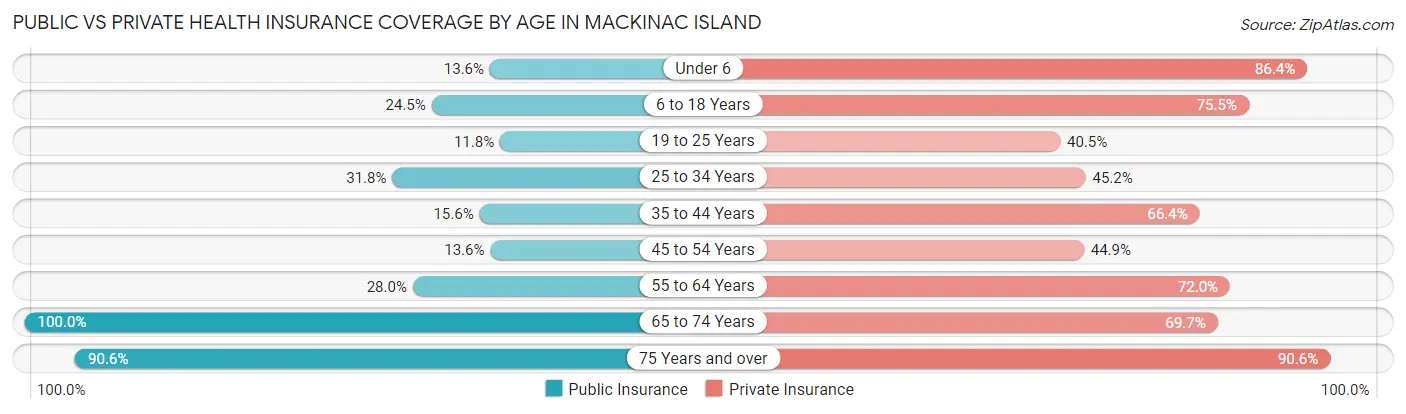
Public vs Private Health Insurance Coverage by Age in Mackinac Island
| Age Bracket | Public Insurance | Private Insurance |
| Under 6 | 3 (13.6%) | 19 (86.4%) |
| 6 to 18 Years | 23 (24.5%) | 71 (75.5%) |
| 19 to 25 Years | 18 (11.8%) | 62 (40.5%) |
| 25 to 34 Years | 40 (31.8%) | 57 (45.2%) |
| 35 to 44 Years | 19 (15.6%) | 81 (66.4%) |
| 45 to 54 Years | 16 (13.6%) | 53 (44.9%) |
| 55 to 64 Years | 26 (28.0%) | 67 (72.0%) |
| 65 to 74 Years | 76 (100.0%) | 53 (69.7%) |
| 75 Years and over | 29 (90.6%) | 29 (90.6%) |
| Total | 250 (29.9%) | 492 (58.9%) |
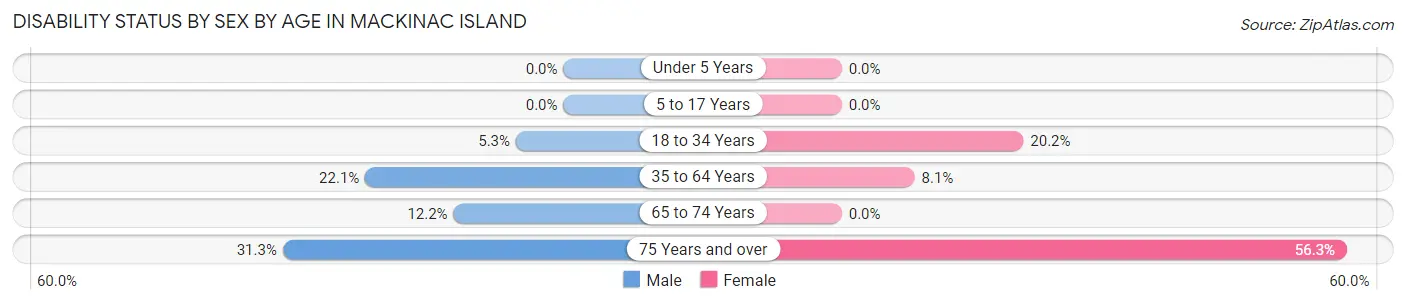
Disability Status by Sex by Age in Mackinac Island
| Age Bracket | Male | Female |
| Under 5 Years | 0 (0.0%) | 0 (0.0%) |
| 5 to 17 Years | 0 (0.0%) | 0 (0.0%) |
| 18 to 34 Years | 11 (5.3%) | 18 (20.2%) |
| 35 to 64 Years | 49 (22.1%) | 9 (8.1%) |
| 65 to 74 Years | 6 (12.2%) | 0 (0.0%) |
| 75 Years and over | 5 (31.2%) | 9 (56.2%) |
Disability Class by Sex by Age in Mackinac Island
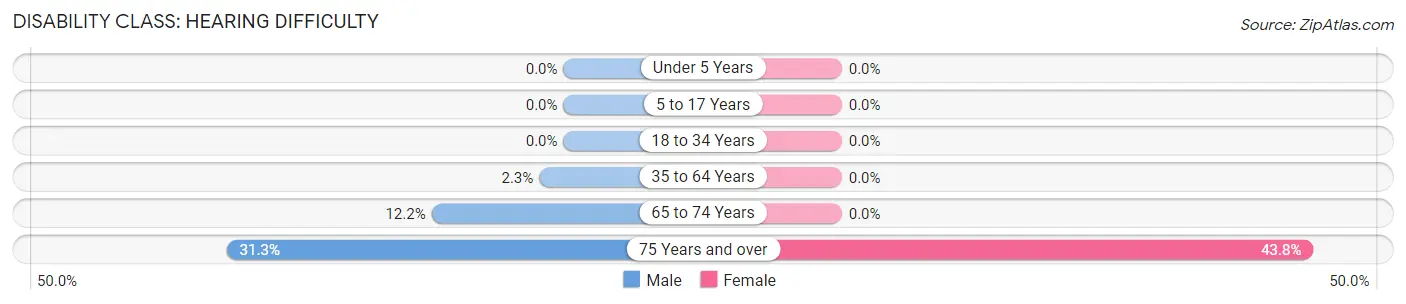
Disability Class: Hearing Difficulty
| Age Bracket | Male | Female |
| Under 5 Years | 0 (0.0%) | 0 (0.0%) |
| 5 to 17 Years | 0 (0.0%) | 0 (0.0%) |
| 18 to 34 Years | 0 (0.0%) | 0 (0.0%) |
| 35 to 64 Years | 5 (2.2%) | 0 (0.0%) |
| 65 to 74 Years | 6 (12.2%) | 0 (0.0%) |
| 75 Years and over | 5 (31.2%) | 7 (43.8%) |
Disability Class: Vision Difficulty
| Age Bracket | Male | Female |
| Under 5 Years | 0 (0.0%) | 0 (0.0%) |
| 5 to 17 Years | 0 (0.0%) | 0 (0.0%) |
| 18 to 34 Years | 0 (0.0%) | 0 (0.0%) |
| 35 to 64 Years | 0 (0.0%) | 0 (0.0%) |
| 65 to 74 Years | 0 (0.0%) | 0 (0.0%) |
| 75 Years and over | 0 (0.0%) | 0 (0.0%) |
Disability Class: Cognitive Difficulty
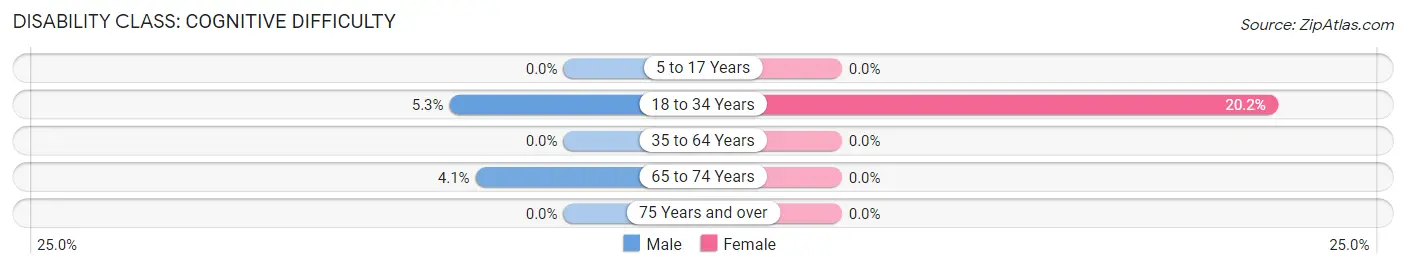
| Age Bracket | Male | Female |
| 5 to 17 Years | 0 (0.0%) | 0 (0.0%) |
| 18 to 34 Years | 11 (5.3%) | 18 (20.2%) |
| 35 to 64 Years | 0 (0.0%) | 0 (0.0%) |
| 65 to 74 Years | 2 (4.1%) | 0 (0.0%) |
| 75 Years and over | 0 (0.0%) | 0 (0.0%) |
Disability Class: Ambulatory Difficulty
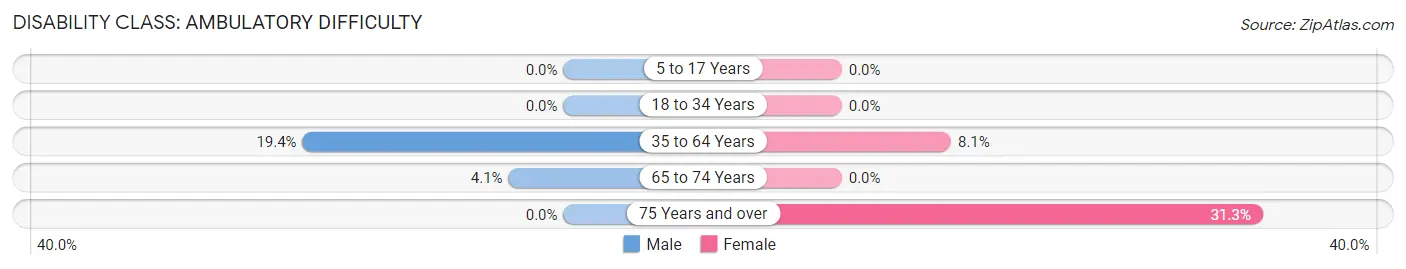
| Age Bracket | Male | Female |
| 5 to 17 Years | 0 (0.0%) | 0 (0.0%) |
| 18 to 34 Years | 0 (0.0%) | 0 (0.0%) |
| 35 to 64 Years | 43 (19.4%) | 9 (8.1%) |
| 65 to 74 Years | 2 (4.1%) | 0 (0.0%) |
| 75 Years and over | 0 (0.0%) | 5 (31.2%) |
Disability Class: Self-Care Difficulty
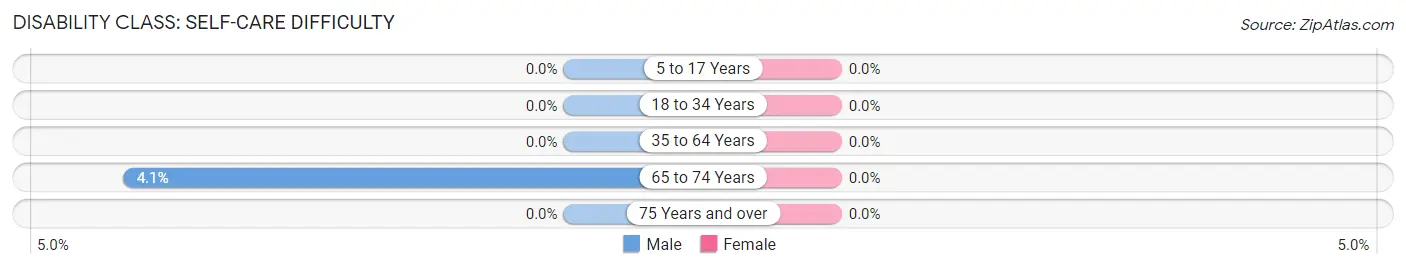
| Age Bracket | Male | Female |
| 5 to 17 Years | 0 (0.0%) | 0 (0.0%) |
| 18 to 34 Years | 0 (0.0%) | 0 (0.0%) |
| 35 to 64 Years | 0 (0.0%) | 0 (0.0%) |
| 65 to 74 Years | 2 (4.1%) | 0 (0.0%) |
| 75 Years and over | 0 (0.0%) | 0 (0.0%) |
Technology Access in Mackinac Island
Computing Device Access in Mackinac Island
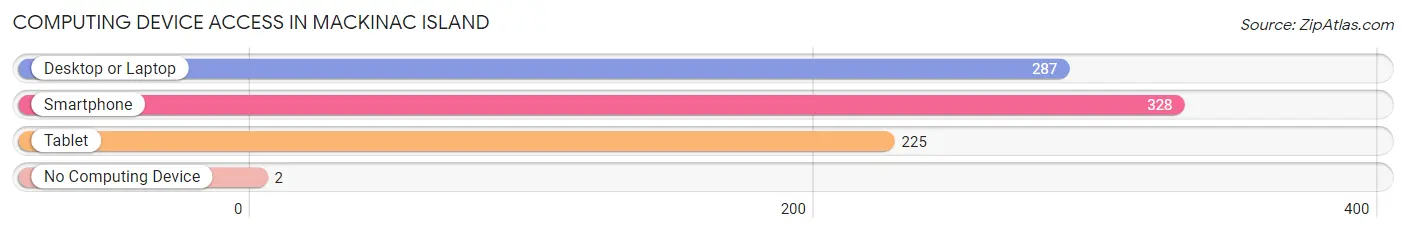
| Device Type | # Households | % Households |
| Desktop or Laptop | 287 | 83.4% |
| Smartphone | 328 | 95.4% |
| Tablet | 225 | 65.4% |
| No Computing Device | 2 | 0.6% |
| Total | 344 | 100.0% |
Internet Access in Mackinac Island
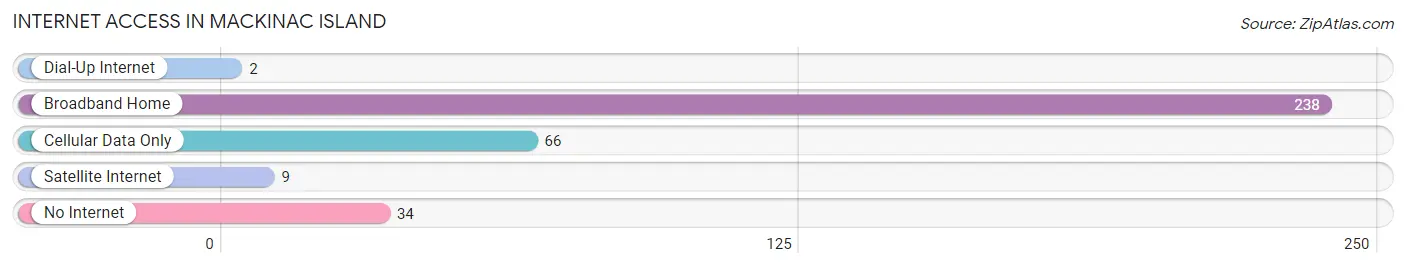
| Internet Type | # Households | % Households |
| Dial-Up Internet | 2 | 0.6% |
| Broadband Home | 238 | 69.2% |
| Cellular Data Only | 66 | 19.2% |
| Satellite Internet | 9 | 2.6% |
| No Internet | 34 | 9.9% |
| Total | 344 | 100.0% |
Mackinac Island Summary
Mackinac Island is a small island located in Lake Huron, off the coast of Michigan’s Upper Peninsula. It is a popular tourist destination, known for its Victorian-era architecture, its fudge shops, and its horse-drawn carriages. The island has a rich history, a unique geography, and a vibrant economy.
History
Mackinac Island has been inhabited for thousands of years. The Anishinaabe people, also known as the Ojibwe, were the first to inhabit the island. They called the island “Mitchimakinak,” which means “big turtle.” The island was an important trading post for the Anishinaabe people, and it was also a sacred site.
In the late 1600s, French explorers arrived on the island and established a fur trading post. The island was then part of the French colony of New France. In 1763, the island was ceded to the British after the French and Indian War. The British then built a fort on the island, which was used to protect the fur trade.
In 1814, during the War of 1812, the British abandoned the fort and the island was taken by the Americans. The Americans then built a new fort, Fort Mackinac, which was used to protect the Great Lakes.
In the late 1800s, Mackinac Island became a popular tourist destination. The island was known for its Victorian-era architecture, its fudge shops, and its horse-drawn carriages. In 1895, the island was designated as a state park, and it remains a popular tourist destination to this day.
Geography
Mackinac Island is located in Lake Huron, off the coast of Michigan’s Upper Peninsula. The island is about 3.8 square miles in size, and it is the largest island in the Great Lakes. The island is surrounded by limestone cliffs, and it is home to a variety of wildlife, including deer, foxes, and bald eagles.
The island is connected to the mainland by a bridge, and it is accessible by ferry. The island is also home to a small airport, which is used for private planes and helicopters.
Economy
Mackinac Island’s economy is largely based on tourism. The island is home to a variety of hotels, restaurants, and shops, which cater to the millions of tourists who visit the island each year. The island is also home to a variety of attractions, including Fort Mackinac, the Grand Hotel, and the Mackinac Island State Park.
The island is also home to a variety of businesses, including boat tours, fishing charters, and bike rentals. The island is also home to a variety of art galleries, museums, and historical sites.
Demographics
Mackinac Island has a population of about 500 people. The island is home to a variety of ethnicities, including Native Americans, French Canadians, and British. The island is also home to a variety of religions, including Christianity, Judaism, and Islam.
The island is home to a variety of languages, including English, French, and Anishinaabemowin. The island is also home to a variety of cultures, including Native American, French Canadian, and British.
Conclusion
Mackinac Island is a small island located in Lake Huron, off the coast of Michigan’s Upper Peninsula. The island has a rich history, a unique geography, and a vibrant economy. The island is home to a variety of ethnicities, religions, languages, and cultures. The island is also home to a variety of attractions, businesses, and historical sites. Mackinac Island is a popular tourist destination, and it is a great place to visit for those looking for a unique and memorable experience.
Common Questions
What is Per Capita Income in Mackinac Island?
Per Capita income in Mackinac Island is $46,343.
What is the Median Family Income in Mackinac Island?
Median Family Income in Mackinac Island is $87,321.
What is the Median Household income in Mackinac Island?
Median Household Income in Mackinac Island is $79,500.
What is Income or Wage Gap in Mackinac Island?
Income or Wage Gap in Mackinac Island is 28.1%.
Women in Mackinac Island earn 71.9 cents for every dollar earned by a man.
What is Inequality or Gini Index in Mackinac Island?
Inequality or Gini Index in Mackinac Island is 0.40.
What is the Total Population of Mackinac Island?
Total Population of Mackinac Island is 836.
What is the Total Male Population of Mackinac Island?
Total Male Population of Mackinac Island is 543.
What is the Total Female Population of Mackinac Island?
Total Female Population of Mackinac Island is 293.
What is the Ratio of Males per 100 Females in Mackinac Island?
There are 185.32 Males per 100 Females in Mackinac Island.
What is the Ratio of Females per 100 Males in Mackinac Island?
There are 53.96 Females per 100 Males in Mackinac Island.
What is the Median Population Age in Mackinac Island?
Median Population Age in Mackinac Island is 39.1 Years.
What is the Average Family Size in Mackinac Island
Average Family Size in Mackinac Island is 2.8 People.
What is the Average Household Size in Mackinac Island
Average Household Size in Mackinac Island is 1.9 People.
How Large is the Labor Force in Mackinac Island?
There are 609 People in the Labor Forcein in Mackinac Island.
What is the Percentage of People in the Labor Force in Mackinac Island?
80.7% of People are in the Labor Force in Mackinac Island.
What is the Unemployment Rate in Mackinac Island?
Unemployment Rate in Mackinac Island is 8.5%.