Prudenville, MI Map & Demographics
Prudenville Map
Prudenville Overview
$35,095
PER CAPITA INCOME
$62,500
AVG FAMILY INCOME
$51,055
AVG HOUSEHOLD INCOME
46.6%
WAGE / INCOME GAP [ % ]
53.4¢/ $1
WAGE / INCOME GAP [ $ ]
0.50
INEQUALITY / GINI INDEX
1,412
TOTAL POPULATION
704
MALE POPULATION
708
FEMALE POPULATION
99.44
MALES / 100 FEMALES
100.57
FEMALES / 100 MALES
46.0
MEDIAN AGE
2.5
AVG FAMILY SIZE
2.1
AVG HOUSEHOLD SIZE
669
LABOR FORCE [ PEOPLE ]
53.9%
PERCENT IN LABOR FORCE
7.9%
UNEMPLOYMENT RATE
Prudenville Zip Codes
Prudenville Area Codes
Income in Prudenville
Income Overview in Prudenville
Per Capita Income in Prudenville is $35,095, while median incomes of families and households are $62,500 and $51,055 respectively.
| Characteristic | Number | Measure |
| Per Capita Income | 1,412 | $35,095 |
| Median Family Income | 436 | $62,500 |
| Mean Family Income | 436 | $76,143 |
| Median Household Income | 675 | $51,055 |
| Mean Household Income | 675 | $72,514 |
| Income Deficit | 436 | $0 |
| Wage / Income Gap (%) | 1,412 | 46.62% |
| Wage / Income Gap ($) | 1,412 | 53.38¢ per $1 |
| Gini / Inequality Index | 1,412 | 0.50 |
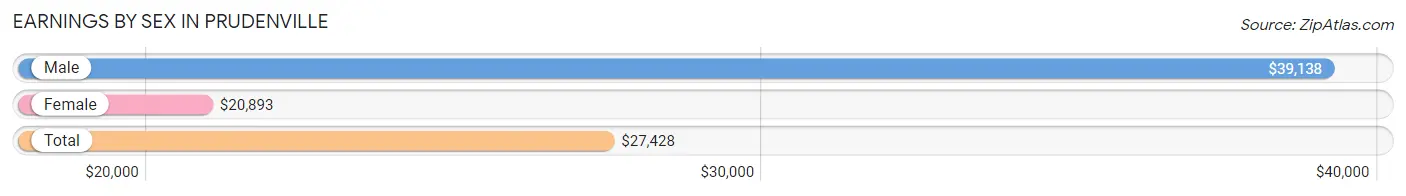
Earnings by Sex in Prudenville
Average Earnings in Prudenville are $27,428, $39,138 for men and $20,893 for women, a difference of 46.6%.
| Sex | Number | Average Earnings |
| Male | 332 (48.9%) | $39,138 |
| Female | 347 (51.1%) | $20,893 |
| Total | 679 (100.0%) | $27,428 |
Earnings by Sex by Income Bracket in Prudenville
The most common earnings brackets in Prudenville are $100,000+ for men (69 | 20.8%) and $7,500 to $9,999 for women (62 | 17.9%).
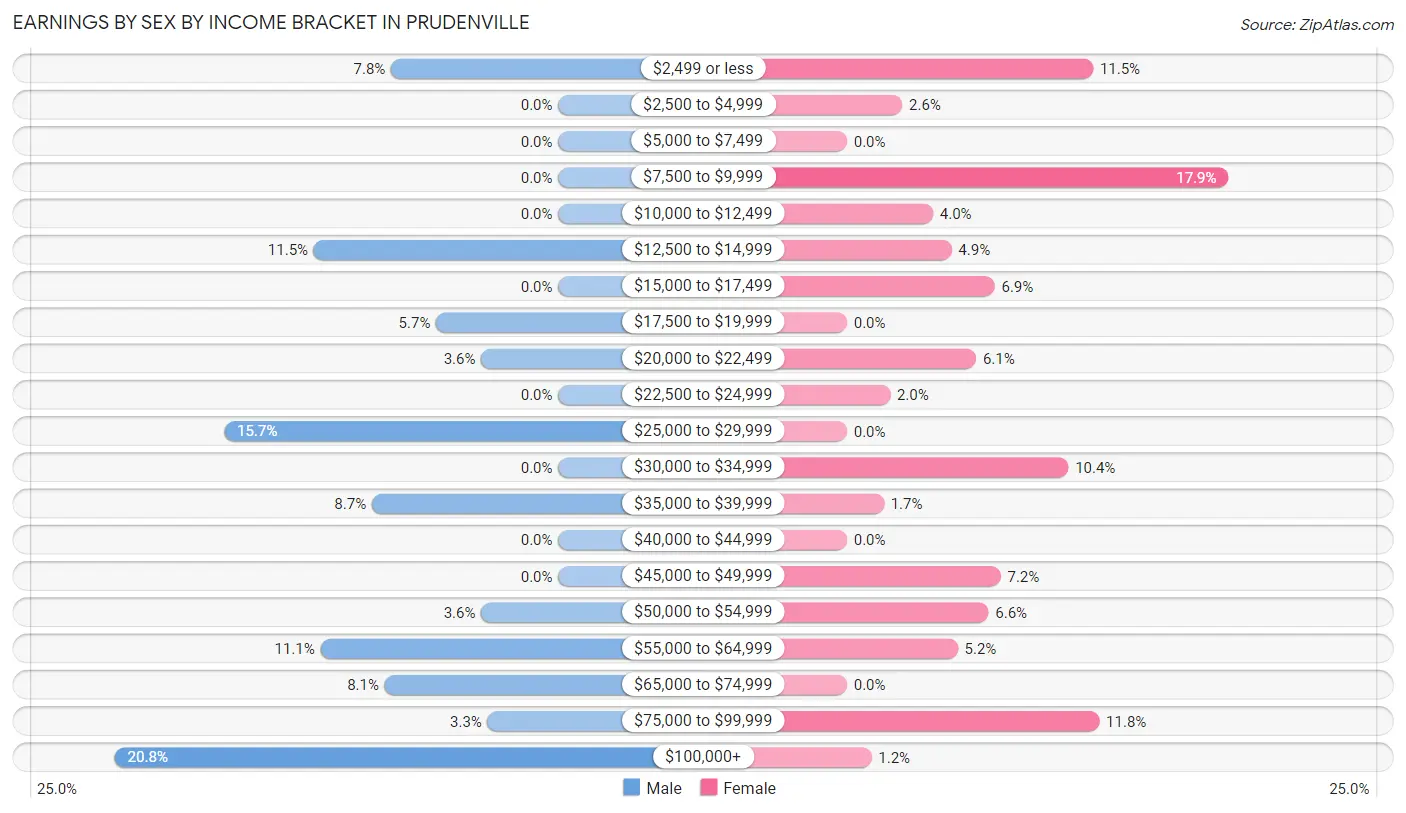
| Income | Male | Female |
| $2,499 or less | 26 (7.8%) | 40 (11.5%) |
| $2,500 to $4,999 | 0 (0.0%) | 9 (2.6%) |
| $5,000 to $7,499 | 0 (0.0%) | 0 (0.0%) |
| $7,500 to $9,999 | 0 (0.0%) | 62 (17.9%) |
| $10,000 to $12,499 | 0 (0.0%) | 14 (4.0%) |
| $12,500 to $14,999 | 38 (11.5%) | 17 (4.9%) |
| $15,000 to $17,499 | 0 (0.0%) | 24 (6.9%) |
| $17,500 to $19,999 | 19 (5.7%) | 0 (0.0%) |
| $20,000 to $22,499 | 12 (3.6%) | 21 (6.0%) |
| $22,500 to $24,999 | 0 (0.0%) | 7 (2.0%) |
| $25,000 to $29,999 | 52 (15.7%) | 0 (0.0%) |
| $30,000 to $34,999 | 0 (0.0%) | 36 (10.4%) |
| $35,000 to $39,999 | 29 (8.7%) | 6 (1.7%) |
| $40,000 to $44,999 | 0 (0.0%) | 0 (0.0%) |
| $45,000 to $49,999 | 0 (0.0%) | 25 (7.2%) |
| $50,000 to $54,999 | 12 (3.6%) | 23 (6.6%) |
| $55,000 to $64,999 | 37 (11.1%) | 18 (5.2%) |
| $65,000 to $74,999 | 27 (8.1%) | 0 (0.0%) |
| $75,000 to $99,999 | 11 (3.3%) | 41 (11.8%) |
| $100,000+ | 69 (20.8%) | 4 (1.1%) |
| Total | 332 (100.0%) | 347 (100.0%) |
Earnings by Sex by Educational Attainment in Prudenville
Average earnings in Prudenville are $60,208 for men and $33,523 for women, a difference of 44.3%. Men with an educational attainment of bachelor's degree enjoy the highest average annual earnings of $168,864, while those with college or associate's degree education earn the least with $54,063. Women with an educational attainment of high school diploma earn the most with the average annual earnings of $52,125, while those with high school diploma education have the smallest earnings of $52,125.
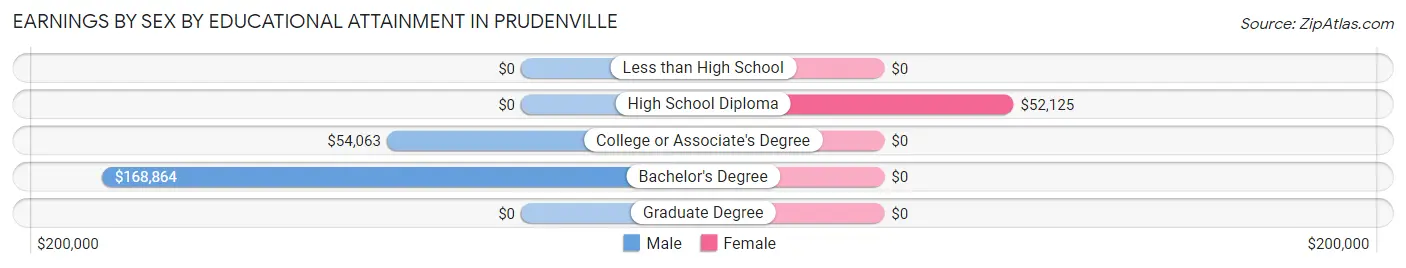
| Educational Attainment | Male Income | Female Income |
| Less than High School | - | - |
| High School Diploma | - | - |
| College or Associate's Degree | $54,063 | $0 |
| Bachelor's Degree | $168,864 | $0 |
| Graduate Degree | - | - |
| Total | $60,208 | $33,523 |
Family Income in Prudenville
Family Income Brackets in Prudenville
According to the Prudenville family income data, there are 81 families falling into the $50,000 to $74,999 income range, which is the most common income bracket and makes up 18.6% of all families.
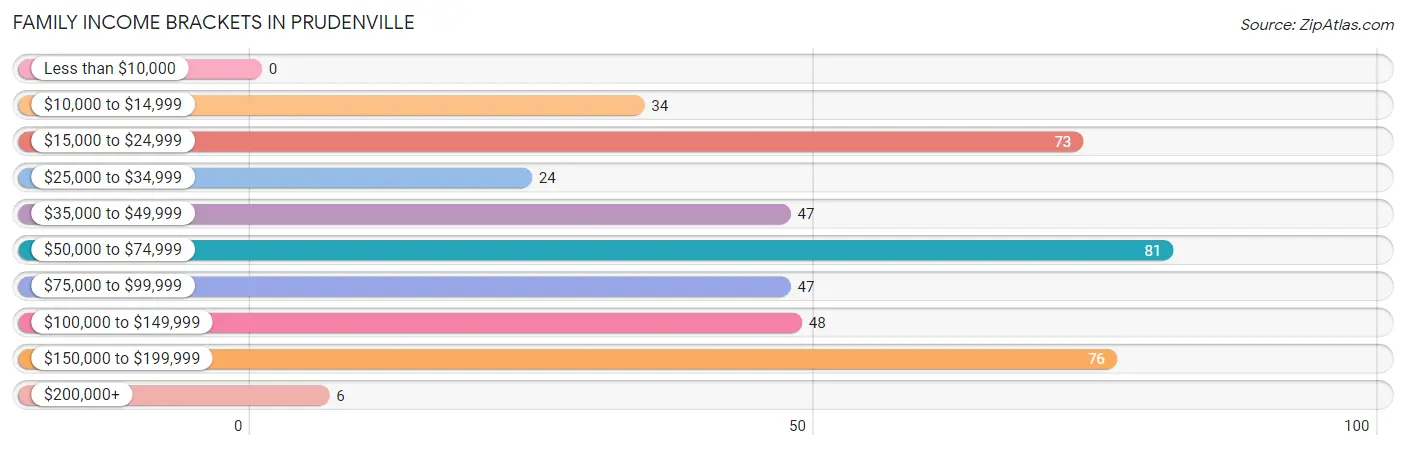
| Income Bracket | # Families | % Families |
| Less than $10,000 | 0 | 0.0% |
| $10,000 to $14,999 | 34 | 7.8% |
| $15,000 to $24,999 | 73 | 16.7% |
| $25,000 to $34,999 | 24 | 5.5% |
| $35,000 to $49,999 | 47 | 10.8% |
| $50,000 to $74,999 | 81 | 18.6% |
| $75,000 to $99,999 | 47 | 10.8% |
| $100,000 to $149,999 | 48 | 11.0% |
| $150,000 to $199,999 | 76 | 17.4% |
| $200,000+ | 6 | 1.4% |
Family Income by Famaliy Size in Prudenville
3-person families (66 | 15.1%) account for the highest median family income in Prudenville with $116,250 per family, while 3-person families (66 | 15.1%) have the highest median income of $38,750 per family member.
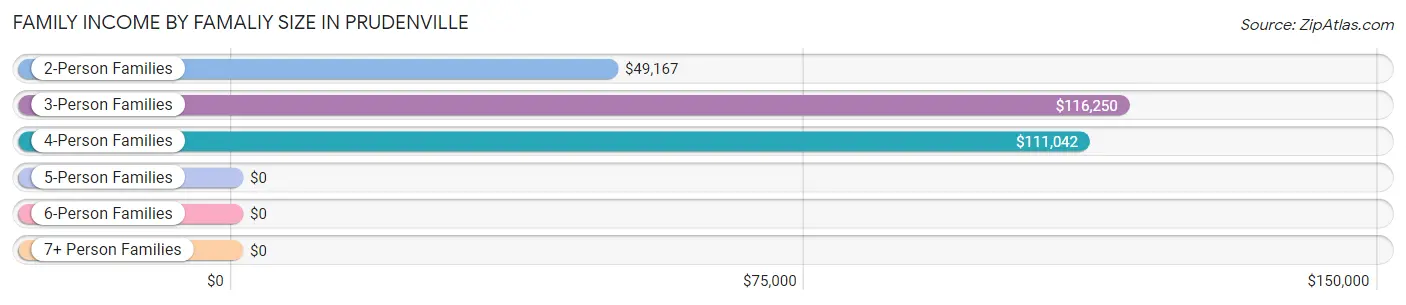
| Income Bracket | # Families | Median Income |
| 2-Person Families | 318 (72.9%) | $49,167 |
| 3-Person Families | 66 (15.1%) | $116,250 |
| 4-Person Families | 47 (10.8%) | $111,042 |
| 5-Person Families | 0 (0.0%) | $0 |
| 6-Person Families | 5 (1.1%) | $0 |
| 7+ Person Families | 0 (0.0%) | $0 |
| Total | 436 (100.0%) | $62,500 |
Family Income by Number of Earners in Prudenville
The median family income in Prudenville is $62,500, with families comprising 3+ earners (52) having the highest median family income of $163,452, while families with no earners (132) have the lowest median family income of $41,406, accounting for 11.9% and 30.3% of families, respectively.
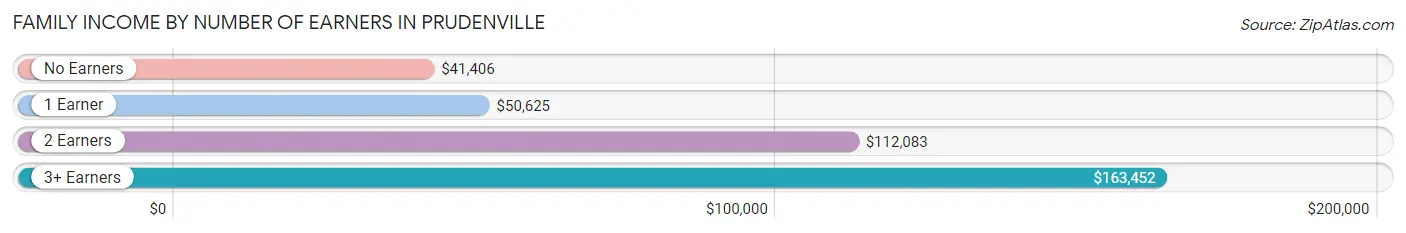
| Number of Earners | # Families | Median Income |
| No Earners | 132 (30.3%) | $41,406 |
| 1 Earner | 178 (40.8%) | $50,625 |
| 2 Earners | 74 (17.0%) | $112,083 |
| 3+ Earners | 52 (11.9%) | $163,452 |
| Total | 436 (100.0%) | $62,500 |
Household Income in Prudenville
Household Income Brackets in Prudenville
With 141 households falling in the category, the $50,000 to $74,999 income range is the most frequent in Prudenville, accounting for 20.9% of all households. In contrast, only 27 households (4.0%) fall into the $200,000+ income bracket, making it the least populous group.
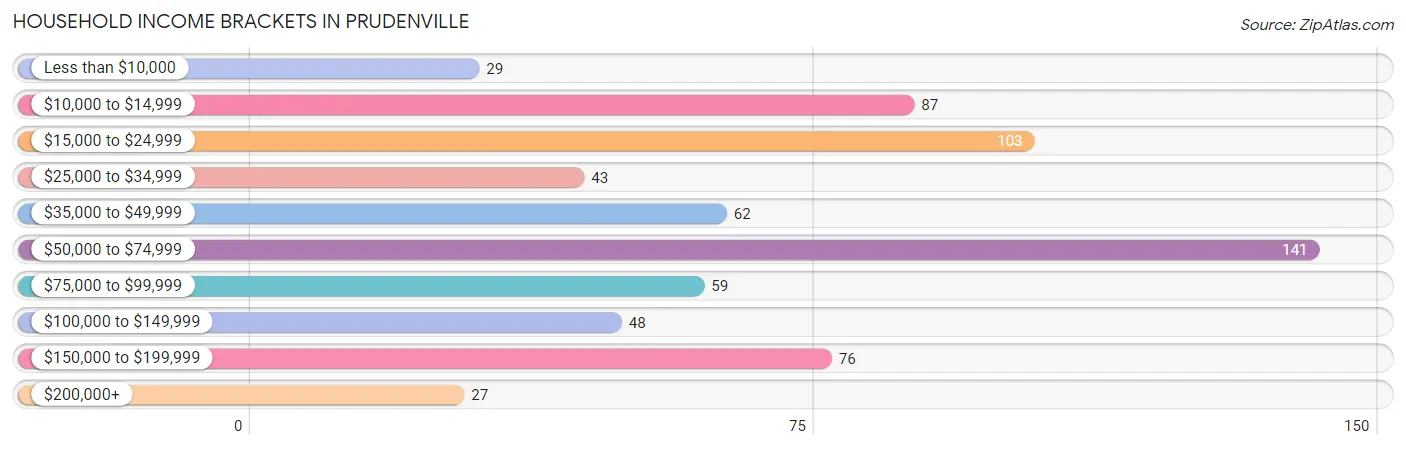
| Income Bracket | # Households | % Households |
| Less than $10,000 | 29 | 4.3% |
| $10,000 to $14,999 | 87 | 12.9% |
| $15,000 to $24,999 | 103 | 15.3% |
| $25,000 to $34,999 | 43 | 6.4% |
| $35,000 to $49,999 | 62 | 9.2% |
| $50,000 to $74,999 | 141 | 20.9% |
| $75,000 to $99,999 | 59 | 8.7% |
| $100,000 to $149,999 | 48 | 7.1% |
| $150,000 to $199,999 | 76 | 11.3% |
| $200,000+ | 27 | 4.0% |
Household Income by Householder Age in Prudenville
The median household income in Prudenville is $51,055, with the highest median household income of $61,298 found in the 45 to 64 years age bracket for the primary householder. A total of 183 households (27.1%) fall into this category. Meanwhile, the 15 to 24 years age bracket for the primary householder has the lowest median household income of $0, with 72 households (10.7%) in this group.
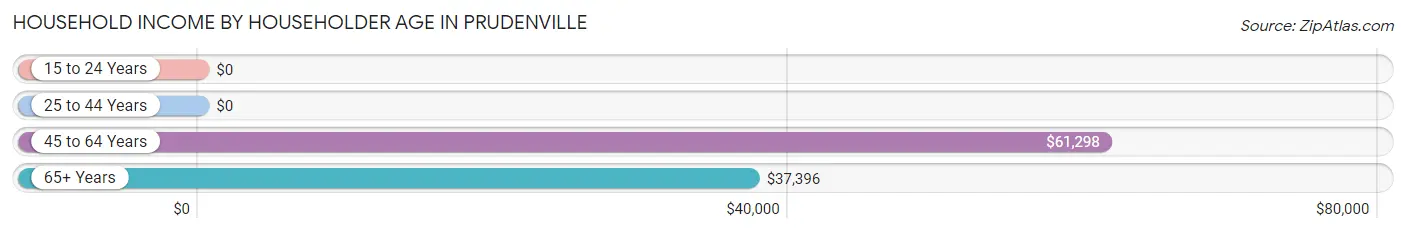
| Income Bracket | # Households | Median Income |
| 15 to 24 Years | 72 (10.7%) | $0 |
| 25 to 44 Years | 163 (24.1%) | $0 |
| 45 to 64 Years | 183 (27.1%) | $61,298 |
| 65+ Years | 257 (38.1%) | $37,396 |
| Total | 675 (100.0%) | $51,055 |
Poverty in Prudenville
Income Below Poverty by Sex and Age in Prudenville
With 8.5% poverty level for males and 16.8% for females among the residents of Prudenville, 12 to 14 year old males and 75 year old and over females are the most vulnerable to poverty, with 10 males (38.5%) and 55 females (51.9%) in their respective age groups living below the poverty level.
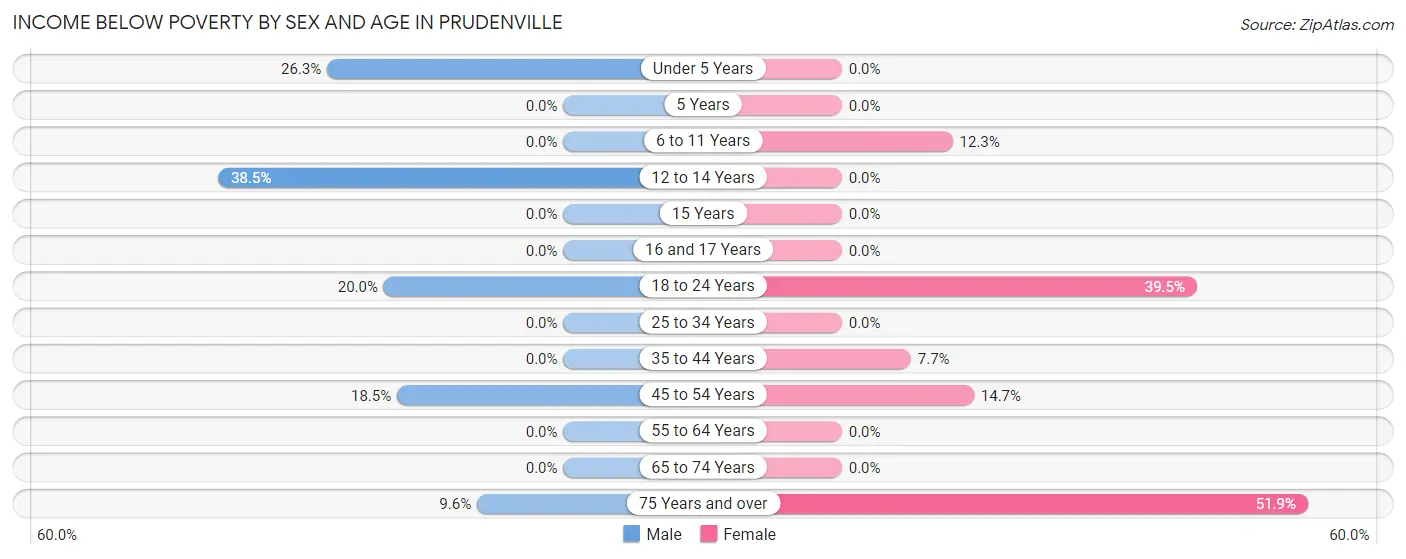
| Age Bracket | Male | Female |
| Under 5 Years | 10 (26.3%) | 0 (0.0%) |
| 5 Years | 0 (0.0%) | 0 (0.0%) |
| 6 to 11 Years | 0 (0.0%) | 9 (12.3%) |
| 12 to 14 Years | 10 (38.5%) | 0 (0.0%) |
| 15 Years | 0 (0.0%) | 0 (0.0%) |
| 16 and 17 Years | 0 (0.0%) | 0 (0.0%) |
| 18 to 24 Years | 20 (20.0%) | 34 (39.5%) |
| 25 to 34 Years | 0 (0.0%) | 0 (0.0%) |
| 35 to 44 Years | 0 (0.0%) | 11 (7.7%) |
| 45 to 54 Years | 10 (18.5%) | 10 (14.7%) |
| 55 to 64 Years | 0 (0.0%) | 0 (0.0%) |
| 65 to 74 Years | 0 (0.0%) | 0 (0.0%) |
| 75 Years and over | 10 (9.6%) | 55 (51.9%) |
| Total | 60 (8.5%) | 119 (16.8%) |
Income Above Poverty by Sex and Age in Prudenville
According to the poverty statistics in Prudenville, males aged 16 and 17 years and females aged under 5 years are the age groups that are most secure financially, with 100.0% of males and 100.0% of females in these age groups living above the poverty line.
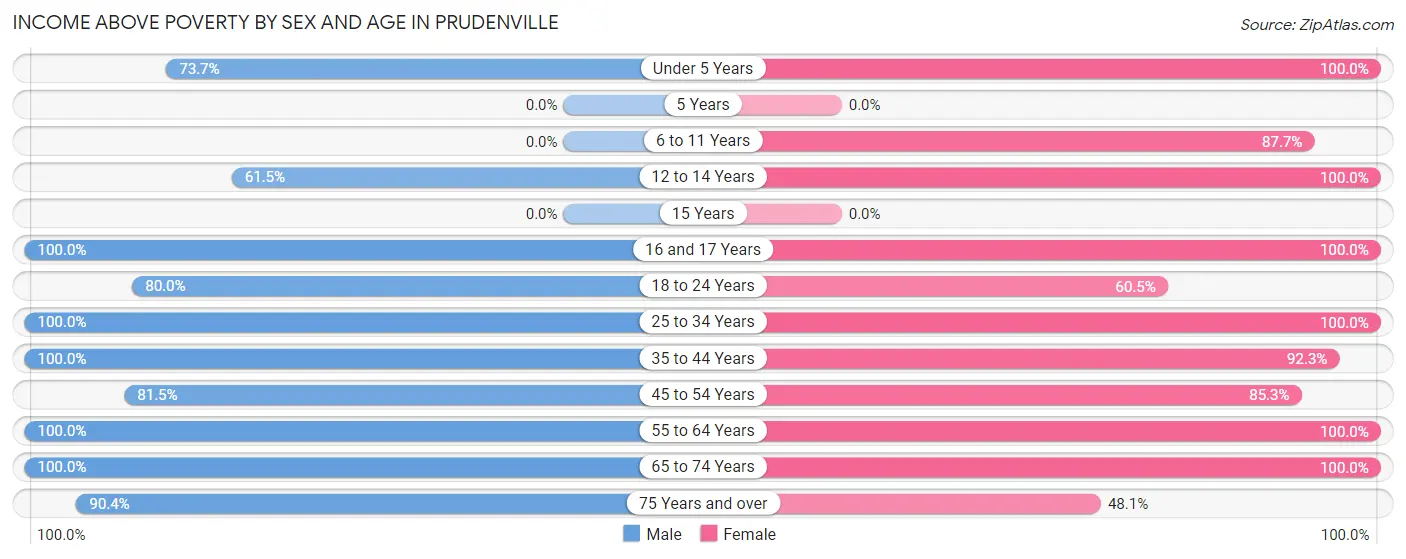
| Age Bracket | Male | Female |
| Under 5 Years | 28 (73.7%) | 22 (100.0%) |
| 5 Years | 0 (0.0%) | 0 (0.0%) |
| 6 to 11 Years | 0 (0.0%) | 64 (87.7%) |
| 12 to 14 Years | 16 (61.5%) | 11 (100.0%) |
| 15 Years | 0 (0.0%) | 0 (0.0%) |
| 16 and 17 Years | 20 (100.0%) | 21 (100.0%) |
| 18 to 24 Years | 80 (80.0%) | 52 (60.5%) |
| 25 to 34 Years | 58 (100.0%) | 9 (100.0%) |
| 35 to 44 Years | 98 (100.0%) | 132 (92.3%) |
| 45 to 54 Years | 44 (81.5%) | 58 (85.3%) |
| 55 to 64 Years | 97 (100.0%) | 95 (100.0%) |
| 65 to 74 Years | 109 (100.0%) | 74 (100.0%) |
| 75 Years and over | 94 (90.4%) | 51 (48.1%) |
| Total | 644 (91.5%) | 589 (83.2%) |
Income Below Poverty Among Married-Couple Families in Prudenville
The poverty statistics for married-couple families in Prudenville show that 6.7% or 20 of the total 300 families live below the poverty line. Families with 1 or 2 children have the highest poverty rate of 18.9%, comprising of 10 families. On the other hand, families with 3 or 4 children have the lowest poverty rate of 0.0%, which includes 0 families.
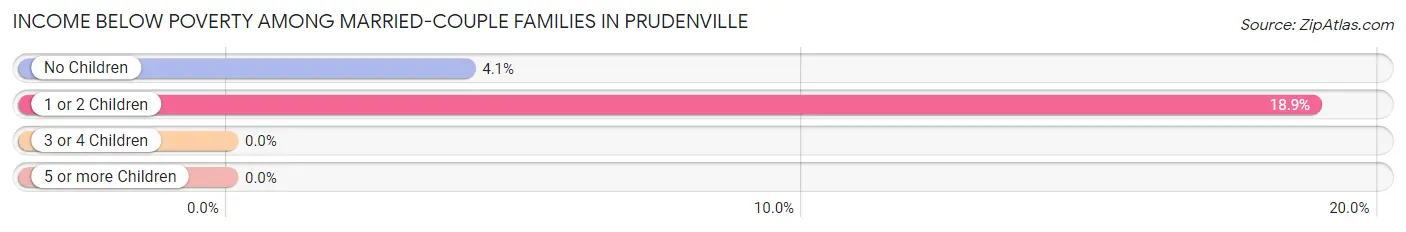
| Children | Above Poverty | Below Poverty |
| No Children | 232 (95.9%) | 10 (4.1%) |
| 1 or 2 Children | 43 (81.1%) | 10 (18.9%) |
| 3 or 4 Children | 5 (100.0%) | 0 (0.0%) |
| 5 or more Children | 0 (0.0%) | 0 (0.0%) |
| Total | 280 (93.3%) | 20 (6.7%) |
Income Below Poverty Among Single-Parent Households in Prudenville
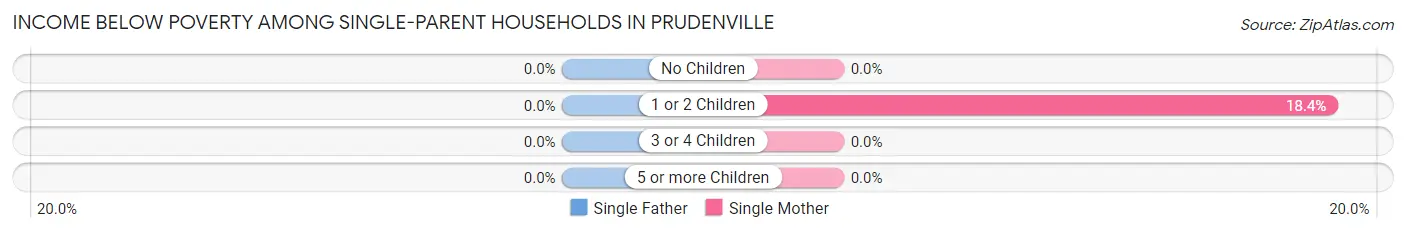
| Children | Single Father | Single Mother |
| No Children | 0 (0.0%) | 0 (0.0%) |
| 1 or 2 Children | 0 (0.0%) | 14 (18.4%) |
| 3 or 4 Children | 0 (0.0%) | 0 (0.0%) |
| 5 or more Children | 0 (0.0%) | 0 (0.0%) |
| Total | 0 (0.0%) | 14 (14.6%) |
Income Below Poverty Among Married-Couple vs Single-Parent Households in Prudenville
The poverty data for Prudenville shows that 20 of the married-couple family households (6.7%) and 14 of the single-parent households (10.3%) are living below the poverty level. Within the married-couple family households, those with 1 or 2 children have the highest poverty rate, with 10 households (18.9%) falling below the poverty line. Among the single-parent households, those with 1 or 2 children have the highest poverty rate, with 14 household (13.1%) living below poverty.
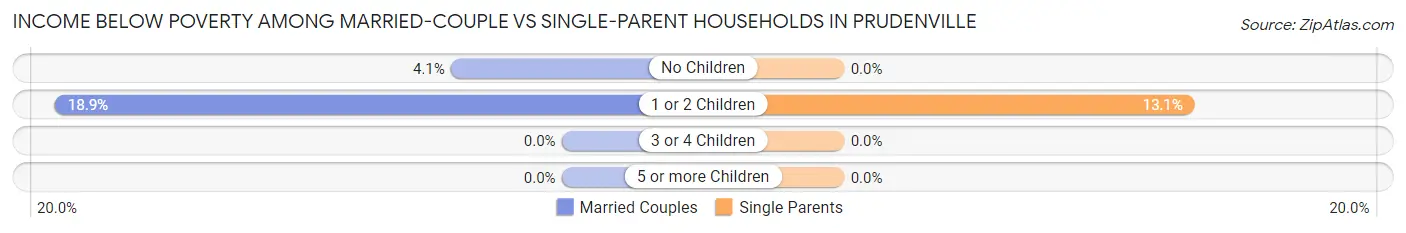
| Children | Married-Couple Families | Single-Parent Households |
| No Children | 10 (4.1%) | 0 (0.0%) |
| 1 or 2 Children | 10 (18.9%) | 14 (13.1%) |
| 3 or 4 Children | 0 (0.0%) | 0 (0.0%) |
| 5 or more Children | 0 (0.0%) | 0 (0.0%) |
| Total | 20 (6.7%) | 14 (10.3%) |
Race in Prudenville
The most populous races in Prudenville are White / Caucasian (1,394 | 98.7%), and Two or more Races (18 | 1.3%).
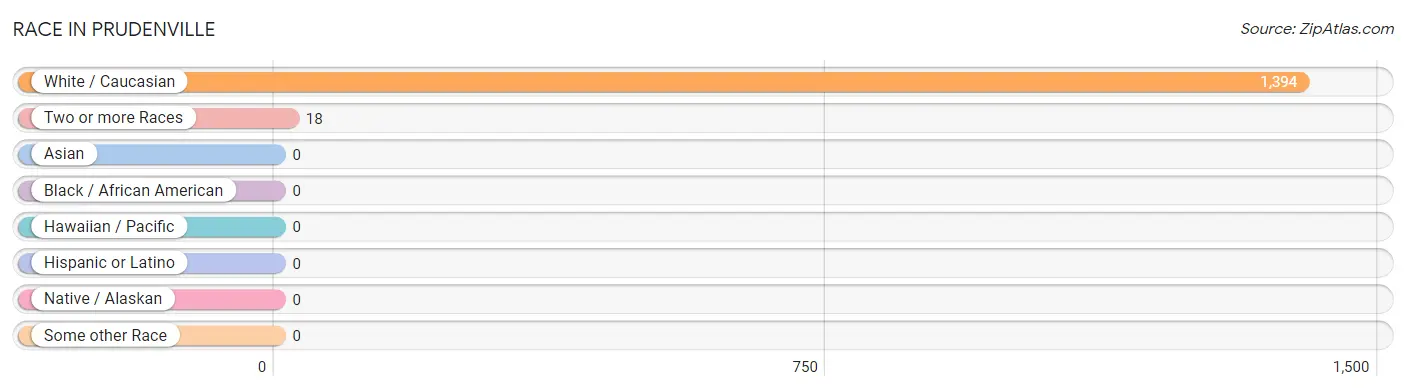
| Race | # Population | % Population |
| Asian | 0 | 0.0% |
| Black / African American | 0 | 0.0% |
| Hawaiian / Pacific | 0 | 0.0% |
| Hispanic or Latino | 0 | 0.0% |
| Native / Alaskan | 0 | 0.0% |
| White / Caucasian | 1,394 | 98.7% |
| Two or more Races | 18 | 1.3% |
| Some other Race | 0 | 0.0% |
| Total | 1,412 | 100.0% |
Ancestry in Prudenville
The most populous ancestries reported in Prudenville are German (376 | 26.6%), Irish (331 | 23.4%), English (255 | 18.1%), Polish (158 | 11.2%), and American (75 | 5.3%), together accounting for 84.6% of all Prudenville residents.
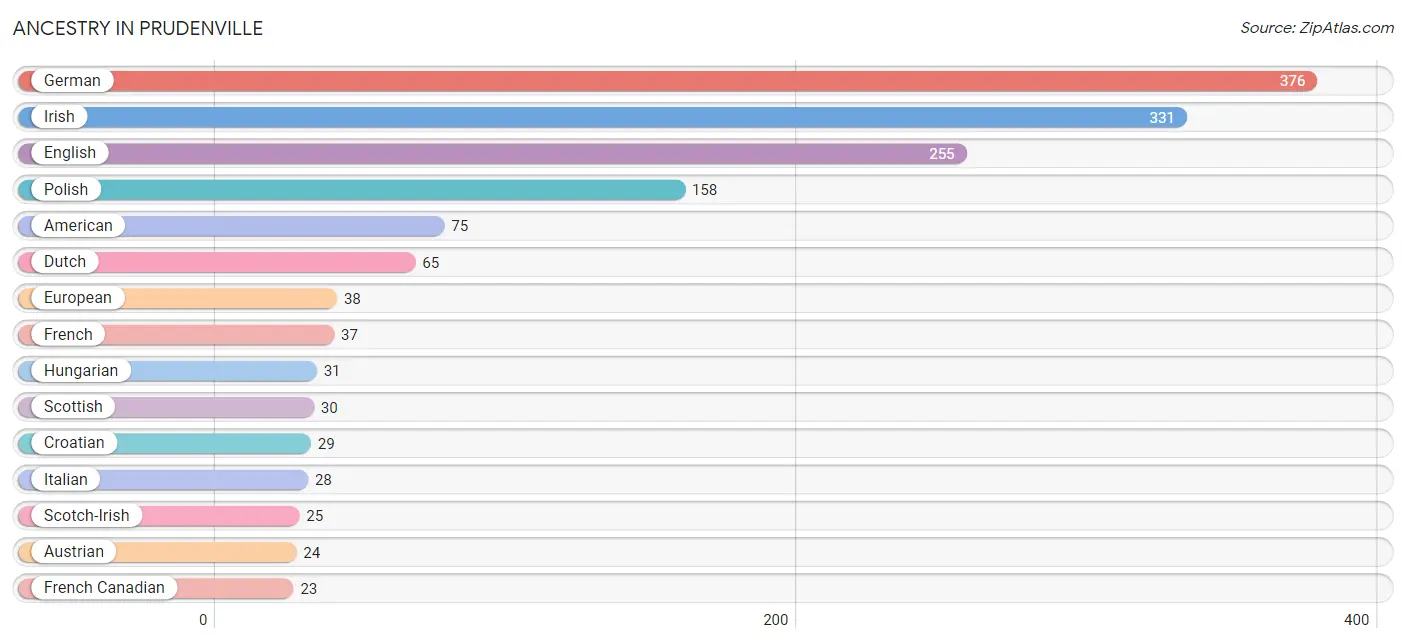
| Ancestry | # Population | % Population |
| American | 75 | 5.3% |
| Austrian | 24 | 1.7% |
| Belgian | 18 | 1.3% |
| Canadian | 19 | 1.3% |
| Cherokee | 6 | 0.4% |
| Croatian | 29 | 2.1% |
| Dutch | 65 | 4.6% |
| English | 255 | 18.1% |
| European | 38 | 2.7% |
| French | 37 | 2.6% |
| French Canadian | 23 | 1.6% |
| German | 376 | 26.6% |
| Hungarian | 31 | 2.2% |
| Irish | 331 | 23.4% |
| Italian | 28 | 2.0% |
| Polish | 158 | 11.2% |
| Scotch-Irish | 25 | 1.8% |
| Scottish | 30 | 2.1% |
| Swedish | 11 | 0.8% |
| Ukrainian | 6 | 0.4% |
| Welsh | 19 | 1.3% | View All 21 Rows |
Immigrants in Prudenville
The most numerous immigrant groups reported in Prudenville came from Europe (37 | 2.6%), England (19 | 1.3%), Northern Europe (19 | 1.3%), Eastern Europe (10 | 0.7%), and Poland (10 | 0.7%), together accounting for 6.7% of all Prudenville residents.
| Immigration Origin | # Population | % Population |
| Eastern Europe | 10 | 0.7% |
| England | 19 | 1.3% |
| Europe | 37 | 2.6% |
| Germany | 8 | 0.6% |
| Northern Europe | 19 | 1.3% |
| Poland | 10 | 0.7% |
| Western Europe | 8 | 0.6% | View All 7 Rows |
Sex and Age in Prudenville
Sex and Age in Prudenville
The most populous age groups in Prudenville are 40 to 44 Years (88 | 12.5%) for men and 40 to 44 Years (100 | 14.1%) for women.
| Age Bracket | Male | Female |
| Under 5 Years | 38 (5.4%) | 22 (3.1%) |
| 5 to 9 Years | 0 (0.0%) | 0 (0.0%) |
| 10 to 14 Years | 26 (3.7%) | 84 (11.9%) |
| 15 to 19 Years | 41 (5.8%) | 38 (5.4%) |
| 20 to 24 Years | 79 (11.2%) | 69 (9.8%) |
| 25 to 29 Years | 53 (7.5%) | 9 (1.3%) |
| 30 to 34 Years | 5 (0.7%) | 0 (0.0%) |
| 35 to 39 Years | 10 (1.4%) | 43 (6.1%) |
| 40 to 44 Years | 88 (12.5%) | 100 (14.1%) |
| 45 to 49 Years | 10 (1.4%) | 55 (7.8%) |
| 50 to 54 Years | 44 (6.2%) | 13 (1.8%) |
| 55 to 59 Years | 37 (5.3%) | 48 (6.8%) |
| 60 to 64 Years | 60 (8.5%) | 47 (6.6%) |
| 65 to 69 Years | 63 (8.9%) | 27 (3.8%) |
| 70 to 74 Years | 46 (6.5%) | 47 (6.6%) |
| 75 to 79 Years | 57 (8.1%) | 59 (8.3%) |
| 80 to 84 Years | 30 (4.3%) | 47 (6.6%) |
| 85 Years and over | 17 (2.4%) | 0 (0.0%) |
| Total | 704 (100.0%) | 708 (100.0%) |
Families and Households in Prudenville
Median Family Size in Prudenville
The median family size in Prudenville is 2.46 persons per family, with married-couple families (300 | 68.8%) accounting for the largest median family size of 2.49 persons per family. On the other hand, single female/mother families (96 | 22.0%) represent the smallest median family size with 2.39 persons per family.
| Family Type | # Families | Family Size |
| Married-Couple | 300 (68.8%) | 2.49 |
| Single Male/Father | 40 (9.2%) | 2.43 |
| Single Female/Mother | 96 (22.0%) | 2.39 |
| Total Families | 436 (100.0%) | 2.46 |
Median Household Size in Prudenville
The median household size in Prudenville is 2.09 persons per household, with single male/father households (40 | 5.9%) accounting for the largest median household size of 2.7 persons per household. non-family households (239 | 35.4%) represent the smallest median household size with 1.33 persons per household.
| Household Type | # Households | Household Size |
| Married-Couple | 300 (44.4%) | 2.49 |
| Single Male/Father | 40 (5.9%) | 2.70 |
| Single Female/Mother | 96 (14.2%) | 2.50 |
| Non-family | 239 (35.4%) | 1.33 |
| Total Households | 675 (100.0%) | 2.09 |
Household Size by Marriage Status in Prudenville
Out of a total of 675 households in Prudenville, 436 (64.6%) are family households, while 239 (35.4%) are nonfamily households. The most numerous type of family households are 2-person households, comprising 292, and the most common type of nonfamily households are 1-person households, comprising 182.
| Household Size | Family Households | Nonfamily Households |
| 1-Person Households | - | 182 (27.0%) |
| 2-Person Households | 292 (43.3%) | 57 (8.4%) |
| 3-Person Households | 92 (13.6%) | 0 (0.0%) |
| 4-Person Households | 47 (7.0%) | 0 (0.0%) |
| 5-Person Households | 0 (0.0%) | 0 (0.0%) |
| 6-Person Households | 5 (0.7%) | 0 (0.0%) |
| 7+ Person Households | 0 (0.0%) | 0 (0.0%) |
| Total | 436 (64.6%) | 239 (35.4%) |
Female Fertility in Prudenville
Fertility by Age in Prudenville
Average fertility rate in Prudenville is 131.0 births per 1,000 women. Women in the age bracket of 20 to 34 years have the highest fertility rate with 295.0 births per 1,000 women. Women in the age bracket of 20 to 34 years acount for 56.1% of all women with births.
| Age Bracket | Women with Births | Births / 1,000 Women |
| 15 to 19 years | 0 (0.0%) | 0.0 |
| 20 to 34 years | 23 (56.1%) | 295.0 |
| 35 to 50 years | 18 (43.9%) | 91.0 |
| Total | 41 (100.0%) | 131.0 |
Fertility by Age by Marriage Status in Prudenville
65.9% of women with births (41) in Prudenville are married. The highest percentage of unmarried women with births falls into 20 to 34 years age bracket with 60.9% of them unmarried at the time of birth, while the lowest percentage of unmarried women with births belong to 35 to 50 years age bracket with 0.0% of them unmarried.
| Age Bracket | Married | Unmarried |
| 15 to 19 years | 0 (0.0%) | 0 (0.0%) |
| 20 to 34 years | 9 (39.1%) | 14 (60.9%) |
| 35 to 50 years | 18 (100.0%) | 0 (0.0%) |
| Total | 27 (65.8%) | 14 (34.2%) |
Fertility by Education in Prudenville
| Educational Attainment | Women with Births | Births / 1,000 Women |
| Less than High School | 14 (34.2%) | 400.0 |
| High School Diploma | 0 (0.0%) | 0.0 |
| College or Associate's Degree | 27 (65.8%) | 141.0 |
| Bachelor's Degree | 0 (0.0%) | 0.0 |
| Graduate Degree | 0 (0.0%) | 0.0 |
| Total | 41 (100.0%) | 131.0 |
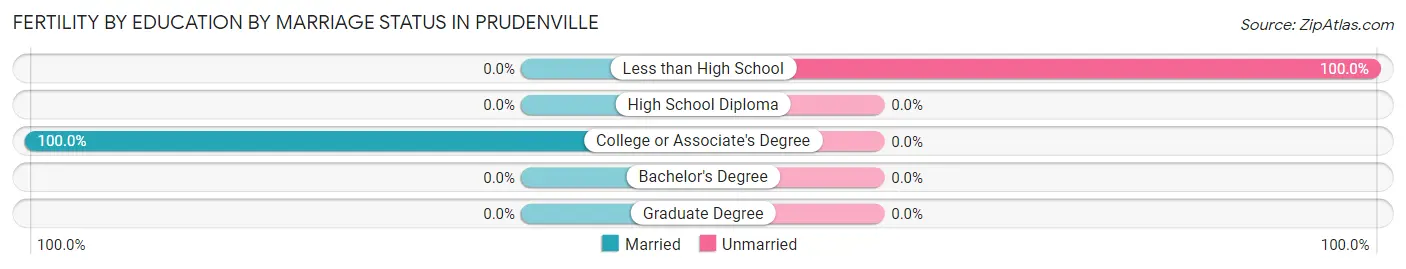
Fertility by Education by Marriage Status in Prudenville
34.2% of women with births in Prudenville are unmarried. Women with the educational attainment of college or associate's degree are most likely to be married with 100.0% of them married at childbirth, while women with the educational attainment of less than high school are least likely to be married with 100.0% of them unmarried at childbirth.
| Educational Attainment | Married | Unmarried |
| Less than High School | 0 (0.0%) | 14 (100.0%) |
| High School Diploma | 0 (0.0%) | 0 (0.0%) |
| College or Associate's Degree | 27 (100.0%) | 0 (0.0%) |
| Bachelor's Degree | 0 (0.0%) | 0 (0.0%) |
| Graduate Degree | 0 (0.0%) | 0 (0.0%) |
| Total | 27 (65.8%) | 14 (34.2%) |
Employment Characteristics in Prudenville
Employment by Class of Employer in Prudenville
Among the 554 employed individuals in Prudenville, private company employees (332 | 59.9%), self-employed (incorporated) (70 | 12.6%), and not-for-profit organizations (60 | 10.8%) make up the most common classes of employment.
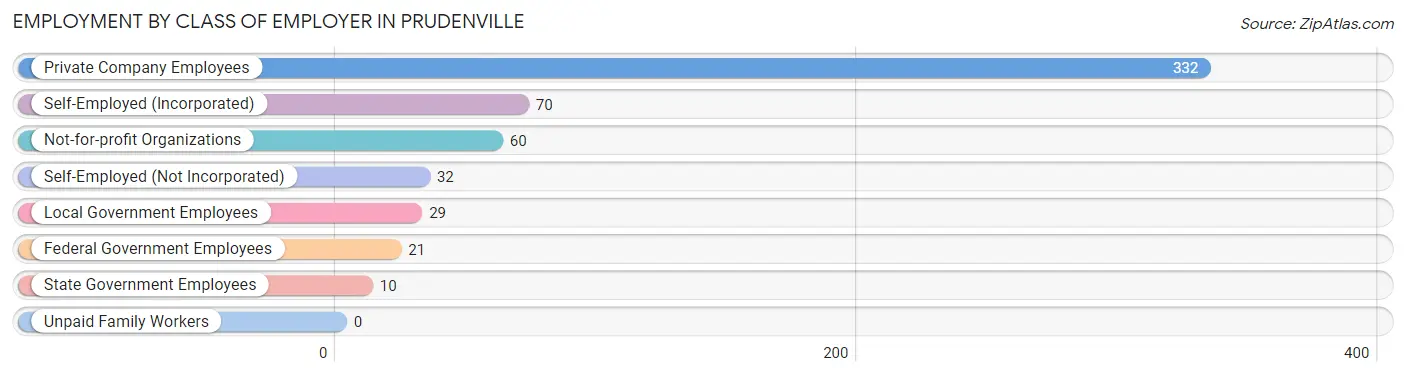
| Employer Class | # Employees | % Employees |
| Private Company Employees | 332 | 59.9% |
| Self-Employed (Incorporated) | 70 | 12.6% |
| Self-Employed (Not Incorporated) | 32 | 5.8% |
| Not-for-profit Organizations | 60 | 10.8% |
| Local Government Employees | 29 | 5.2% |
| State Government Employees | 10 | 1.8% |
| Federal Government Employees | 21 | 3.8% |
| Unpaid Family Workers | 0 | 0.0% |
| Total | 554 | 100.0% |
Employment Status by Age in Prudenville
According to the labor force statistics for Prudenville, out of the total population over 16 years of age (1,242), 53.9% or 669 individuals are in the labor force, with 7.9% or 53 of them unemployed. The age group with the highest labor force participation rate is 20 to 24 years, with 100.0% or 148 individuals in the labor force. Within the labor force, the 60 to 64 years age range has the highest percentage of unemployed individuals, with 47.1% or 8 of them being unemployed.
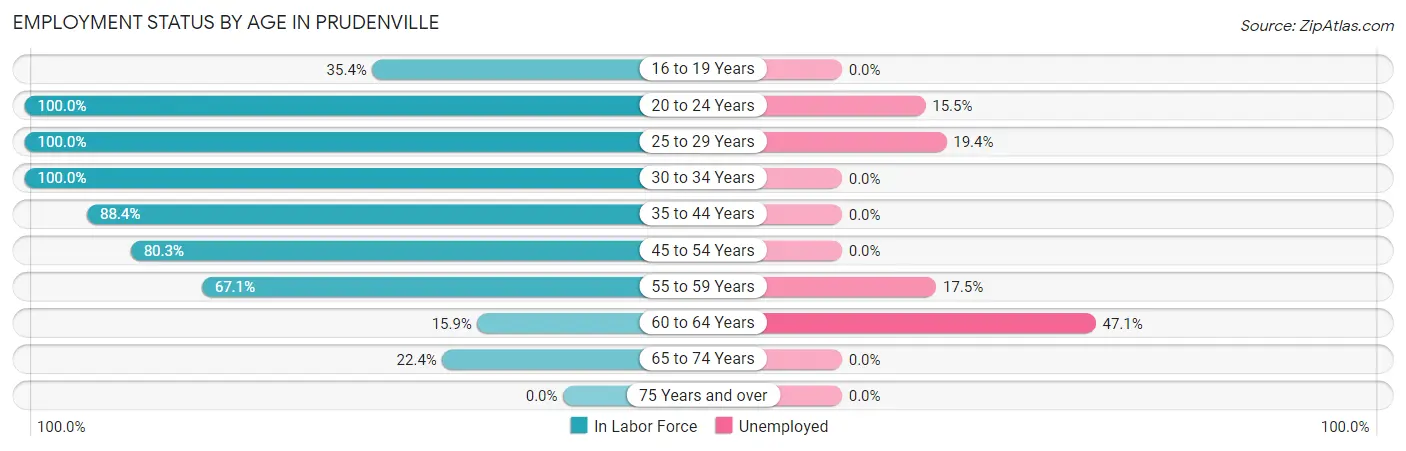
| Age Bracket | In Labor Force | Unemployed |
| 16 to 19 Years | 28 (35.4%) | 0 (0.0%) |
| 20 to 24 Years | 148 (100.0%) | 23 (15.5%) |
| 25 to 29 Years | 62 (100.0%) | 12 (19.4%) |
| 30 to 34 Years | 5 (100.0%) | 0 (0.0%) |
| 35 to 44 Years | 213 (88.4%) | 0 (0.0%) |
| 45 to 54 Years | 98 (80.3%) | 0 (0.0%) |
| 55 to 59 Years | 57 (67.1%) | 10 (17.5%) |
| 60 to 64 Years | 17 (15.9%) | 8 (47.1%) |
| 65 to 74 Years | 41 (22.4%) | 0 (0.0%) |
| 75 Years and over | 0 (0.0%) | 0 (0.0%) |
| Total | 669 (53.9%) | 53 (7.9%) |
Employment Status by Educational Attainment in Prudenville
According to labor force statistics for Prudenville, 72.7% of individuals (452) out of the total population between 25 and 64 years of age (622) are in the labor force, with 6.6% or 30 of them being unemployed. The group with the highest labor force participation rate are those with the educational attainment of college / associate degree, with 79.3% or 265 individuals in the labor force. Within the labor force, individuals with high school diploma education have the highest percentage of unemployment, with 7.9% or 10 of them being unemployed.
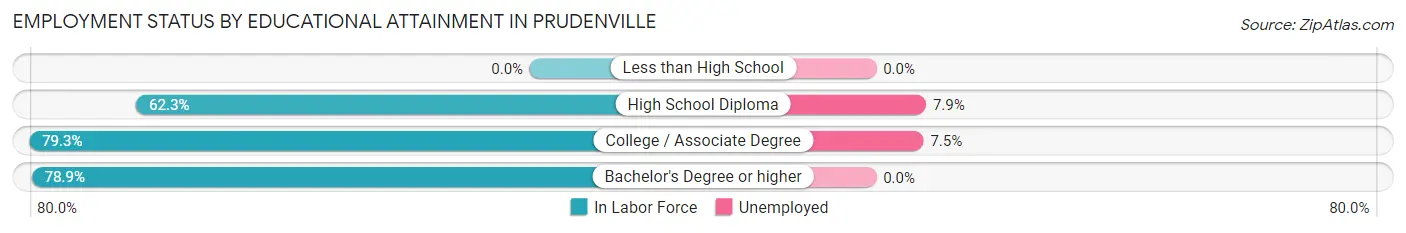
| Educational Attainment | In Labor Force | Unemployed |
| Less than High School | 0 (0.0%) | 0 (0.0%) |
| High School Diploma | 127 (62.3%) | 16 (7.9%) |
| College / Associate Degree | 265 (79.3%) | 25 (7.5%) |
| Bachelor's Degree or higher | 60 (78.9%) | 0 (0.0%) |
| Total | 452 (72.7%) | 41 (6.6%) |
Employment Occupations by Sex in Prudenville
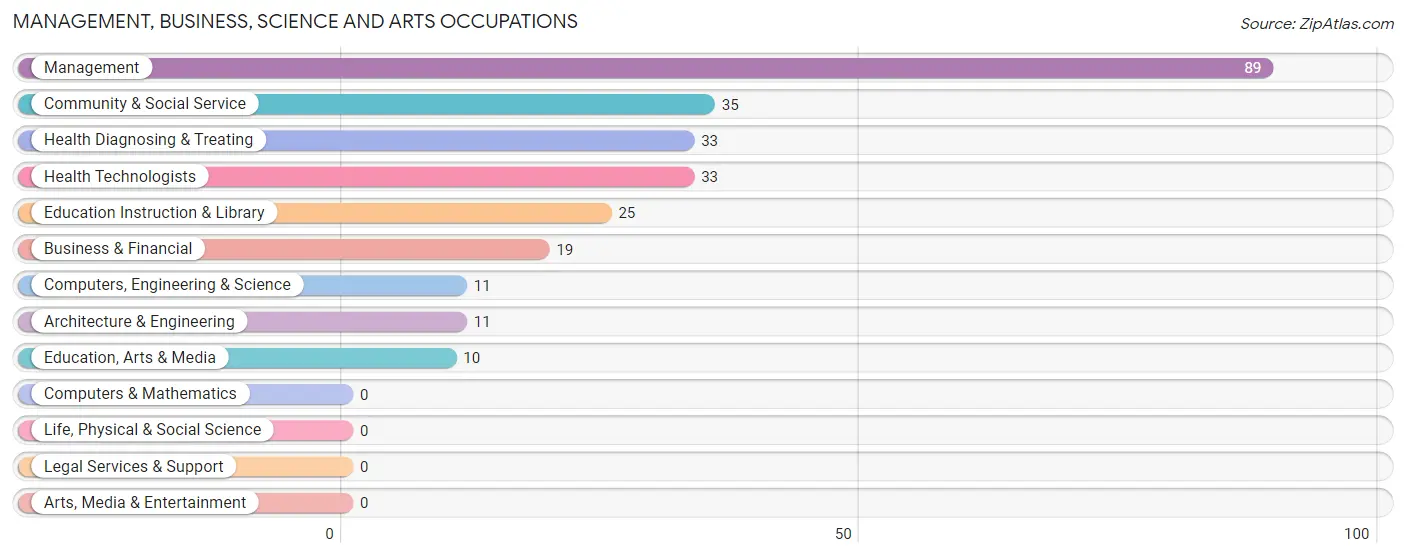
Management, Business, Science and Arts Occupations
The most common Management, Business, Science and Arts occupations in Prudenville are Management (89 | 14.4%), Community & Social Service (35 | 5.7%), Health Diagnosing & Treating (33 | 5.4%), Health Technologists (33 | 5.4%), and Education Instruction & Library (25 | 4.1%).
Management, Business, Science and Arts Occupations by Sex
Within the Management, Business, Science and Arts occupations in Prudenville, the most male-oriented occupations are Computers, Engineering & Science (100.0%), Architecture & Engineering (100.0%), and Education, Arts & Media (100.0%), while the most female-oriented occupations are Business & Financial (100.0%), Education Instruction & Library (100.0%), and Health Diagnosing & Treating (100.0%).
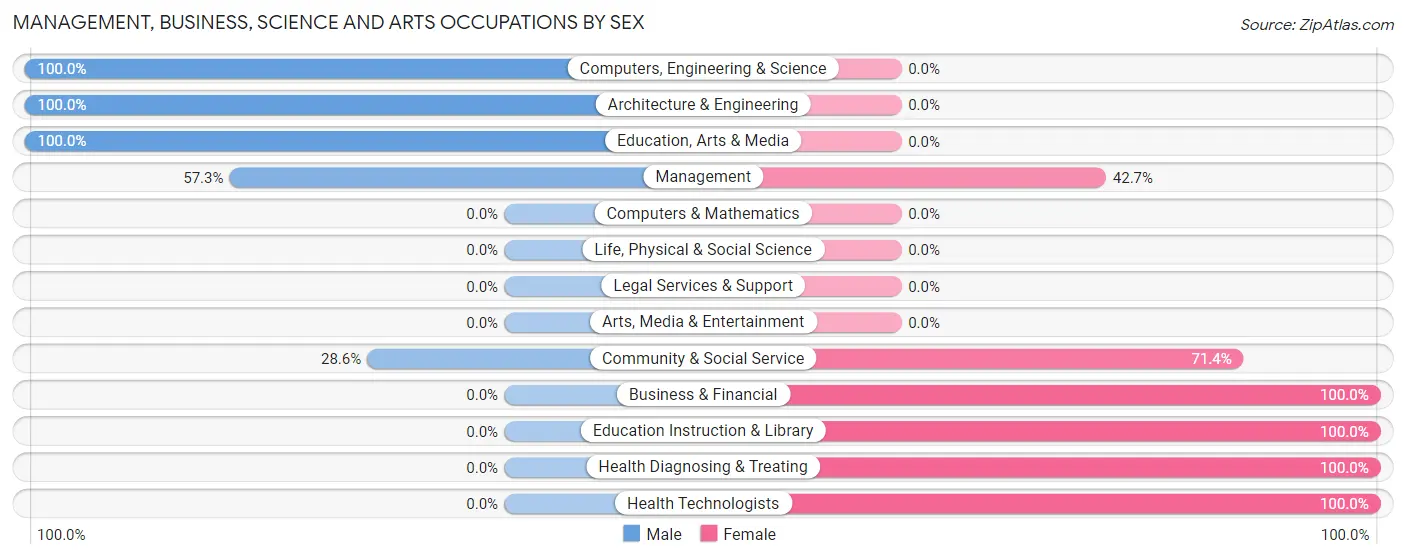
| Occupation | Male | Female |
| Management | 51 (57.3%) | 38 (42.7%) |
| Business & Financial | 0 (0.0%) | 19 (100.0%) |
| Computers, Engineering & Science | 11 (100.0%) | 0 (0.0%) |
| Computers & Mathematics | 0 (0.0%) | 0 (0.0%) |
| Architecture & Engineering | 11 (100.0%) | 0 (0.0%) |
| Life, Physical & Social Science | 0 (0.0%) | 0 (0.0%) |
| Community & Social Service | 10 (28.6%) | 25 (71.4%) |
| Education, Arts & Media | 10 (100.0%) | 0 (0.0%) |
| Legal Services & Support | 0 (0.0%) | 0 (0.0%) |
| Education Instruction & Library | 0 (0.0%) | 25 (100.0%) |
| Arts, Media & Entertainment | 0 (0.0%) | 0 (0.0%) |
| Health Diagnosing & Treating | 0 (0.0%) | 33 (100.0%) |
| Health Technologists | 0 (0.0%) | 33 (100.0%) |
| Total (Category) | 72 (38.5%) | 115 (61.5%) |
| Total (Overall) | 292 (47.4%) | 324 (52.6%) |
Services Occupations
The most common Services occupations in Prudenville are Food Preparation & Serving (150 | 24.3%), Healthcare Support (81 | 13.2%), Security & Protection (18 | 2.9%), Law Enforcement (18 | 2.9%), and Personal Care & Service (17 | 2.8%).
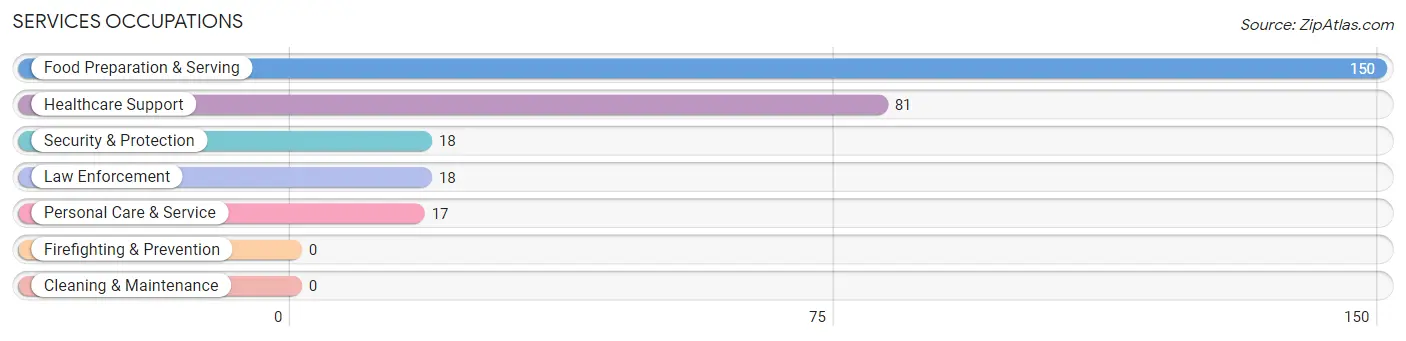
Services Occupations by Sex
Within the Services occupations in Prudenville, the most male-oriented occupations are Security & Protection (100.0%), Law Enforcement (100.0%), and Food Preparation & Serving (50.7%), while the most female-oriented occupations are Personal Care & Service (100.0%), Healthcare Support (76.5%), and Food Preparation & Serving (49.3%).
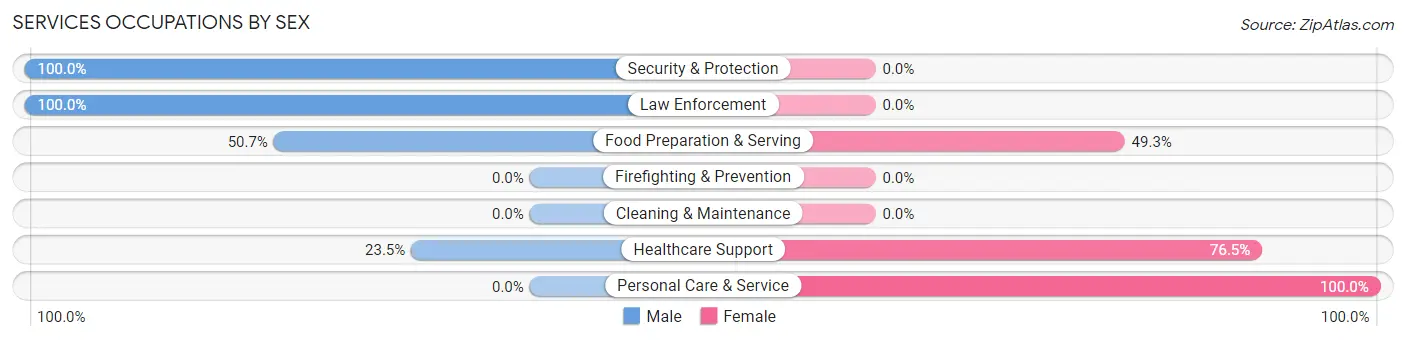
| Occupation | Male | Female |
| Healthcare Support | 19 (23.5%) | 62 (76.5%) |
| Security & Protection | 18 (100.0%) | 0 (0.0%) |
| Firefighting & Prevention | 0 (0.0%) | 0 (0.0%) |
| Law Enforcement | 18 (100.0%) | 0 (0.0%) |
| Food Preparation & Serving | 76 (50.7%) | 74 (49.3%) |
| Cleaning & Maintenance | 0 (0.0%) | 0 (0.0%) |
| Personal Care & Service | 0 (0.0%) | 17 (100.0%) |
| Total (Category) | 113 (42.5%) | 153 (57.5%) |
| Total (Overall) | 292 (47.4%) | 324 (52.6%) |
Sales and Office Occupations
The most common Sales and Office occupations in Prudenville are Sales & Related (55 | 8.9%), and Office & Administration (49 | 8.0%).

Sales and Office Occupations by Sex
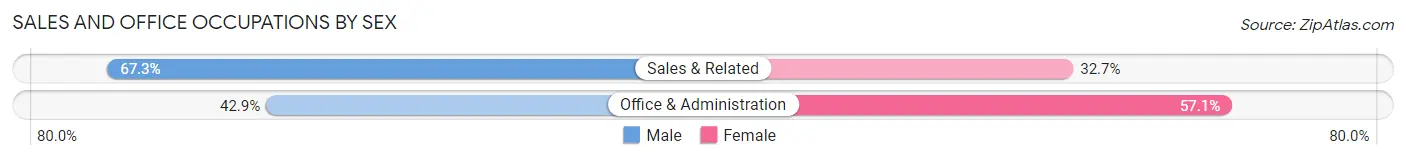
| Occupation | Male | Female |
| Sales & Related | 37 (67.3%) | 18 (32.7%) |
| Office & Administration | 21 (42.9%) | 28 (57.1%) |
| Total (Category) | 58 (55.8%) | 46 (44.2%) |
| Total (Overall) | 292 (47.4%) | 324 (52.6%) |
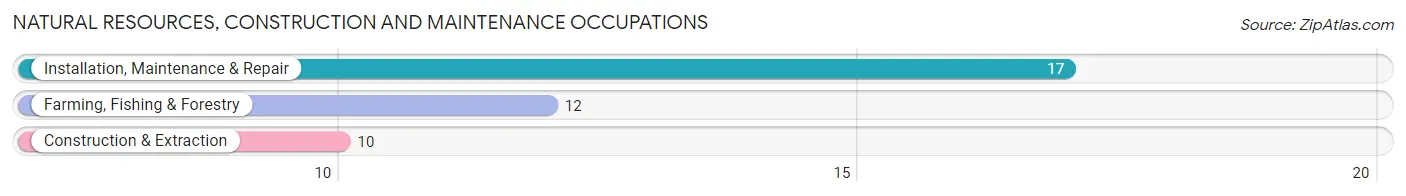
Natural Resources, Construction and Maintenance Occupations
The most common Natural Resources, Construction and Maintenance occupations in Prudenville are Installation, Maintenance & Repair (17 | 2.8%), Farming, Fishing & Forestry (12 | 1.9%), and Construction & Extraction (10 | 1.6%).
Natural Resources, Construction and Maintenance Occupations by Sex
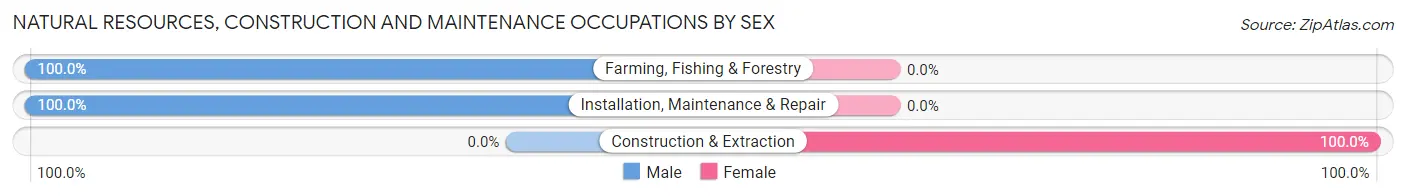
| Occupation | Male | Female |
| Farming, Fishing & Forestry | 12 (100.0%) | 0 (0.0%) |
| Construction & Extraction | 0 (0.0%) | 10 (100.0%) |
| Installation, Maintenance & Repair | 17 (100.0%) | 0 (0.0%) |
| Total (Category) | 29 (74.4%) | 10 (25.6%) |
| Total (Overall) | 292 (47.4%) | 324 (52.6%) |
Production, Transportation and Moving Occupations
The most common Production, Transportation and Moving occupations in Prudenville are Material Moving (11 | 1.8%), and Production (9 | 1.5%).
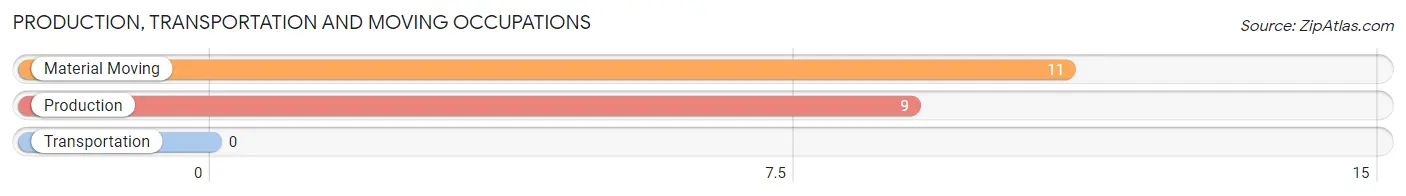
Production, Transportation and Moving Occupations by Sex
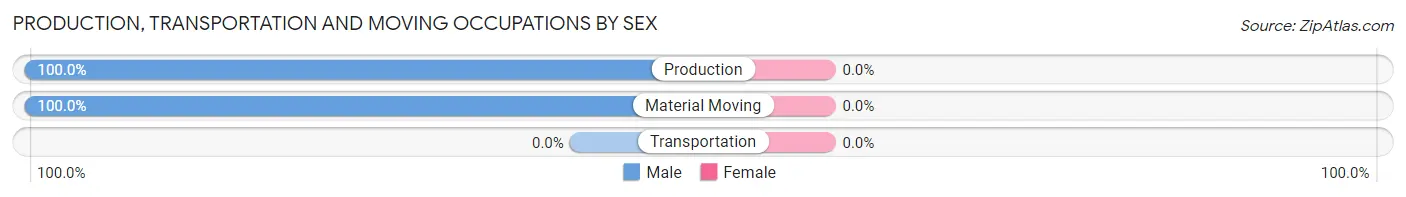
| Occupation | Male | Female |
| Production | 9 (100.0%) | 0 (0.0%) |
| Transportation | 0 (0.0%) | 0 (0.0%) |
| Material Moving | 11 (100.0%) | 0 (0.0%) |
| Total (Category) | 20 (100.0%) | 0 (0.0%) |
| Total (Overall) | 292 (47.4%) | 324 (52.6%) |
Employment Industries by Sex in Prudenville
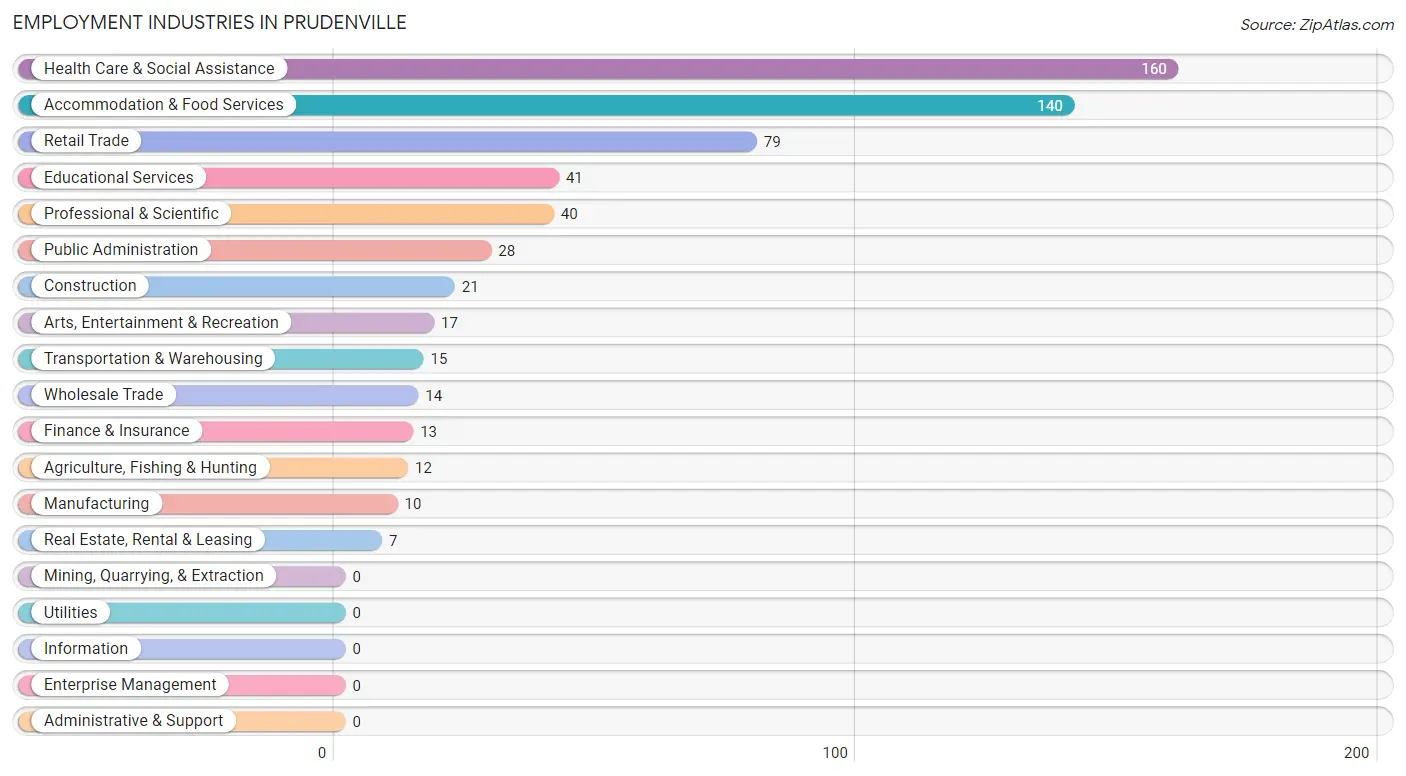
Employment Industries in Prudenville
The major employment industries in Prudenville include Health Care & Social Assistance (160 | 26.0%), Accommodation & Food Services (140 | 22.7%), Retail Trade (79 | 12.8%), Educational Services (41 | 6.7%), and Professional & Scientific (40 | 6.5%).
Employment Industries by Sex in Prudenville
The Prudenville industries that see more men than women are Agriculture, Fishing & Hunting (100.0%), Construction (100.0%), and Wholesale Trade (100.0%), whereas the industries that tend to have a higher number of women are Manufacturing (100.0%), Finance & Insurance (100.0%), and Real Estate, Rental & Leasing (100.0%).
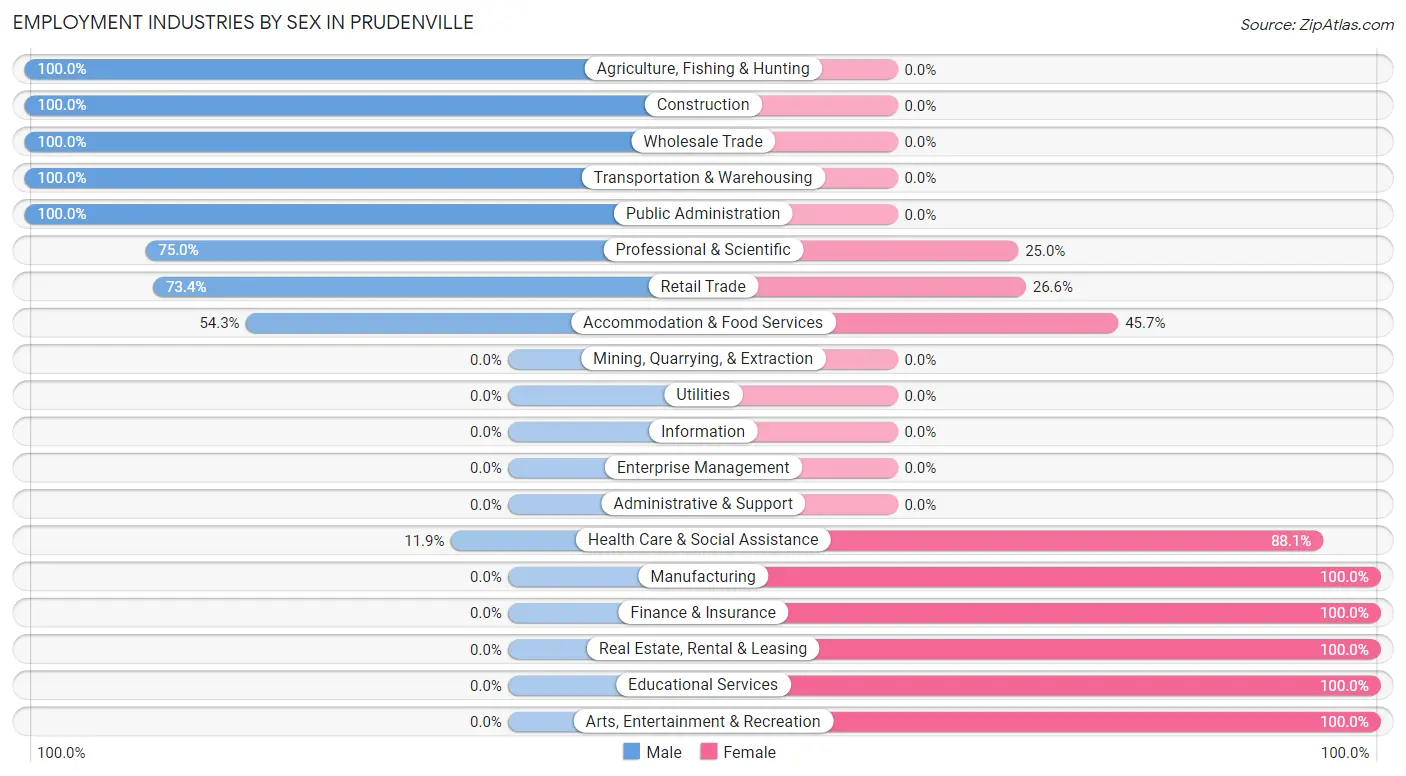
| Industry | Male | Female |
| Agriculture, Fishing & Hunting | 12 (100.0%) | 0 (0.0%) |
| Mining, Quarrying, & Extraction | 0 (0.0%) | 0 (0.0%) |
| Construction | 21 (100.0%) | 0 (0.0%) |
| Manufacturing | 0 (0.0%) | 10 (100.0%) |
| Wholesale Trade | 14 (100.0%) | 0 (0.0%) |
| Retail Trade | 58 (73.4%) | 21 (26.6%) |
| Transportation & Warehousing | 15 (100.0%) | 0 (0.0%) |
| Utilities | 0 (0.0%) | 0 (0.0%) |
| Information | 0 (0.0%) | 0 (0.0%) |
| Finance & Insurance | 0 (0.0%) | 13 (100.0%) |
| Real Estate, Rental & Leasing | 0 (0.0%) | 7 (100.0%) |
| Professional & Scientific | 30 (75.0%) | 10 (25.0%) |
| Enterprise Management | 0 (0.0%) | 0 (0.0%) |
| Administrative & Support | 0 (0.0%) | 0 (0.0%) |
| Educational Services | 0 (0.0%) | 41 (100.0%) |
| Health Care & Social Assistance | 19 (11.9%) | 141 (88.1%) |
| Arts, Entertainment & Recreation | 0 (0.0%) | 17 (100.0%) |
| Accommodation & Food Services | 76 (54.3%) | 64 (45.7%) |
| Public Administration | 28 (100.0%) | 0 (0.0%) |
| Total | 292 (47.4%) | 324 (52.6%) |
Education in Prudenville
School Enrollment in Prudenville
The most common levels of schooling among the 261 students in Prudenville are middle school (110 | 42.1%), high school (76 | 29.1%), and college / undergraduate (71 | 27.2%).
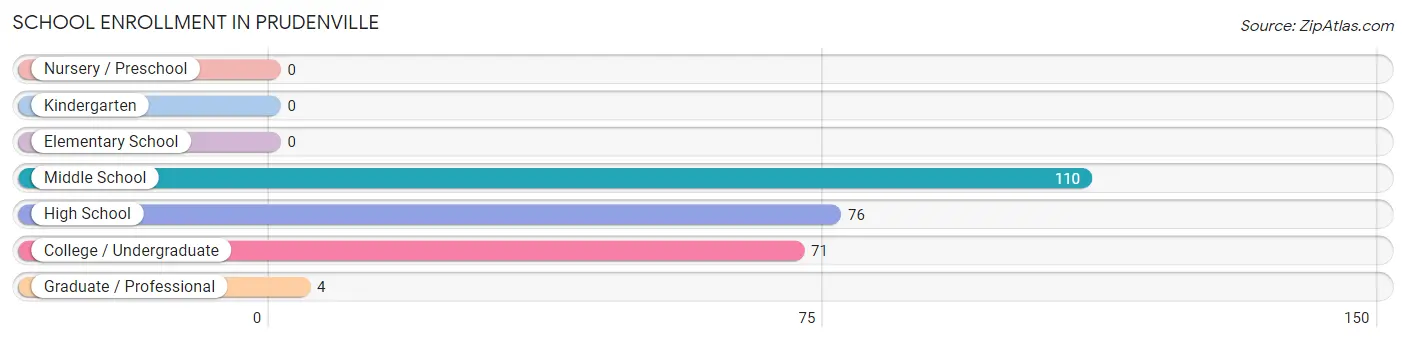
| School Level | # Students | % Students |
| Nursery / Preschool | 0 | 0.0% |
| Kindergarten | 0 | 0.0% |
| Elementary School | 0 | 0.0% |
| Middle School | 110 | 42.1% |
| High School | 76 | 29.1% |
| College / Undergraduate | 71 | 27.2% |
| Graduate / Professional | 4 | 1.5% |
| Total | 261 | 100.0% |
School Enrollment by Age by Funding Source in Prudenville
Out of a total of 261 students who are enrolled in schools in Prudenville, 14 (5.4%) attend a private institution, while the remaining 247 (94.6%) are enrolled in public schools. The age group of 20 to 24 year olds has the highest likelihood of being enrolled in private schools, with 14 (20.6% in the age bracket) enrolled. Conversely, the age group of 10 to 14 year olds has the lowest likelihood of being enrolled in a private school, with 110 (100.0% in the age bracket) attending a public institution.
| Age Bracket | Public School | Private School |
| 3 to 4 Year Olds | 0 (0.0%) | 0 (0.0%) |
| 5 to 9 Year Old | 0 (0.0%) | 0 (0.0%) |
| 10 to 14 Year Olds | 110 (100.0%) | 0 (0.0%) |
| 15 to 17 Year Olds | 41 (100.0%) | 0 (0.0%) |
| 18 to 19 Year Olds | 38 (100.0%) | 0 (0.0%) |
| 20 to 24 Year Olds | 54 (79.4%) | 14 (20.6%) |
| 25 to 34 Year Olds | 0 (0.0%) | 0 (0.0%) |
| 35 Years and over | 4 (100.0%) | 0 (0.0%) |
| Total | 247 (94.6%) | 14 (5.4%) |
Educational Attainment by Field of Study in Prudenville
Science & technology (42 | 20.2%), education (39 | 18.8%), business (37 | 17.8%), engineering (27 | 13.0%), and arts & humanities (20 | 9.6%) are the most common fields of study among 208 individuals in Prudenville who have obtained a bachelor's degree or higher.
| Field of Study | # Graduates | % Graduates |
| Computers & Mathematics | 6 | 2.9% |
| Bio, Nature & Agricultural | 0 | 0.0% |
| Physical & Health Sciences | 10 | 4.8% |
| Psychology | 0 | 0.0% |
| Social Sciences | 10 | 4.8% |
| Engineering | 27 | 13.0% |
| Multidisciplinary Studies | 0 | 0.0% |
| Science & Technology | 42 | 20.2% |
| Business | 37 | 17.8% |
| Education | 39 | 18.8% |
| Literature & Languages | 0 | 0.0% |
| Liberal Arts & History | 9 | 4.3% |
| Visual & Performing Arts | 0 | 0.0% |
| Communications | 8 | 3.8% |
| Arts & Humanities | 20 | 9.6% |
| Total | 208 | 100.0% |
Transportation & Commute in Prudenville
Vehicle Availability by Sex in Prudenville
The most prevalent vehicle ownership categories in Prudenville are males with 1 vehicle (119, accounting for 40.7%) and females with 1 vehicle (47, making up 45.4%).
| Vehicles Available | Male | Female |
| No Vehicle | 11 (3.8%) | 0 (0.0%) |
| 1 Vehicle | 119 (40.7%) | 47 (17.9%) |
| 2 Vehicles | 61 (20.9%) | 80 (30.5%) |
| 3 Vehicles | 50 (17.1%) | 93 (35.5%) |
| 4 Vehicles | 21 (7.2%) | 38 (14.5%) |
| 5 or more Vehicles | 30 (10.3%) | 4 (1.5%) |
| Total | 292 (100.0%) | 262 (100.0%) |
Commute Time in Prudenville
The most frequently occuring commute durations in Prudenville are less than 5 minutes (170 commuters, 35.9%), 10 to 14 minutes (102 commuters, 21.5%), and 5 to 9 minutes (74 commuters, 15.6%).
| Commute Time | # Commuters | % Commuters |
| Less than 5 Minutes | 170 | 35.9% |
| 5 to 9 Minutes | 74 | 15.6% |
| 10 to 14 Minutes | 102 | 21.5% |
| 15 to 19 Minutes | 56 | 11.8% |
| 20 to 24 Minutes | 36 | 7.6% |
| 25 to 29 Minutes | 23 | 4.9% |
| 30 to 34 Minutes | 9 | 1.9% |
| 35 to 39 Minutes | 0 | 0.0% |
| 40 to 44 Minutes | 0 | 0.0% |
| 45 to 59 Minutes | 0 | 0.0% |
| 60 to 89 Minutes | 4 | 0.8% |
| 90 or more Minutes | 0 | 0.0% |
Commute Time by Sex in Prudenville
The most common commute times in Prudenville are less than 5 minutes (88 commuters, 36.2%) for males and less than 5 minutes (82 commuters, 35.5%) for females.
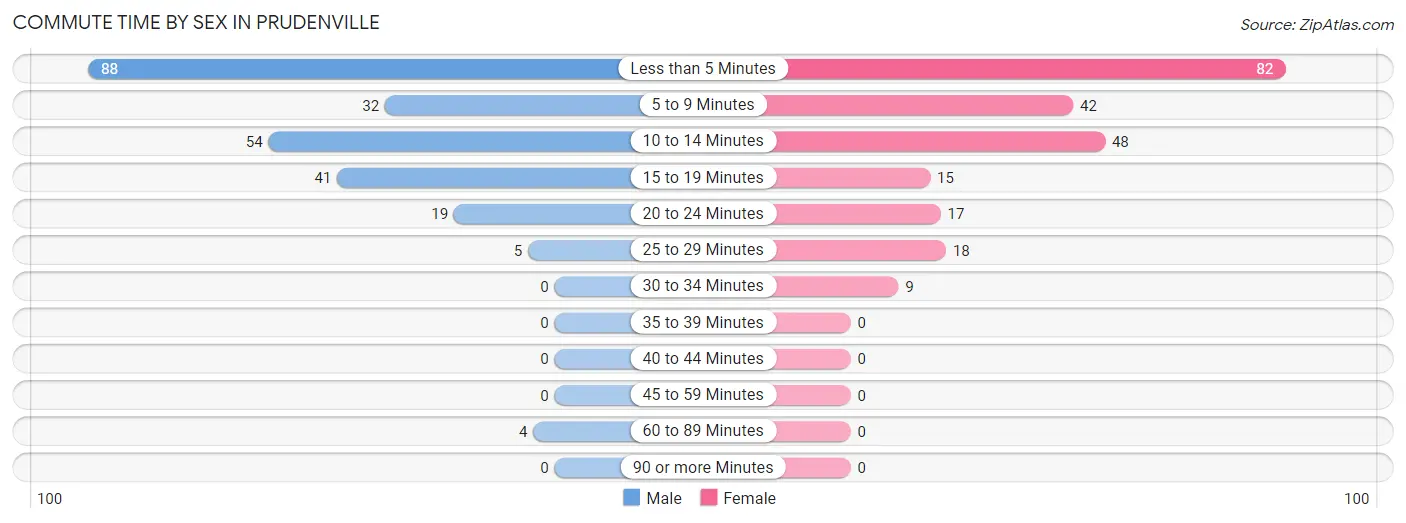
| Commute Time | Male | Female |
| Less than 5 Minutes | 88 (36.2%) | 82 (35.5%) |
| 5 to 9 Minutes | 32 (13.2%) | 42 (18.2%) |
| 10 to 14 Minutes | 54 (22.2%) | 48 (20.8%) |
| 15 to 19 Minutes | 41 (16.9%) | 15 (6.5%) |
| 20 to 24 Minutes | 19 (7.8%) | 17 (7.4%) |
| 25 to 29 Minutes | 5 (2.1%) | 18 (7.8%) |
| 30 to 34 Minutes | 0 (0.0%) | 9 (3.9%) |
| 35 to 39 Minutes | 0 (0.0%) | 0 (0.0%) |
| 40 to 44 Minutes | 0 (0.0%) | 0 (0.0%) |
| 45 to 59 Minutes | 0 (0.0%) | 0 (0.0%) |
| 60 to 89 Minutes | 4 (1.7%) | 0 (0.0%) |
| 90 or more Minutes | 0 (0.0%) | 0 (0.0%) |
Time of Departure to Work by Sex in Prudenville
The most frequent times of departure to work in Prudenville are 8:00 AM to 8:29 AM (57, 23.5%) for males and 8:30 AM to 8:59 AM (55, 23.8%) for females.
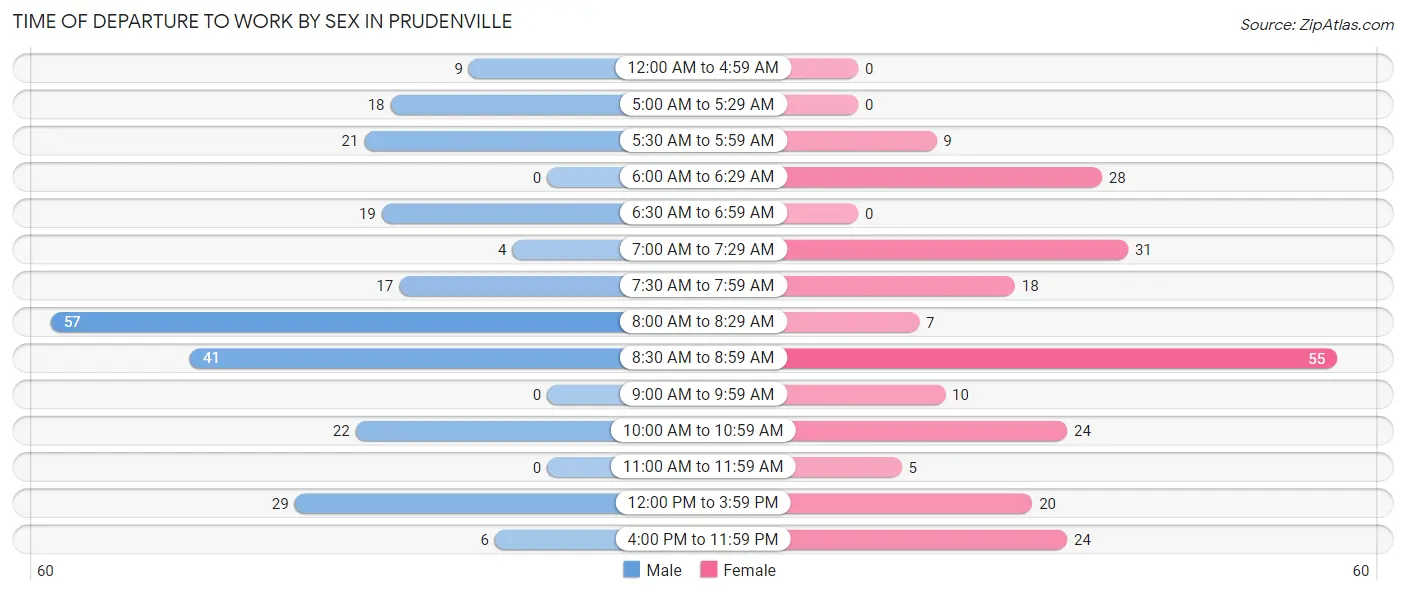
| Time of Departure | Male | Female |
| 12:00 AM to 4:59 AM | 9 (3.7%) | 0 (0.0%) |
| 5:00 AM to 5:29 AM | 18 (7.4%) | 0 (0.0%) |
| 5:30 AM to 5:59 AM | 21 (8.6%) | 9 (3.9%) |
| 6:00 AM to 6:29 AM | 0 (0.0%) | 28 (12.1%) |
| 6:30 AM to 6:59 AM | 19 (7.8%) | 0 (0.0%) |
| 7:00 AM to 7:29 AM | 4 (1.7%) | 31 (13.4%) |
| 7:30 AM to 7:59 AM | 17 (7.0%) | 18 (7.8%) |
| 8:00 AM to 8:29 AM | 57 (23.5%) | 7 (3.0%) |
| 8:30 AM to 8:59 AM | 41 (16.9%) | 55 (23.8%) |
| 9:00 AM to 9:59 AM | 0 (0.0%) | 10 (4.3%) |
| 10:00 AM to 10:59 AM | 22 (9.0%) | 24 (10.4%) |
| 11:00 AM to 11:59 AM | 0 (0.0%) | 5 (2.2%) |
| 12:00 PM to 3:59 PM | 29 (11.9%) | 20 (8.7%) |
| 4:00 PM to 11:59 PM | 6 (2.5%) | 24 (10.4%) |
| Total | 243 (100.0%) | 231 (100.0%) |
Housing Occupancy in Prudenville
Occupancy by Ownership in Prudenville
Of the total 675 dwellings in Prudenville, owner-occupied units account for 502 (74.4%), while renter-occupied units make up 173 (25.6%).
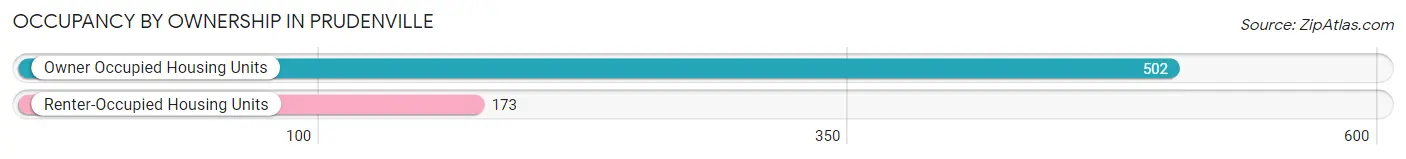
| Occupancy | # Housing Units | % Housing Units |
| Owner Occupied Housing Units | 502 | 74.4% |
| Renter-Occupied Housing Units | 173 | 25.6% |
| Total Occupied Housing Units | 675 | 100.0% |
Occupancy by Household Size in Prudenville
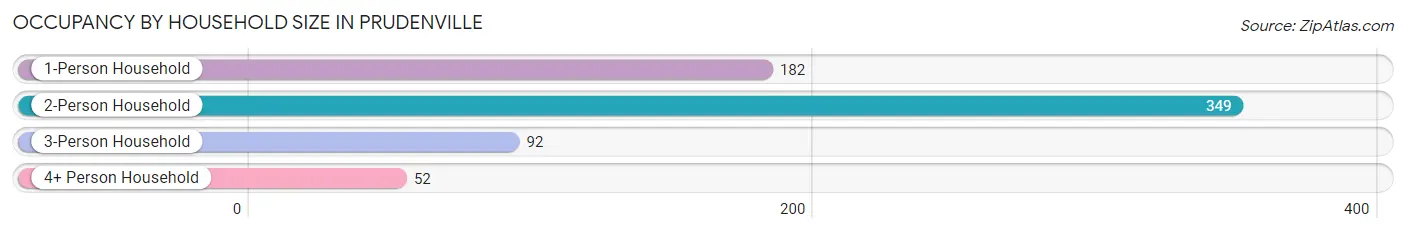
| Household Size | # Housing Units | % Housing Units |
| 1-Person Household | 182 | 27.0% |
| 2-Person Household | 349 | 51.7% |
| 3-Person Household | 92 | 13.6% |
| 4+ Person Household | 52 | 7.7% |
| Total Housing Units | 675 | 100.0% |
Occupancy by Ownership by Household Size in Prudenville
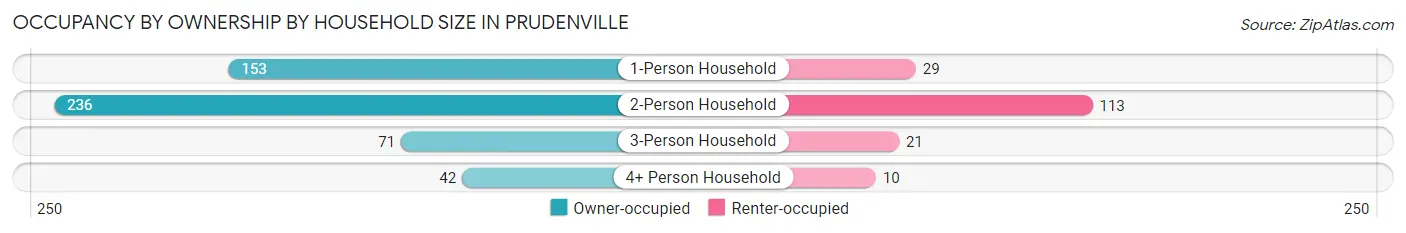
| Household Size | Owner-occupied | Renter-occupied |
| 1-Person Household | 153 (84.1%) | 29 (15.9%) |
| 2-Person Household | 236 (67.6%) | 113 (32.4%) |
| 3-Person Household | 71 (77.2%) | 21 (22.8%) |
| 4+ Person Household | 42 (80.8%) | 10 (19.2%) |
| Total Housing Units | 502 (74.4%) | 173 (25.6%) |
Occupancy by Educational Attainment in Prudenville
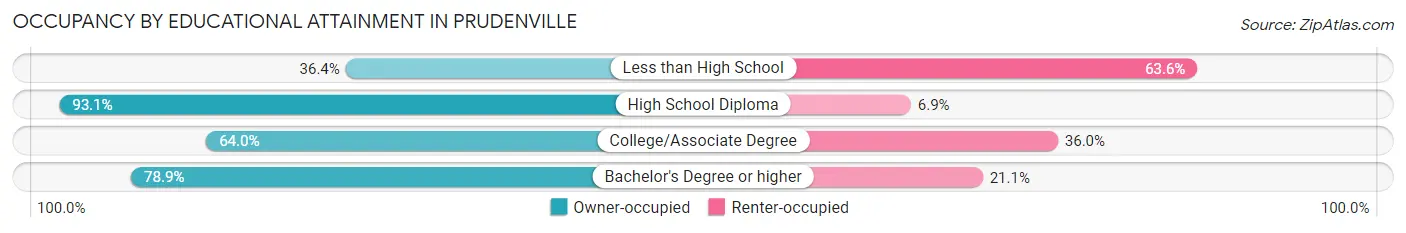
| Household Size | Owner-occupied | Renter-occupied |
| Less than High School | 8 (36.4%) | 14 (63.6%) |
| High School Diploma | 176 (93.1%) | 13 (6.9%) |
| College/Associate Degree | 206 (64.0%) | 116 (36.0%) |
| Bachelor's Degree or higher | 112 (78.9%) | 30 (21.1%) |
Occupancy by Age of Householder in Prudenville
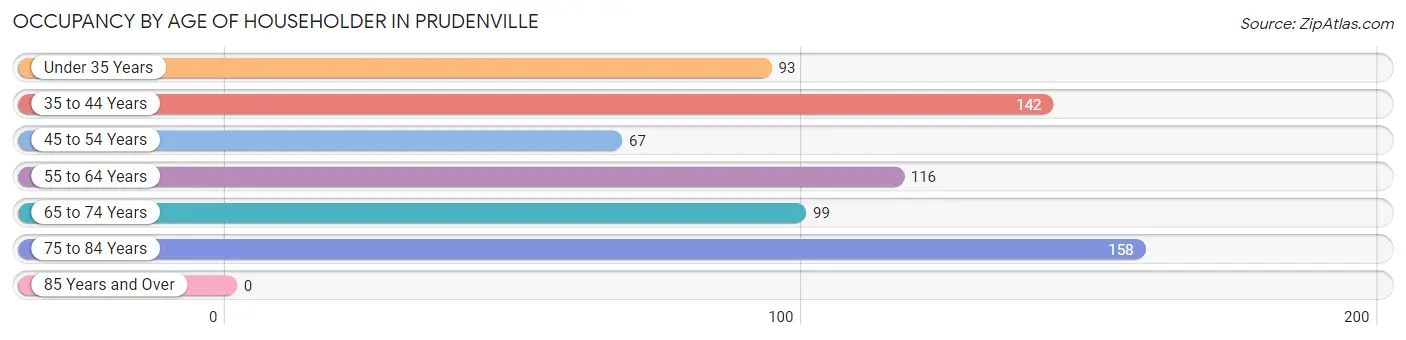
| Age Bracket | # Households | % Households |
| Under 35 Years | 93 | 13.8% |
| 35 to 44 Years | 142 | 21.0% |
| 45 to 54 Years | 67 | 9.9% |
| 55 to 64 Years | 116 | 17.2% |
| 65 to 74 Years | 99 | 14.7% |
| 75 to 84 Years | 158 | 23.4% |
| 85 Years and Over | 0 | 0.0% |
| Total | 675 | 100.0% |
Housing Finances in Prudenville
Median Income by Occupancy in Prudenville
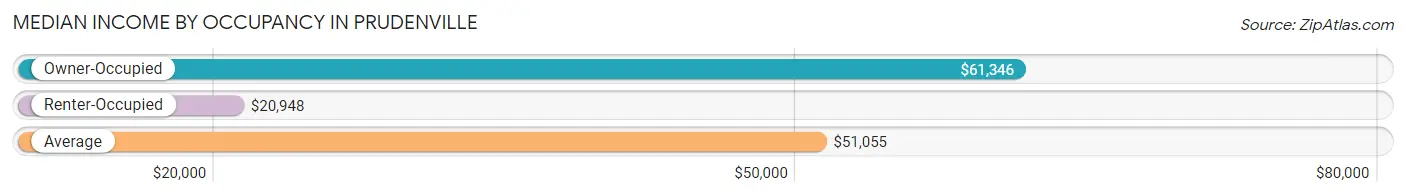
| Occupancy Type | # Households | Median Income |
| Owner-Occupied | 502 (74.4%) | $61,346 |
| Renter-Occupied | 173 (25.6%) | $20,948 |
| Average | 675 (100.0%) | $51,055 |
Occupancy by Householder Income Bracket in Prudenville
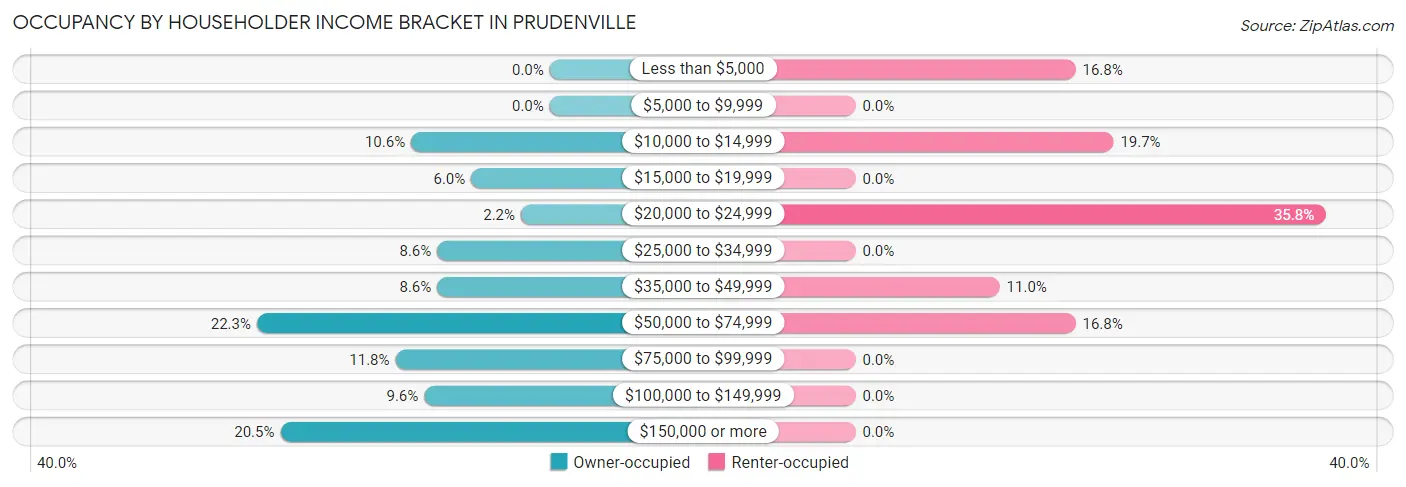
| Income Bracket | Owner-occupied | Renter-occupied |
| Less than $5,000 | 0 (0.0%) | 29 (16.8%) |
| $5,000 to $9,999 | 0 (0.0%) | 0 (0.0%) |
| $10,000 to $14,999 | 53 (10.6%) | 34 (19.7%) |
| $15,000 to $19,999 | 30 (6.0%) | 0 (0.0%) |
| $20,000 to $24,999 | 11 (2.2%) | 62 (35.8%) |
| $25,000 to $34,999 | 43 (8.6%) | 0 (0.0%) |
| $35,000 to $49,999 | 43 (8.6%) | 19 (11.0%) |
| $50,000 to $74,999 | 112 (22.3%) | 29 (16.8%) |
| $75,000 to $99,999 | 59 (11.7%) | 0 (0.0%) |
| $100,000 to $149,999 | 48 (9.6%) | 0 (0.0%) |
| $150,000 or more | 103 (20.5%) | 0 (0.0%) |
| Total | 502 (100.0%) | 173 (100.0%) |
Monthly Housing Cost Tiers in Prudenville
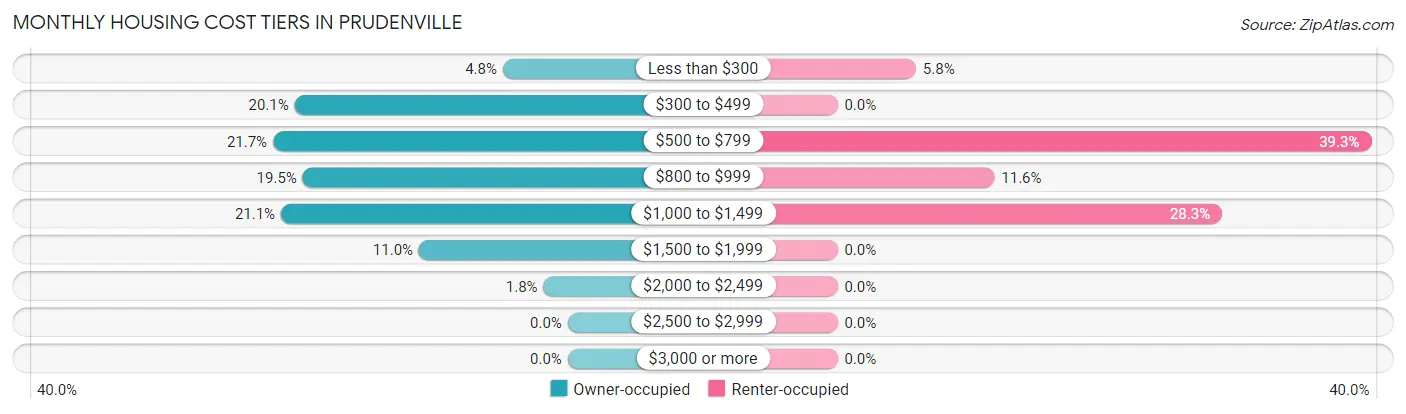
| Monthly Cost | Owner-occupied | Renter-occupied |
| Less than $300 | 24 (4.8%) | 10 (5.8%) |
| $300 to $499 | 101 (20.1%) | 0 (0.0%) |
| $500 to $799 | 109 (21.7%) | 68 (39.3%) |
| $800 to $999 | 98 (19.5%) | 20 (11.6%) |
| $1,000 to $1,499 | 106 (21.1%) | 49 (28.3%) |
| $1,500 to $1,999 | 55 (11.0%) | 0 (0.0%) |
| $2,000 to $2,499 | 9 (1.8%) | 0 (0.0%) |
| $2,500 to $2,999 | 0 (0.0%) | 0 (0.0%) |
| $3,000 or more | 0 (0.0%) | 0 (0.0%) |
| Total | 502 (100.0%) | 173 (100.0%) |
Physical Housing Characteristics in Prudenville
Housing Structures in Prudenville
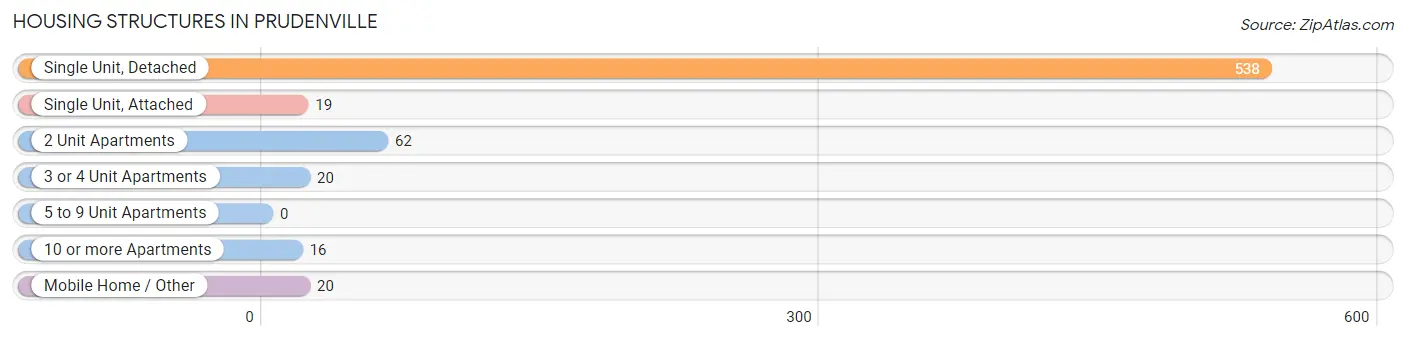
| Structure Type | # Housing Units | % Housing Units |
| Single Unit, Detached | 538 | 79.7% |
| Single Unit, Attached | 19 | 2.8% |
| 2 Unit Apartments | 62 | 9.2% |
| 3 or 4 Unit Apartments | 20 | 3.0% |
| 5 to 9 Unit Apartments | 0 | 0.0% |
| 10 or more Apartments | 16 | 2.4% |
| Mobile Home / Other | 20 | 3.0% |
| Total | 675 | 100.0% |
Housing Structures by Occupancy in Prudenville
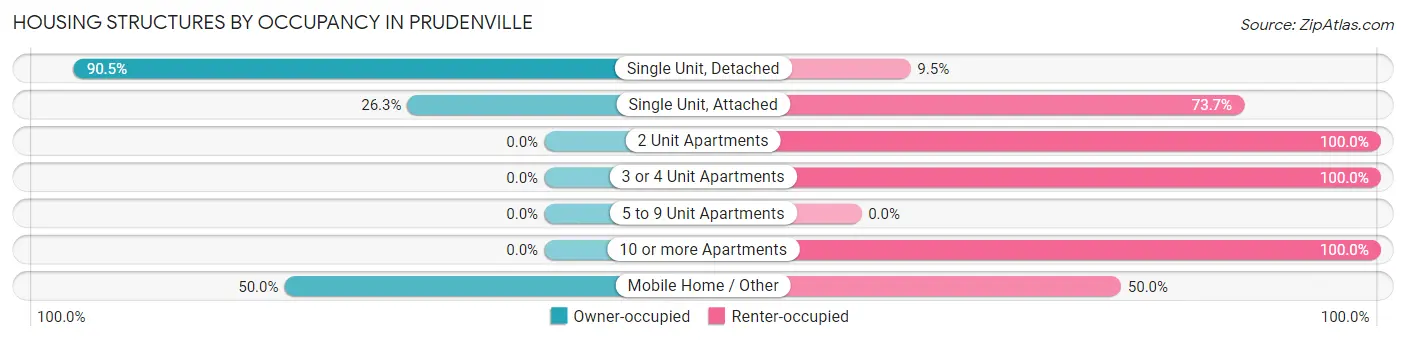
| Structure Type | Owner-occupied | Renter-occupied |
| Single Unit, Detached | 487 (90.5%) | 51 (9.5%) |
| Single Unit, Attached | 5 (26.3%) | 14 (73.7%) |
| 2 Unit Apartments | 0 (0.0%) | 62 (100.0%) |
| 3 or 4 Unit Apartments | 0 (0.0%) | 20 (100.0%) |
| 5 to 9 Unit Apartments | 0 (0.0%) | 0 (0.0%) |
| 10 or more Apartments | 0 (0.0%) | 16 (100.0%) |
| Mobile Home / Other | 10 (50.0%) | 10 (50.0%) |
| Total | 502 (74.4%) | 173 (25.6%) |
Housing Structures by Number of Rooms in Prudenville
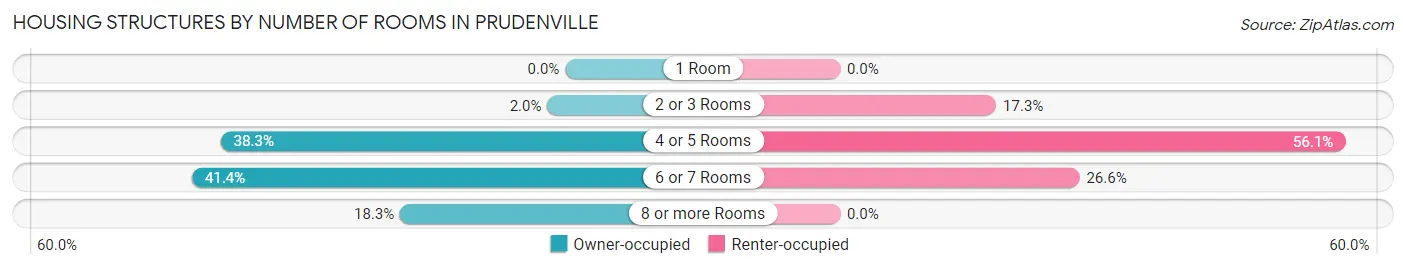
| Number of Rooms | Owner-occupied | Renter-occupied |
| 1 Room | 0 (0.0%) | 0 (0.0%) |
| 2 or 3 Rooms | 10 (2.0%) | 30 (17.3%) |
| 4 or 5 Rooms | 192 (38.3%) | 97 (56.1%) |
| 6 or 7 Rooms | 208 (41.4%) | 46 (26.6%) |
| 8 or more Rooms | 92 (18.3%) | 0 (0.0%) |
| Total | 502 (100.0%) | 173 (100.0%) |
Housing Structure by Heating Type in Prudenville
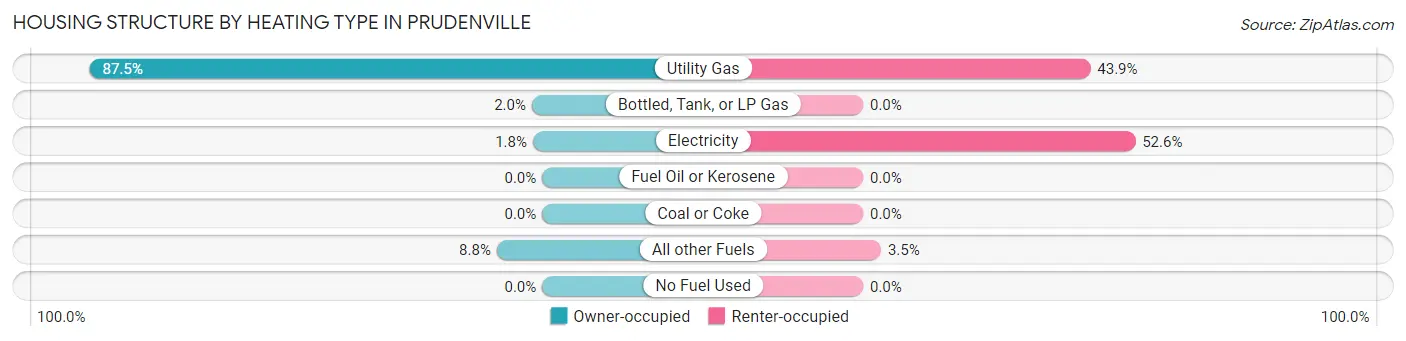
| Heating Type | Owner-occupied | Renter-occupied |
| Utility Gas | 439 (87.5%) | 76 (43.9%) |
| Bottled, Tank, or LP Gas | 10 (2.0%) | 0 (0.0%) |
| Electricity | 9 (1.8%) | 91 (52.6%) |
| Fuel Oil or Kerosene | 0 (0.0%) | 0 (0.0%) |
| Coal or Coke | 0 (0.0%) | 0 (0.0%) |
| All other Fuels | 44 (8.8%) | 6 (3.5%) |
| No Fuel Used | 0 (0.0%) | 0 (0.0%) |
| Total | 502 (100.0%) | 173 (100.0%) |
Household Vehicle Usage in Prudenville
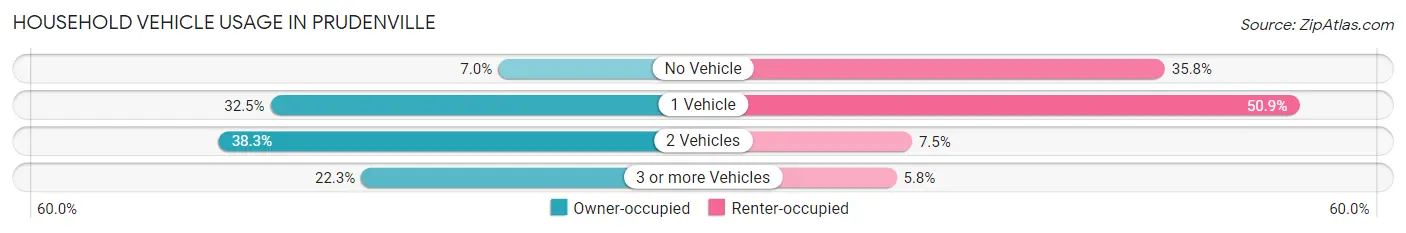
| Vehicles per Household | Owner-occupied | Renter-occupied |
| No Vehicle | 35 (7.0%) | 62 (35.8%) |
| 1 Vehicle | 163 (32.5%) | 88 (50.9%) |
| 2 Vehicles | 192 (38.3%) | 13 (7.5%) |
| 3 or more Vehicles | 112 (22.3%) | 10 (5.8%) |
| Total | 502 (100.0%) | 173 (100.0%) |
Real Estate & Mortgages in Prudenville
Real Estate and Mortgage Overview in Prudenville
| Characteristic | Without Mortgage | With Mortgage |
| Housing Units | 227 | 275 |
| Median Property Value | $180,600 | $160,900 |
| Median Household Income | $41,902 | $59 |
| Monthly Housing Costs | $459 | $0 |
| Real Estate Taxes | $1,950 | $0 |
Property Value by Mortgage Status in Prudenville
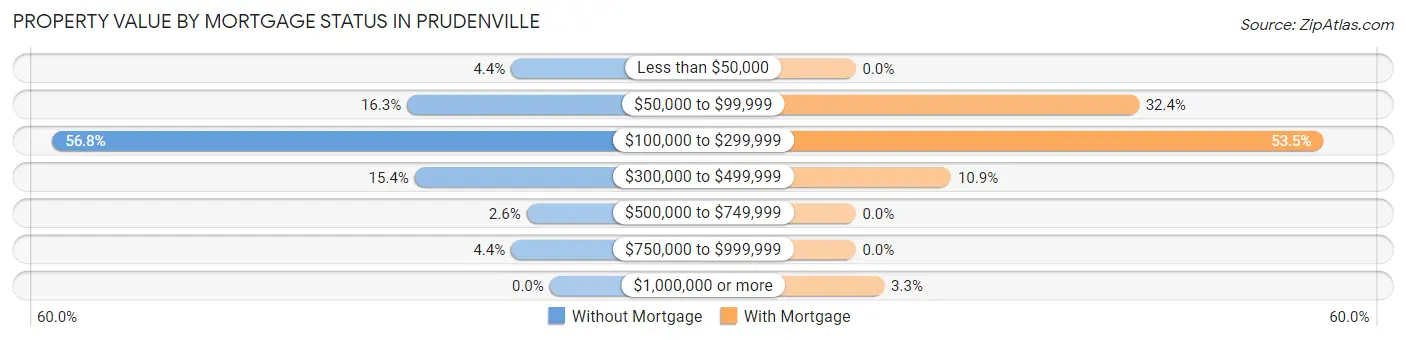
| Property Value | Without Mortgage | With Mortgage |
| Less than $50,000 | 10 (4.4%) | 0 (0.0%) |
| $50,000 to $99,999 | 37 (16.3%) | 89 (32.4%) |
| $100,000 to $299,999 | 129 (56.8%) | 147 (53.4%) |
| $300,000 to $499,999 | 35 (15.4%) | 30 (10.9%) |
| $500,000 to $749,999 | 6 (2.6%) | 0 (0.0%) |
| $750,000 to $999,999 | 10 (4.4%) | 0 (0.0%) |
| $1,000,000 or more | 0 (0.0%) | 9 (3.3%) |
| Total | 227 (100.0%) | 275 (100.0%) |
Household Income by Mortgage Status in Prudenville
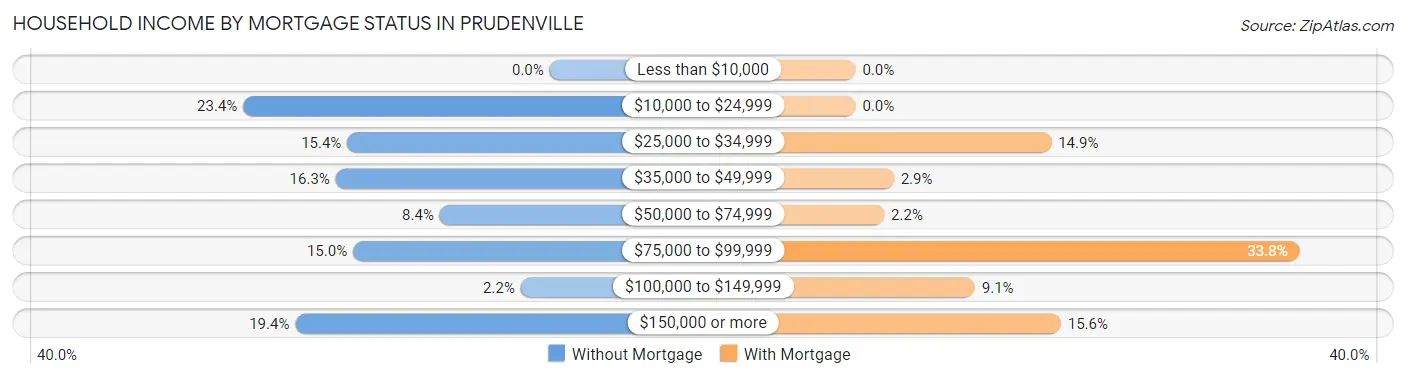
| Household Income | Without Mortgage | With Mortgage |
| Less than $10,000 | 0 (0.0%) | 0 (0.0%) |
| $10,000 to $24,999 | 53 (23.4%) | 0 (0.0%) |
| $25,000 to $34,999 | 35 (15.4%) | 41 (14.9%) |
| $35,000 to $49,999 | 37 (16.3%) | 8 (2.9%) |
| $50,000 to $74,999 | 19 (8.4%) | 6 (2.2%) |
| $75,000 to $99,999 | 34 (15.0%) | 93 (33.8%) |
| $100,000 to $149,999 | 5 (2.2%) | 25 (9.1%) |
| $150,000 or more | 44 (19.4%) | 43 (15.6%) |
| Total | 227 (100.0%) | 275 (100.0%) |
Property Value to Household Income Ratio in Prudenville
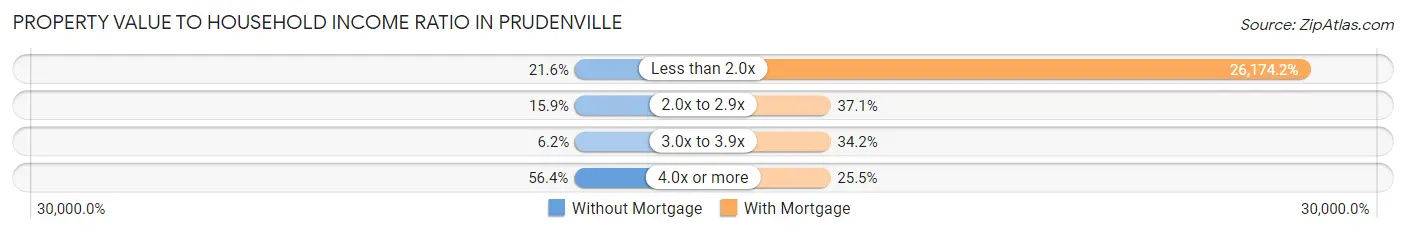
| Value-to-Income Ratio | Without Mortgage | With Mortgage |
| Less than 2.0x | 49 (21.6%) | 71,979 (26,174.2%) |
| 2.0x to 2.9x | 36 (15.9%) | 102 (37.1%) |
| 3.0x to 3.9x | 14 (6.2%) | 94 (34.2%) |
| 4.0x or more | 128 (56.4%) | 70 (25.5%) |
| Total | 227 (100.0%) | 275 (100.0%) |
Real Estate Taxes by Mortgage Status in Prudenville
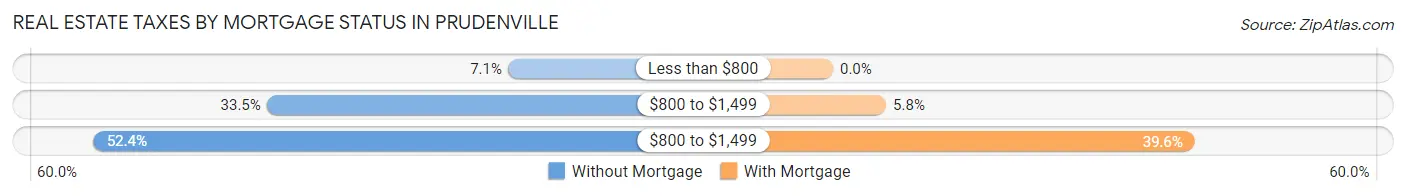
| Property Taxes | Without Mortgage | With Mortgage |
| Less than $800 | 16 (7.0%) | 0 (0.0%) |
| $800 to $1,499 | 76 (33.5%) | 16 (5.8%) |
| $800 to $1,499 | 119 (52.4%) | 109 (39.6%) |
| Total | 227 (100.0%) | 275 (100.0%) |
Health & Disability in Prudenville
Health Insurance Coverage by Age in Prudenville
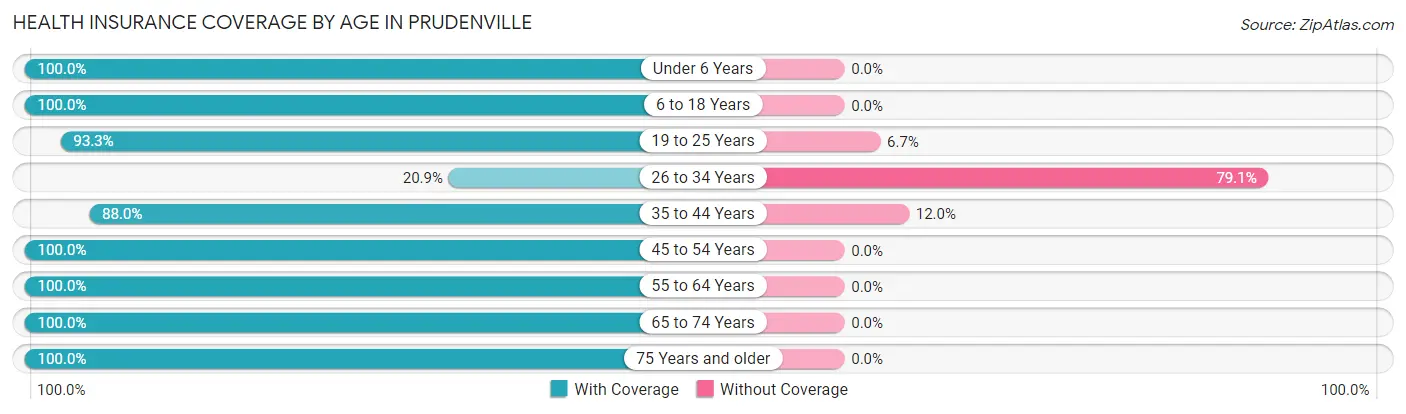
| Age Bracket | With Coverage | Without Coverage |
| Under 6 Years | 60 (100.0%) | 0 (0.0%) |
| 6 to 18 Years | 172 (100.0%) | 0 (0.0%) |
| 19 to 25 Years | 154 (93.3%) | 11 (6.7%) |
| 26 to 34 Years | 14 (20.9%) | 53 (79.1%) |
| 35 to 44 Years | 212 (88.0%) | 29 (12.0%) |
| 45 to 54 Years | 122 (100.0%) | 0 (0.0%) |
| 55 to 64 Years | 192 (100.0%) | 0 (0.0%) |
| 65 to 74 Years | 183 (100.0%) | 0 (0.0%) |
| 75 Years and older | 210 (100.0%) | 0 (0.0%) |
| Total | 1,319 (93.4%) | 93 (6.6%) |
Health Insurance Coverage by Citizenship Status in Prudenville
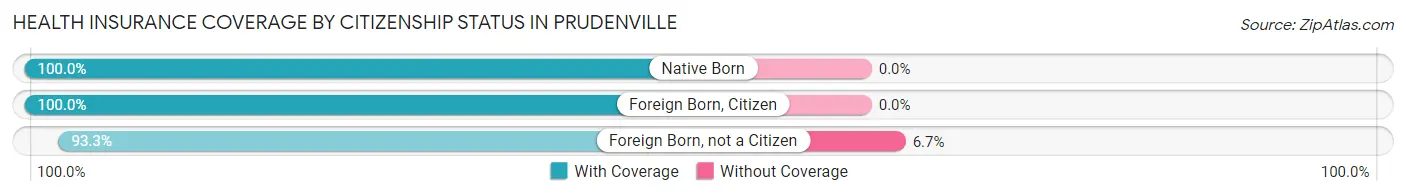
| Citizenship Status | With Coverage | Without Coverage |
| Native Born | 60 (100.0%) | 0 (0.0%) |
| Foreign Born, Citizen | 172 (100.0%) | 0 (0.0%) |
| Foreign Born, not a Citizen | 154 (93.3%) | 11 (6.7%) |
Health Insurance Coverage by Household Income in Prudenville
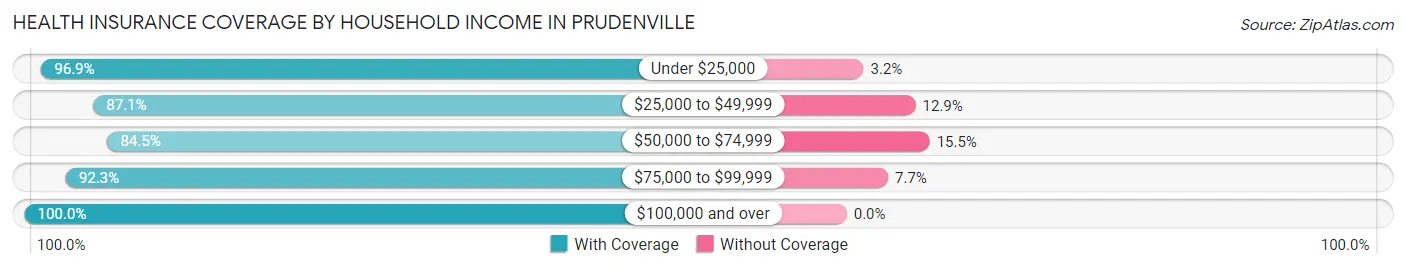
| Household Income | With Coverage | Without Coverage |
| Under $25,000 | 338 (96.9%) | 11 (3.2%) |
| $25,000 to $49,999 | 196 (87.1%) | 29 (12.9%) |
| $50,000 to $74,999 | 223 (84.5%) | 41 (15.5%) |
| $75,000 to $99,999 | 143 (92.3%) | 12 (7.7%) |
| $100,000 and over | 419 (100.0%) | 0 (0.0%) |
Public vs Private Health Insurance Coverage by Age in Prudenville
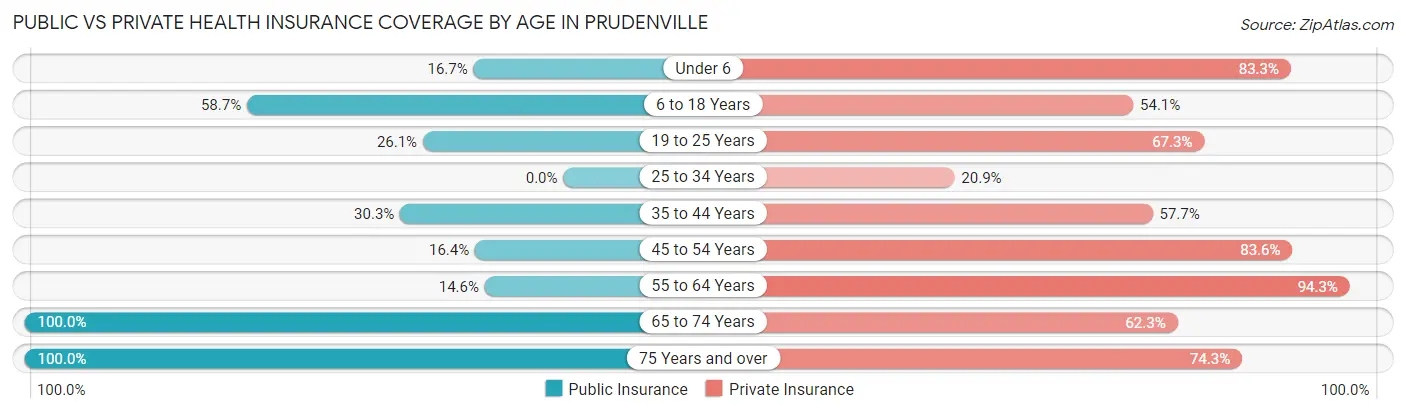
| Age Bracket | Public Insurance | Private Insurance |
| Under 6 | 10 (16.7%) | 50 (83.3%) |
| 6 to 18 Years | 101 (58.7%) | 93 (54.1%) |
| 19 to 25 Years | 43 (26.1%) | 111 (67.3%) |
| 25 to 34 Years | 0 (0.0%) | 14 (20.9%) |
| 35 to 44 Years | 73 (30.3%) | 139 (57.7%) |
| 45 to 54 Years | 20 (16.4%) | 102 (83.6%) |
| 55 to 64 Years | 28 (14.6%) | 181 (94.3%) |
| 65 to 74 Years | 183 (100.0%) | 114 (62.3%) |
| 75 Years and over | 210 (100.0%) | 156 (74.3%) |
| Total | 668 (47.3%) | 960 (68.0%) |
Disability Status by Sex by Age in Prudenville
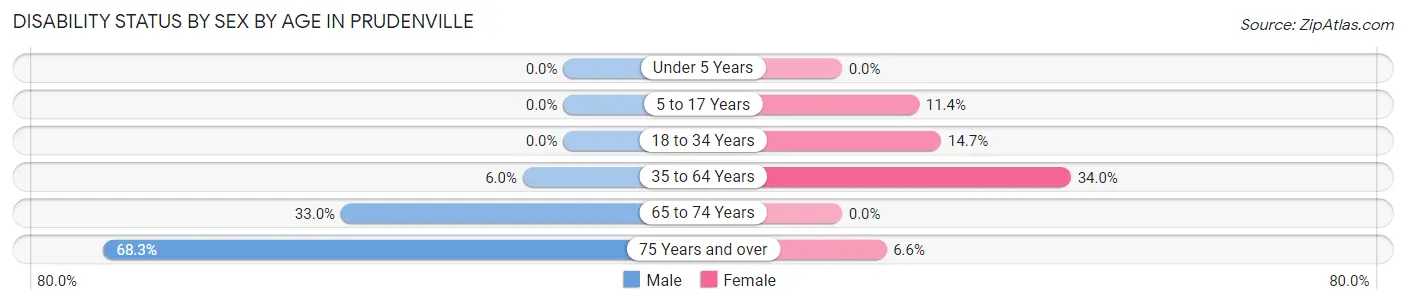
| Age Bracket | Male | Female |
| Under 5 Years | 0 (0.0%) | 0 (0.0%) |
| 5 to 17 Years | 0 (0.0%) | 12 (11.4%) |
| 18 to 34 Years | 0 (0.0%) | 14 (14.7%) |
| 35 to 64 Years | 15 (6.0%) | 104 (34.0%) |
| 65 to 74 Years | 36 (33.0%) | 0 (0.0%) |
| 75 Years and over | 71 (68.3%) | 7 (6.6%) |
Disability Class by Sex by Age in Prudenville
Disability Class: Hearing Difficulty
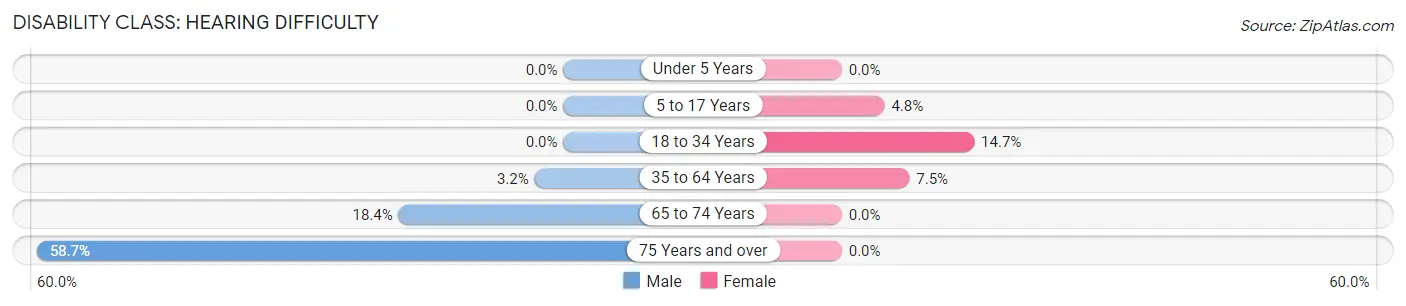
| Age Bracket | Male | Female |
| Under 5 Years | 0 (0.0%) | 0 (0.0%) |
| 5 to 17 Years | 0 (0.0%) | 5 (4.8%) |
| 18 to 34 Years | 0 (0.0%) | 14 (14.7%) |
| 35 to 64 Years | 8 (3.2%) | 23 (7.5%) |
| 65 to 74 Years | 20 (18.3%) | 0 (0.0%) |
| 75 Years and over | 61 (58.7%) | 0 (0.0%) |
Disability Class: Vision Difficulty
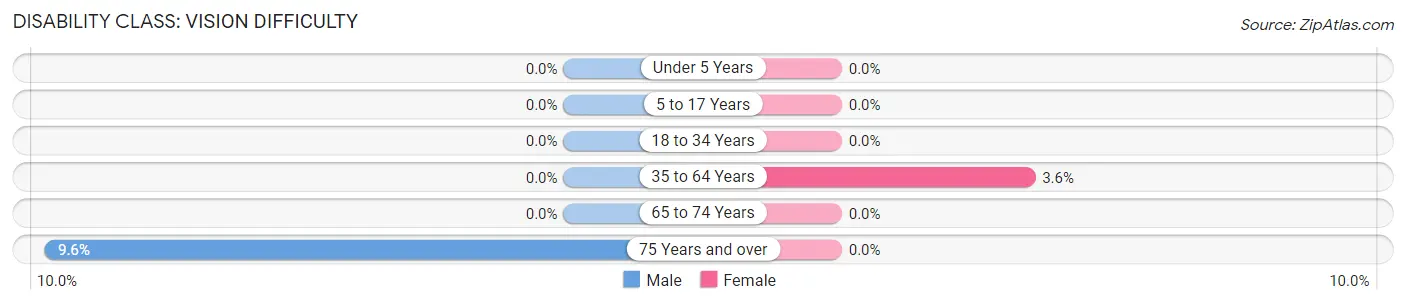
| Age Bracket | Male | Female |
| Under 5 Years | 0 (0.0%) | 0 (0.0%) |
| 5 to 17 Years | 0 (0.0%) | 0 (0.0%) |
| 18 to 34 Years | 0 (0.0%) | 0 (0.0%) |
| 35 to 64 Years | 0 (0.0%) | 11 (3.6%) |
| 65 to 74 Years | 0 (0.0%) | 0 (0.0%) |
| 75 Years and over | 10 (9.6%) | 0 (0.0%) |
Disability Class: Cognitive Difficulty
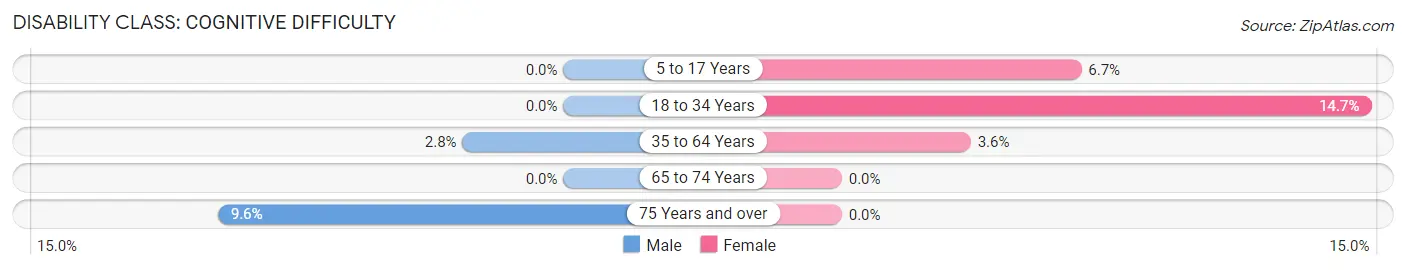
| Age Bracket | Male | Female |
| 5 to 17 Years | 0 (0.0%) | 7 (6.7%) |
| 18 to 34 Years | 0 (0.0%) | 14 (14.7%) |
| 35 to 64 Years | 7 (2.8%) | 11 (3.6%) |
| 65 to 74 Years | 0 (0.0%) | 0 (0.0%) |
| 75 Years and over | 10 (9.6%) | 0 (0.0%) |
Disability Class: Ambulatory Difficulty
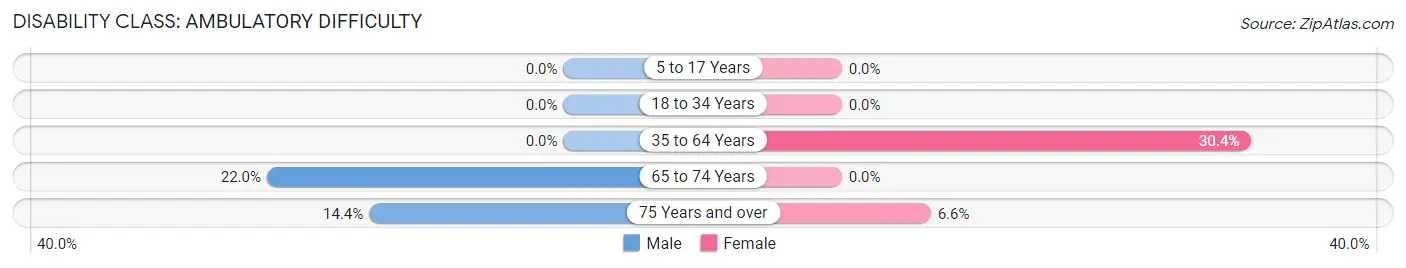
| Age Bracket | Male | Female |
| 5 to 17 Years | 0 (0.0%) | 0 (0.0%) |
| 18 to 34 Years | 0 (0.0%) | 0 (0.0%) |
| 35 to 64 Years | 0 (0.0%) | 93 (30.4%) |
| 65 to 74 Years | 24 (22.0%) | 0 (0.0%) |
| 75 Years and over | 15 (14.4%) | 7 (6.6%) |
Disability Class: Self-Care Difficulty
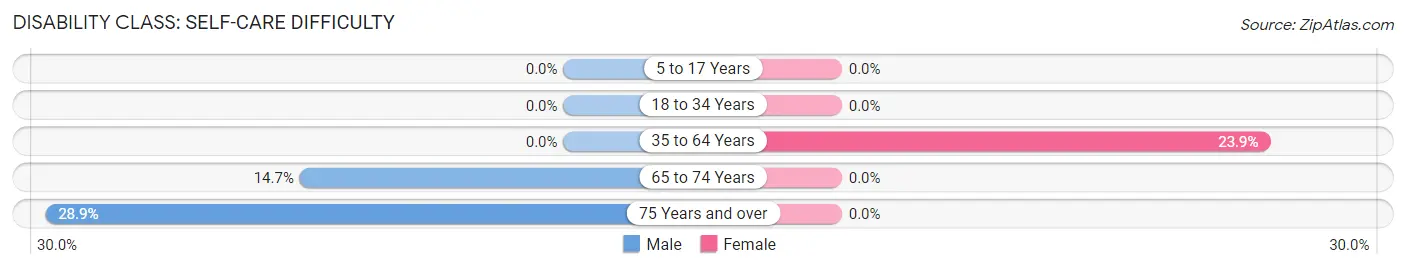
| Age Bracket | Male | Female |
| 5 to 17 Years | 0 (0.0%) | 0 (0.0%) |
| 18 to 34 Years | 0 (0.0%) | 0 (0.0%) |
| 35 to 64 Years | 0 (0.0%) | 73 (23.9%) |
| 65 to 74 Years | 16 (14.7%) | 0 (0.0%) |
| 75 Years and over | 30 (28.8%) | 0 (0.0%) |
Technology Access in Prudenville
Computing Device Access in Prudenville
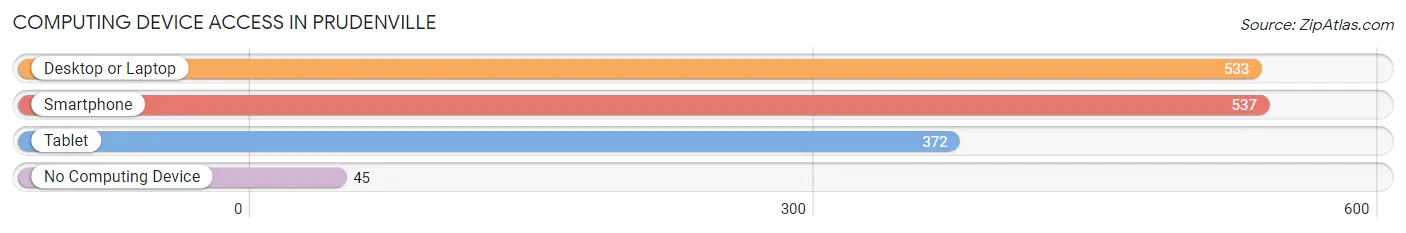
| Device Type | # Households | % Households |
| Desktop or Laptop | 533 | 79.0% |
| Smartphone | 537 | 79.6% |
| Tablet | 372 | 55.1% |
| No Computing Device | 45 | 6.7% |
| Total | 675 | 100.0% |
Internet Access in Prudenville
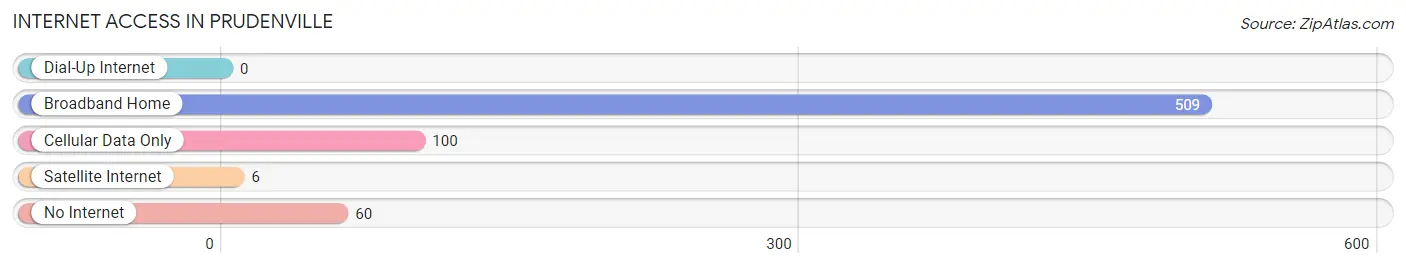
| Internet Type | # Households | % Households |
| Dial-Up Internet | 0 | 0.0% |
| Broadband Home | 509 | 75.4% |
| Cellular Data Only | 100 | 14.8% |
| Satellite Internet | 6 | 0.9% |
| No Internet | 60 | 8.9% |
| Total | 675 | 100.0% |
Prudenville Summary
Prudenville is a small unincorporated community located in Roscommon County, Michigan. It is situated on the south shore of Higgins Lake, a popular recreational destination in the northern part of the state. The community is located within the boundaries of the Houghton Lake State Forest, and is home to a variety of businesses, including a marina, a golf course, and several restaurants.
History
The area that is now Prudenville was first settled in the late 1800s by a group of lumberjacks. The lumberjacks were attracted to the area by the abundance of timber in the surrounding forests. The first permanent settlement in the area was established in 1883, when a group of settlers from Ohio purchased land and began to build homes. The settlement was named Prudenville after one of the settlers, John Pruden.
In the early 1900s, the area began to develop as a resort destination. The Higgins Lake Hotel was built in 1906, and the Prudenville Hotel was built in 1908. The hotels attracted visitors from all over the state, and the area quickly became a popular summer destination.
In the 1920s, the area began to develop as a year-round community. The Prudenville Post Office was established in 1923, and the Prudenville School District was established in 1925. The area continued to grow throughout the 20th century, and today Prudenville is a popular destination for tourists and locals alike.
Geography
Prudenville is located in the northern part of Michigan, in Roscommon County. It is situated on the south shore of Higgins Lake, a popular recreational destination. The community is surrounded by the Houghton Lake State Forest, which covers over 8,000 acres of land. The area is known for its rolling hills, dense forests, and crystal clear lakes.
The climate in Prudenville is typical of the northern part of the state. Summers are warm and humid, with temperatures reaching into the 80s. Winters are cold and snowy, with temperatures often dropping below zero.
Economy
The economy of Prudenville is largely based on tourism. The area is a popular destination for fishing, boating, and other outdoor activities. The community is home to a marina, a golf course, and several restaurants. There are also several small businesses in the area, including a grocery store, a hardware store, and a gas station.
Demographics
As of the 2010 census, the population of Prudenville was 1,845. The racial makeup of the community was 97.3% White, 0.3% African American, 0.2% Native American, 0.3% Asian, 0.1% Pacific Islander, 0.7% from other races, and 1.1% from two or more races. Hispanic or Latino of any race were 2.2% of the population.
The median household income in Prudenville was $37,917, and the median family income was $45,938. The per capita income was $20,945. About 11.2% of families and 14.2% of the population were below the poverty line, including 19.2% of those under age 18 and 8.2% of those age 65 or over.
Common Questions
What is Per Capita Income in Prudenville?
Per Capita income in Prudenville is $35,095.
What is the Median Family Income in Prudenville?
Median Family Income in Prudenville is $62,500.
What is the Median Household income in Prudenville?
Median Household Income in Prudenville is $51,055.
What is Income or Wage Gap in Prudenville?
Income or Wage Gap in Prudenville is 46.6%.
Women in Prudenville earn 53.4 cents for every dollar earned by a man.
What is Inequality or Gini Index in Prudenville?
Inequality or Gini Index in Prudenville is 0.50.
What is the Total Population of Prudenville?
Total Population of Prudenville is 1,412.
What is the Total Male Population of Prudenville?
Total Male Population of Prudenville is 704.
What is the Total Female Population of Prudenville?
Total Female Population of Prudenville is 708.
What is the Ratio of Males per 100 Females in Prudenville?
There are 99.44 Males per 100 Females in Prudenville.
What is the Ratio of Females per 100 Males in Prudenville?
There are 100.57 Females per 100 Males in Prudenville.
What is the Median Population Age in Prudenville?
Median Population Age in Prudenville is 46.0 Years.
What is the Average Family Size in Prudenville
Average Family Size in Prudenville is 2.5 People.
What is the Average Household Size in Prudenville
Average Household Size in Prudenville is 2.1 People.
How Large is the Labor Force in Prudenville?
There are 669 People in the Labor Forcein in Prudenville.
What is the Percentage of People in the Labor Force in Prudenville?
53.9% of People are in the Labor Force in Prudenville.
What is the Unemployment Rate in Prudenville?
Unemployment Rate in Prudenville is 7.9%.