Maple City, MI Map & Demographics
Maple City Map
Maple City Overview
$27,076
PER CAPITA INCOME
$96,250
AVG FAMILY INCOME
$93,333
AVG HOUSEHOLD INCOME
47.3%
WAGE / INCOME GAP [ % ]
52.7¢/ $1
WAGE / INCOME GAP [ $ ]
0.25
INEQUALITY / GINI INDEX
164
TOTAL POPULATION
63
MALE POPULATION
101
FEMALE POPULATION
62.38
MALES / 100 FEMALES
160.32
FEMALES / 100 MALES
49.0
MEDIAN AGE
3.0
AVG FAMILY SIZE
2.7
AVG HOUSEHOLD SIZE
92
LABOR FORCE [ PEOPLE ]
57.9%
PERCENT IN LABOR FORCE
Maple City Zip Codes
Maple City Area Codes
Income in Maple City
Income Overview in Maple City
Per Capita Income in Maple City is $27,076, while median incomes of families and households are $96,250 and $93,333 respectively.
| Characteristic | Number | Measure |
| Per Capita Income | 164 | $27,076 |
| Median Family Income | 41 | $96,250 |
| Mean Family Income | 41 | $81,120 |
| Median Household Income | 60 | $93,333 |
| Mean Household Income | 60 | $71,567 |
| Income Deficit | 41 | $0 |
| Wage / Income Gap (%) | 164 | 47.34% |
| Wage / Income Gap ($) | 164 | 52.66¢ per $1 |
| Gini / Inequality Index | 164 | 0.25 |
Earnings by Sex in Maple City
Average Earnings in Maple City are $24,375, $37,031 for men and $19,500 for women, a difference of 47.3%.
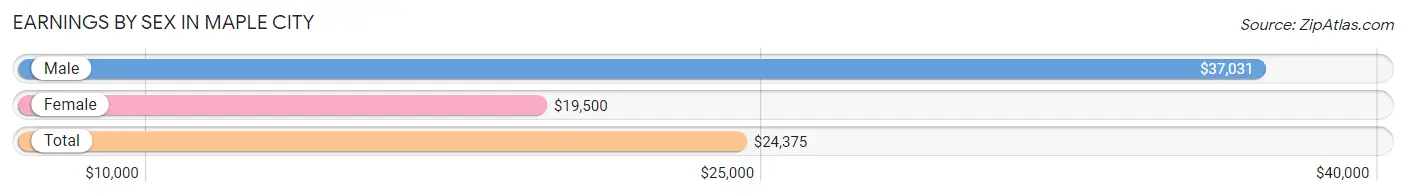
| Sex | Number | Average Earnings |
| Male | 53 (55.8%) | $37,031 |
| Female | 42 (44.2%) | $19,500 |
| Total | 95 (100.0%) | $24,375 |
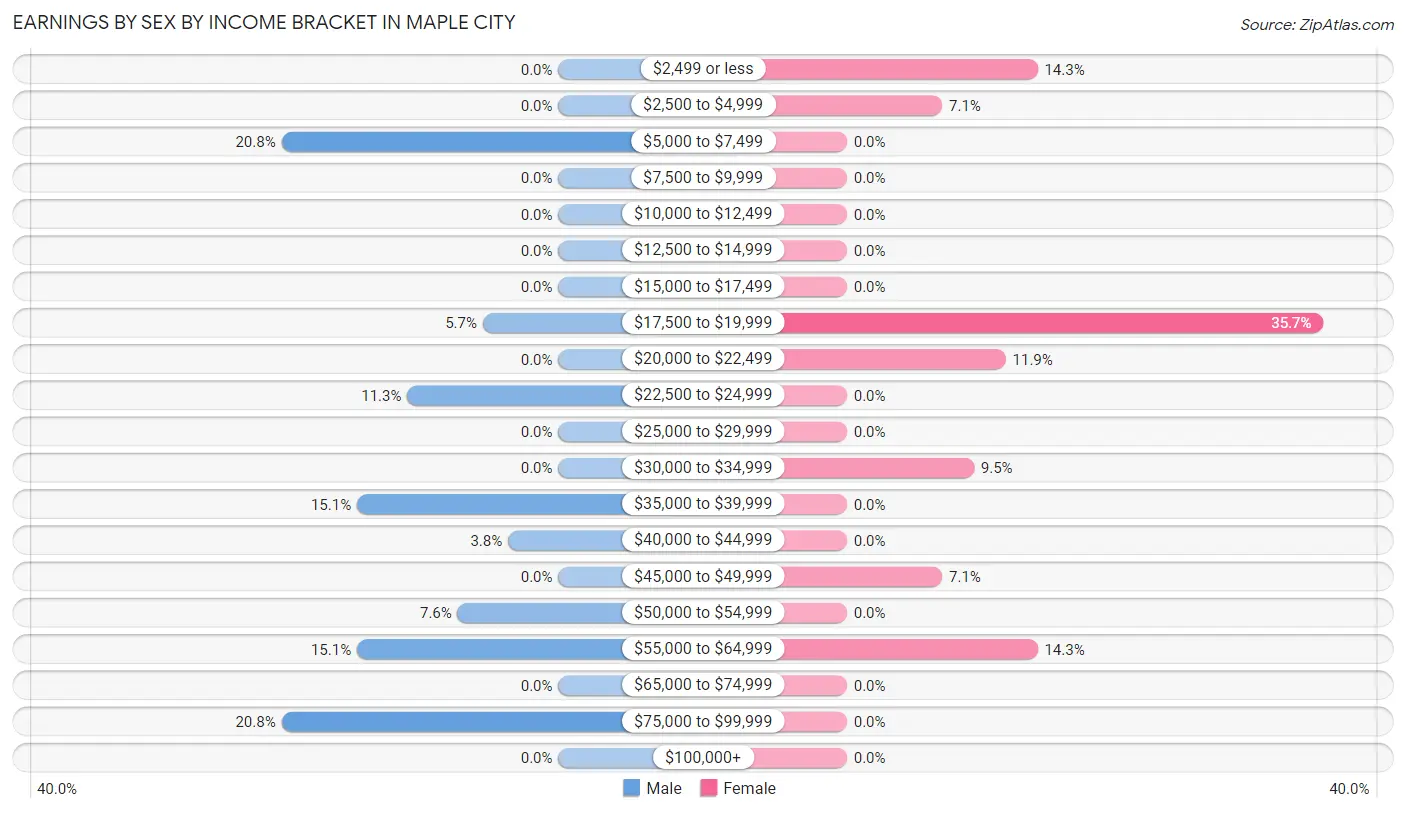
Earnings by Sex by Income Bracket in Maple City
The most common earnings brackets in Maple City are $5,000 to $7,499 for men (11 | 20.7%) and $17,500 to $19,999 for women (15 | 35.7%).
| Income | Male | Female |
| $2,499 or less | 0 (0.0%) | 6 (14.3%) |
| $2,500 to $4,999 | 0 (0.0%) | 3 (7.1%) |
| $5,000 to $7,499 | 11 (20.7%) | 0 (0.0%) |
| $7,500 to $9,999 | 0 (0.0%) | 0 (0.0%) |
| $10,000 to $12,499 | 0 (0.0%) | 0 (0.0%) |
| $12,500 to $14,999 | 0 (0.0%) | 0 (0.0%) |
| $15,000 to $17,499 | 0 (0.0%) | 0 (0.0%) |
| $17,500 to $19,999 | 3 (5.7%) | 15 (35.7%) |
| $20,000 to $22,499 | 0 (0.0%) | 5 (11.9%) |
| $22,500 to $24,999 | 6 (11.3%) | 0 (0.0%) |
| $25,000 to $29,999 | 0 (0.0%) | 0 (0.0%) |
| $30,000 to $34,999 | 0 (0.0%) | 4 (9.5%) |
| $35,000 to $39,999 | 8 (15.1%) | 0 (0.0%) |
| $40,000 to $44,999 | 2 (3.8%) | 0 (0.0%) |
| $45,000 to $49,999 | 0 (0.0%) | 3 (7.1%) |
| $50,000 to $54,999 | 4 (7.5%) | 0 (0.0%) |
| $55,000 to $64,999 | 8 (15.1%) | 6 (14.3%) |
| $65,000 to $74,999 | 0 (0.0%) | 0 (0.0%) |
| $75,000 to $99,999 | 11 (20.7%) | 0 (0.0%) |
| $100,000+ | 0 (0.0%) | 0 (0.0%) |
| Total | 53 (100.0%) | 42 (100.0%) |
Earnings by Sex by Educational Attainment in Maple City
Average earnings in Maple City are $38,750 for men and $20,750 for women, a difference of 46.5%. Men with an educational attainment of college or associate's degree enjoy the highest average annual earnings of $53,125, while those with college or associate's degree education earn the least with $53,125. Women with an educational attainment of college or associate's degree earn the most with the average annual earnings of $19,904, while those with college or associate's degree education have the smallest earnings of $19,904.
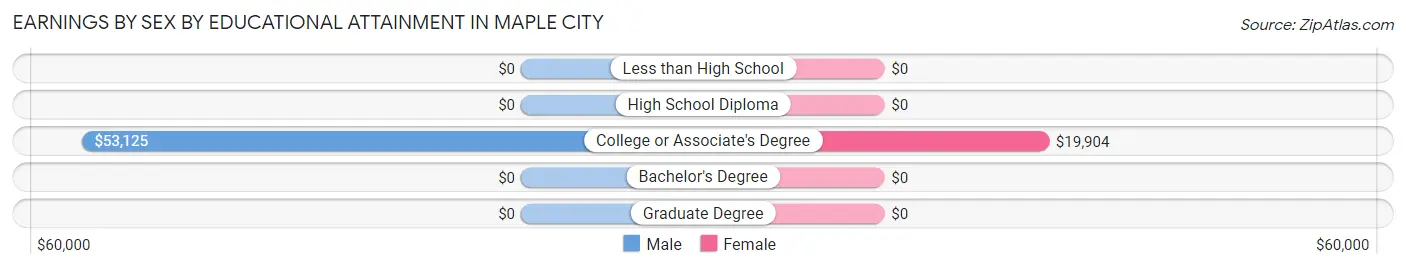
| Educational Attainment | Male Income | Female Income |
| Less than High School | - | - |
| High School Diploma | - | - |
| College or Associate's Degree | $53,125 | $19,904 |
| Bachelor's Degree | - | - |
| Graduate Degree | - | - |
| Total | $38,750 | $20,750 |
Family Income in Maple City
Family Income Brackets in Maple City
According to the Maple City family income data, there are 14 families falling into the $75,000 to $99,999 income range, which is the most common income bracket and makes up 34.2% of all families.
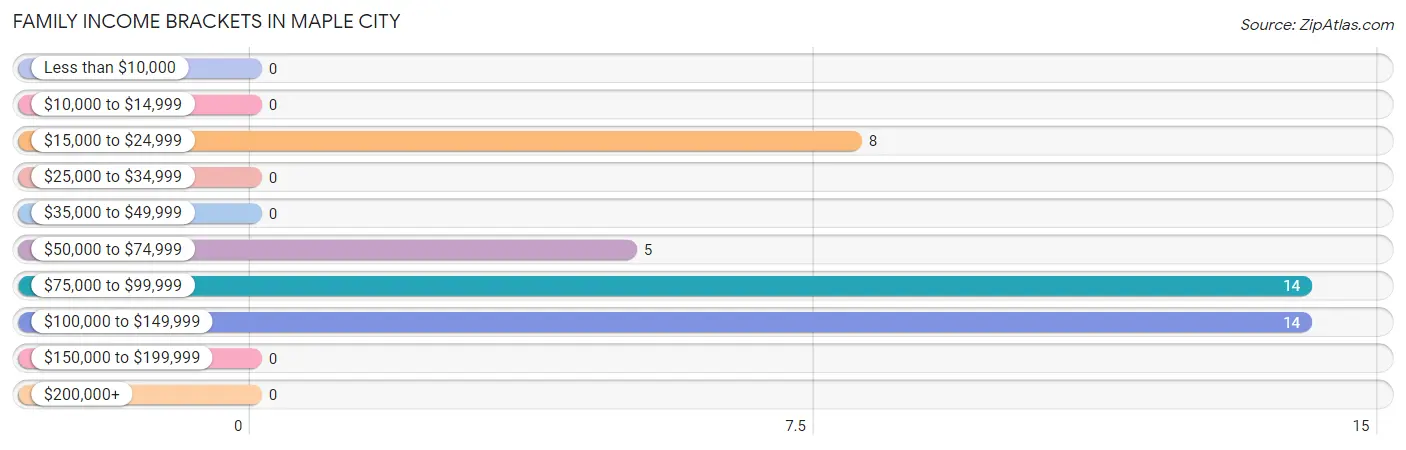
| Income Bracket | # Families | % Families |
| Less than $10,000 | 0 | 0.0% |
| $10,000 to $14,999 | 0 | 0.0% |
| $15,000 to $24,999 | 8 | 19.5% |
| $25,000 to $34,999 | 0 | 0.0% |
| $35,000 to $49,999 | 0 | 0.0% |
| $50,000 to $74,999 | 5 | 12.2% |
| $75,000 to $99,999 | 14 | 34.1% |
| $100,000 to $149,999 | 14 | 34.1% |
| $150,000 to $199,999 | 0 | 0.0% |
| $200,000+ | 0 | 0.0% |
Family Income by Famaliy Size in Maple City
3-person families (21 | 51.2%) account for the highest median family income in Maple City with $100,795 per family, while 3-person families (21 | 51.2%) have the highest median income of $33,598 per family member.
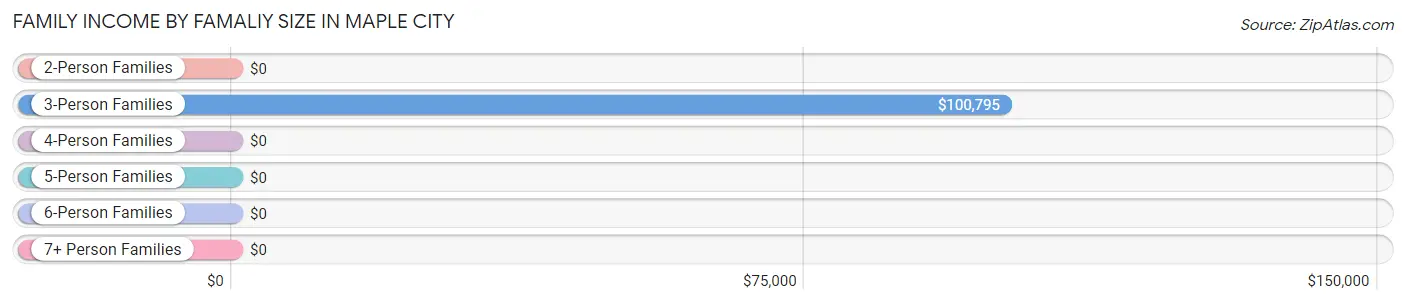
| Income Bracket | # Families | Median Income |
| 2-Person Families | 20 (48.8%) | $0 |
| 3-Person Families | 21 (51.2%) | $100,795 |
| 4-Person Families | 0 (0.0%) | $0 |
| 5-Person Families | 0 (0.0%) | $0 |
| 6-Person Families | 0 (0.0%) | $0 |
| 7+ Person Families | 0 (0.0%) | $0 |
| Total | 41 (100.0%) | $96,250 |
Family Income by Number of Earners in Maple City
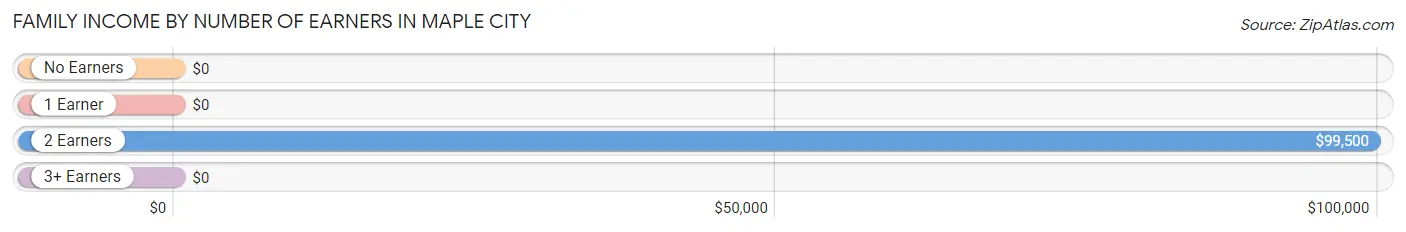
| Number of Earners | # Families | Median Income |
| No Earners | 6 (14.6%) | $0 |
| 1 Earner | 5 (12.2%) | $0 |
| 2 Earners | 30 (73.2%) | $99,500 |
| 3+ Earners | 0 (0.0%) | $0 |
| Total | 41 (100.0%) | $96,250 |
Household Income in Maple City
Household Income Brackets in Maple City
With 18 households falling in the category, the $75,000 to $99,999 income range is the most frequent in Maple City, accounting for 30.0% of all households.
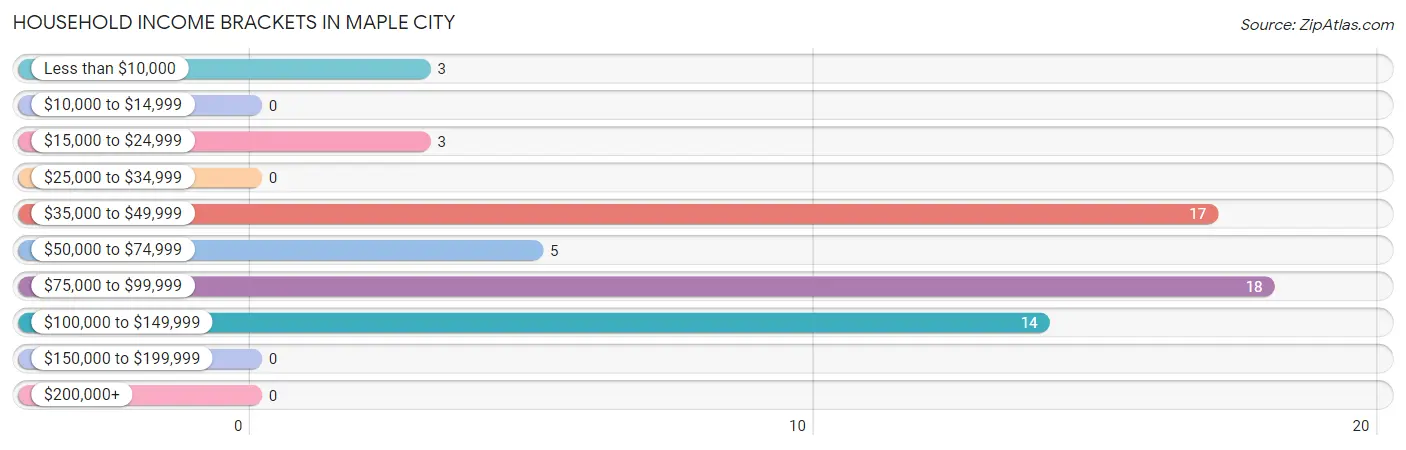
| Income Bracket | # Households | % Households |
| Less than $10,000 | 3 | 5.0% |
| $10,000 to $14,999 | 0 | 0.0% |
| $15,000 to $24,999 | 3 | 5.0% |
| $25,000 to $34,999 | 0 | 0.0% |
| $35,000 to $49,999 | 17 | 28.3% |
| $50,000 to $74,999 | 5 | 8.3% |
| $75,000 to $99,999 | 18 | 30.0% |
| $100,000 to $149,999 | 14 | 23.3% |
| $150,000 to $199,999 | 0 | 0.0% |
| $200,000+ | 0 | 0.0% |
Household Income by Householder Age in Maple City
The median household income in Maple City is $93,333, with the highest median household income of $99,250 found in the 45 to 64 years age bracket for the primary householder. A total of 25 households (41.7%) fall into this category. Meanwhile, the 15 to 24 years age bracket for the primary householder has the lowest median household income of $0, with 3 households (5.0%) in this group.
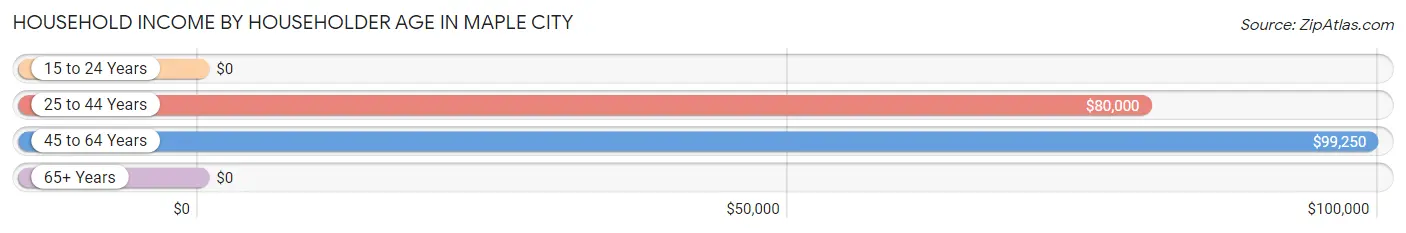
| Income Bracket | # Households | Median Income |
| 15 to 24 Years | 3 (5.0%) | $0 |
| 25 to 44 Years | 14 (23.3%) | $80,000 |
| 45 to 64 Years | 25 (41.7%) | $99,250 |
| 65+ Years | 18 (30.0%) | $0 |
| Total | 60 (100.0%) | $93,333 |
Poverty in Maple City
Income Below Poverty by Sex and Age in Maple City
With 4.8% poverty level for males and 11.9% for females among the residents of Maple City, 75 year old and over males and 75 year old and over females are the most vulnerable to poverty, with 3 males (42.9%) and 3 females (100.0%) in their respective age groups living below the poverty level.
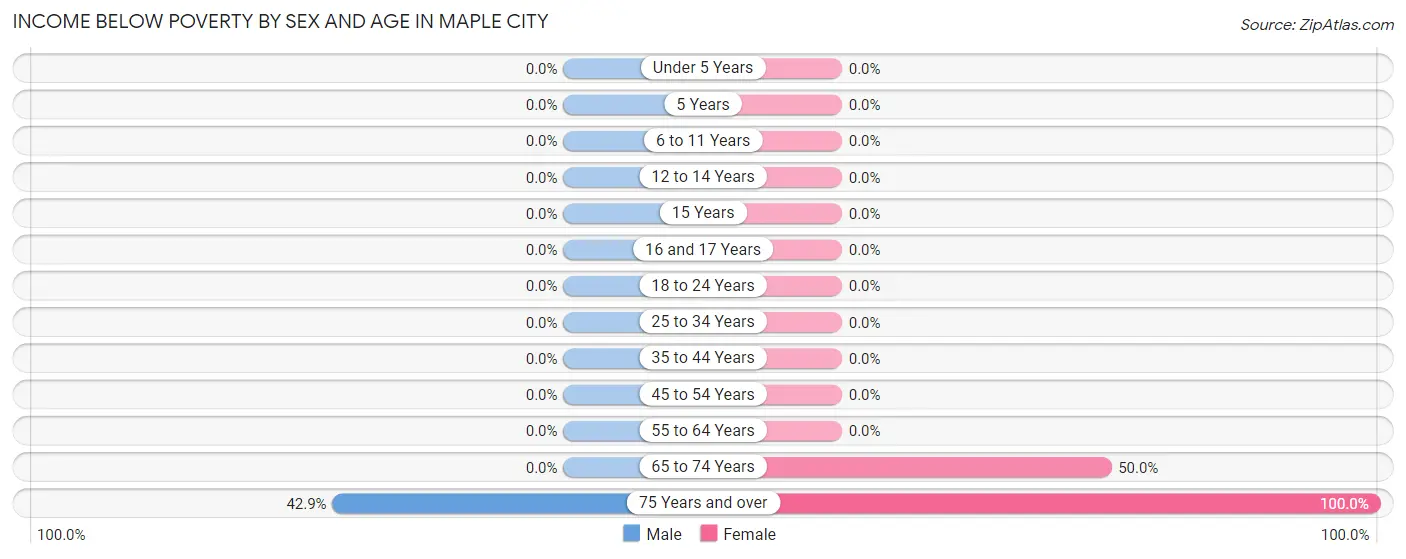
| Age Bracket | Male | Female |
| Under 5 Years | 0 (0.0%) | 0 (0.0%) |
| 5 Years | 0 (0.0%) | 0 (0.0%) |
| 6 to 11 Years | 0 (0.0%) | 0 (0.0%) |
| 12 to 14 Years | 0 (0.0%) | 0 (0.0%) |
| 15 Years | 0 (0.0%) | 0 (0.0%) |
| 16 and 17 Years | 0 (0.0%) | 0 (0.0%) |
| 18 to 24 Years | 0 (0.0%) | 0 (0.0%) |
| 25 to 34 Years | 0 (0.0%) | 0 (0.0%) |
| 35 to 44 Years | 0 (0.0%) | 0 (0.0%) |
| 45 to 54 Years | 0 (0.0%) | 0 (0.0%) |
| 55 to 64 Years | 0 (0.0%) | 0 (0.0%) |
| 65 to 74 Years | 0 (0.0%) | 9 (50.0%) |
| 75 Years and over | 3 (42.9%) | 3 (100.0%) |
| Total | 3 (4.8%) | 12 (11.9%) |
Income Above Poverty by Sex and Age in Maple City
According to the poverty statistics in Maple City, males aged 18 to 24 years and females aged 6 to 11 years are the age groups that are most secure financially, with 100.0% of males and 100.0% of females in these age groups living above the poverty line.
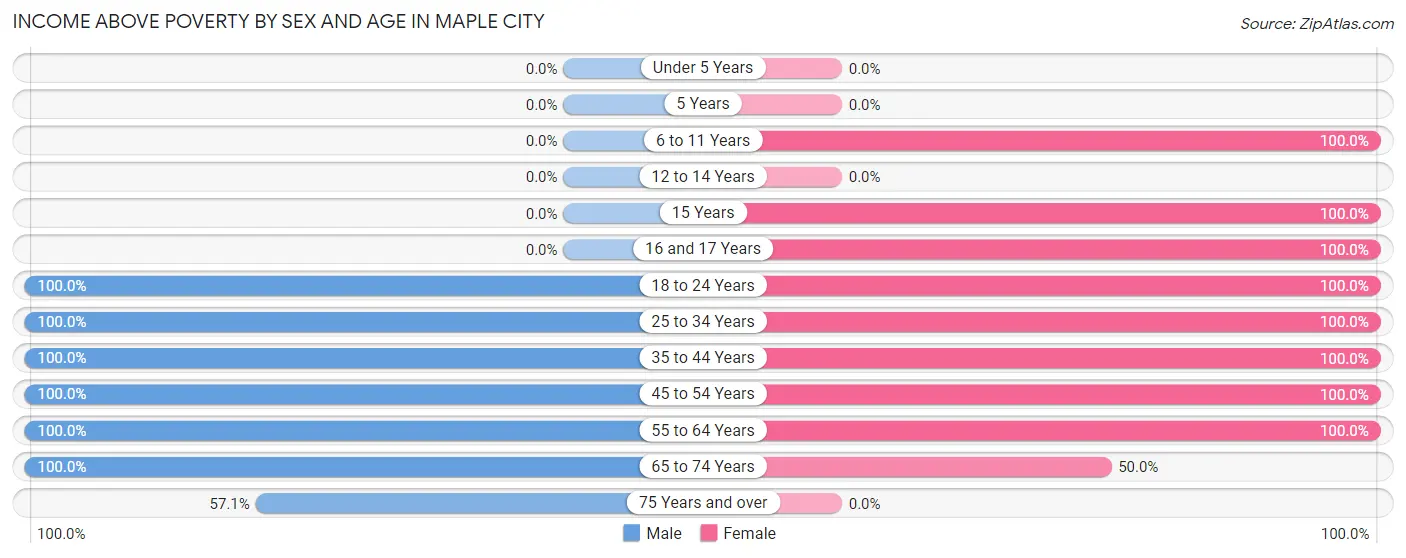
| Age Bracket | Male | Female |
| Under 5 Years | 0 (0.0%) | 0 (0.0%) |
| 5 Years | 0 (0.0%) | 0 (0.0%) |
| 6 to 11 Years | 0 (0.0%) | 3 (100.0%) |
| 12 to 14 Years | 0 (0.0%) | 0 (0.0%) |
| 15 Years | 0 (0.0%) | 2 (100.0%) |
| 16 and 17 Years | 0 (0.0%) | 3 (100.0%) |
| 18 to 24 Years | 3 (100.0%) | 31 (100.0%) |
| 25 to 34 Years | 6 (100.0%) | 9 (100.0%) |
| 35 to 44 Years | 6 (100.0%) | 5 (100.0%) |
| 45 to 54 Years | 11 (100.0%) | 11 (100.0%) |
| 55 to 64 Years | 27 (100.0%) | 16 (100.0%) |
| 65 to 74 Years | 3 (100.0%) | 9 (50.0%) |
| 75 Years and over | 4 (57.1%) | 0 (0.0%) |
| Total | 60 (95.2%) | 89 (88.1%) |
Income Below Poverty Among Married-Couple Families in Maple City
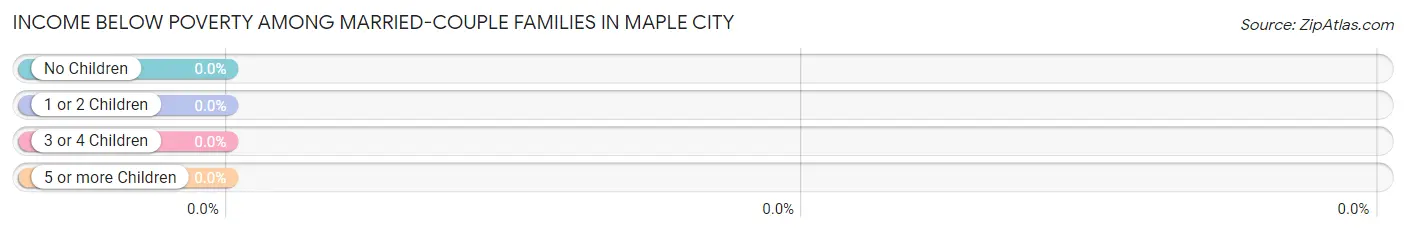
| Children | Above Poverty | Below Poverty |
| No Children | 28 (100.0%) | 0 (0.0%) |
| 1 or 2 Children | 8 (100.0%) | 0 (0.0%) |
| 3 or 4 Children | 0 (0.0%) | 0 (0.0%) |
| 5 or more Children | 0 (0.0%) | 0 (0.0%) |
| Total | 36 (100.0%) | 0 (0.0%) |
Income Below Poverty Among Single-Parent Households in Maple City
| Children | Single Father | Single Mother |
| No Children | 0 (0.0%) | 0 (0.0%) |
| 1 or 2 Children | 0 (0.0%) | 0 (0.0%) |
| 3 or 4 Children | 0 (0.0%) | 0 (0.0%) |
| 5 or more Children | 0 (0.0%) | 0 (0.0%) |
| Total | 0 (0.0%) | 0 (0.0%) |
Income Below Poverty Among Married-Couple vs Single-Parent Households in Maple City
| Children | Married-Couple Families | Single-Parent Households |
| No Children | 0 (0.0%) | 0 (0.0%) |
| 1 or 2 Children | 0 (0.0%) | 0 (0.0%) |
| 3 or 4 Children | 0 (0.0%) | 0 (0.0%) |
| 5 or more Children | 0 (0.0%) | 0 (0.0%) |
| Total | 0 (0.0%) | 0 (0.0%) |
Race in Maple City
The most populous races in Maple City are White / Caucasian (161 | 98.2%), Hispanic or Latino (11 | 6.7%), and Asian (3 | 1.8%).
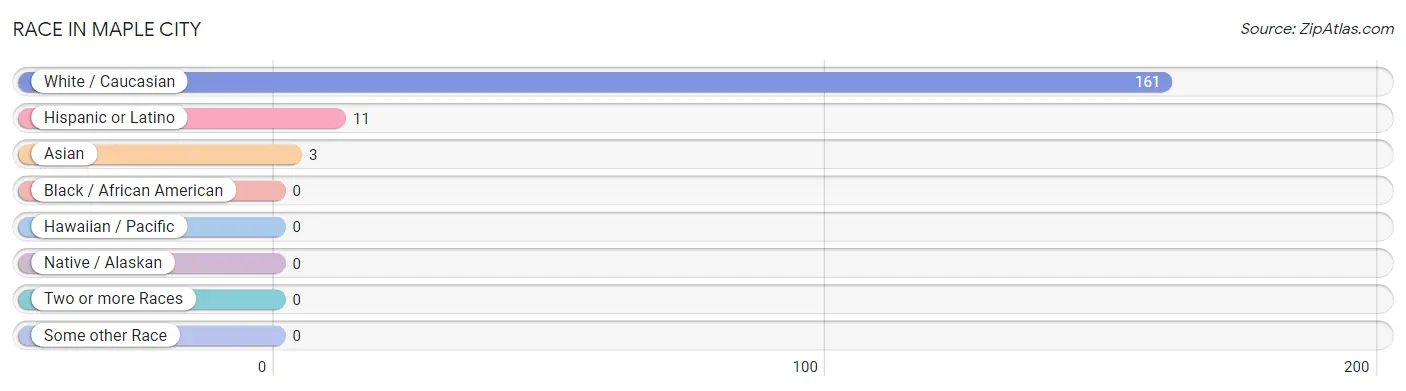
| Race | # Population | % Population |
| Asian | 3 | 1.8% |
| Black / African American | 0 | 0.0% |
| Hawaiian / Pacific | 0 | 0.0% |
| Hispanic or Latino | 11 | 6.7% |
| Native / Alaskan | 0 | 0.0% |
| White / Caucasian | 161 | 98.2% |
| Two or more Races | 0 | 0.0% |
| Some other Race | 0 | 0.0% |
| Total | 164 | 100.0% |
Ancestry in Maple City
The most populous ancestries reported in Maple City are German (78 | 47.6%), Polish (44 | 26.8%), Dutch (15 | 9.1%), Scotch-Irish (13 | 7.9%), and American (12 | 7.3%), together accounting for 98.8% of all Maple City residents.
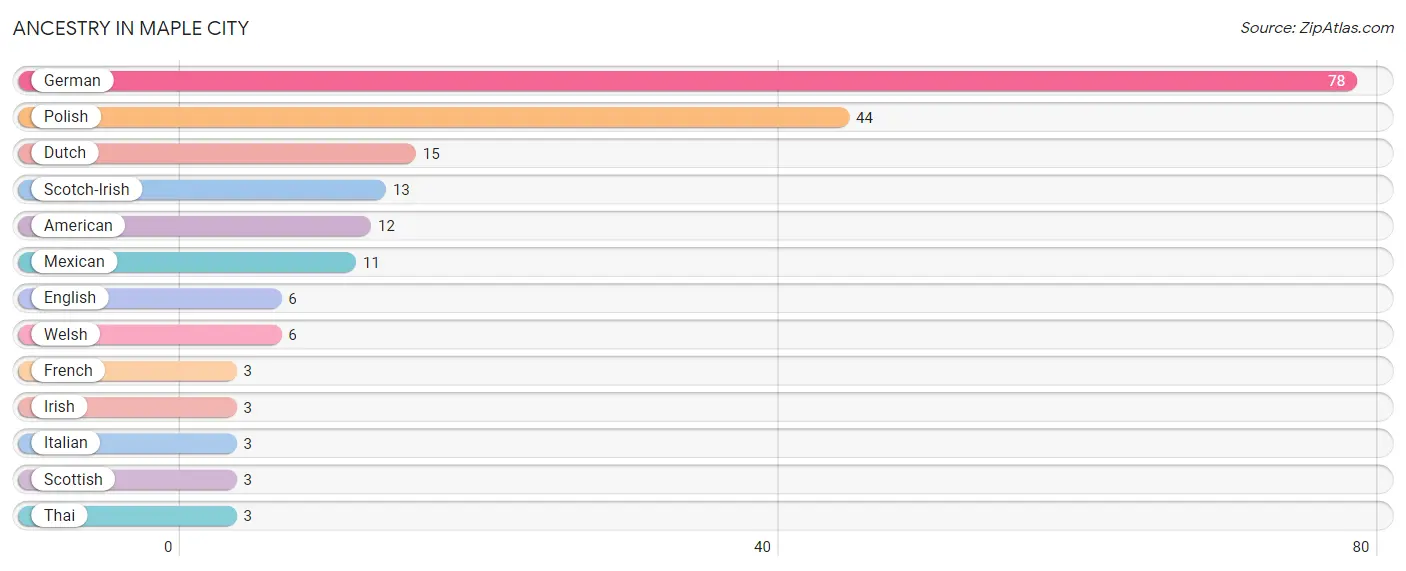
| Ancestry | # Population | % Population |
| American | 12 | 7.3% |
| Dutch | 15 | 9.1% |
| English | 6 | 3.7% |
| French | 3 | 1.8% |
| German | 78 | 47.6% |
| Irish | 3 | 1.8% |
| Italian | 3 | 1.8% |
| Mexican | 11 | 6.7% |
| Polish | 44 | 26.8% |
| Scotch-Irish | 13 | 7.9% |
| Scottish | 3 | 1.8% |
| Thai | 3 | 1.8% |
| Welsh | 6 | 3.7% | View All 13 Rows |
Immigrants in Maple City
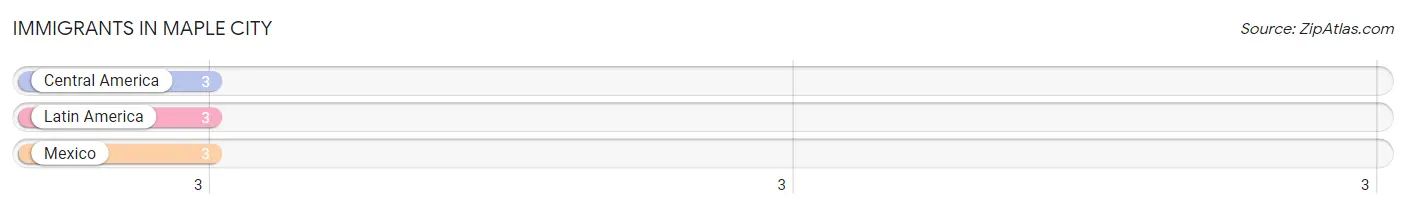
The most numerous immigrant groups reported in Maple City came from Central America (3 | 1.8%), Latin America (3 | 1.8%), and Mexico (3 | 1.8%), together accounting for 5.5% of all Maple City residents.
| Immigration Origin | # Population | % Population |
| Central America | 3 | 1.8% |
| Latin America | 3 | 1.8% |
| Mexico | 3 | 1.8% | View All 3 Rows |
Sex and Age in Maple City
Sex and Age in Maple City
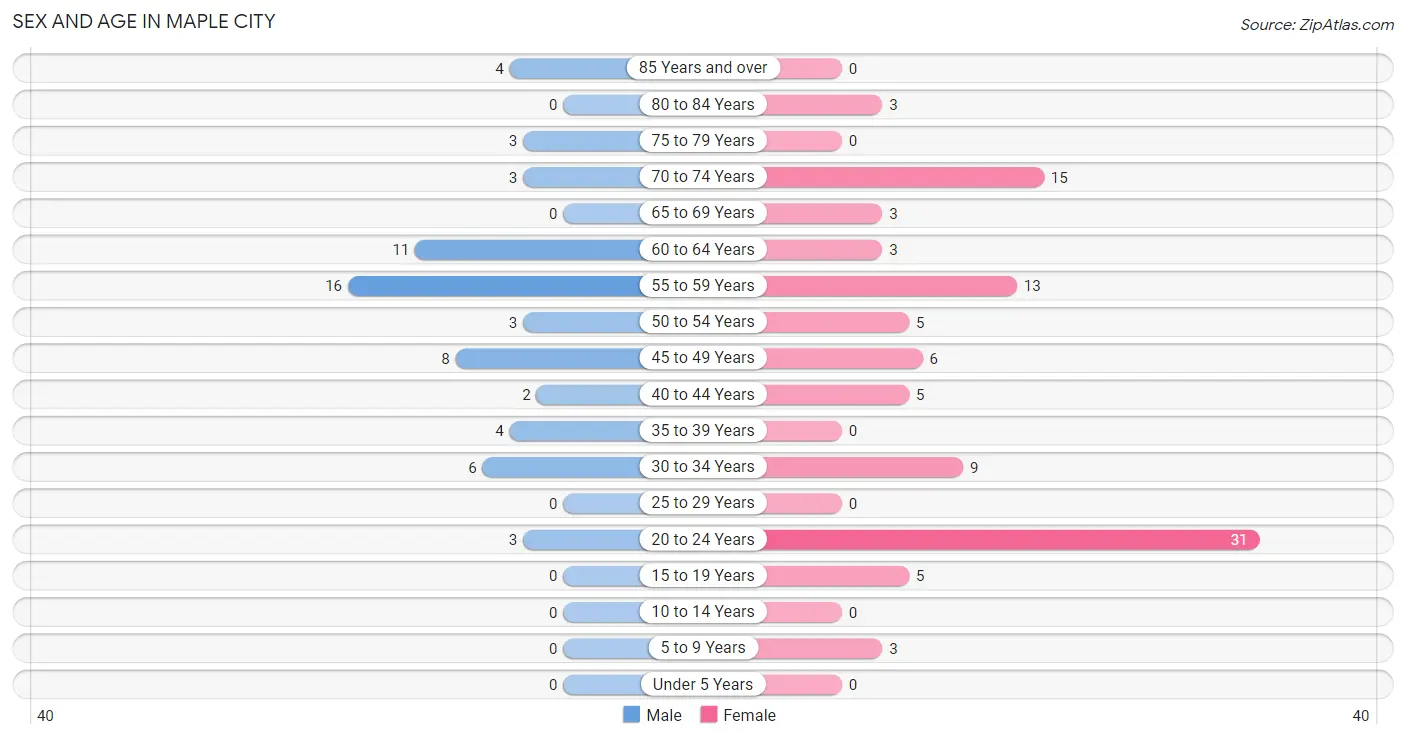
The most populous age groups in Maple City are 55 to 59 Years (16 | 25.4%) for men and 20 to 24 Years (31 | 30.7%) for women.
| Age Bracket | Male | Female |
| Under 5 Years | 0 (0.0%) | 0 (0.0%) |
| 5 to 9 Years | 0 (0.0%) | 3 (3.0%) |
| 10 to 14 Years | 0 (0.0%) | 0 (0.0%) |
| 15 to 19 Years | 0 (0.0%) | 5 (5.0%) |
| 20 to 24 Years | 3 (4.8%) | 31 (30.7%) |
| 25 to 29 Years | 0 (0.0%) | 0 (0.0%) |
| 30 to 34 Years | 6 (9.5%) | 9 (8.9%) |
| 35 to 39 Years | 4 (6.4%) | 0 (0.0%) |
| 40 to 44 Years | 2 (3.2%) | 5 (5.0%) |
| 45 to 49 Years | 8 (12.7%) | 6 (5.9%) |
| 50 to 54 Years | 3 (4.8%) | 5 (5.0%) |
| 55 to 59 Years | 16 (25.4%) | 13 (12.9%) |
| 60 to 64 Years | 11 (17.5%) | 3 (3.0%) |
| 65 to 69 Years | 0 (0.0%) | 3 (3.0%) |
| 70 to 74 Years | 3 (4.8%) | 15 (14.8%) |
| 75 to 79 Years | 3 (4.8%) | 0 (0.0%) |
| 80 to 84 Years | 0 (0.0%) | 3 (3.0%) |
| 85 Years and over | 4 (6.4%) | 0 (0.0%) |
| Total | 63 (100.0%) | 101 (100.0%) |
Families and Households in Maple City
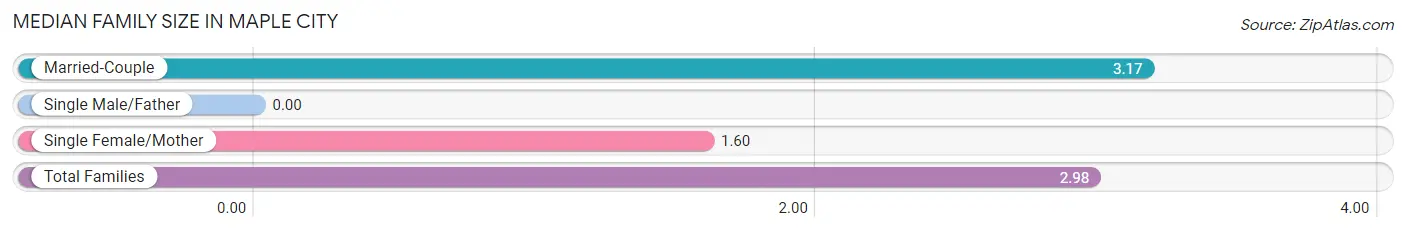
Median Family Size in Maple City
| Family Type | # Families | Family Size |
| Married-Couple | 36 (87.8%) | 3.17 |
| Single Male/Father | 0 (0.0%) | - |
| Single Female/Mother | 5 (12.2%) | 1.60 |
| Total Families | 41 (100.0%) | 2.98 |
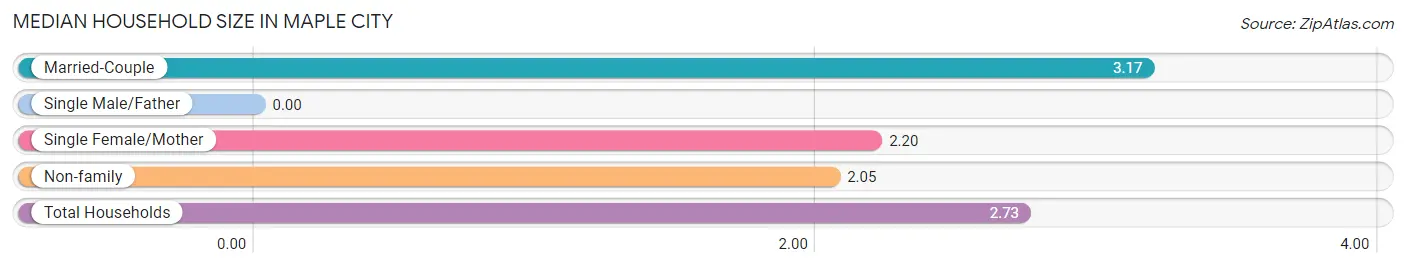
Median Household Size in Maple City
| Household Type | # Households | Household Size |
| Married-Couple | 36 (60.0%) | 3.17 |
| Single Male/Father | 0 (0.0%) | - |
| Single Female/Mother | 5 (8.3%) | 2.20 |
| Non-family | 19 (31.7%) | 2.05 |
| Total Households | 60 (100.0%) | 2.73 |
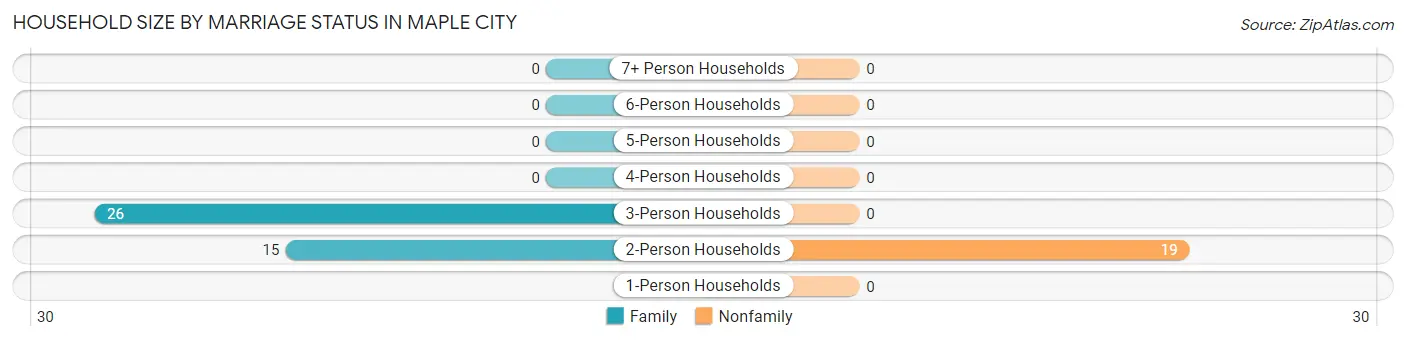
Household Size by Marriage Status in Maple City
Out of a total of 60 households in Maple City, 41 (68.3%) are family households, while 19 (31.7%) are nonfamily households. The most numerous type of family households are 3-person households, comprising 26, and the most common type of nonfamily households are 2-person households, comprising 19.
| Household Size | Family Households | Nonfamily Households |
| 1-Person Households | - | 0 (0.0%) |
| 2-Person Households | 15 (25.0%) | 19 (31.7%) |
| 3-Person Households | 26 (43.3%) | 0 (0.0%) |
| 4-Person Households | 0 (0.0%) | 0 (0.0%) |
| 5-Person Households | 0 (0.0%) | 0 (0.0%) |
| 6-Person Households | 0 (0.0%) | 0 (0.0%) |
| 7+ Person Households | 0 (0.0%) | 0 (0.0%) |
| Total | 41 (68.3%) | 19 (31.7%) |
Female Fertility in Maple City
Fertility by Age in Maple City
| Age Bracket | Women with Births | Births / 1,000 Women |
| 15 to 19 years | 0 (0.0%) | 0.0 |
| 20 to 34 years | 0 (0.0%) | 0.0 |
| 35 to 50 years | 0 (0.0%) | 0.0 |
| Total | 0 (0.0%) | 0.0 |
Fertility by Age by Marriage Status in Maple City
| Age Bracket | Married | Unmarried |
| 15 to 19 years | 0 (0.0%) | 0 (0.0%) |
| 20 to 34 years | 0 (0.0%) | 0 (0.0%) |
| 35 to 50 years | 0 (0.0%) | 0 (0.0%) |
| Total | 0 (0.0%) | 0 (0.0%) |
Fertility by Education in Maple City
| Educational Attainment | Women with Births | Births / 1,000 Women |
| Less than High School | 0 (0.0%) | 0.0 |
| High School Diploma | 0 (0.0%) | 0.0 |
| College or Associate's Degree | 0 (0.0%) | 0.0 |
| Bachelor's Degree | 0 (0.0%) | 0.0 |
| Graduate Degree | 0 (0.0%) | 0.0 |
| Total | 0 (0.0%) | 0.0 |
Fertility by Education by Marriage Status in Maple City
| Educational Attainment | Married | Unmarried |
| Less than High School | 0 (0.0%) | 0 (0.0%) |
| High School Diploma | 0 (0.0%) | 0 (0.0%) |
| College or Associate's Degree | 0 (0.0%) | 0 (0.0%) |
| Bachelor's Degree | 0 (0.0%) | 0 (0.0%) |
| Graduate Degree | 0 (0.0%) | 0 (0.0%) |
| Total | 0 (0.0%) | 0 (0.0%) |
Employment Characteristics in Maple City
Employment by Class of Employer in Maple City
Among the 76 employed individuals in Maple City, private company employees (51 | 67.1%), local government employees (13 | 17.1%), and self-employed (not incorporated) (6 | 7.9%) make up the most common classes of employment.
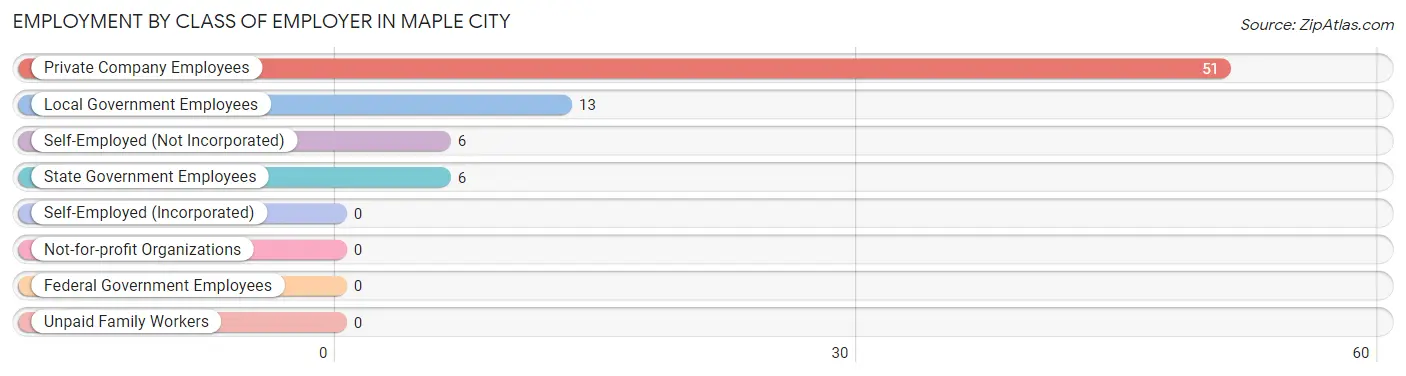
| Employer Class | # Employees | % Employees |
| Private Company Employees | 51 | 67.1% |
| Self-Employed (Incorporated) | 0 | 0.0% |
| Self-Employed (Not Incorporated) | 6 | 7.9% |
| Not-for-profit Organizations | 0 | 0.0% |
| Local Government Employees | 13 | 17.1% |
| State Government Employees | 6 | 7.9% |
| Federal Government Employees | 0 | 0.0% |
| Unpaid Family Workers | 0 | 0.0% |
| Total | 76 | 100.0% |
Employment Status by Age in Maple City
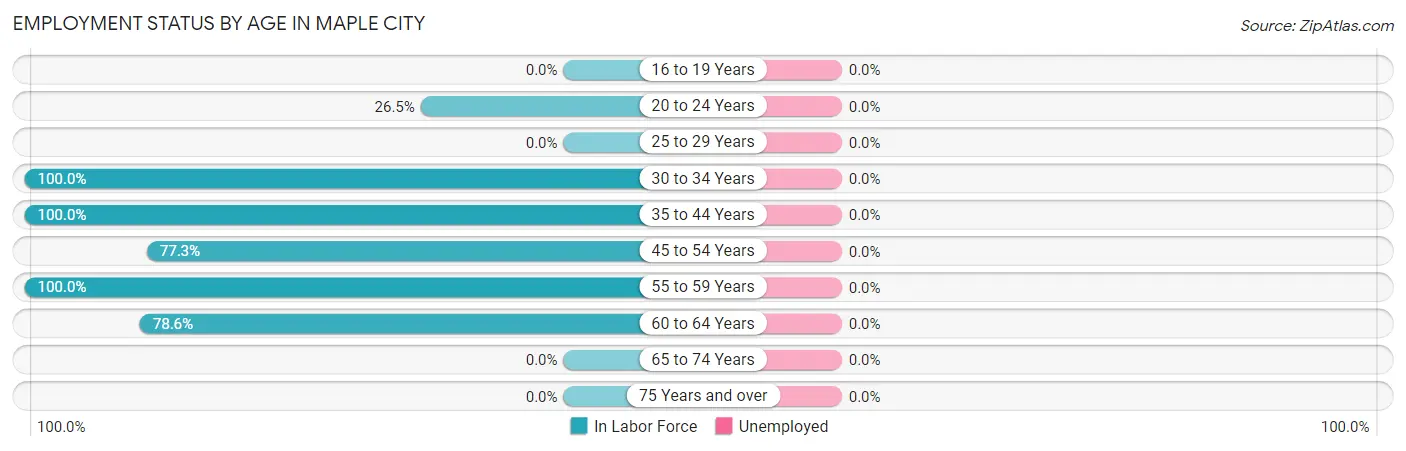
| Age Bracket | In Labor Force | Unemployed |
| 16 to 19 Years | 0 (0.0%) | 0 (0.0%) |
| 20 to 24 Years | 9 (26.5%) | 0 (0.0%) |
| 25 to 29 Years | 0 (0.0%) | 0 (0.0%) |
| 30 to 34 Years | 15 (100.0%) | 0 (0.0%) |
| 35 to 44 Years | 11 (100.0%) | 0 (0.0%) |
| 45 to 54 Years | 17 (77.3%) | 0 (0.0%) |
| 55 to 59 Years | 29 (100.0%) | 0 (0.0%) |
| 60 to 64 Years | 11 (78.6%) | 0 (0.0%) |
| 65 to 74 Years | 0 (0.0%) | 0 (0.0%) |
| 75 Years and over | 0 (0.0%) | 0 (0.0%) |
| Total | 92 (57.9%) | 0 (0.0%) |
Employment Status by Educational Attainment in Maple City
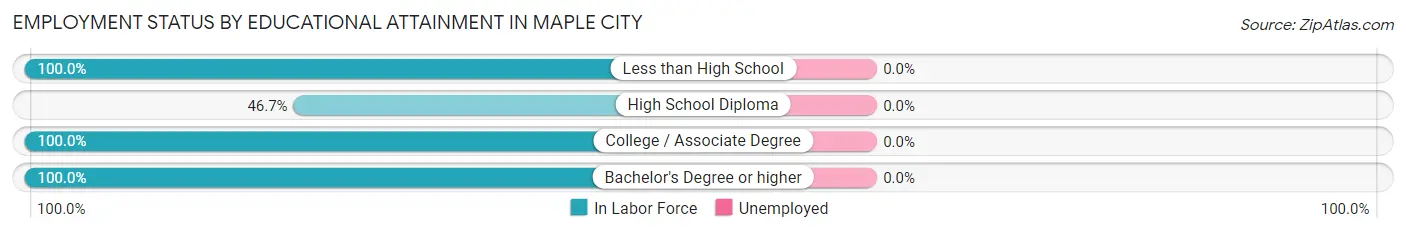
| Educational Attainment | In Labor Force | Unemployed |
| Less than High School | 3 (100.0%) | 0 (0.0%) |
| High School Diploma | 7 (46.7%) | 0 (0.0%) |
| College / Associate Degree | 53 (100.0%) | 0 (0.0%) |
| Bachelor's Degree or higher | 20 (100.0%) | 0 (0.0%) |
| Total | 83 (91.2%) | 0 (0.0%) |
Employment Occupations by Sex in Maple City
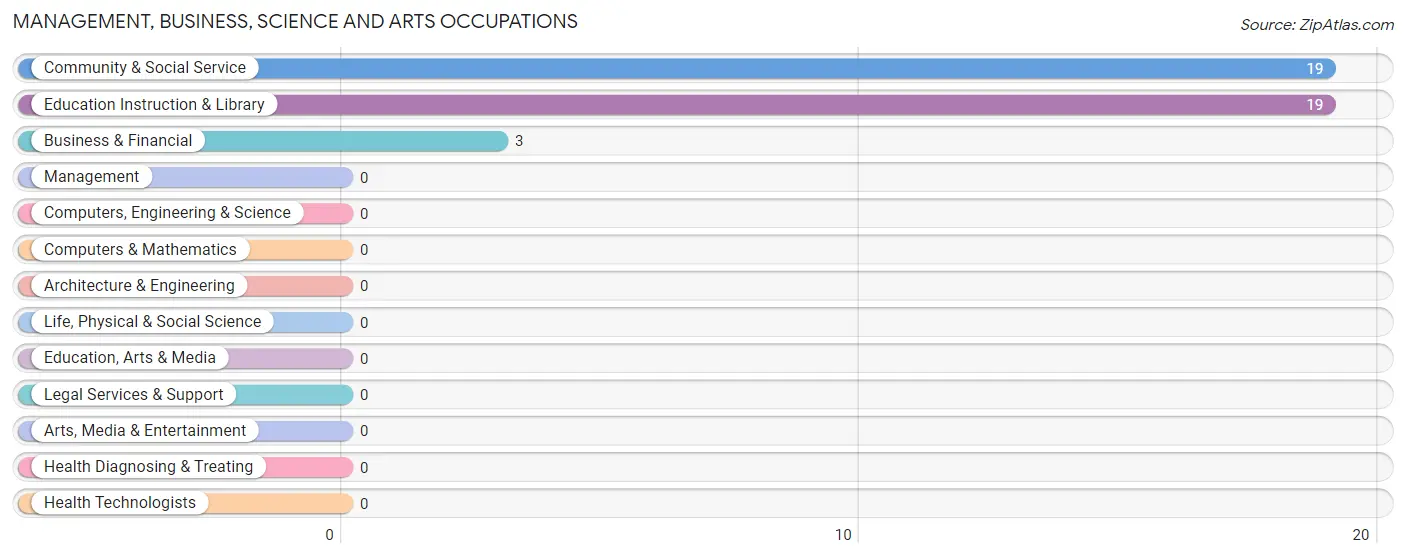
Management, Business, Science and Arts Occupations
The most common Management, Business, Science and Arts occupations in Maple City are Community & Social Service (19 | 20.6%), Education Instruction & Library (19 | 20.6%), and Business & Financial (3 | 3.3%).
Management, Business, Science and Arts Occupations by Sex
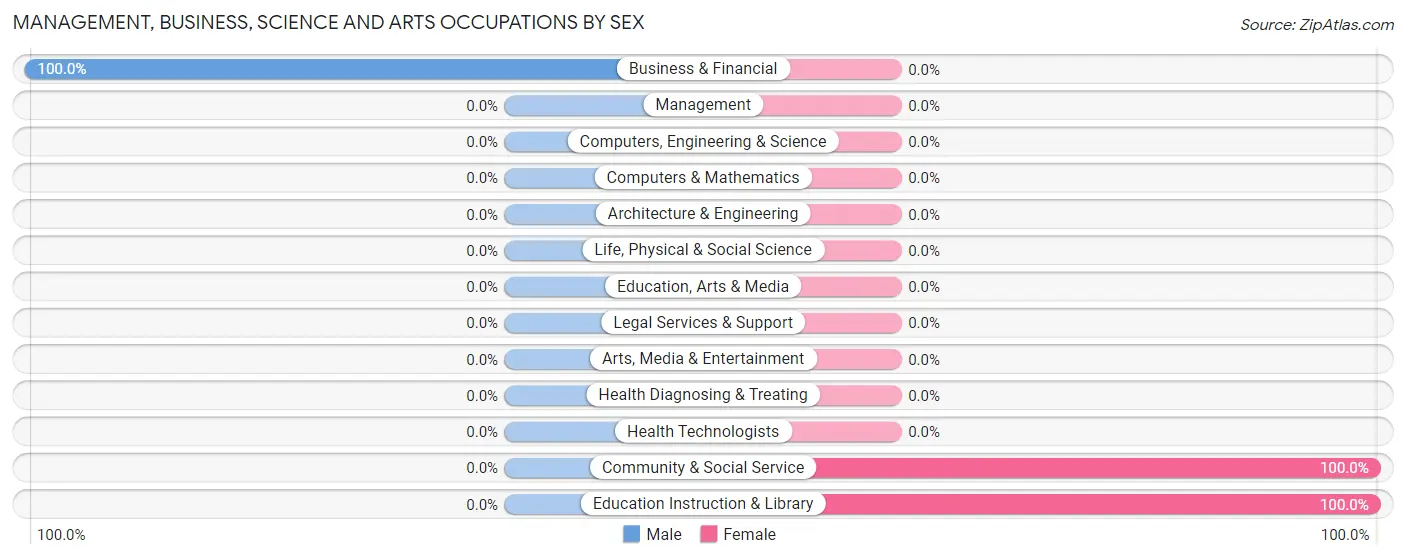
| Occupation | Male | Female |
| Management | 0 (0.0%) | 0 (0.0%) |
| Business & Financial | 3 (100.0%) | 0 (0.0%) |
| Computers, Engineering & Science | 0 (0.0%) | 0 (0.0%) |
| Computers & Mathematics | 0 (0.0%) | 0 (0.0%) |
| Architecture & Engineering | 0 (0.0%) | 0 (0.0%) |
| Life, Physical & Social Science | 0 (0.0%) | 0 (0.0%) |
| Community & Social Service | 0 (0.0%) | 19 (100.0%) |
| Education, Arts & Media | 0 (0.0%) | 0 (0.0%) |
| Legal Services & Support | 0 (0.0%) | 0 (0.0%) |
| Education Instruction & Library | 0 (0.0%) | 19 (100.0%) |
| Arts, Media & Entertainment | 0 (0.0%) | 0 (0.0%) |
| Health Diagnosing & Treating | 0 (0.0%) | 0 (0.0%) |
| Health Technologists | 0 (0.0%) | 0 (0.0%) |
| Total (Category) | 3 (13.6%) | 19 (86.4%) |
| Total (Overall) | 53 (57.6%) | 39 (42.4%) |
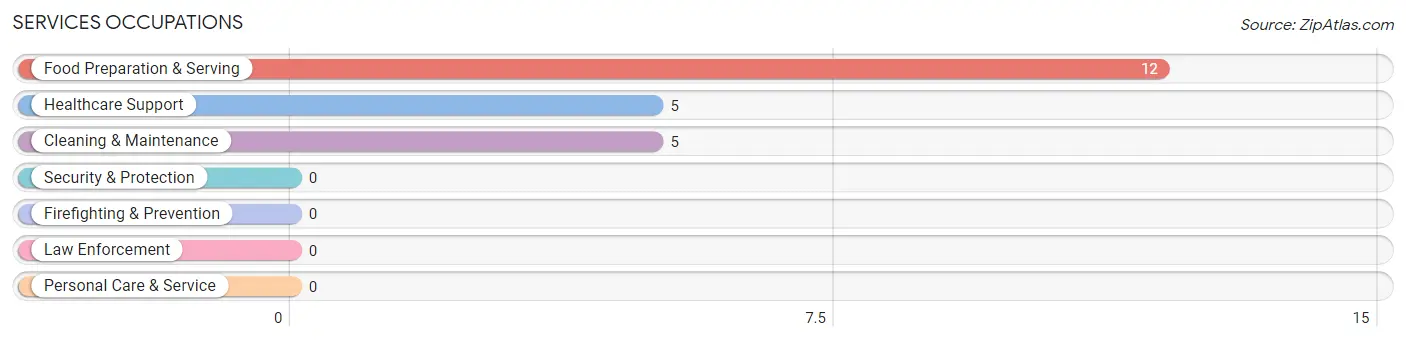
Services Occupations
The most common Services occupations in Maple City are Food Preparation & Serving (12 | 13.0%), Healthcare Support (5 | 5.4%), and Cleaning & Maintenance (5 | 5.4%).
Services Occupations by Sex
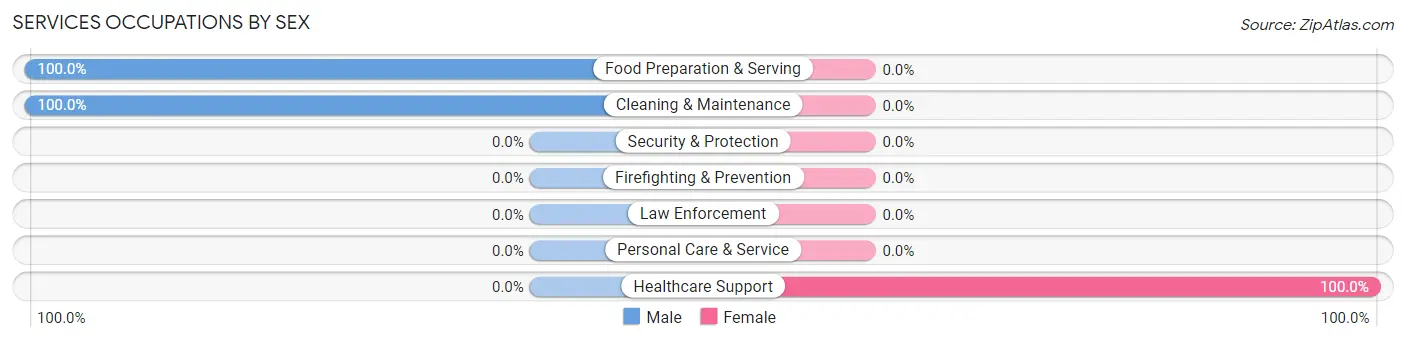
| Occupation | Male | Female |
| Healthcare Support | 0 (0.0%) | 5 (100.0%) |
| Security & Protection | 0 (0.0%) | 0 (0.0%) |
| Firefighting & Prevention | 0 (0.0%) | 0 (0.0%) |
| Law Enforcement | 0 (0.0%) | 0 (0.0%) |
| Food Preparation & Serving | 12 (100.0%) | 0 (0.0%) |
| Cleaning & Maintenance | 5 (100.0%) | 0 (0.0%) |
| Personal Care & Service | 0 (0.0%) | 0 (0.0%) |
| Total (Category) | 17 (77.3%) | 5 (22.7%) |
| Total (Overall) | 53 (57.6%) | 39 (42.4%) |
Sales and Office Occupations
The most common Sales and Office occupations in Maple City are Office & Administration (10 | 10.9%), and Sales & Related (3 | 3.3%).
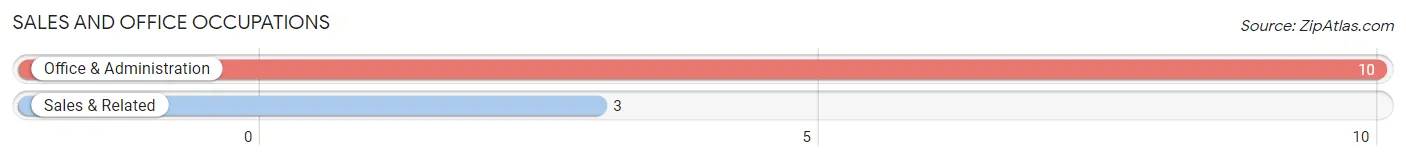
Sales and Office Occupations by Sex
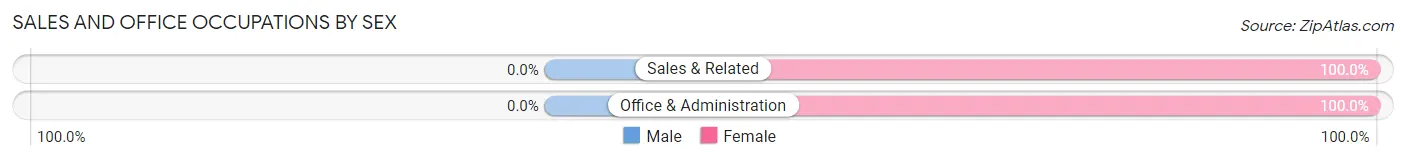
| Occupation | Male | Female |
| Sales & Related | 0 (0.0%) | 3 (100.0%) |
| Office & Administration | 0 (0.0%) | 10 (100.0%) |
| Total (Category) | 0 (0.0%) | 13 (100.0%) |
| Total (Overall) | 53 (57.6%) | 39 (42.4%) |
Natural Resources, Construction and Maintenance Occupations
The most common Natural Resources, Construction and Maintenance occupations in Maple City are Construction & Extraction (19 | 20.6%), and Installation, Maintenance & Repair (14 | 15.2%).
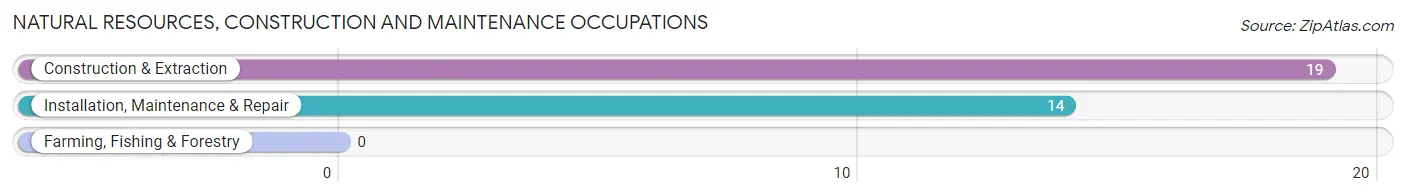
Natural Resources, Construction and Maintenance Occupations by Sex
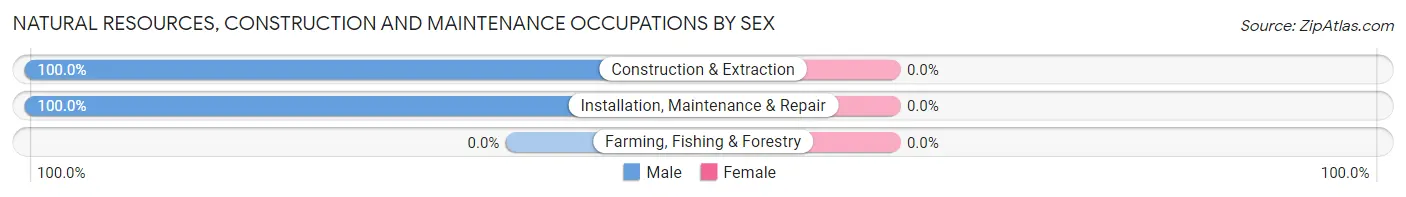
| Occupation | Male | Female |
| Farming, Fishing & Forestry | 0 (0.0%) | 0 (0.0%) |
| Construction & Extraction | 19 (100.0%) | 0 (0.0%) |
| Installation, Maintenance & Repair | 14 (100.0%) | 0 (0.0%) |
| Total (Category) | 33 (100.0%) | 0 (0.0%) |
| Total (Overall) | 53 (57.6%) | 39 (42.4%) |
Production, Transportation and Moving Occupations
The most common Production, Transportation and Moving occupations in Maple City are , and Production (2 | 2.2%).
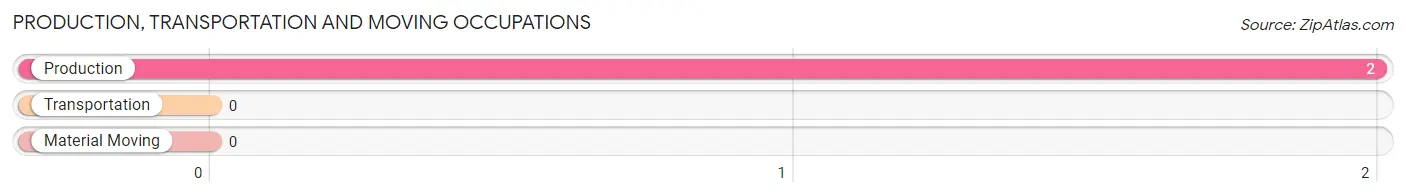
Production, Transportation and Moving Occupations by Sex
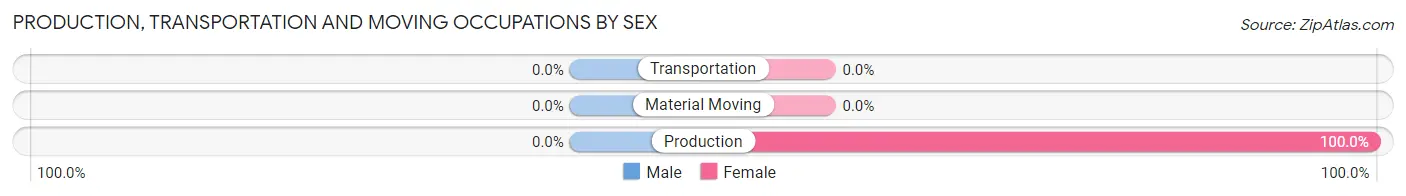
| Occupation | Male | Female |
| Production | 0 (0.0%) | 2 (100.0%) |
| Transportation | 0 (0.0%) | 0 (0.0%) |
| Material Moving | 0 (0.0%) | 0 (0.0%) |
| Total (Category) | 0 (0.0%) | 2 (100.0%) |
| Total (Overall) | 53 (57.6%) | 39 (42.4%) |
Employment Industries by Sex in Maple City
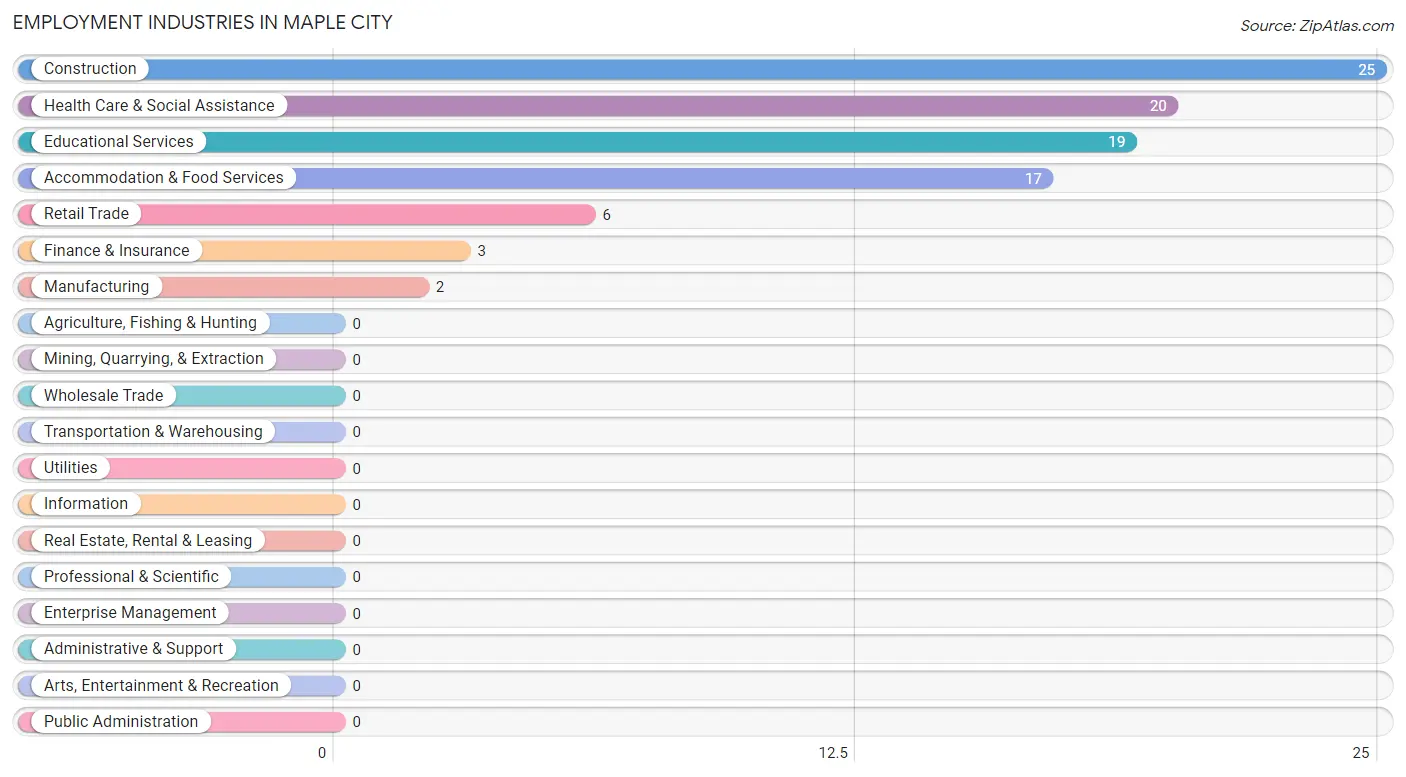
Employment Industries in Maple City
The major employment industries in Maple City include Construction (25 | 27.2%), Health Care & Social Assistance (20 | 21.7%), Educational Services (19 | 20.6%), Accommodation & Food Services (17 | 18.5%), and Retail Trade (6 | 6.5%).
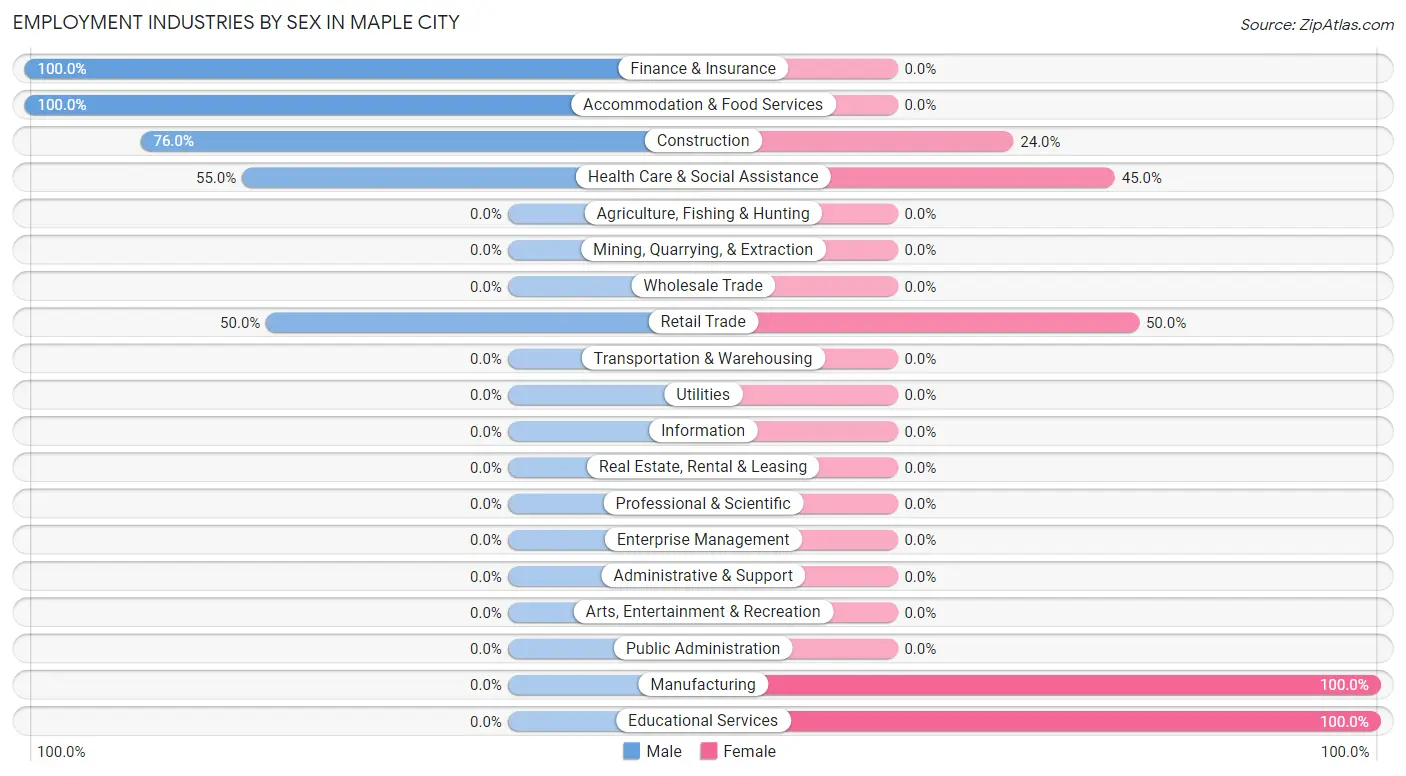
Employment Industries by Sex in Maple City
The Maple City industries that see more men than women are Finance & Insurance (100.0%), Accommodation & Food Services (100.0%), and Construction (76.0%), whereas the industries that tend to have a higher number of women are Manufacturing (100.0%), Educational Services (100.0%), and Retail Trade (50.0%).
| Industry | Male | Female |
| Agriculture, Fishing & Hunting | 0 (0.0%) | 0 (0.0%) |
| Mining, Quarrying, & Extraction | 0 (0.0%) | 0 (0.0%) |
| Construction | 19 (76.0%) | 6 (24.0%) |
| Manufacturing | 0 (0.0%) | 2 (100.0%) |
| Wholesale Trade | 0 (0.0%) | 0 (0.0%) |
| Retail Trade | 3 (50.0%) | 3 (50.0%) |
| Transportation & Warehousing | 0 (0.0%) | 0 (0.0%) |
| Utilities | 0 (0.0%) | 0 (0.0%) |
| Information | 0 (0.0%) | 0 (0.0%) |
| Finance & Insurance | 3 (100.0%) | 0 (0.0%) |
| Real Estate, Rental & Leasing | 0 (0.0%) | 0 (0.0%) |
| Professional & Scientific | 0 (0.0%) | 0 (0.0%) |
| Enterprise Management | 0 (0.0%) | 0 (0.0%) |
| Administrative & Support | 0 (0.0%) | 0 (0.0%) |
| Educational Services | 0 (0.0%) | 19 (100.0%) |
| Health Care & Social Assistance | 11 (55.0%) | 9 (45.0%) |
| Arts, Entertainment & Recreation | 0 (0.0%) | 0 (0.0%) |
| Accommodation & Food Services | 17 (100.0%) | 0 (0.0%) |
| Public Administration | 0 (0.0%) | 0 (0.0%) |
| Total | 53 (57.6%) | 39 (42.4%) |
Education in Maple City
School Enrollment in Maple City
The most common levels of schooling among the 10 students in Maple City are high school (5 | 50.0%), kindergarten (3 | 30.0%), and college / undergraduate (2 | 20.0%).
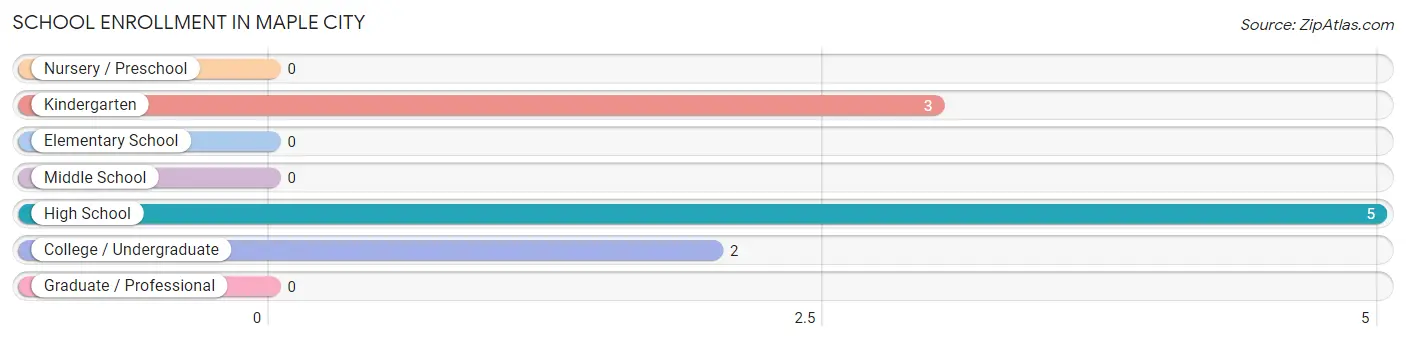
| School Level | # Students | % Students |
| Nursery / Preschool | 0 | 0.0% |
| Kindergarten | 3 | 30.0% |
| Elementary School | 0 | 0.0% |
| Middle School | 0 | 0.0% |
| High School | 5 | 50.0% |
| College / Undergraduate | 2 | 20.0% |
| Graduate / Professional | 0 | 0.0% |
| Total | 10 | 100.0% |
School Enrollment by Age by Funding Source in Maple City
Out of a total of 10 students who are enrolled in schools in Maple City, 2 (20.0%) attend a private institution, while the remaining 8 (80.0%) are enrolled in public schools. The age group of 35 years and over has the highest likelihood of being enrolled in private schools, with 2 (100.0% in the age bracket) enrolled. Conversely, the age group of 5 to 9 year old has the lowest likelihood of being enrolled in a private school, with 3 (100.0% in the age bracket) attending a public institution.
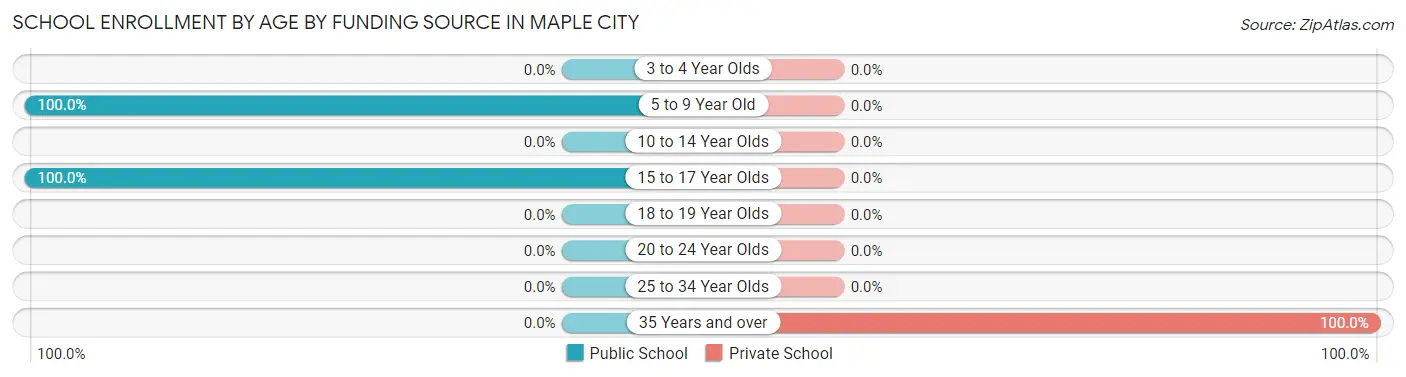
| Age Bracket | Public School | Private School |
| 3 to 4 Year Olds | 0 (0.0%) | 0 (0.0%) |
| 5 to 9 Year Old | 3 (100.0%) | 0 (0.0%) |
| 10 to 14 Year Olds | 0 (0.0%) | 0 (0.0%) |
| 15 to 17 Year Olds | 5 (100.0%) | 0 (0.0%) |
| 18 to 19 Year Olds | 0 (0.0%) | 0 (0.0%) |
| 20 to 24 Year Olds | 0 (0.0%) | 0 (0.0%) |
| 25 to 34 Year Olds | 0 (0.0%) | 0 (0.0%) |
| 35 Years and over | 0 (0.0%) | 2 (100.0%) |
| Total | 8 (80.0%) | 2 (20.0%) |
Educational Attainment by Field of Study in Maple City
Science & technology (14 | 48.3%), business (6 | 20.7%), education (6 | 20.7%), and bio, nature & agricultural (3 | 10.3%) are the most common fields of study among 29 individuals in Maple City who have obtained a bachelor's degree or higher.
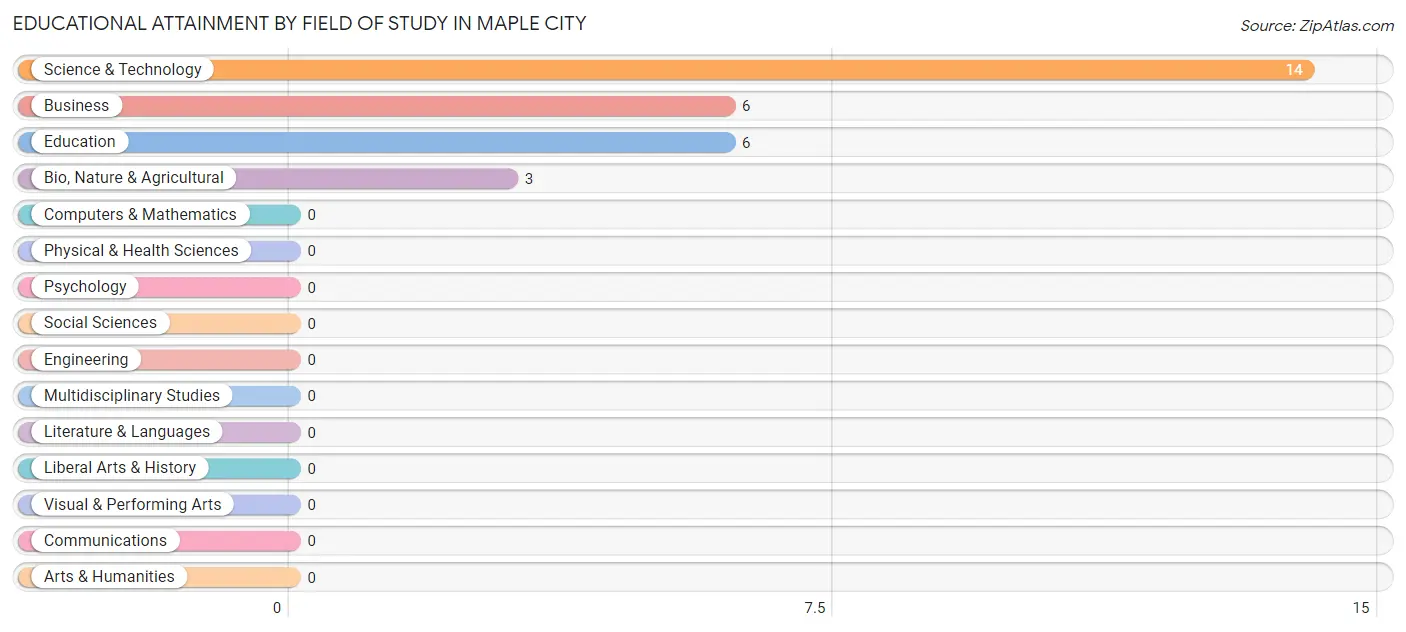
| Field of Study | # Graduates | % Graduates |
| Computers & Mathematics | 0 | 0.0% |
| Bio, Nature & Agricultural | 3 | 10.3% |
| Physical & Health Sciences | 0 | 0.0% |
| Psychology | 0 | 0.0% |
| Social Sciences | 0 | 0.0% |
| Engineering | 0 | 0.0% |
| Multidisciplinary Studies | 0 | 0.0% |
| Science & Technology | 14 | 48.3% |
| Business | 6 | 20.7% |
| Education | 6 | 20.7% |
| Literature & Languages | 0 | 0.0% |
| Liberal Arts & History | 0 | 0.0% |
| Visual & Performing Arts | 0 | 0.0% |
| Communications | 0 | 0.0% |
| Arts & Humanities | 0 | 0.0% |
| Total | 29 | 100.0% |
Transportation & Commute in Maple City
Vehicle Availability by Sex in Maple City
The most prevalent vehicle ownership categories in Maple City are males with 2 vehicles (17, accounting for 40.5%) and females with 2 vehicles (16, making up 50.0%).
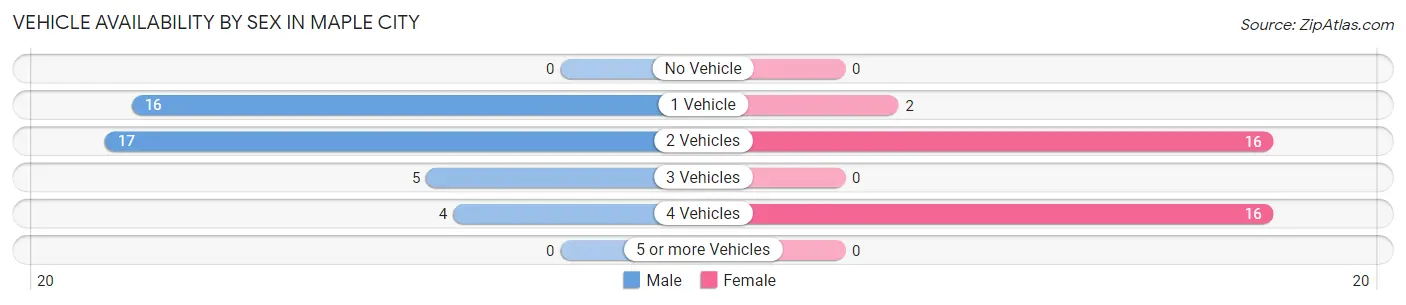
| Vehicles Available | Male | Female |
| No Vehicle | 0 (0.0%) | 0 (0.0%) |
| 1 Vehicle | 16 (38.1%) | 2 (5.9%) |
| 2 Vehicles | 17 (40.5%) | 16 (47.1%) |
| 3 Vehicles | 5 (11.9%) | 0 (0.0%) |
| 4 Vehicles | 4 (9.5%) | 16 (47.1%) |
| 5 or more Vehicles | 0 (0.0%) | 0 (0.0%) |
| Total | 42 (100.0%) | 34 (100.0%) |
Commute Time in Maple City
The most frequently occuring commute durations in Maple City are 10 to 14 minutes (26 commuters, 36.1%), 20 to 24 minutes (19 commuters, 26.4%), and less than 5 minutes (13 commuters, 18.1%).
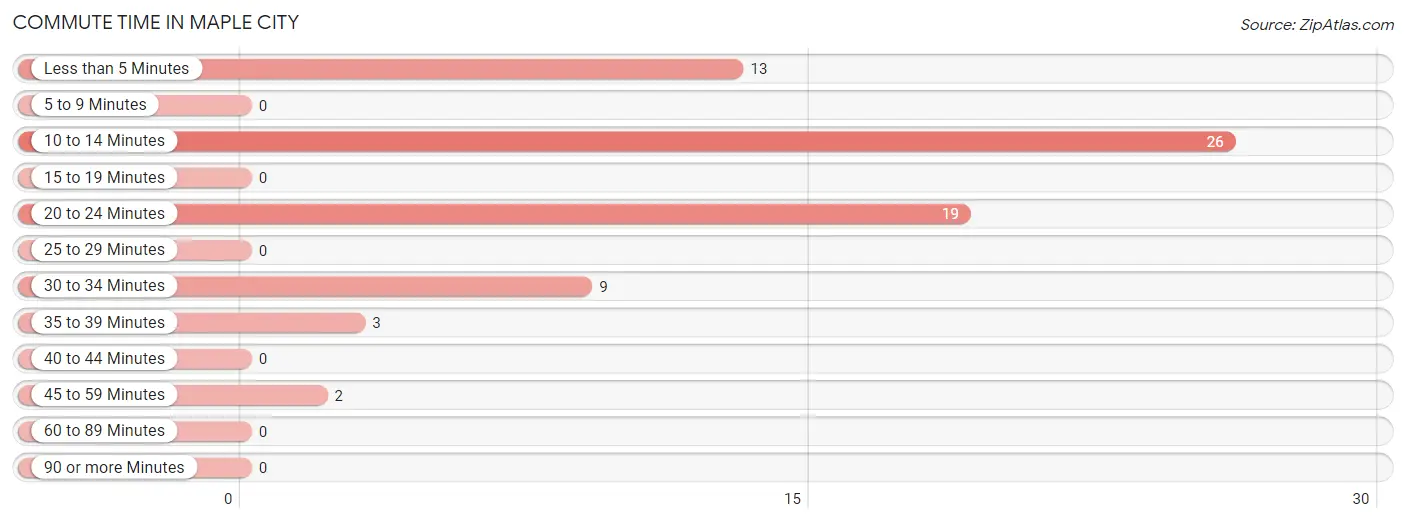
| Commute Time | # Commuters | % Commuters |
| Less than 5 Minutes | 13 | 18.1% |
| 5 to 9 Minutes | 0 | 0.0% |
| 10 to 14 Minutes | 26 | 36.1% |
| 15 to 19 Minutes | 0 | 0.0% |
| 20 to 24 Minutes | 19 | 26.4% |
| 25 to 29 Minutes | 0 | 0.0% |
| 30 to 34 Minutes | 9 | 12.5% |
| 35 to 39 Minutes | 3 | 4.2% |
| 40 to 44 Minutes | 0 | 0.0% |
| 45 to 59 Minutes | 2 | 2.8% |
| 60 to 89 Minutes | 0 | 0.0% |
| 90 or more Minutes | 0 | 0.0% |
Commute Time by Sex in Maple City
The most common commute times in Maple City are 20 to 24 minutes (19 commuters, 45.2%) for males and less than 5 minutes (13 commuters, 43.3%) for females.
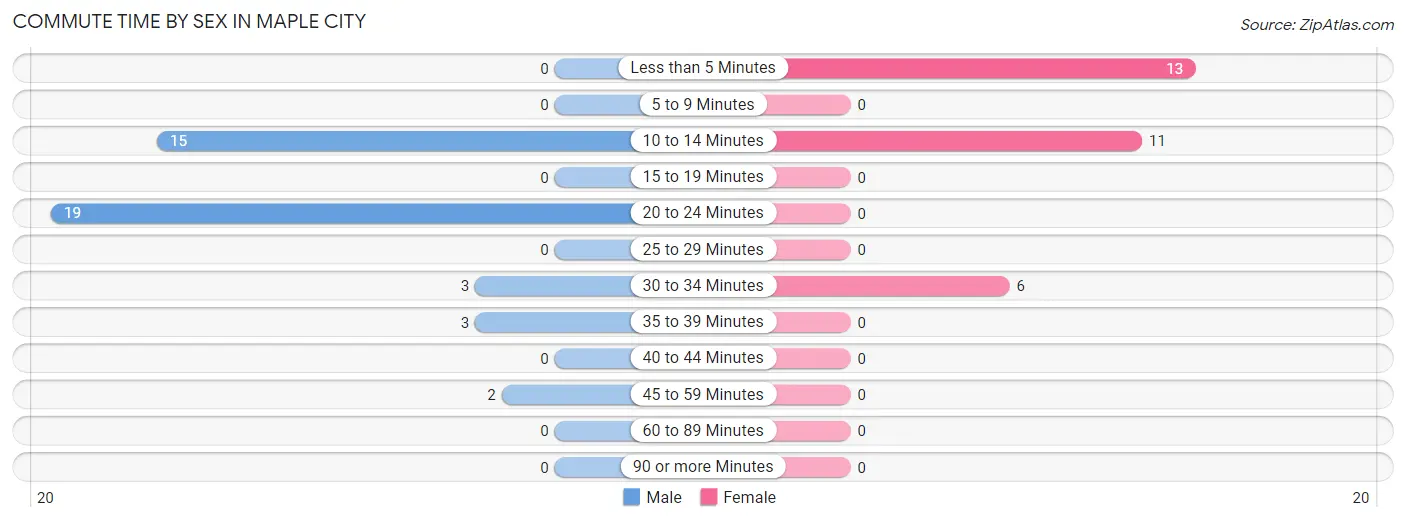
| Commute Time | Male | Female |
| Less than 5 Minutes | 0 (0.0%) | 13 (43.3%) |
| 5 to 9 Minutes | 0 (0.0%) | 0 (0.0%) |
| 10 to 14 Minutes | 15 (35.7%) | 11 (36.7%) |
| 15 to 19 Minutes | 0 (0.0%) | 0 (0.0%) |
| 20 to 24 Minutes | 19 (45.2%) | 0 (0.0%) |
| 25 to 29 Minutes | 0 (0.0%) | 0 (0.0%) |
| 30 to 34 Minutes | 3 (7.1%) | 6 (20.0%) |
| 35 to 39 Minutes | 3 (7.1%) | 0 (0.0%) |
| 40 to 44 Minutes | 0 (0.0%) | 0 (0.0%) |
| 45 to 59 Minutes | 2 (4.8%) | 0 (0.0%) |
| 60 to 89 Minutes | 0 (0.0%) | 0 (0.0%) |
| 90 or more Minutes | 0 (0.0%) | 0 (0.0%) |
Time of Departure to Work by Sex in Maple City
The most frequent times of departure to work in Maple City are 7:30 AM to 7:59 AM (16, 38.1%) for males and 6:00 AM to 6:29 AM (13, 43.3%) for females.
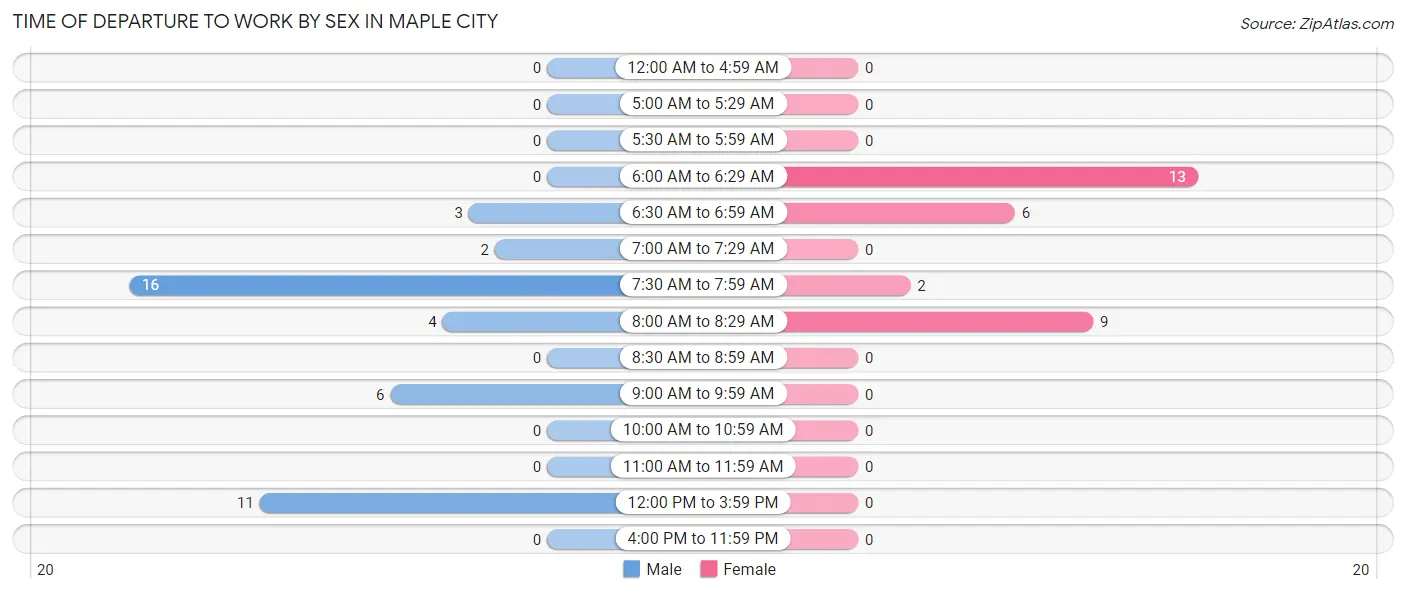
| Time of Departure | Male | Female |
| 12:00 AM to 4:59 AM | 0 (0.0%) | 0 (0.0%) |
| 5:00 AM to 5:29 AM | 0 (0.0%) | 0 (0.0%) |
| 5:30 AM to 5:59 AM | 0 (0.0%) | 0 (0.0%) |
| 6:00 AM to 6:29 AM | 0 (0.0%) | 13 (43.3%) |
| 6:30 AM to 6:59 AM | 3 (7.1%) | 6 (20.0%) |
| 7:00 AM to 7:29 AM | 2 (4.8%) | 0 (0.0%) |
| 7:30 AM to 7:59 AM | 16 (38.1%) | 2 (6.7%) |
| 8:00 AM to 8:29 AM | 4 (9.5%) | 9 (30.0%) |
| 8:30 AM to 8:59 AM | 0 (0.0%) | 0 (0.0%) |
| 9:00 AM to 9:59 AM | 6 (14.3%) | 0 (0.0%) |
| 10:00 AM to 10:59 AM | 0 (0.0%) | 0 (0.0%) |
| 11:00 AM to 11:59 AM | 0 (0.0%) | 0 (0.0%) |
| 12:00 PM to 3:59 PM | 11 (26.2%) | 0 (0.0%) |
| 4:00 PM to 11:59 PM | 0 (0.0%) | 0 (0.0%) |
| Total | 42 (100.0%) | 30 (100.0%) |
Housing Occupancy in Maple City
Occupancy by Ownership in Maple City
Of the total 60 dwellings in Maple City, owner-occupied units account for 41 (68.3%), while renter-occupied units make up 19 (31.7%).
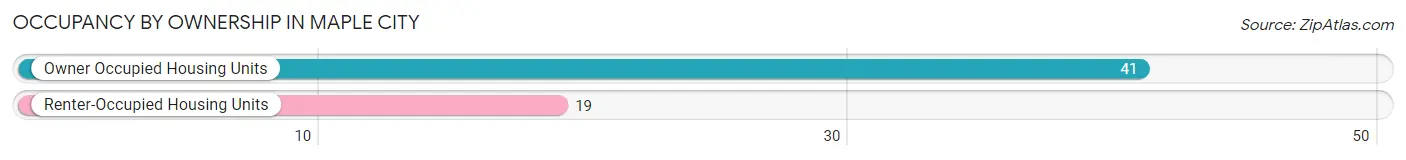
| Occupancy | # Housing Units | % Housing Units |
| Owner Occupied Housing Units | 41 | 68.3% |
| Renter-Occupied Housing Units | 19 | 31.7% |
| Total Occupied Housing Units | 60 | 100.0% |
Occupancy by Household Size in Maple City
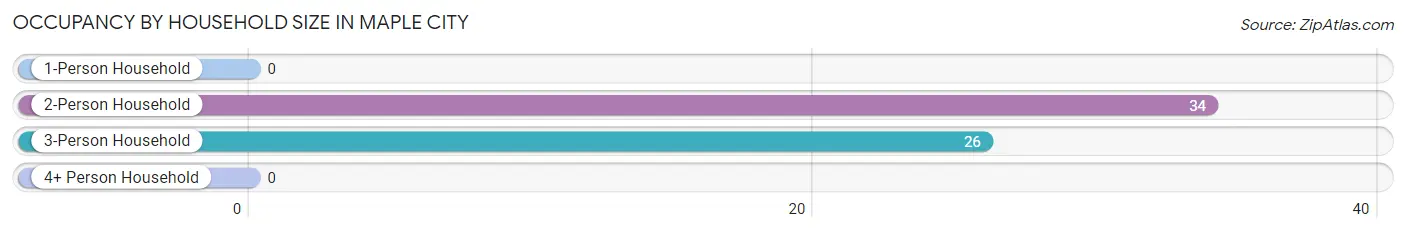
| Household Size | # Housing Units | % Housing Units |
| 1-Person Household | 0 | 0.0% |
| 2-Person Household | 34 | 56.7% |
| 3-Person Household | 26 | 43.3% |
| 4+ Person Household | 0 | 0.0% |
| Total Housing Units | 60 | 100.0% |
Occupancy by Ownership by Household Size in Maple City
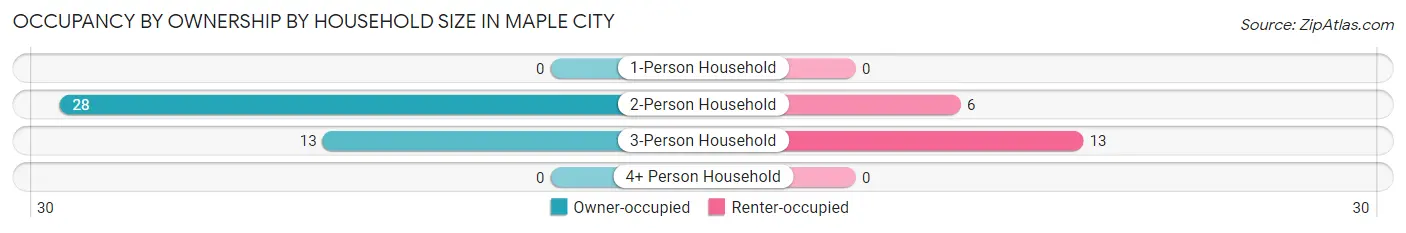
| Household Size | Owner-occupied | Renter-occupied |
| 1-Person Household | 0 (0.0%) | 0 (0.0%) |
| 2-Person Household | 28 (82.4%) | 6 (17.6%) |
| 3-Person Household | 13 (50.0%) | 13 (50.0%) |
| 4+ Person Household | 0 (0.0%) | 0 (0.0%) |
| Total Housing Units | 41 (68.3%) | 19 (31.7%) |
Occupancy by Educational Attainment in Maple City
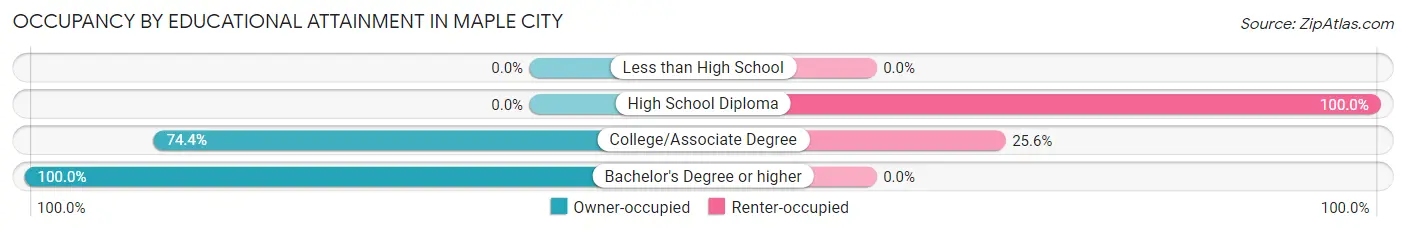
| Household Size | Owner-occupied | Renter-occupied |
| Less than High School | 0 (0.0%) | 0 (0.0%) |
| High School Diploma | 0 (0.0%) | 8 (100.0%) |
| College/Associate Degree | 32 (74.4%) | 11 (25.6%) |
| Bachelor's Degree or higher | 9 (100.0%) | 0 (0.0%) |
Occupancy by Age of Householder in Maple City
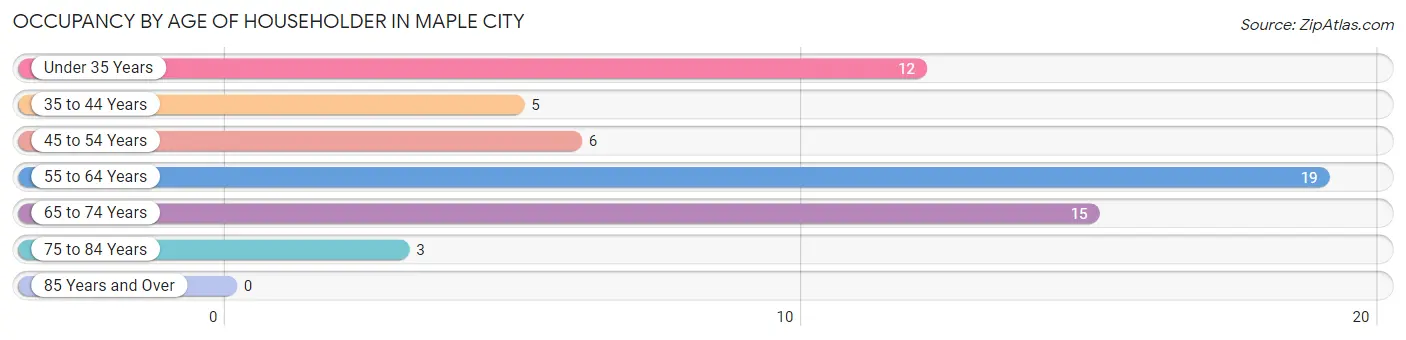
| Age Bracket | # Households | % Households |
| Under 35 Years | 12 | 20.0% |
| 35 to 44 Years | 5 | 8.3% |
| 45 to 54 Years | 6 | 10.0% |
| 55 to 64 Years | 19 | 31.7% |
| 65 to 74 Years | 15 | 25.0% |
| 75 to 84 Years | 3 | 5.0% |
| 85 Years and Over | 0 | 0.0% |
| Total | 60 | 100.0% |
Housing Finances in Maple City
Median Income by Occupancy in Maple City
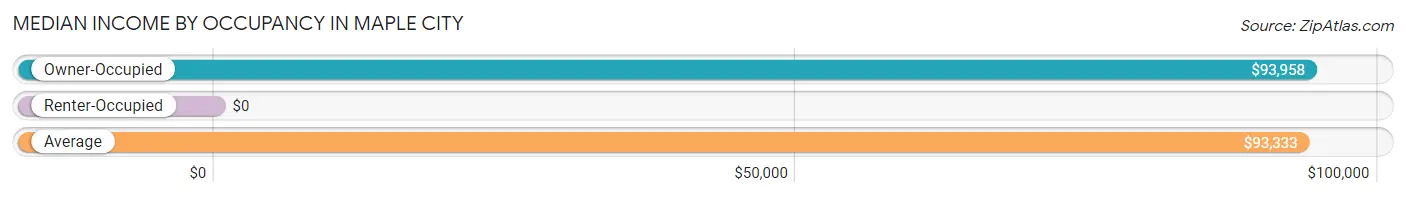
| Occupancy Type | # Households | Median Income |
| Owner-Occupied | 41 (68.3%) | $93,958 |
| Renter-Occupied | 19 (31.7%) | $0 |
| Average | 60 (100.0%) | $93,333 |
Occupancy by Householder Income Bracket in Maple City
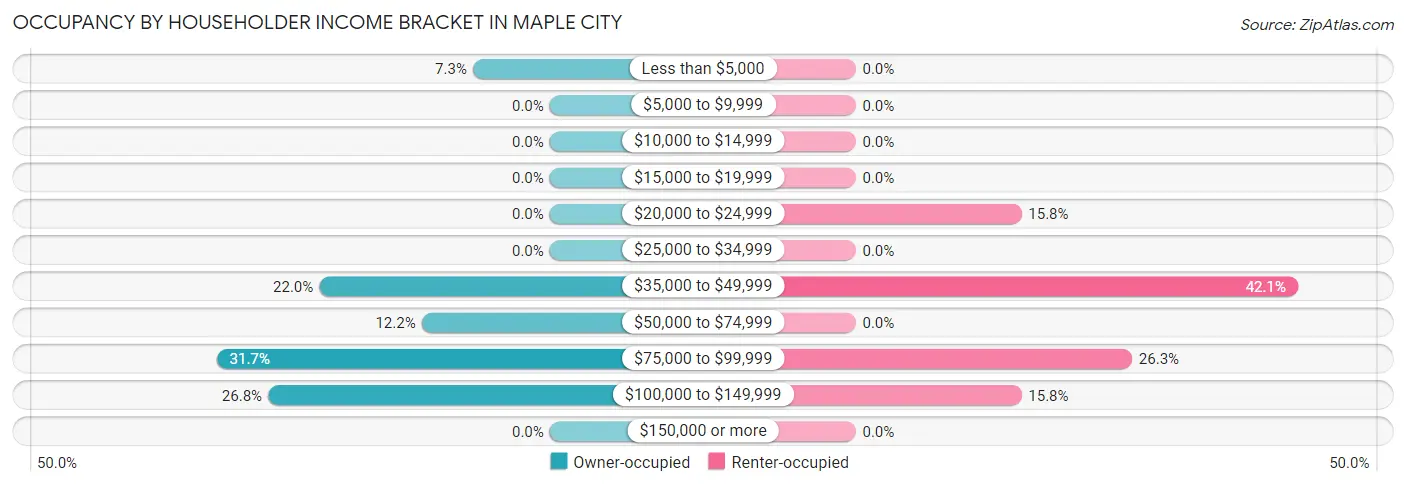
| Income Bracket | Owner-occupied | Renter-occupied |
| Less than $5,000 | 3 (7.3%) | 0 (0.0%) |
| $5,000 to $9,999 | 0 (0.0%) | 0 (0.0%) |
| $10,000 to $14,999 | 0 (0.0%) | 0 (0.0%) |
| $15,000 to $19,999 | 0 (0.0%) | 0 (0.0%) |
| $20,000 to $24,999 | 0 (0.0%) | 3 (15.8%) |
| $25,000 to $34,999 | 0 (0.0%) | 0 (0.0%) |
| $35,000 to $49,999 | 9 (22.0%) | 8 (42.1%) |
| $50,000 to $74,999 | 5 (12.2%) | 0 (0.0%) |
| $75,000 to $99,999 | 13 (31.7%) | 5 (26.3%) |
| $100,000 to $149,999 | 11 (26.8%) | 3 (15.8%) |
| $150,000 or more | 0 (0.0%) | 0 (0.0%) |
| Total | 41 (100.0%) | 19 (100.0%) |
Monthly Housing Cost Tiers in Maple City
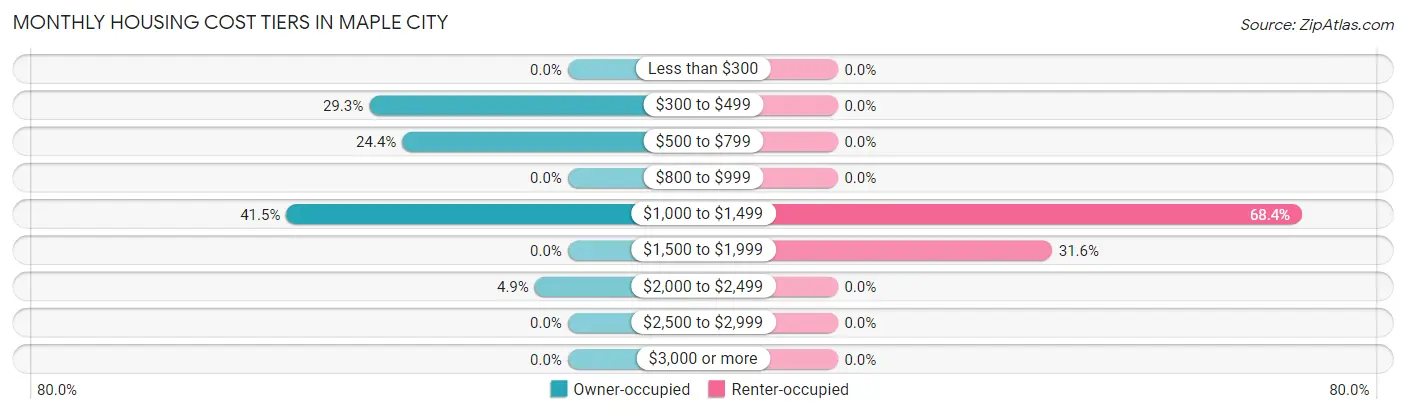
| Monthly Cost | Owner-occupied | Renter-occupied |
| Less than $300 | 0 (0.0%) | 0 (0.0%) |
| $300 to $499 | 12 (29.3%) | 0 (0.0%) |
| $500 to $799 | 10 (24.4%) | 0 (0.0%) |
| $800 to $999 | 0 (0.0%) | 0 (0.0%) |
| $1,000 to $1,499 | 17 (41.5%) | 13 (68.4%) |
| $1,500 to $1,999 | 0 (0.0%) | 6 (31.6%) |
| $2,000 to $2,499 | 2 (4.9%) | 0 (0.0%) |
| $2,500 to $2,999 | 0 (0.0%) | 0 (0.0%) |
| $3,000 or more | 0 (0.0%) | 0 (0.0%) |
| Total | 41 (100.0%) | 19 (100.0%) |
Physical Housing Characteristics in Maple City
Housing Structures in Maple City
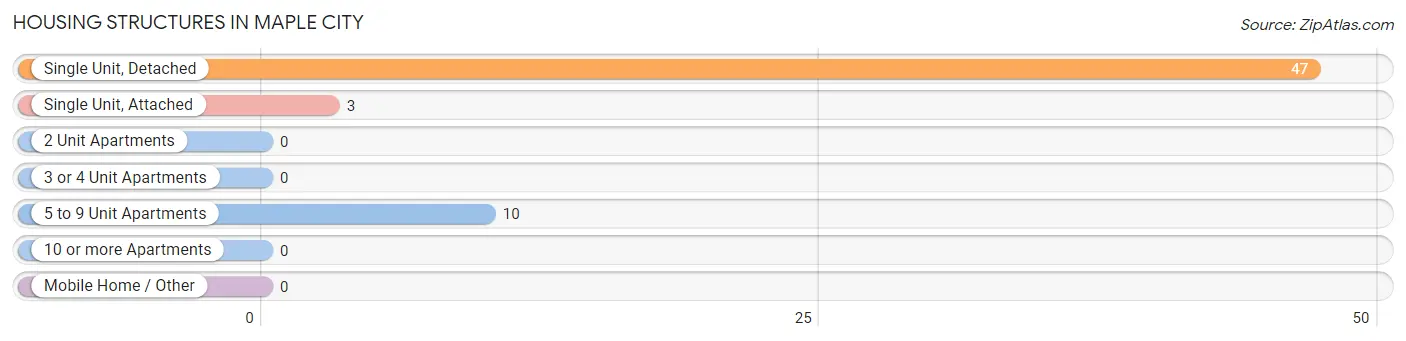
| Structure Type | # Housing Units | % Housing Units |
| Single Unit, Detached | 47 | 78.3% |
| Single Unit, Attached | 3 | 5.0% |
| 2 Unit Apartments | 0 | 0.0% |
| 3 or 4 Unit Apartments | 0 | 0.0% |
| 5 to 9 Unit Apartments | 10 | 16.7% |
| 10 or more Apartments | 0 | 0.0% |
| Mobile Home / Other | 0 | 0.0% |
| Total | 60 | 100.0% |
Housing Structures by Occupancy in Maple City
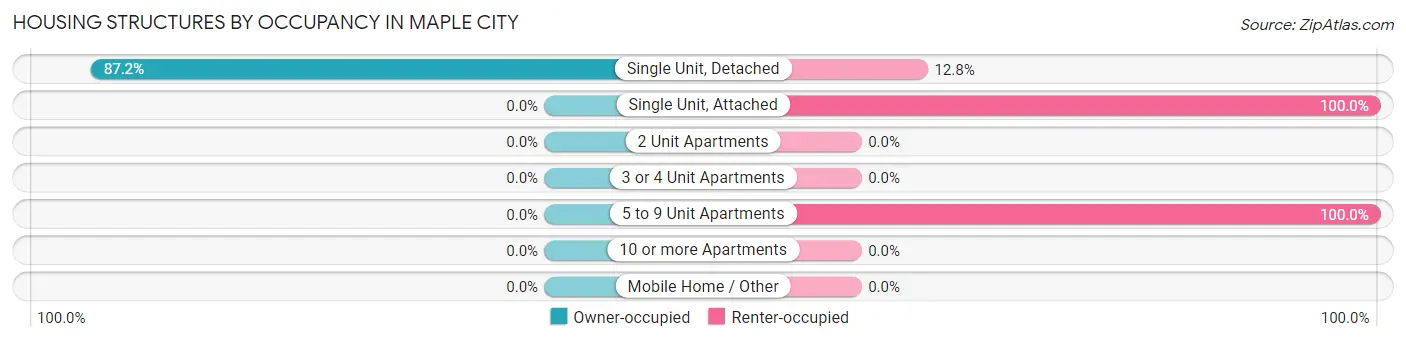
| Structure Type | Owner-occupied | Renter-occupied |
| Single Unit, Detached | 41 (87.2%) | 6 (12.8%) |
| Single Unit, Attached | 0 (0.0%) | 3 (100.0%) |
| 2 Unit Apartments | 0 (0.0%) | 0 (0.0%) |
| 3 or 4 Unit Apartments | 0 (0.0%) | 0 (0.0%) |
| 5 to 9 Unit Apartments | 0 (0.0%) | 10 (100.0%) |
| 10 or more Apartments | 0 (0.0%) | 0 (0.0%) |
| Mobile Home / Other | 0 (0.0%) | 0 (0.0%) |
| Total | 41 (68.3%) | 19 (31.7%) |
Housing Structures by Number of Rooms in Maple City
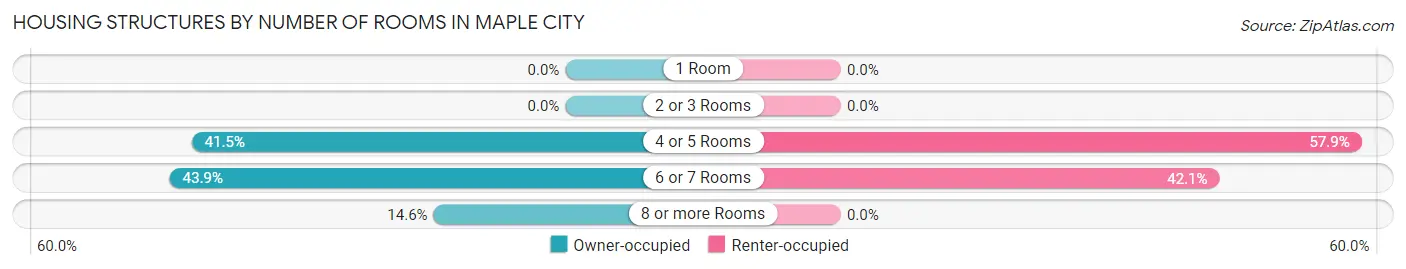
| Number of Rooms | Owner-occupied | Renter-occupied |
| 1 Room | 0 (0.0%) | 0 (0.0%) |
| 2 or 3 Rooms | 0 (0.0%) | 0 (0.0%) |
| 4 or 5 Rooms | 17 (41.5%) | 11 (57.9%) |
| 6 or 7 Rooms | 18 (43.9%) | 8 (42.1%) |
| 8 or more Rooms | 6 (14.6%) | 0 (0.0%) |
| Total | 41 (100.0%) | 19 (100.0%) |
Housing Structure by Heating Type in Maple City
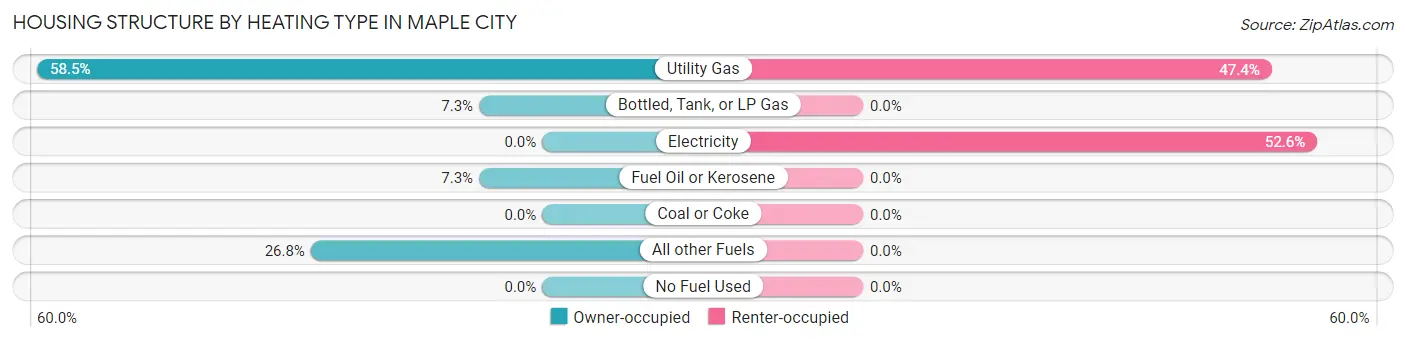
| Heating Type | Owner-occupied | Renter-occupied |
| Utility Gas | 24 (58.5%) | 9 (47.4%) |
| Bottled, Tank, or LP Gas | 3 (7.3%) | 0 (0.0%) |
| Electricity | 0 (0.0%) | 10 (52.6%) |
| Fuel Oil or Kerosene | 3 (7.3%) | 0 (0.0%) |
| Coal or Coke | 0 (0.0%) | 0 (0.0%) |
| All other Fuels | 11 (26.8%) | 0 (0.0%) |
| No Fuel Used | 0 (0.0%) | 0 (0.0%) |
| Total | 41 (100.0%) | 19 (100.0%) |
Household Vehicle Usage in Maple City
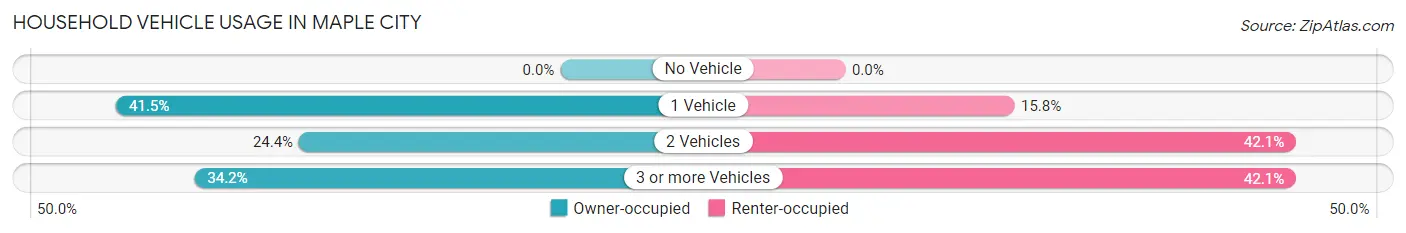
| Vehicles per Household | Owner-occupied | Renter-occupied |
| No Vehicle | 0 (0.0%) | 0 (0.0%) |
| 1 Vehicle | 17 (41.5%) | 3 (15.8%) |
| 2 Vehicles | 10 (24.4%) | 8 (42.1%) |
| 3 or more Vehicles | 14 (34.2%) | 8 (42.1%) |
| Total | 41 (100.0%) | 19 (100.0%) |
Real Estate & Mortgages in Maple City
Real Estate and Mortgage Overview in Maple City
| Characteristic | Without Mortgage | With Mortgage |
| Housing Units | 19 | 22 |
| Median Property Value | - | - |
| Median Household Income | $72,917 | $0 |
| Monthly Housing Costs | $417 | $0 |
| Real Estate Taxes | - | - |
Property Value by Mortgage Status in Maple City
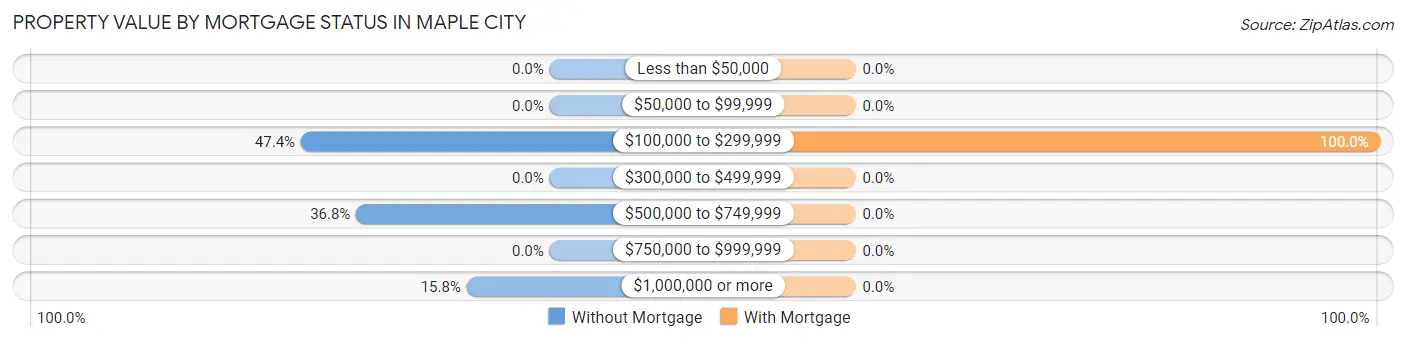
| Property Value | Without Mortgage | With Mortgage |
| Less than $50,000 | 0 (0.0%) | 0 (0.0%) |
| $50,000 to $99,999 | 0 (0.0%) | 0 (0.0%) |
| $100,000 to $299,999 | 9 (47.4%) | 22 (100.0%) |
| $300,000 to $499,999 | 0 (0.0%) | 0 (0.0%) |
| $500,000 to $749,999 | 7 (36.8%) | 0 (0.0%) |
| $750,000 to $999,999 | 0 (0.0%) | 0 (0.0%) |
| $1,000,000 or more | 3 (15.8%) | 0 (0.0%) |
| Total | 19 (100.0%) | 22 (100.0%) |
Household Income by Mortgage Status in Maple City
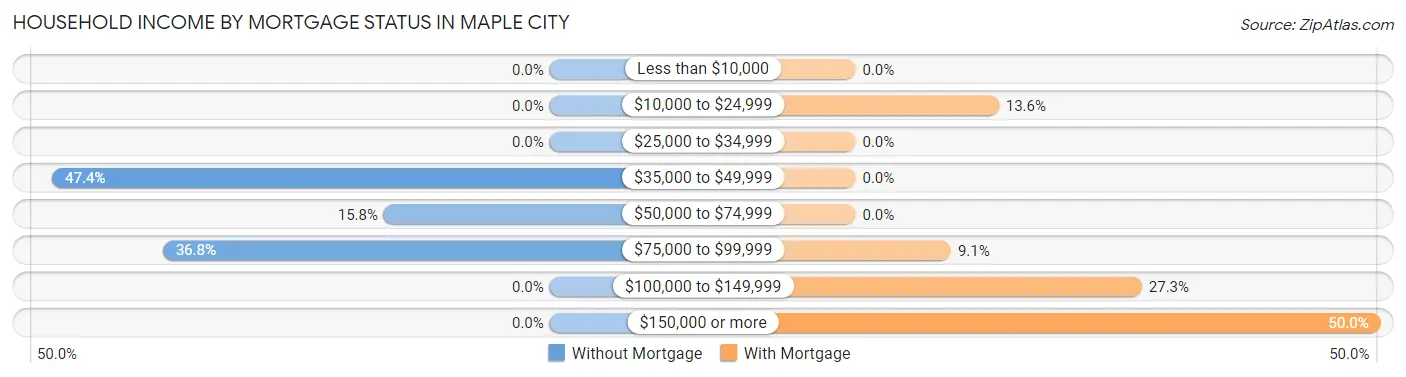
| Household Income | Without Mortgage | With Mortgage |
| Less than $10,000 | 0 (0.0%) | 0 (0.0%) |
| $10,000 to $24,999 | 0 (0.0%) | 3 (13.6%) |
| $25,000 to $34,999 | 0 (0.0%) | 0 (0.0%) |
| $35,000 to $49,999 | 9 (47.4%) | 0 (0.0%) |
| $50,000 to $74,999 | 3 (15.8%) | 0 (0.0%) |
| $75,000 to $99,999 | 7 (36.8%) | 2 (9.1%) |
| $100,000 to $149,999 | 0 (0.0%) | 6 (27.3%) |
| $150,000 or more | 0 (0.0%) | 11 (50.0%) |
| Total | 19 (100.0%) | 22 (100.0%) |
Property Value to Household Income Ratio in Maple City
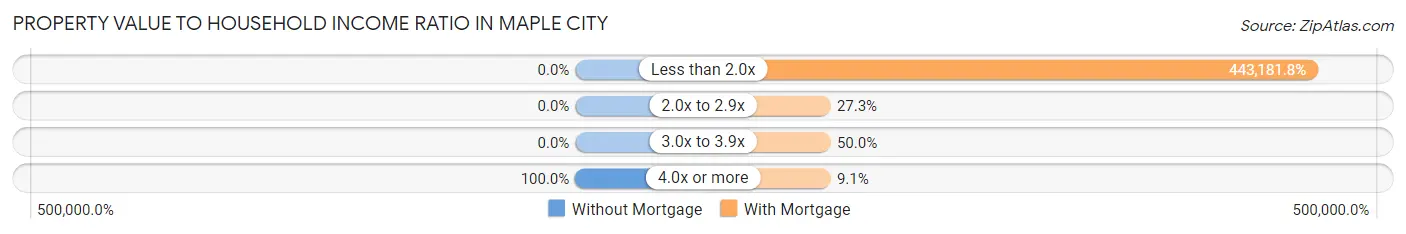
| Value-to-Income Ratio | Without Mortgage | With Mortgage |
| Less than 2.0x | 0 (0.0%) | 97,500 (443,181.8%) |
| 2.0x to 2.9x | 0 (0.0%) | 6 (27.3%) |
| 3.0x to 3.9x | 0 (0.0%) | 11 (50.0%) |
| 4.0x or more | 19 (100.0%) | 2 (9.1%) |
| Total | 19 (100.0%) | 22 (100.0%) |
Real Estate Taxes by Mortgage Status in Maple City
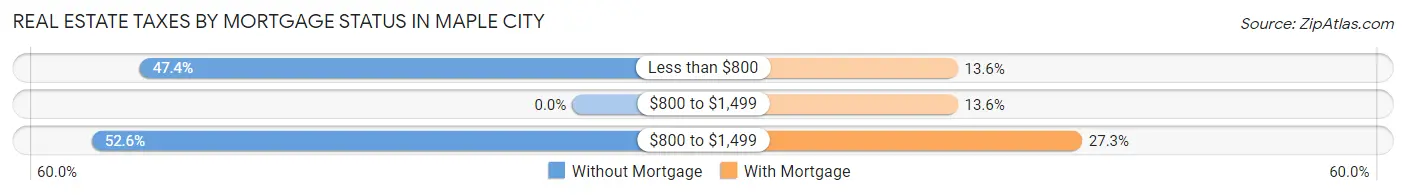
| Property Taxes | Without Mortgage | With Mortgage |
| Less than $800 | 9 (47.4%) | 3 (13.6%) |
| $800 to $1,499 | 0 (0.0%) | 3 (13.6%) |
| $800 to $1,499 | 10 (52.6%) | 6 (27.3%) |
| Total | 19 (100.0%) | 22 (100.0%) |
Health & Disability in Maple City
Health Insurance Coverage by Age in Maple City
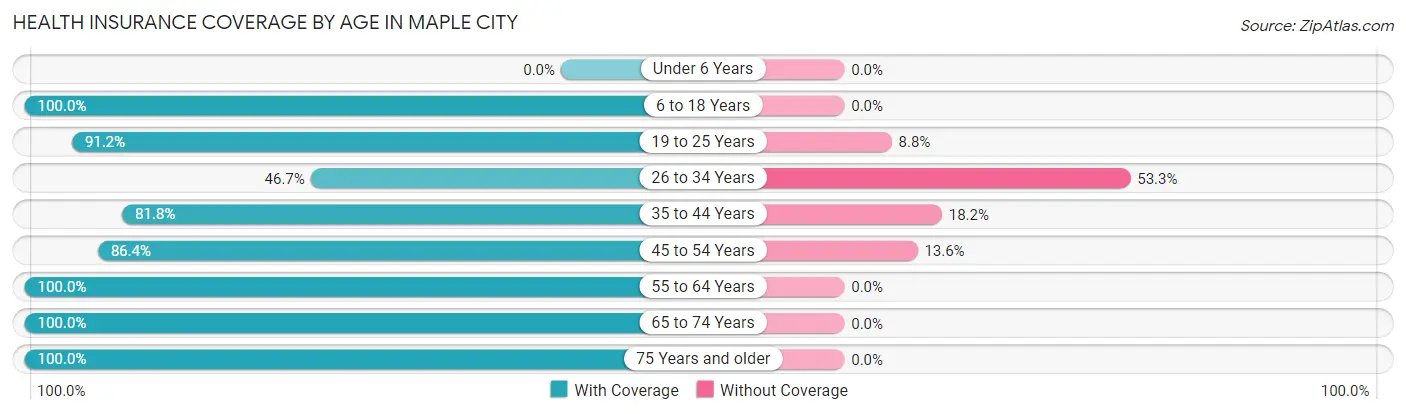
| Age Bracket | With Coverage | Without Coverage |
| Under 6 Years | 0 (0.0%) | 0 (0.0%) |
| 6 to 18 Years | 8 (100.0%) | 0 (0.0%) |
| 19 to 25 Years | 31 (91.2%) | 3 (8.8%) |
| 26 to 34 Years | 7 (46.7%) | 8 (53.3%) |
| 35 to 44 Years | 9 (81.8%) | 2 (18.2%) |
| 45 to 54 Years | 19 (86.4%) | 3 (13.6%) |
| 55 to 64 Years | 43 (100.0%) | 0 (0.0%) |
| 65 to 74 Years | 21 (100.0%) | 0 (0.0%) |
| 75 Years and older | 10 (100.0%) | 0 (0.0%) |
| Total | 148 (90.2%) | 16 (9.8%) |
Health Insurance Coverage by Citizenship Status in Maple City
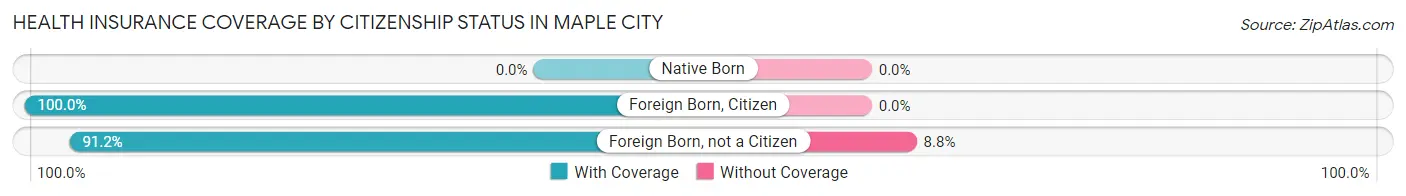
| Citizenship Status | With Coverage | Without Coverage |
| Native Born | 0 (0.0%) | 0 (0.0%) |
| Foreign Born, Citizen | 8 (100.0%) | 0 (0.0%) |
| Foreign Born, not a Citizen | 31 (91.2%) | 3 (8.8%) |
Health Insurance Coverage by Household Income in Maple City
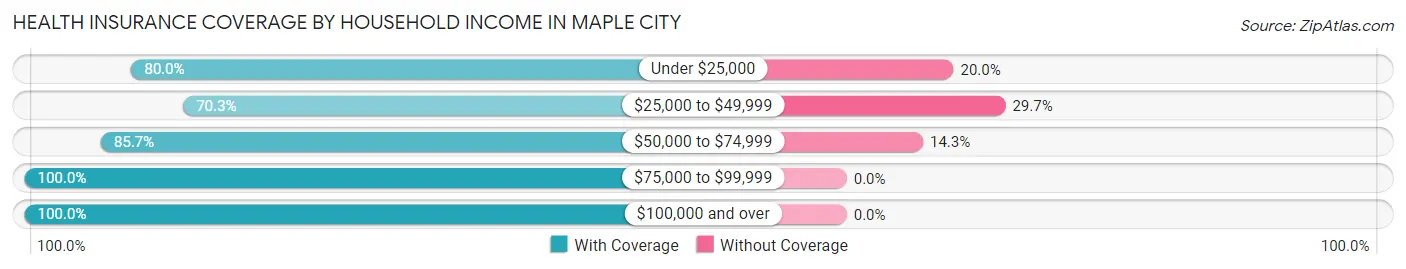
| Household Income | With Coverage | Without Coverage |
| Under $25,000 | 12 (80.0%) | 3 (20.0%) |
| $25,000 to $49,999 | 26 (70.3%) | 11 (29.7%) |
| $50,000 to $74,999 | 12 (85.7%) | 2 (14.3%) |
| $75,000 to $99,999 | 40 (100.0%) | 0 (0.0%) |
| $100,000 and over | 58 (100.0%) | 0 (0.0%) |
Public vs Private Health Insurance Coverage by Age in Maple City
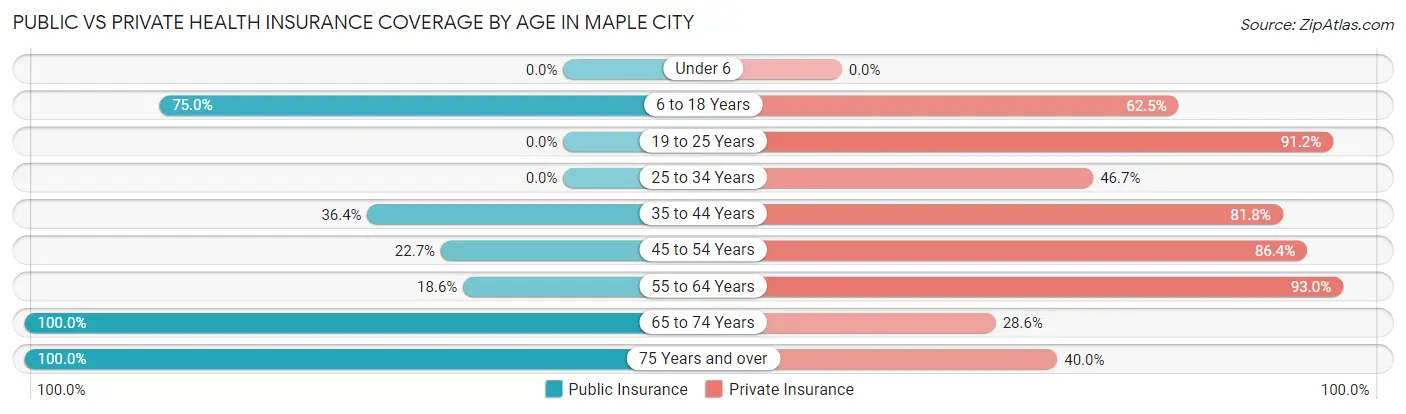
| Age Bracket | Public Insurance | Private Insurance |
| Under 6 | 0 (0.0%) | 0 (0.0%) |
| 6 to 18 Years | 6 (75.0%) | 5 (62.5%) |
| 19 to 25 Years | 0 (0.0%) | 31 (91.2%) |
| 25 to 34 Years | 0 (0.0%) | 7 (46.7%) |
| 35 to 44 Years | 4 (36.4%) | 9 (81.8%) |
| 45 to 54 Years | 5 (22.7%) | 19 (86.4%) |
| 55 to 64 Years | 8 (18.6%) | 40 (93.0%) |
| 65 to 74 Years | 21 (100.0%) | 6 (28.6%) |
| 75 Years and over | 10 (100.0%) | 4 (40.0%) |
| Total | 54 (32.9%) | 121 (73.8%) |
Disability Status by Sex by Age in Maple City
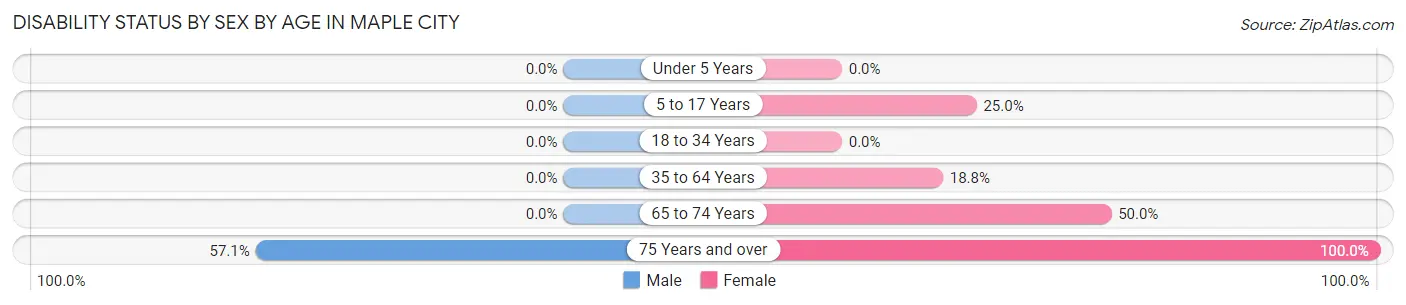
| Age Bracket | Male | Female |
| Under 5 Years | 0 (0.0%) | 0 (0.0%) |
| 5 to 17 Years | 0 (0.0%) | 2 (25.0%) |
| 18 to 34 Years | 0 (0.0%) | 0 (0.0%) |
| 35 to 64 Years | 0 (0.0%) | 6 (18.8%) |
| 65 to 74 Years | 0 (0.0%) | 9 (50.0%) |
| 75 Years and over | 4 (57.1%) | 3 (100.0%) |
Disability Class by Sex by Age in Maple City
Disability Class: Hearing Difficulty
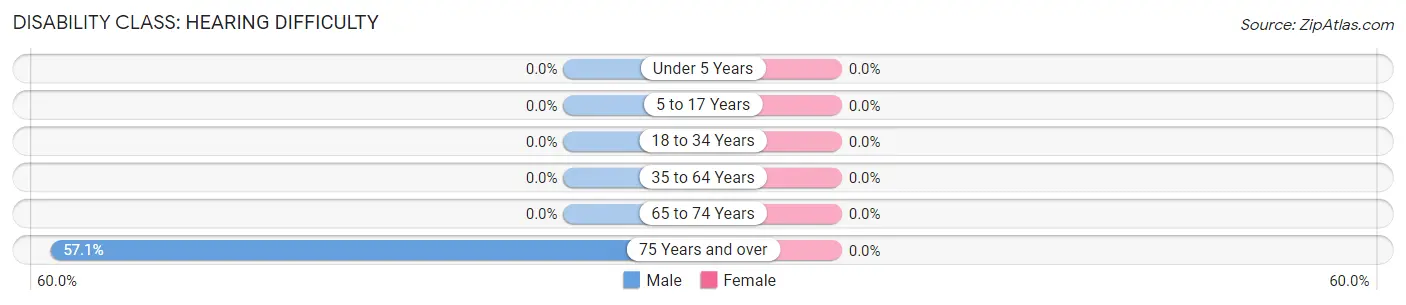
| Age Bracket | Male | Female |
| Under 5 Years | 0 (0.0%) | 0 (0.0%) |
| 5 to 17 Years | 0 (0.0%) | 0 (0.0%) |
| 18 to 34 Years | 0 (0.0%) | 0 (0.0%) |
| 35 to 64 Years | 0 (0.0%) | 0 (0.0%) |
| 65 to 74 Years | 0 (0.0%) | 0 (0.0%) |
| 75 Years and over | 4 (57.1%) | 0 (0.0%) |
Disability Class: Vision Difficulty
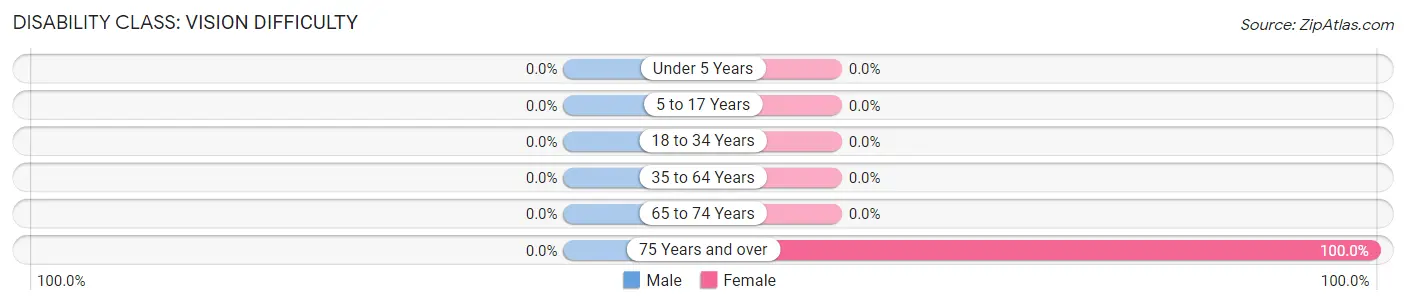
| Age Bracket | Male | Female |
| Under 5 Years | 0 (0.0%) | 0 (0.0%) |
| 5 to 17 Years | 0 (0.0%) | 0 (0.0%) |
| 18 to 34 Years | 0 (0.0%) | 0 (0.0%) |
| 35 to 64 Years | 0 (0.0%) | 0 (0.0%) |
| 65 to 74 Years | 0 (0.0%) | 0 (0.0%) |
| 75 Years and over | 0 (0.0%) | 3 (100.0%) |
Disability Class: Cognitive Difficulty
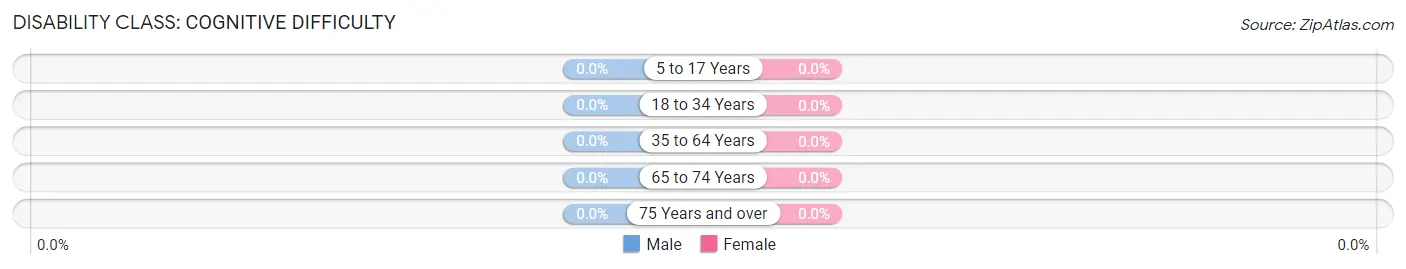
| Age Bracket | Male | Female |
| 5 to 17 Years | 0 (0.0%) | 0 (0.0%) |
| 18 to 34 Years | 0 (0.0%) | 0 (0.0%) |
| 35 to 64 Years | 0 (0.0%) | 0 (0.0%) |
| 65 to 74 Years | 0 (0.0%) | 0 (0.0%) |
| 75 Years and over | 0 (0.0%) | 0 (0.0%) |
Disability Class: Ambulatory Difficulty
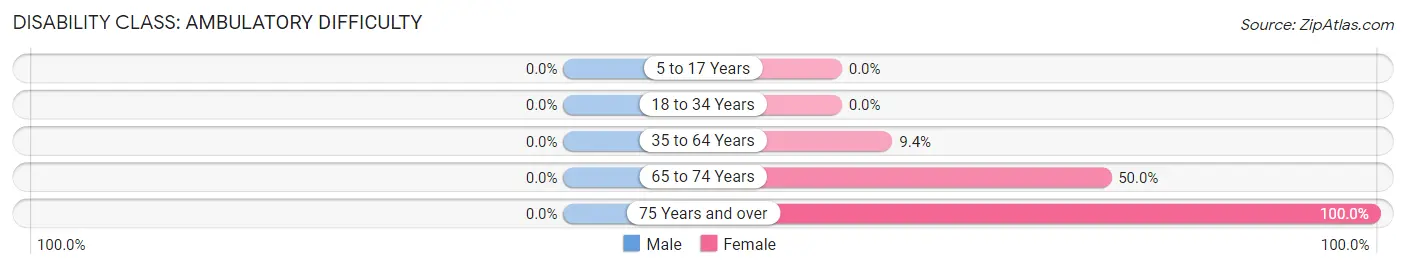
| Age Bracket | Male | Female |
| 5 to 17 Years | 0 (0.0%) | 0 (0.0%) |
| 18 to 34 Years | 0 (0.0%) | 0 (0.0%) |
| 35 to 64 Years | 0 (0.0%) | 3 (9.4%) |
| 65 to 74 Years | 0 (0.0%) | 9 (50.0%) |
| 75 Years and over | 0 (0.0%) | 3 (100.0%) |
Disability Class: Self-Care Difficulty
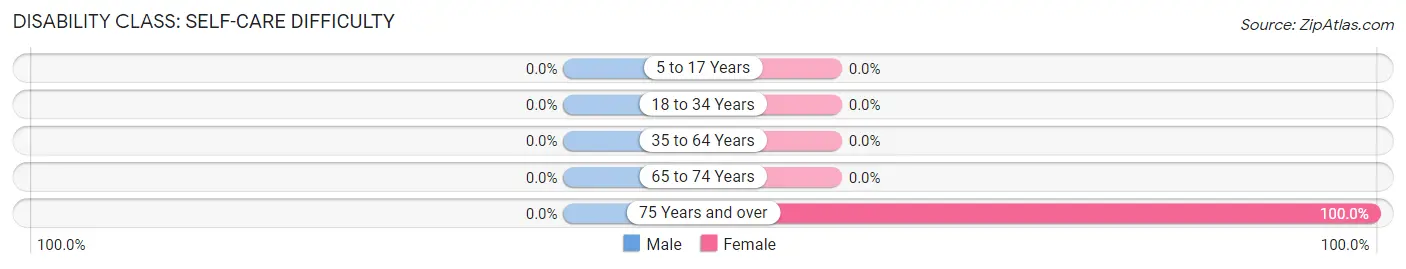
| Age Bracket | Male | Female |
| 5 to 17 Years | 0 (0.0%) | 0 (0.0%) |
| 18 to 34 Years | 0 (0.0%) | 0 (0.0%) |
| 35 to 64 Years | 0 (0.0%) | 0 (0.0%) |
| 65 to 74 Years | 0 (0.0%) | 0 (0.0%) |
| 75 Years and over | 0 (0.0%) | 3 (100.0%) |
Technology Access in Maple City
Computing Device Access in Maple City
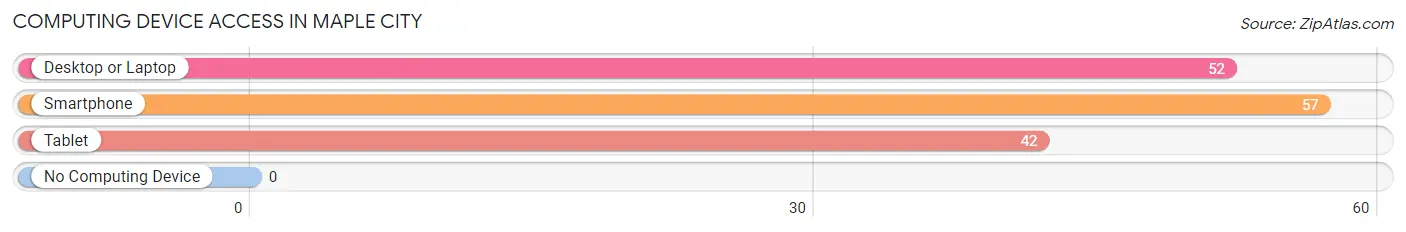
| Device Type | # Households | % Households |
| Desktop or Laptop | 52 | 86.7% |
| Smartphone | 57 | 95.0% |
| Tablet | 42 | 70.0% |
| No Computing Device | 0 | 0.0% |
| Total | 60 | 100.0% |
Internet Access in Maple City
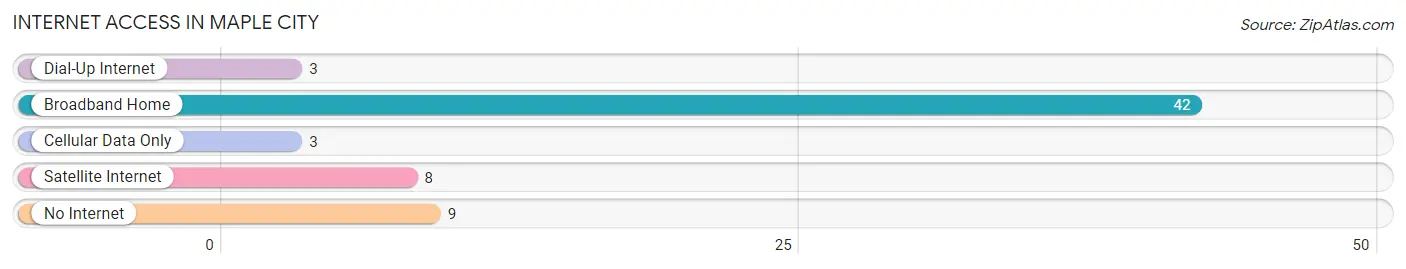
| Internet Type | # Households | % Households |
| Dial-Up Internet | 3 | 5.0% |
| Broadband Home | 42 | 70.0% |
| Cellular Data Only | 3 | 5.0% |
| Satellite Internet | 8 | 13.3% |
| No Internet | 9 | 15.0% |
| Total | 60 | 100.0% |
Maple City Summary
Maple City, Michigan is a small town located in the northern part of the state, in Leelanau County. It is situated on the shores of Lake Michigan, and is surrounded by rolling hills and forests. The town has a population of just over 1,000 people, and is known for its quaint charm and rural atmosphere.
History
Maple City was founded in 1871 by a group of settlers from Ohio. The town was originally called “Maple Grove”, but the name was changed to Maple City in 1876. The town was incorporated in 1881, and the first mayor was elected in 1882.
The town grew slowly over the years, and by the early 1900s, it had become a popular summer destination for tourists. The town was known for its beautiful beaches, and many people came to enjoy the lake and the surrounding countryside.
In the 1950s, the town began to experience a decline in population, as many people moved away to larger cities. However, in the late 1970s, the town began to experience a resurgence in popularity, as people began to move back to the area.
Geography
Maple City is located in the northern part of Michigan, in Leelanau County. It is situated on the shores of Lake Michigan, and is surrounded by rolling hills and forests. The town is located about 30 miles north of Traverse City, and is about a two-hour drive from Detroit.
The town is situated on a peninsula, and is bordered by the lake on three sides. The town is home to several parks, including Maple City Park, which is located on the lakefront. The park features a beach, picnic areas, and a playground.
Economy
The economy of Maple City is largely based on tourism. The town is a popular destination for visitors who come to enjoy the lake and the surrounding countryside. The town is also home to several small businesses, including restaurants, shops, and galleries.
The town is also home to several wineries, which produce a variety of wines. The town is also home to several fruit farms, which produce apples, cherries, and other fruits.
Demographics
As of the 2010 census, the population of Maple City was 1,072. The town is predominantly white, with 95.3% of the population identifying as such. The town is also home to a small Hispanic population, with 2.3% of the population identifying as Hispanic or Latino.
The median household income in Maple City is $45,000, and the median home value is $150,000. The town has a low unemployment rate, with only 4.2% of the population unemployed.
Conclusion
Maple City, Michigan is a small town located in the northern part of the state, in Leelanau County. It is situated on the shores of Lake Michigan, and is surrounded by rolling hills and forests. The town has a population of just over 1,000 people, and is known for its quaint charm and rural atmosphere. The town’s economy is largely based on tourism, and it is home to several small businesses, wineries, and fruit farms. The town is predominantly white, with a small Hispanic population. The median household income in Maple City is $45,000, and the median home value is $150,000.
Common Questions
What is Per Capita Income in Maple City?
Per Capita income in Maple City is $27,076.
What is the Median Family Income in Maple City?
Median Family Income in Maple City is $96,250.
What is the Median Household income in Maple City?
Median Household Income in Maple City is $93,333.
What is Income or Wage Gap in Maple City?
Income or Wage Gap in Maple City is 47.3%.
Women in Maple City earn 52.7 cents for every dollar earned by a man.
What is Inequality or Gini Index in Maple City?
Inequality or Gini Index in Maple City is 0.25.
What is the Total Population of Maple City?
Total Population of Maple City is 164.
What is the Total Male Population of Maple City?
Total Male Population of Maple City is 63.
What is the Total Female Population of Maple City?
Total Female Population of Maple City is 101.
What is the Ratio of Males per 100 Females in Maple City?
There are 62.38 Males per 100 Females in Maple City.
What is the Ratio of Females per 100 Males in Maple City?
There are 160.32 Females per 100 Males in Maple City.
What is the Median Population Age in Maple City?
Median Population Age in Maple City is 49.0 Years.
What is the Average Family Size in Maple City
Average Family Size in Maple City is 3.0 People.
What is the Average Household Size in Maple City
Average Household Size in Maple City is 2.7 People.
How Large is the Labor Force in Maple City?
There are 92 People in the Labor Forcein in Maple City.
What is the Percentage of People in the Labor Force in Maple City?
57.9% of People are in the Labor Force in Maple City.