Thompsonville, MI Map & Demographics
Thompsonville Map
Thompsonville Overview
$29,358
PER CAPITA INCOME
$70,875
AVG FAMILY INCOME
$58,929
AVG HOUSEHOLD INCOME
16.0%
WAGE / INCOME GAP [ % ]
84.0¢/ $1
WAGE / INCOME GAP [ $ ]
0.37
INEQUALITY / GINI INDEX
452
TOTAL POPULATION
248
MALE POPULATION
204
FEMALE POPULATION
121.57
MALES / 100 FEMALES
82.26
FEMALES / 100 MALES
41.0
MEDIAN AGE
2.9
AVG FAMILY SIZE
2.2
AVG HOUSEHOLD SIZE
237
LABOR FORCE [ PEOPLE ]
61.9%
PERCENT IN LABOR FORCE
3.0%
UNEMPLOYMENT RATE
Thompsonville Zip Codes
Thompsonville Area Codes
Income in Thompsonville
Income Overview in Thompsonville
Per Capita Income in Thompsonville is $29,358, while median incomes of families and households are $70,875 and $58,929 respectively.
| Characteristic | Number | Measure |
| Per Capita Income | 452 | $29,358 |
| Median Family Income | 117 | $70,875 |
| Mean Family Income | 117 | $74,171 |
| Median Household Income | 206 | $58,929 |
| Mean Household Income | 206 | $62,565 |
| Income Deficit | 117 | $0 |
| Wage / Income Gap (%) | 452 | 16.03% |
| Wage / Income Gap ($) | 452 | 83.97¢ per $1 |
| Gini / Inequality Index | 452 | 0.37 |
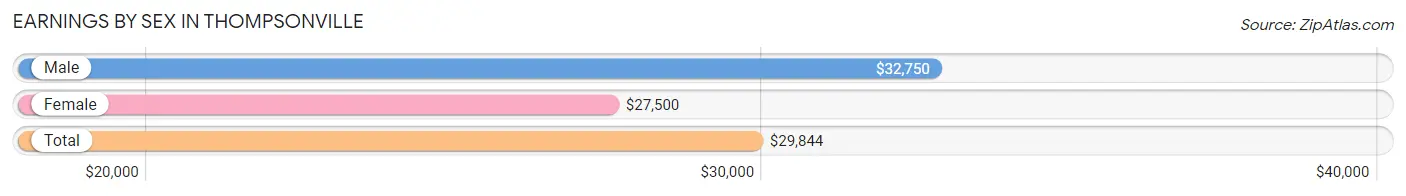
Earnings by Sex in Thompsonville
Average Earnings in Thompsonville are $29,844, $32,750 for men and $27,500 for women, a difference of 16.0%.
| Sex | Number | Average Earnings |
| Male | 141 (56.2%) | $32,750 |
| Female | 110 (43.8%) | $27,500 |
| Total | 251 (100.0%) | $29,844 |
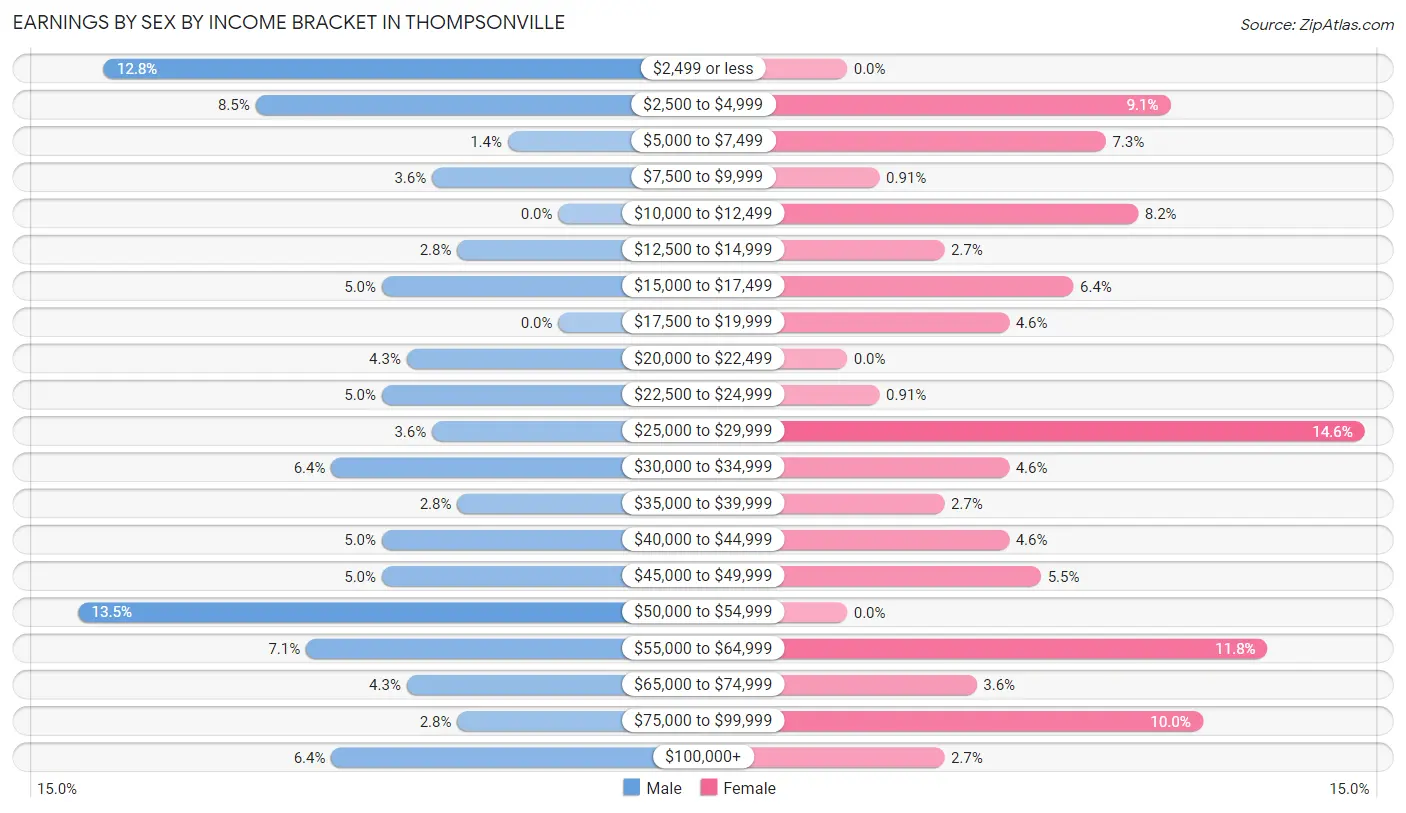
Earnings by Sex by Income Bracket in Thompsonville
The most common earnings brackets in Thompsonville are $50,000 to $54,999 for men (19 | 13.5%) and $25,000 to $29,999 for women (16 | 14.5%).
| Income | Male | Female |
| $2,499 or less | 18 (12.8%) | 0 (0.0%) |
| $2,500 to $4,999 | 12 (8.5%) | 10 (9.1%) |
| $5,000 to $7,499 | 2 (1.4%) | 8 (7.3%) |
| $7,500 to $9,999 | 5 (3.5%) | 1 (0.9%) |
| $10,000 to $12,499 | 0 (0.0%) | 9 (8.2%) |
| $12,500 to $14,999 | 4 (2.8%) | 3 (2.7%) |
| $15,000 to $17,499 | 7 (5.0%) | 7 (6.4%) |
| $17,500 to $19,999 | 0 (0.0%) | 5 (4.5%) |
| $20,000 to $22,499 | 6 (4.3%) | 0 (0.0%) |
| $22,500 to $24,999 | 7 (5.0%) | 1 (0.9%) |
| $25,000 to $29,999 | 5 (3.5%) | 16 (14.5%) |
| $30,000 to $34,999 | 9 (6.4%) | 5 (4.5%) |
| $35,000 to $39,999 | 4 (2.8%) | 3 (2.7%) |
| $40,000 to $44,999 | 7 (5.0%) | 5 (4.5%) |
| $45,000 to $49,999 | 7 (5.0%) | 6 (5.4%) |
| $50,000 to $54,999 | 19 (13.5%) | 0 (0.0%) |
| $55,000 to $64,999 | 10 (7.1%) | 13 (11.8%) |
| $65,000 to $74,999 | 6 (4.3%) | 4 (3.6%) |
| $75,000 to $99,999 | 4 (2.8%) | 11 (10.0%) |
| $100,000+ | 9 (6.4%) | 3 (2.7%) |
| Total | 141 (100.0%) | 110 (100.0%) |
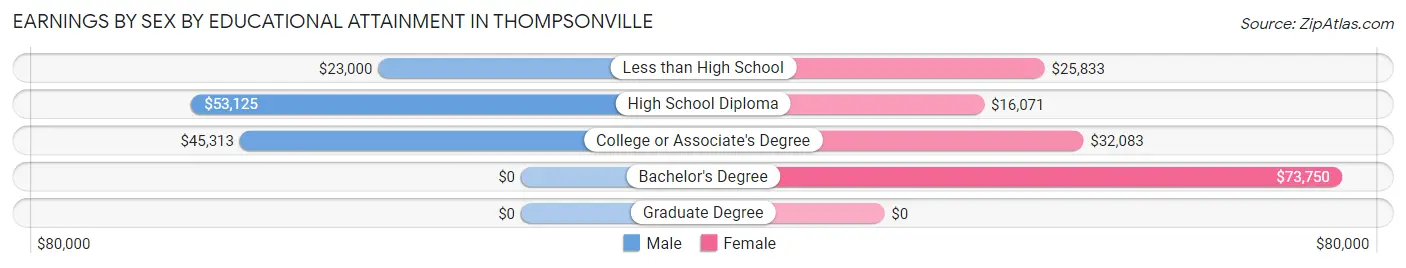
Earnings by Sex by Educational Attainment in Thompsonville
Average earnings in Thompsonville are $45,500 for men and $29,250 for women, a difference of 35.7%. Men with an educational attainment of high school diploma enjoy the highest average annual earnings of $53,125, while those with less than high school education earn the least with $23,000. Women with an educational attainment of bachelor's degree earn the most with the average annual earnings of $73,750, while those with high school diploma education have the smallest earnings of $16,071.
| Educational Attainment | Male Income | Female Income |
| Less than High School | $23,000 | $25,833 |
| High School Diploma | $53,125 | $16,071 |
| College or Associate's Degree | $45,313 | $32,083 |
| Bachelor's Degree | - | - |
| Graduate Degree | - | - |
| Total | $45,500 | $29,250 |
Family Income in Thompsonville
Family Income Brackets in Thompsonville
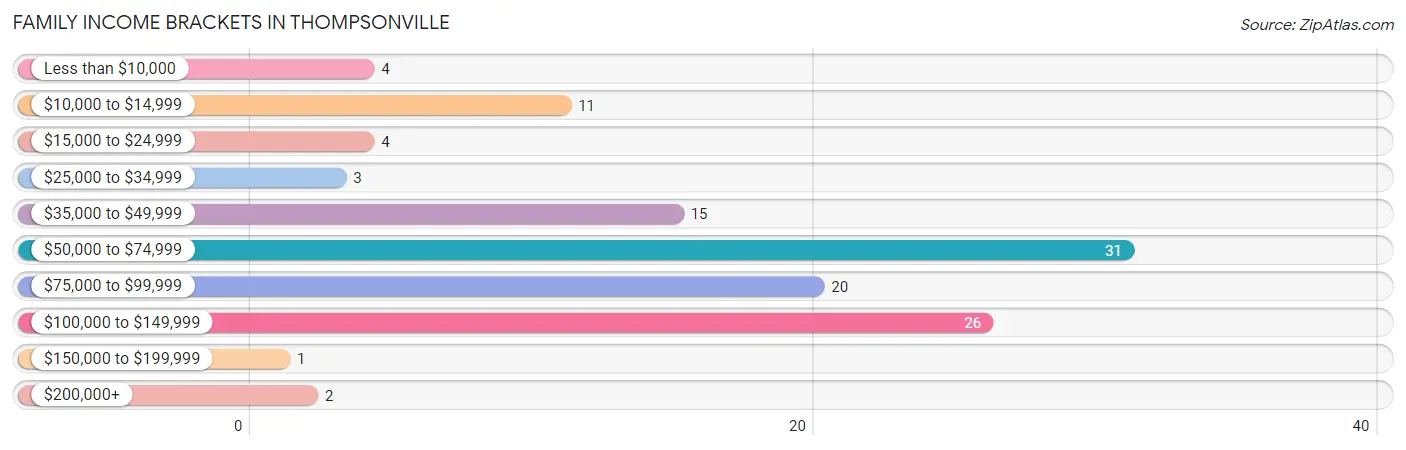
According to the Thompsonville family income data, there are 31 families falling into the $50,000 to $74,999 income range, which is the most common income bracket and makes up 26.5% of all families. Conversely, the $150,000 to $199,999 income bracket is the least frequent group with only 1 families (0.9%) belonging to this category.
| Income Bracket | # Families | % Families |
| Less than $10,000 | 4 | 3.4% |
| $10,000 to $14,999 | 11 | 9.4% |
| $15,000 to $24,999 | 4 | 3.4% |
| $25,000 to $34,999 | 3 | 2.6% |
| $35,000 to $49,999 | 15 | 12.8% |
| $50,000 to $74,999 | 31 | 26.5% |
| $75,000 to $99,999 | 20 | 17.1% |
| $100,000 to $149,999 | 26 | 22.2% |
| $150,000 to $199,999 | 1 | 0.9% |
| $200,000+ | 2 | 1.7% |
Family Income by Famaliy Size in Thompsonville
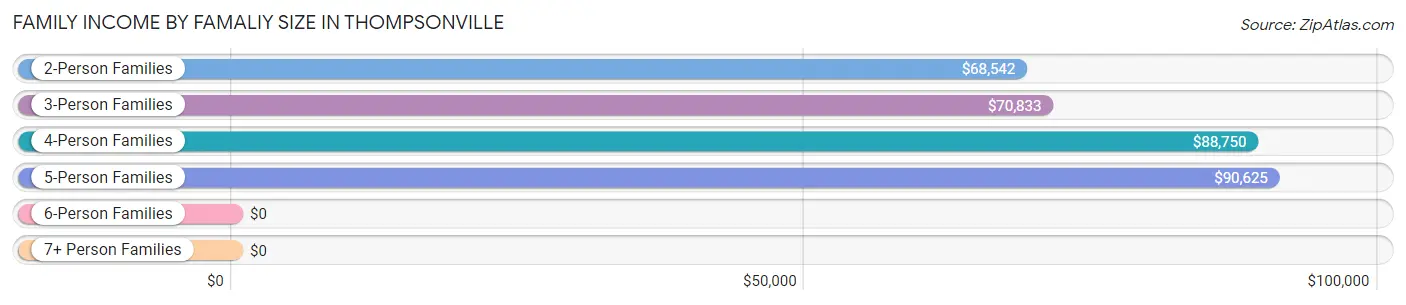
5-person families (7 | 6.0%) account for the highest median family income in Thompsonville with $90,625 per family, while 2-person families (67 | 57.3%) have the highest median income of $34,271 per family member.
| Income Bracket | # Families | Median Income |
| 2-Person Families | 67 (57.3%) | $68,542 |
| 3-Person Families | 10 (8.6%) | $70,833 |
| 4-Person Families | 30 (25.6%) | $88,750 |
| 5-Person Families | 7 (6.0%) | $90,625 |
| 6-Person Families | 3 (2.6%) | $0 |
| 7+ Person Families | 0 (0.0%) | $0 |
| Total | 117 (100.0%) | $70,875 |
Family Income by Number of Earners in Thompsonville
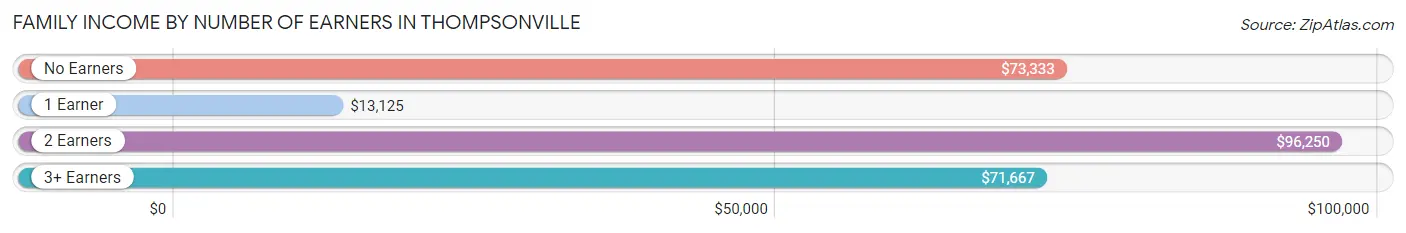
The median family income in Thompsonville is $70,875, with families comprising 2 earners (54) having the highest median family income of $96,250, while families with 1 earner (27) have the lowest median family income of $13,125, accounting for 46.2% and 23.1% of families, respectively.
| Number of Earners | # Families | Median Income |
| No Earners | 24 (20.5%) | $73,333 |
| 1 Earner | 27 (23.1%) | $13,125 |
| 2 Earners | 54 (46.2%) | $96,250 |
| 3+ Earners | 12 (10.3%) | $71,667 |
| Total | 117 (100.0%) | $70,875 |
Household Income in Thompsonville
Household Income Brackets in Thompsonville
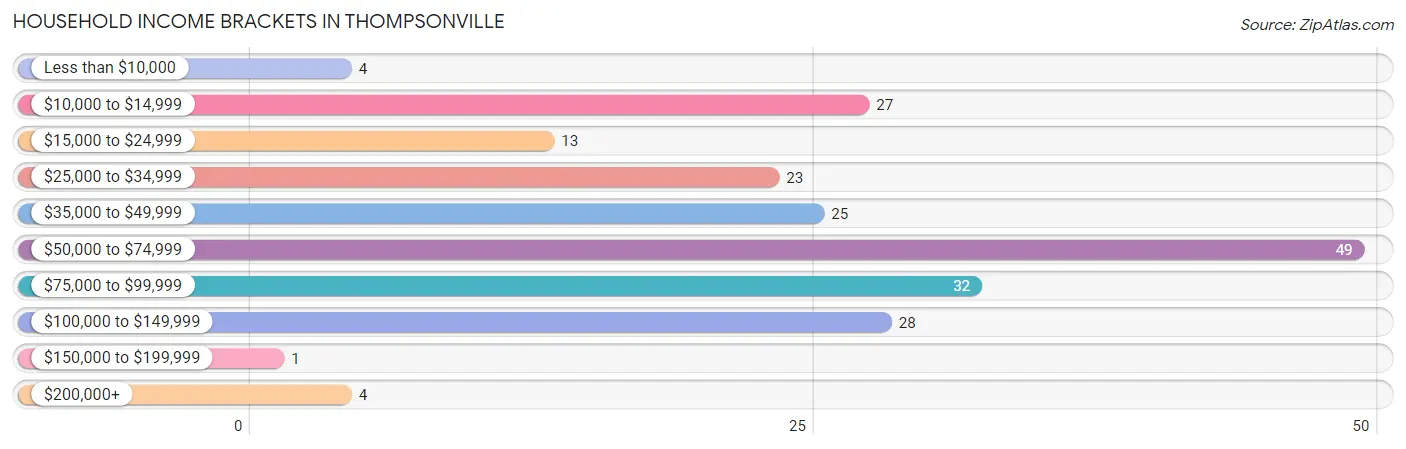
With 49 households falling in the category, the $50,000 to $74,999 income range is the most frequent in Thompsonville, accounting for 23.8% of all households. In contrast, only 1 households (0.5%) fall into the $150,000 to $199,999 income bracket, making it the least populous group.
| Income Bracket | # Households | % Households |
| Less than $10,000 | 4 | 1.9% |
| $10,000 to $14,999 | 27 | 13.1% |
| $15,000 to $24,999 | 13 | 6.3% |
| $25,000 to $34,999 | 23 | 11.2% |
| $35,000 to $49,999 | 25 | 12.1% |
| $50,000 to $74,999 | 49 | 23.8% |
| $75,000 to $99,999 | 32 | 15.5% |
| $100,000 to $149,999 | 28 | 13.6% |
| $150,000 to $199,999 | 1 | 0.5% |
| $200,000+ | 4 | 1.9% |
Household Income by Householder Age in Thompsonville
The median household income in Thompsonville is $58,929, with the highest median household income of $78,125 found in the 15 to 24 years age bracket for the primary householder. A total of 5 households (2.4%) fall into this category. Meanwhile, the 25 to 44 years age bracket for the primary householder has the lowest median household income of $47,188, with 67 households (32.5%) in this group.
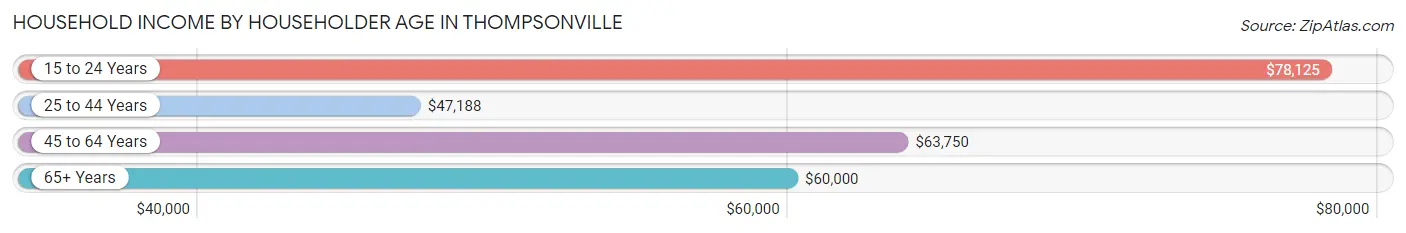
| Income Bracket | # Households | Median Income |
| 15 to 24 Years | 5 (2.4%) | $78,125 |
| 25 to 44 Years | 67 (32.5%) | $47,188 |
| 45 to 64 Years | 82 (39.8%) | $63,750 |
| 65+ Years | 52 (25.2%) | $60,000 |
| Total | 206 (100.0%) | $58,929 |
Poverty in Thompsonville
Income Below Poverty by Sex and Age in Thompsonville
With 12.9% poverty level for males and 19.6% for females among the residents of Thompsonville, 6 to 11 year old males and 16 and 17 year old females are the most vulnerable to poverty, with 7 males (43.8%) and 6 females (100.0%) in their respective age groups living below the poverty level.
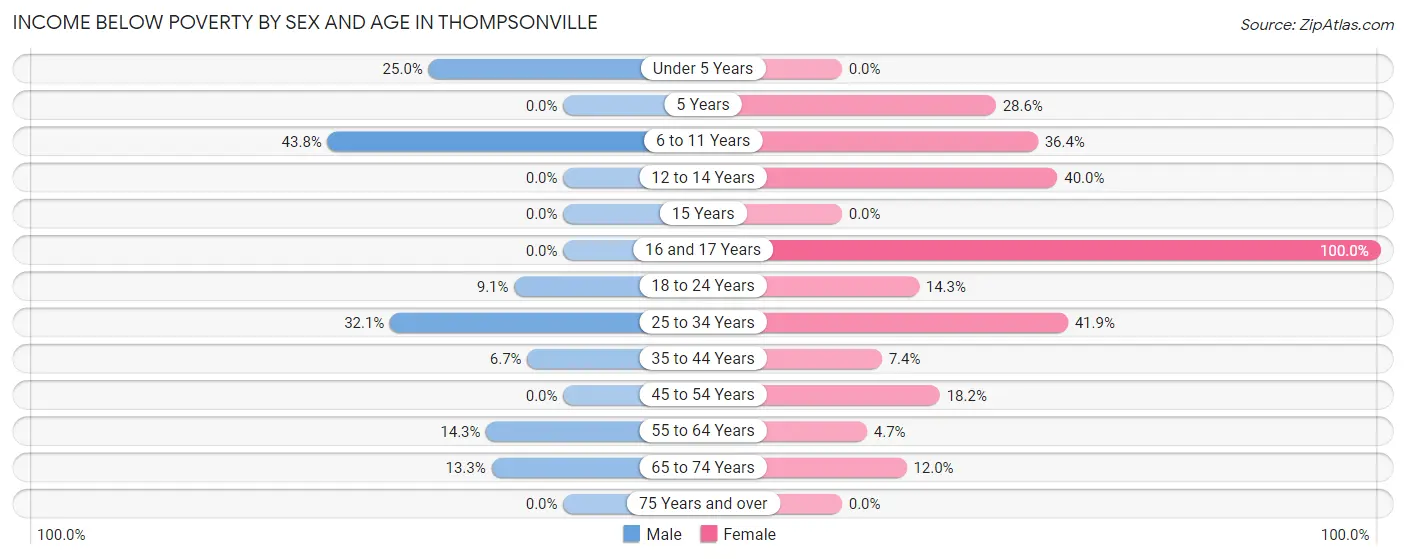
| Age Bracket | Male | Female |
| Under 5 Years | 4 (25.0%) | 0 (0.0%) |
| 5 Years | 0 (0.0%) | 2 (28.6%) |
| 6 to 11 Years | 7 (43.8%) | 4 (36.4%) |
| 12 to 14 Years | 0 (0.0%) | 2 (40.0%) |
| 15 Years | 0 (0.0%) | 0 (0.0%) |
| 16 and 17 Years | 0 (0.0%) | 6 (100.0%) |
| 18 to 24 Years | 2 (9.1%) | 2 (14.3%) |
| 25 to 34 Years | 9 (32.1%) | 13 (41.9%) |
| 35 to 44 Years | 2 (6.7%) | 2 (7.4%) |
| 45 to 54 Years | 0 (0.0%) | 4 (18.2%) |
| 55 to 64 Years | 6 (14.3%) | 2 (4.6%) |
| 65 to 74 Years | 2 (13.3%) | 3 (12.0%) |
| 75 Years and over | 0 (0.0%) | 0 (0.0%) |
| Total | 32 (12.9%) | 40 (19.6%) |
Income Above Poverty by Sex and Age in Thompsonville
According to the poverty statistics in Thompsonville, males aged 12 to 14 years and females aged under 5 years are the age groups that are most secure financially, with 100.0% of males and 100.0% of females in these age groups living above the poverty line.
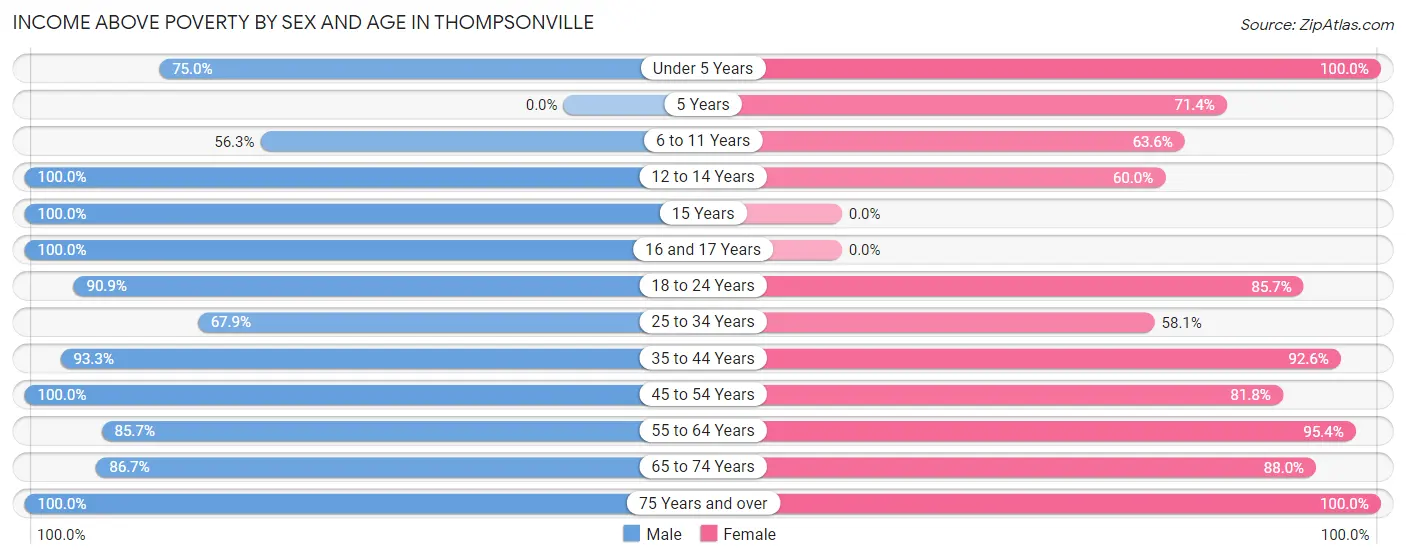
| Age Bracket | Male | Female |
| Under 5 Years | 12 (75.0%) | 3 (100.0%) |
| 5 Years | 0 (0.0%) | 5 (71.4%) |
| 6 to 11 Years | 9 (56.2%) | 7 (63.6%) |
| 12 to 14 Years | 2 (100.0%) | 3 (60.0%) |
| 15 Years | 9 (100.0%) | 0 (0.0%) |
| 16 and 17 Years | 15 (100.0%) | 0 (0.0%) |
| 18 to 24 Years | 20 (90.9%) | 12 (85.7%) |
| 25 to 34 Years | 19 (67.9%) | 18 (58.1%) |
| 35 to 44 Years | 28 (93.3%) | 25 (92.6%) |
| 45 to 54 Years | 34 (100.0%) | 18 (81.8%) |
| 55 to 64 Years | 36 (85.7%) | 41 (95.4%) |
| 65 to 74 Years | 13 (86.7%) | 22 (88.0%) |
| 75 Years and over | 19 (100.0%) | 10 (100.0%) |
| Total | 216 (87.1%) | 164 (80.4%) |
Income Below Poverty Among Married-Couple Families in Thompsonville
The poverty statistics for married-couple families in Thompsonville show that 4.5% or 4 of the total 89 families live below the poverty line. Families with 1 or 2 children have the highest poverty rate of 18.2%, comprising of 4 families. On the other hand, families with no children have the lowest poverty rate of 0.0%, which includes 0 families.
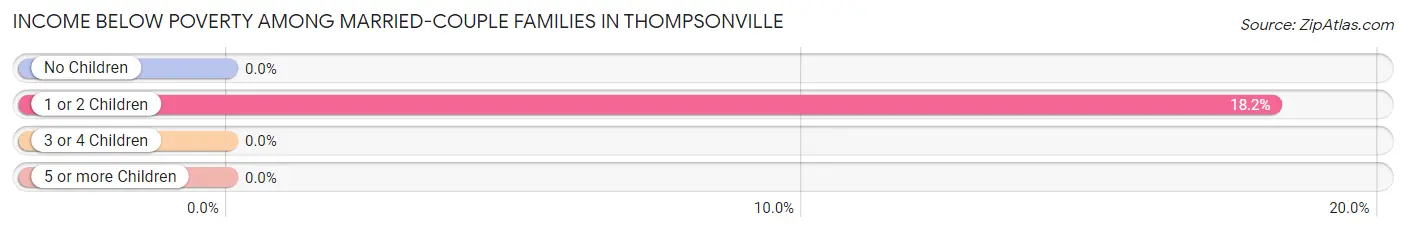
| Children | Above Poverty | Below Poverty |
| No Children | 60 (100.0%) | 0 (0.0%) |
| 1 or 2 Children | 18 (81.8%) | 4 (18.2%) |
| 3 or 4 Children | 7 (100.0%) | 0 (0.0%) |
| 5 or more Children | 0 (0.0%) | 0 (0.0%) |
| Total | 85 (95.5%) | 4 (4.5%) |
Income Below Poverty Among Single-Parent Households in Thompsonville
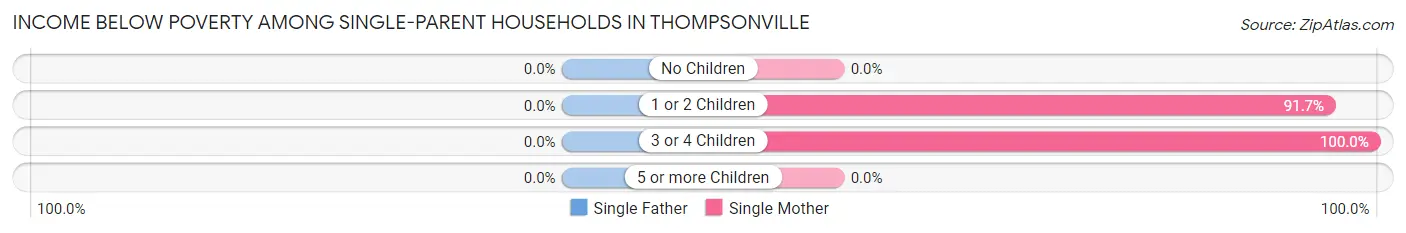
| Children | Single Father | Single Mother |
| No Children | 0 (0.0%) | 0 (0.0%) |
| 1 or 2 Children | 0 (0.0%) | 11 (91.7%) |
| 3 or 4 Children | 0 (0.0%) | 2 (100.0%) |
| 5 or more Children | 0 (0.0%) | 0 (0.0%) |
| Total | 0 (0.0%) | 13 (50.0%) |
Income Below Poverty Among Married-Couple vs Single-Parent Households in Thompsonville
The poverty data for Thompsonville shows that 4 of the married-couple family households (4.5%) and 13 of the single-parent households (46.4%) are living below the poverty level. Within the married-couple family households, those with 1 or 2 children have the highest poverty rate, with 4 households (18.2%) falling below the poverty line. Among the single-parent households, those with 3 or 4 children have the highest poverty rate, with 2 household (100.0%) living below poverty.
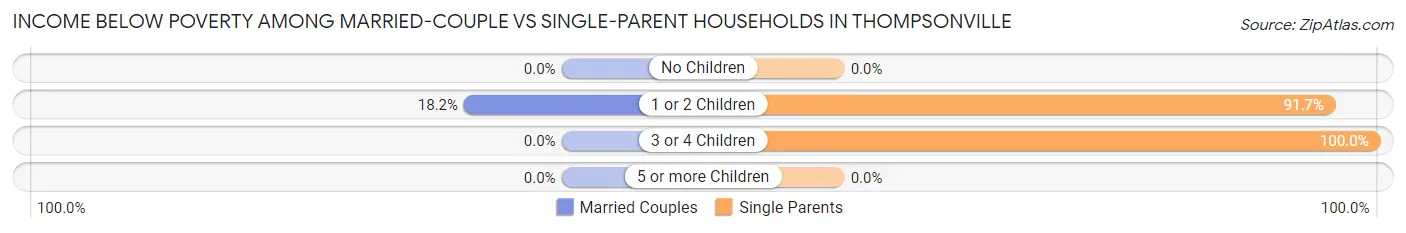
| Children | Married-Couple Families | Single-Parent Households |
| No Children | 0 (0.0%) | 0 (0.0%) |
| 1 or 2 Children | 4 (18.2%) | 11 (91.7%) |
| 3 or 4 Children | 0 (0.0%) | 2 (100.0%) |
| 5 or more Children | 0 (0.0%) | 0 (0.0%) |
| Total | 4 (4.5%) | 13 (46.4%) |
Race in Thompsonville
The most populous races in Thompsonville are White / Caucasian (396 | 87.6%), Asian (19 | 4.2%), and Native / Alaskan (19 | 4.2%).
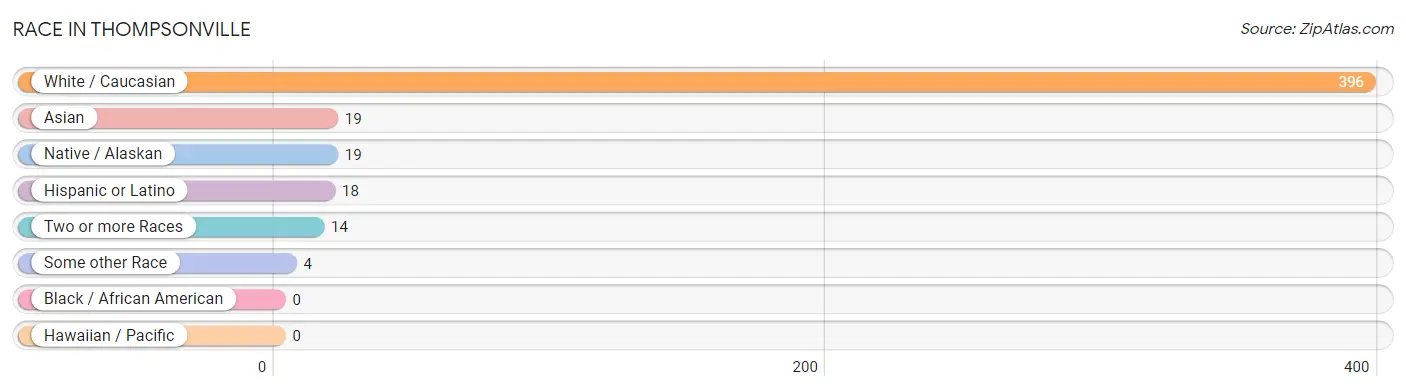
| Race | # Population | % Population |
| Asian | 19 | 4.2% |
| Black / African American | 0 | 0.0% |
| Hawaiian / Pacific | 0 | 0.0% |
| Hispanic or Latino | 18 | 4.0% |
| Native / Alaskan | 19 | 4.2% |
| White / Caucasian | 396 | 87.6% |
| Two or more Races | 14 | 3.1% |
| Some other Race | 4 | 0.9% |
| Total | 452 | 100.0% |
Ancestry in Thompsonville
The most populous ancestries reported in Thompsonville are German (124 | 27.4%), Irish (47 | 10.4%), Polish (44 | 9.7%), English (38 | 8.4%), and French (20 | 4.4%), together accounting for 60.4% of all Thompsonville residents.
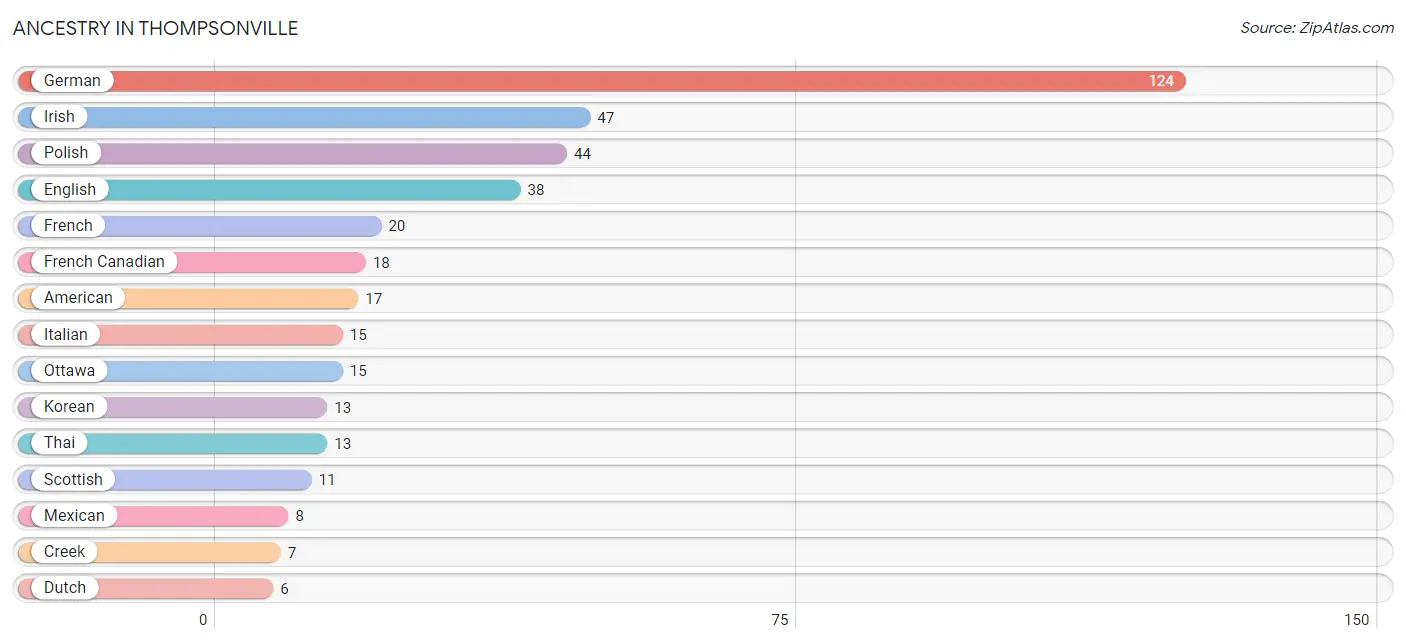
| Ancestry | # Population | % Population |
| American | 17 | 3.8% |
| Chippewa | 3 | 0.7% |
| Creek | 7 | 1.5% |
| Czech | 2 | 0.4% |
| Czechoslovakian | 2 | 0.4% |
| Dutch | 6 | 1.3% |
| English | 38 | 8.4% |
| European | 4 | 0.9% |
| Finnish | 1 | 0.2% |
| French | 20 | 4.4% |
| French Canadian | 18 | 4.0% |
| German | 124 | 27.4% |
| Irish | 47 | 10.4% |
| Italian | 15 | 3.3% |
| Korean | 13 | 2.9% |
| Mexican | 8 | 1.8% |
| Ottawa | 15 | 3.3% |
| Pennsylvania German | 2 | 0.4% |
| Polish | 44 | 9.7% |
| Scotch-Irish | 3 | 0.7% |
| Scottish | 11 | 2.4% |
| Thai | 13 | 2.9% |
| Welsh | 1 | 0.2% | View All 23 Rows |
Immigrants in Thompsonville
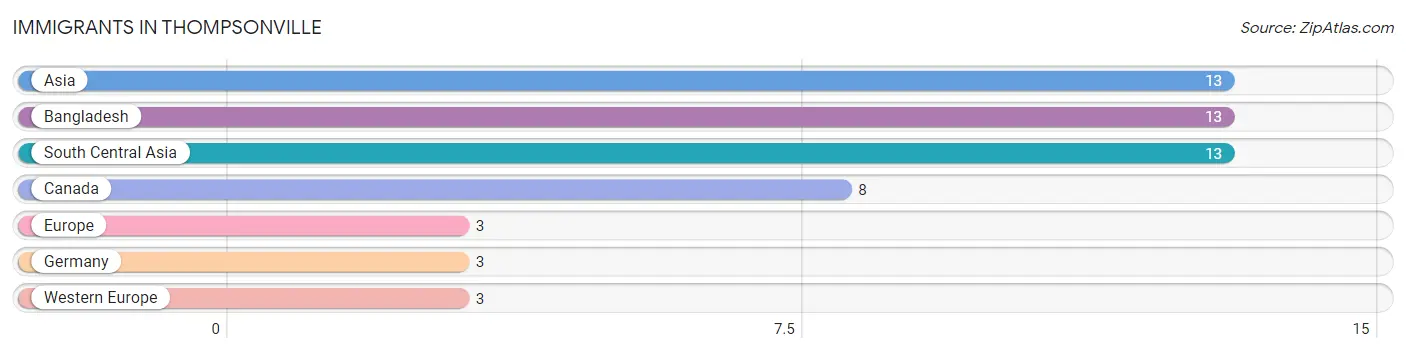
The most numerous immigrant groups reported in Thompsonville came from Asia (13 | 2.9%), Bangladesh (13 | 2.9%), South Central Asia (13 | 2.9%), Canada (8 | 1.8%), and Europe (3 | 0.7%), together accounting for 11.1% of all Thompsonville residents.
| Immigration Origin | # Population | % Population |
| Asia | 13 | 2.9% |
| Bangladesh | 13 | 2.9% |
| Canada | 8 | 1.8% |
| Europe | 3 | 0.7% |
| Germany | 3 | 0.7% |
| South Central Asia | 13 | 2.9% |
| Western Europe | 3 | 0.7% | View All 7 Rows |
Sex and Age in Thompsonville
Sex and Age in Thompsonville
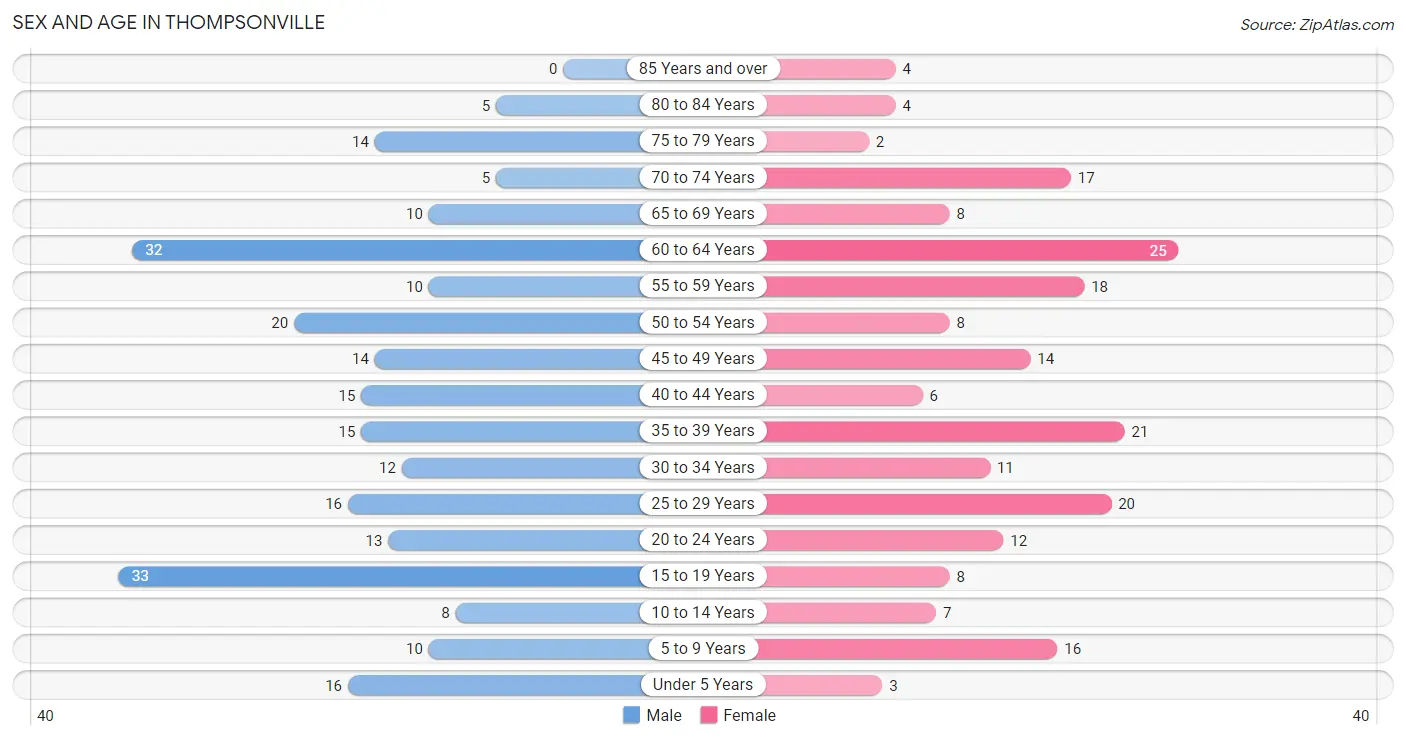
The most populous age groups in Thompsonville are 15 to 19 Years (33 | 13.3%) for men and 60 to 64 Years (25 | 12.2%) for women.
| Age Bracket | Male | Female |
| Under 5 Years | 16 (6.5%) | 3 (1.5%) |
| 5 to 9 Years | 10 (4.0%) | 16 (7.8%) |
| 10 to 14 Years | 8 (3.2%) | 7 (3.4%) |
| 15 to 19 Years | 33 (13.3%) | 8 (3.9%) |
| 20 to 24 Years | 13 (5.2%) | 12 (5.9%) |
| 25 to 29 Years | 16 (6.5%) | 20 (9.8%) |
| 30 to 34 Years | 12 (4.8%) | 11 (5.4%) |
| 35 to 39 Years | 15 (6.0%) | 21 (10.3%) |
| 40 to 44 Years | 15 (6.0%) | 6 (2.9%) |
| 45 to 49 Years | 14 (5.7%) | 14 (6.9%) |
| 50 to 54 Years | 20 (8.1%) | 8 (3.9%) |
| 55 to 59 Years | 10 (4.0%) | 18 (8.8%) |
| 60 to 64 Years | 32 (12.9%) | 25 (12.2%) |
| 65 to 69 Years | 10 (4.0%) | 8 (3.9%) |
| 70 to 74 Years | 5 (2.0%) | 17 (8.3%) |
| 75 to 79 Years | 14 (5.7%) | 2 (1.0%) |
| 80 to 84 Years | 5 (2.0%) | 4 (2.0%) |
| 85 Years and over | 0 (0.0%) | 4 (2.0%) |
| Total | 248 (100.0%) | 204 (100.0%) |
Families and Households in Thompsonville
Median Family Size in Thompsonville
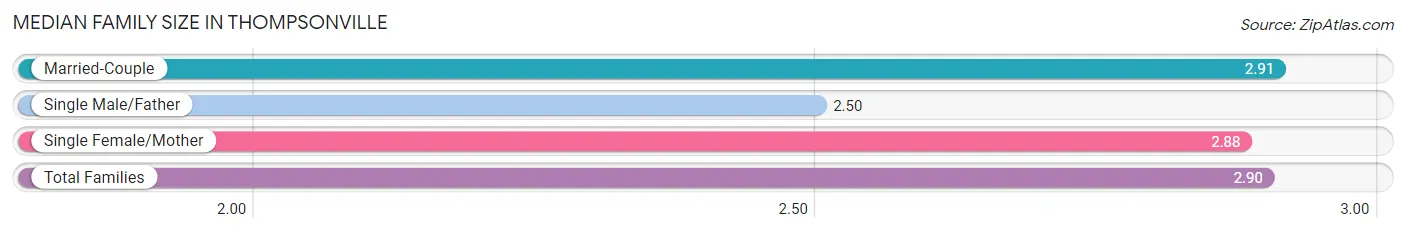
The median family size in Thompsonville is 2.90 persons per family, with married-couple families (89 | 76.1%) accounting for the largest median family size of 2.91 persons per family. On the other hand, single male/father families (2 | 1.7%) represent the smallest median family size with 2.50 persons per family.
| Family Type | # Families | Family Size |
| Married-Couple | 89 (76.1%) | 2.91 |
| Single Male/Father | 2 (1.7%) | 2.50 |
| Single Female/Mother | 26 (22.2%) | 2.88 |
| Total Families | 117 (100.0%) | 2.90 |
Median Household Size in Thompsonville
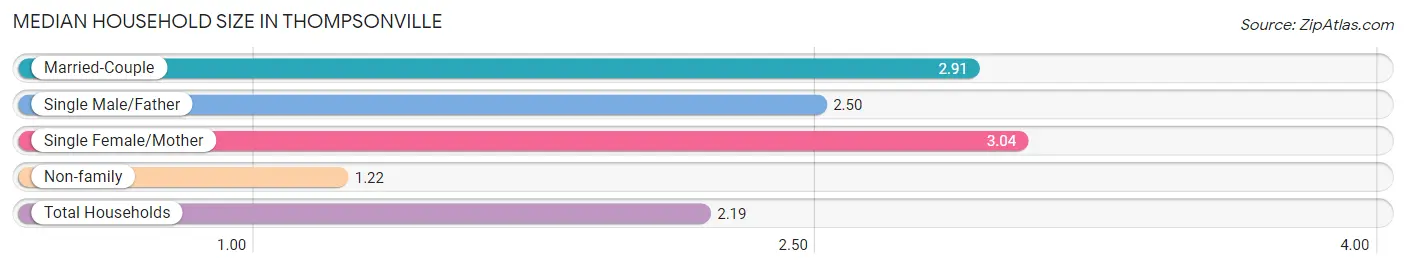
The median household size in Thompsonville is 2.19 persons per household, with single female/mother households (26 | 12.6%) accounting for the largest median household size of 3.04 persons per household. non-family households (89 | 43.2%) represent the smallest median household size with 1.22 persons per household.
| Household Type | # Households | Household Size |
| Married-Couple | 89 (43.2%) | 2.91 |
| Single Male/Father | 2 (1.0%) | 2.50 |
| Single Female/Mother | 26 (12.6%) | 3.04 |
| Non-family | 89 (43.2%) | 1.22 |
| Total Households | 206 (100.0%) | 2.19 |
Household Size by Marriage Status in Thompsonville
Out of a total of 206 households in Thompsonville, 117 (56.8%) are family households, while 89 (43.2%) are nonfamily households. The most numerous type of family households are 2-person households, comprising 67, and the most common type of nonfamily households are 1-person households, comprising 75.
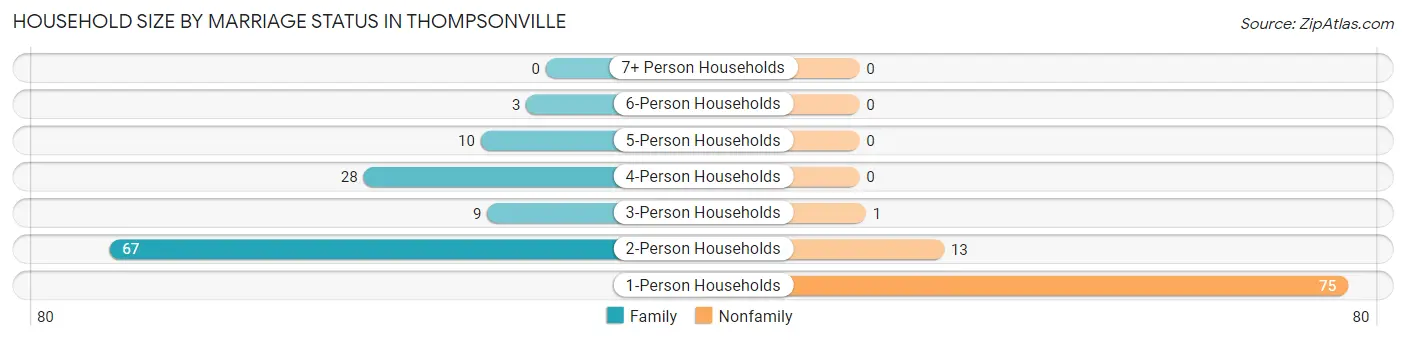
| Household Size | Family Households | Nonfamily Households |
| 1-Person Households | - | 75 (36.4%) |
| 2-Person Households | 67 (32.5%) | 13 (6.3%) |
| 3-Person Households | 9 (4.4%) | 1 (0.5%) |
| 4-Person Households | 28 (13.6%) | 0 (0.0%) |
| 5-Person Households | 10 (4.9%) | 0 (0.0%) |
| 6-Person Households | 3 (1.5%) | 0 (0.0%) |
| 7+ Person Households | 0 (0.0%) | 0 (0.0%) |
| Total | 117 (56.8%) | 89 (43.2%) |
Female Fertility in Thompsonville
Fertility by Age in Thompsonville
Average fertility rate in Thompsonville is 53.0 births per 1,000 women. Women in the age bracket of 20 to 34 years have the highest fertility rate with 116.0 births per 1,000 women. Women in the age bracket of 20 to 34 years acount for 100.0% of all women with births.
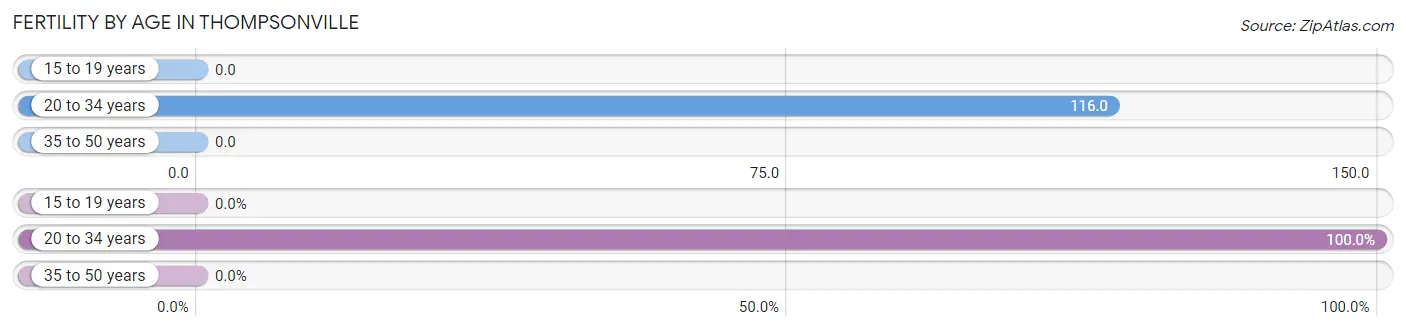
| Age Bracket | Women with Births | Births / 1,000 Women |
| 15 to 19 years | 0 (0.0%) | 0.0 |
| 20 to 34 years | 5 (100.0%) | 116.0 |
| 35 to 50 years | 0 (0.0%) | 0.0 |
| Total | 5 (100.0%) | 53.0 |
Fertility by Age by Marriage Status in Thompsonville
60.0% of women with births (5) in Thompsonville are married. The highest percentage of unmarried women with births falls into 20 to 34 years age bracket with 40.0% of them unmarried at the time of birth, while the lowest percentage of unmarried women with births belong to 20 to 34 years age bracket with 40.0% of them unmarried.
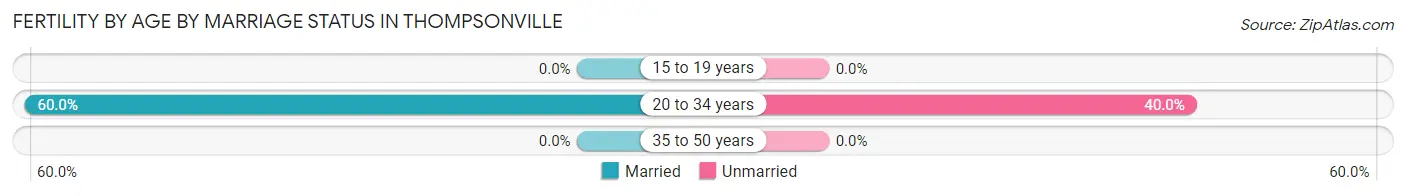
| Age Bracket | Married | Unmarried |
| 15 to 19 years | 0 (0.0%) | 0 (0.0%) |
| 20 to 34 years | 3 (60.0%) | 2 (40.0%) |
| 35 to 50 years | 0 (0.0%) | 0 (0.0%) |
| Total | 3 (60.0%) | 2 (40.0%) |
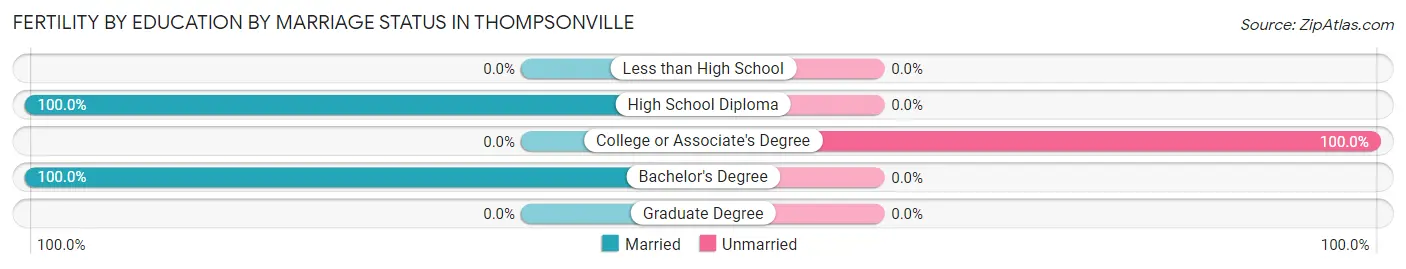
Fertility by Education in Thompsonville
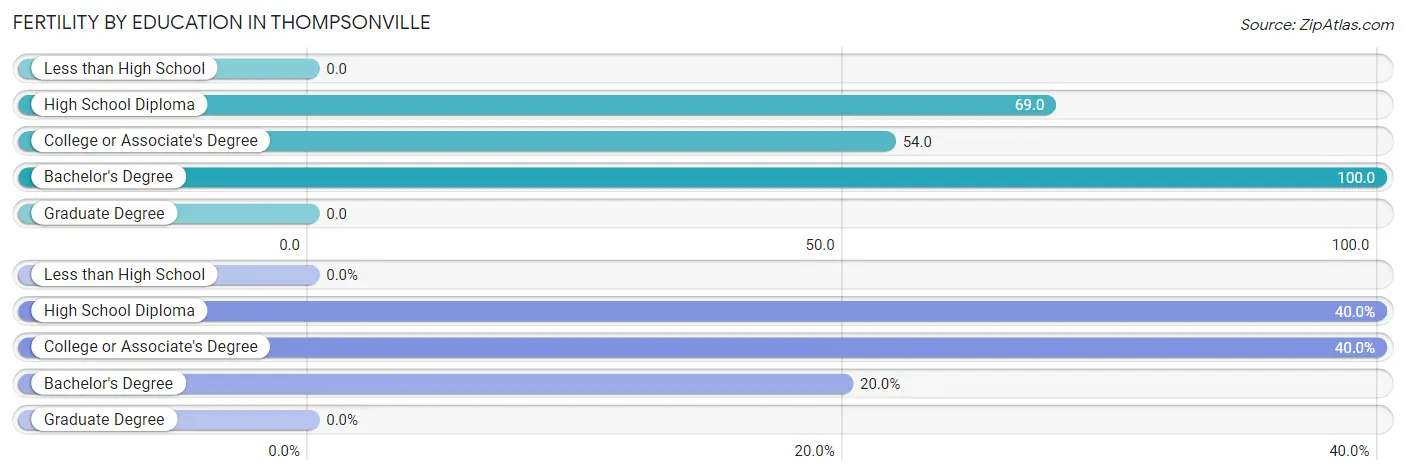
| Educational Attainment | Women with Births | Births / 1,000 Women |
| Less than High School | 0 (0.0%) | 0.0 |
| High School Diploma | 2 (40.0%) | 69.0 |
| College or Associate's Degree | 2 (40.0%) | 54.0 |
| Bachelor's Degree | 1 (20.0%) | 100.0 |
| Graduate Degree | 0 (0.0%) | 0.0 |
| Total | 5 (100.0%) | 53.0 |
Fertility by Education by Marriage Status in Thompsonville
40.0% of women with births in Thompsonville are unmarried. Women with the educational attainment of high school diploma are most likely to be married with 100.0% of them married at childbirth, while women with the educational attainment of college or associate's degree are least likely to be married with 100.0% of them unmarried at childbirth.
| Educational Attainment | Married | Unmarried |
| Less than High School | 0 (0.0%) | 0 (0.0%) |
| High School Diploma | 2 (100.0%) | 0 (0.0%) |
| College or Associate's Degree | 0 (0.0%) | 2 (100.0%) |
| Bachelor's Degree | 1 (100.0%) | 0 (0.0%) |
| Graduate Degree | 0 (0.0%) | 0 (0.0%) |
| Total | 3 (60.0%) | 2 (40.0%) |
Employment Characteristics in Thompsonville
Employment by Class of Employer in Thompsonville
Among the 221 employed individuals in Thompsonville, private company employees (150 | 67.9%), self-employed (not incorporated) (18 | 8.1%), and local government employees (14 | 6.3%) make up the most common classes of employment.
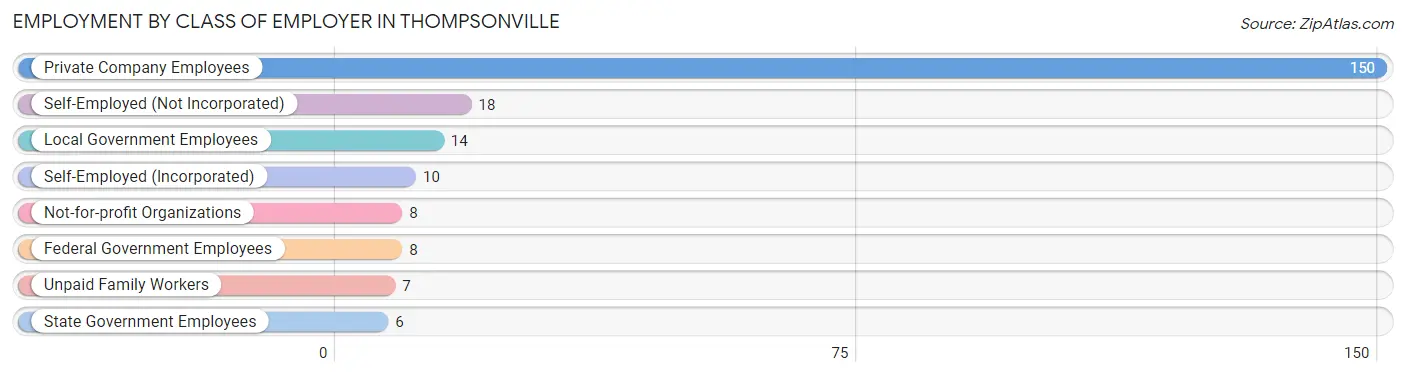
| Employer Class | # Employees | % Employees |
| Private Company Employees | 150 | 67.9% |
| Self-Employed (Incorporated) | 10 | 4.5% |
| Self-Employed (Not Incorporated) | 18 | 8.1% |
| Not-for-profit Organizations | 8 | 3.6% |
| Local Government Employees | 14 | 6.3% |
| State Government Employees | 6 | 2.7% |
| Federal Government Employees | 8 | 3.6% |
| Unpaid Family Workers | 7 | 3.2% |
| Total | 221 | 100.0% |
Employment Status by Age in Thompsonville
According to the labor force statistics for Thompsonville, out of the total population over 16 years of age (383), 61.9% or 237 individuals are in the labor force, with 3.0% or 7 of them unemployed. The age group with the highest labor force participation rate is 25 to 29 years, with 100.0% or 36 individuals in the labor force. Within the labor force, the 30 to 34 years age range has the highest percentage of unemployed individuals, with 19.0% or 4 of them being unemployed.
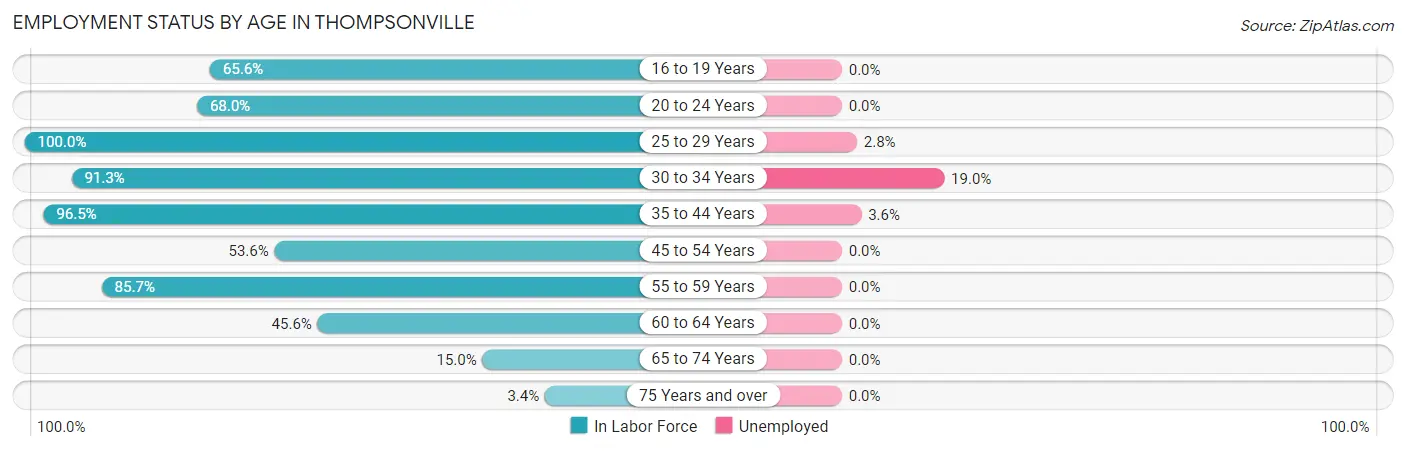
| Age Bracket | In Labor Force | Unemployed |
| 16 to 19 Years | 21 (65.6%) | 0 (0.0%) |
| 20 to 24 Years | 17 (68.0%) | 0 (0.0%) |
| 25 to 29 Years | 36 (100.0%) | 1 (2.8%) |
| 30 to 34 Years | 21 (91.3%) | 4 (19.0%) |
| 35 to 44 Years | 55 (96.5%) | 2 (3.6%) |
| 45 to 54 Years | 30 (53.6%) | 0 (0.0%) |
| 55 to 59 Years | 24 (85.7%) | 0 (0.0%) |
| 60 to 64 Years | 26 (45.6%) | 0 (0.0%) |
| 65 to 74 Years | 6 (15.0%) | 0 (0.0%) |
| 75 Years and over | 1 (3.4%) | 0 (0.0%) |
| Total | 237 (61.9%) | 7 (3.0%) |
Employment Status by Educational Attainment in Thompsonville
According to labor force statistics for Thompsonville, 74.7% of individuals (192) out of the total population between 25 and 64 years of age (257) are in the labor force, with 3.6% or 7 of them being unemployed. The group with the highest labor force participation rate are those with the educational attainment of bachelor's degree or higher, with 100.0% or 27 individuals in the labor force. Within the labor force, individuals with less than high school education have the highest percentage of unemployment, with 23.8% or 5 of them being unemployed.
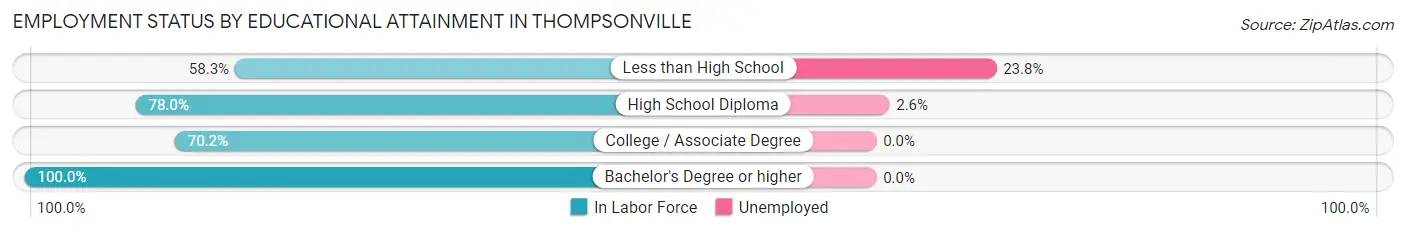
| Educational Attainment | In Labor Force | Unemployed |
| Less than High School | 21 (58.3%) | 9 (23.8%) |
| High School Diploma | 78 (78.0%) | 3 (2.6%) |
| College / Associate Degree | 66 (70.2%) | 0 (0.0%) |
| Bachelor's Degree or higher | 27 (100.0%) | 0 (0.0%) |
| Total | 192 (74.7%) | 9 (3.6%) |
Employment Occupations by Sex in Thompsonville
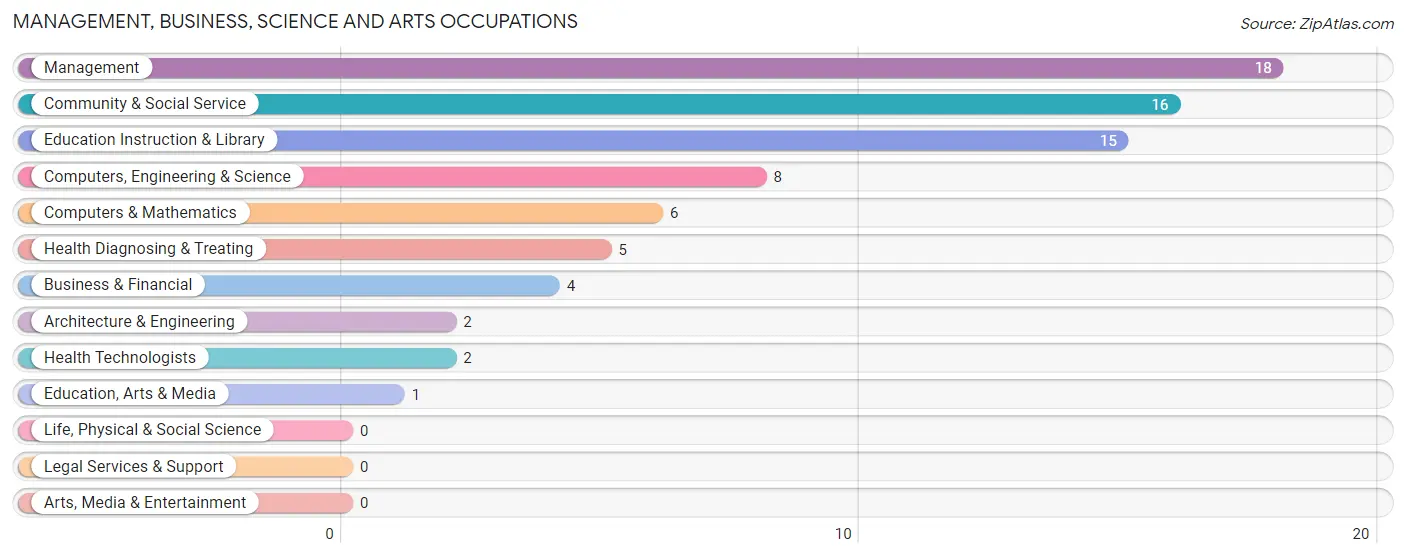
Management, Business, Science and Arts Occupations
The most common Management, Business, Science and Arts occupations in Thompsonville are Management (18 | 7.8%), Community & Social Service (16 | 7.0%), Education Instruction & Library (15 | 6.5%), Computers, Engineering & Science (8 | 3.5%), and Computers & Mathematics (6 | 2.6%).
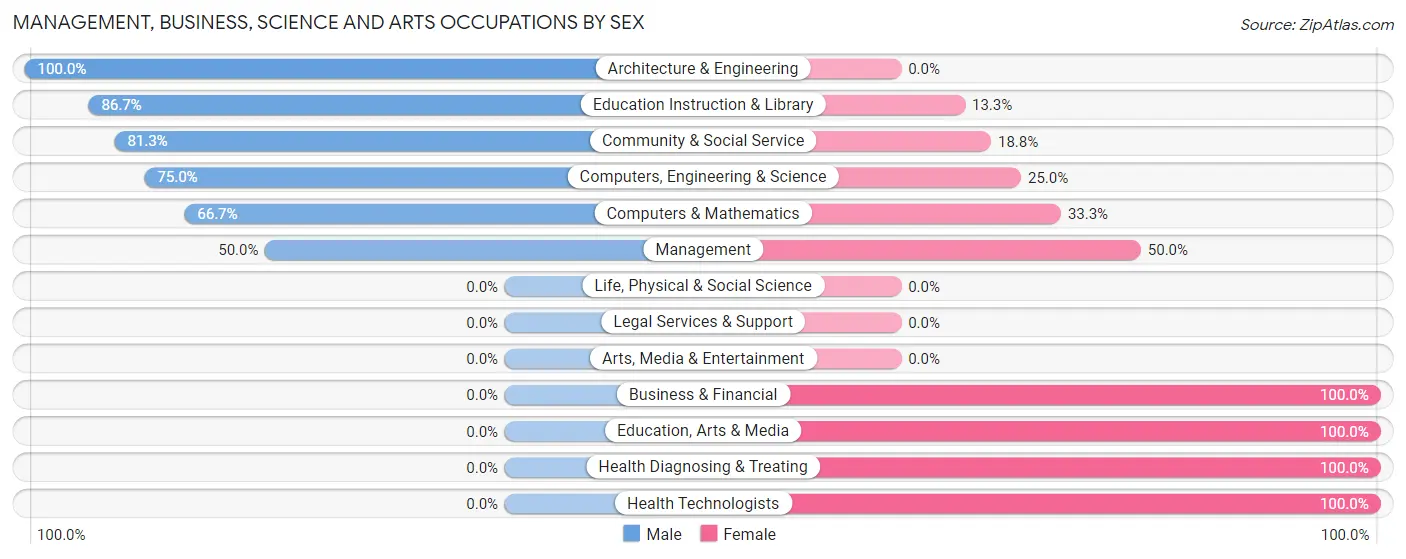
Management, Business, Science and Arts Occupations by Sex
Within the Management, Business, Science and Arts occupations in Thompsonville, the most male-oriented occupations are Architecture & Engineering (100.0%), Education Instruction & Library (86.7%), and Community & Social Service (81.2%), while the most female-oriented occupations are Business & Financial (100.0%), Education, Arts & Media (100.0%), and Health Diagnosing & Treating (100.0%).
| Occupation | Male | Female |
| Management | 9 (50.0%) | 9 (50.0%) |
| Business & Financial | 0 (0.0%) | 4 (100.0%) |
| Computers, Engineering & Science | 6 (75.0%) | 2 (25.0%) |
| Computers & Mathematics | 4 (66.7%) | 2 (33.3%) |
| Architecture & Engineering | 2 (100.0%) | 0 (0.0%) |
| Life, Physical & Social Science | 0 (0.0%) | 0 (0.0%) |
| Community & Social Service | 13 (81.2%) | 3 (18.8%) |
| Education, Arts & Media | 0 (0.0%) | 1 (100.0%) |
| Legal Services & Support | 0 (0.0%) | 0 (0.0%) |
| Education Instruction & Library | 13 (86.7%) | 2 (13.3%) |
| Arts, Media & Entertainment | 0 (0.0%) | 0 (0.0%) |
| Health Diagnosing & Treating | 0 (0.0%) | 5 (100.0%) |
| Health Technologists | 0 (0.0%) | 2 (100.0%) |
| Total (Category) | 28 (54.9%) | 23 (45.1%) |
| Total (Overall) | 122 (53.0%) | 108 (47.0%) |
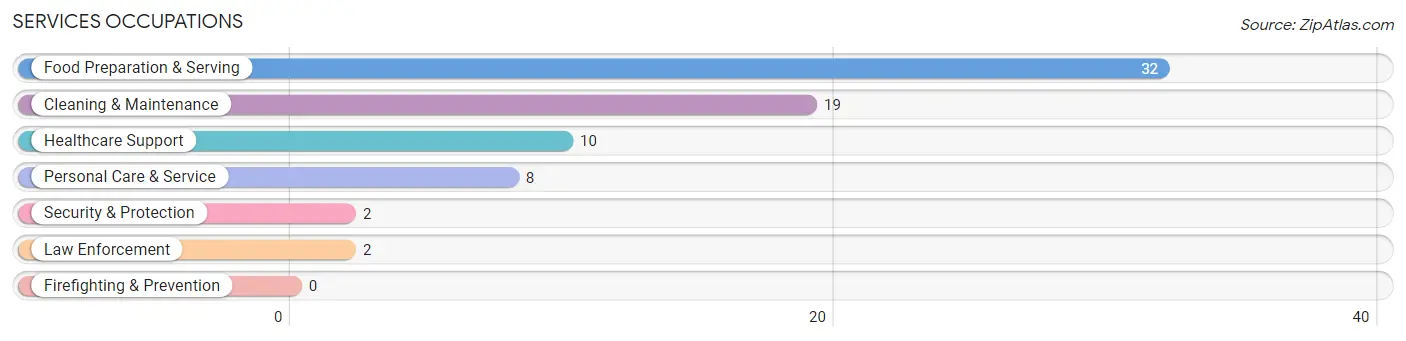
Services Occupations
The most common Services occupations in Thompsonville are Food Preparation & Serving (32 | 13.9%), Cleaning & Maintenance (19 | 8.3%), Healthcare Support (10 | 4.3%), Personal Care & Service (8 | 3.5%), and Security & Protection (2 | 0.9%).
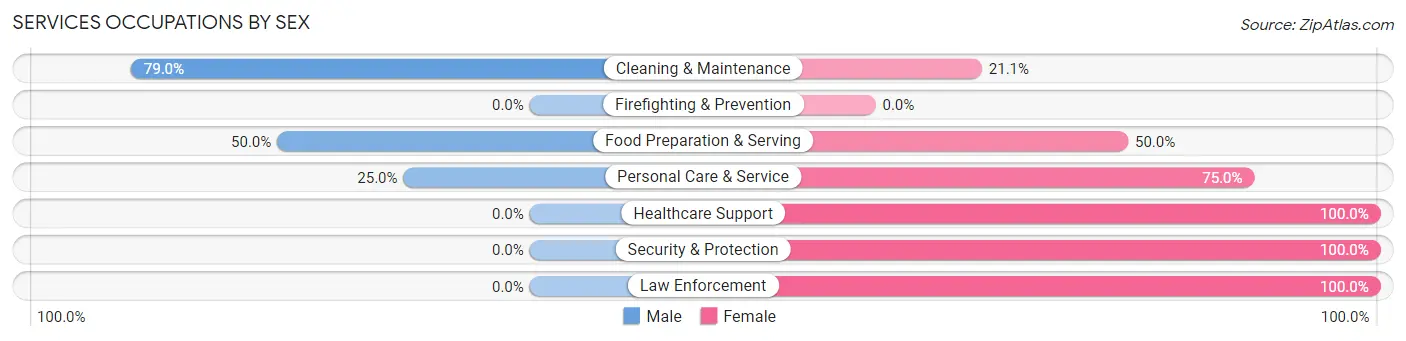
Services Occupations by Sex
Within the Services occupations in Thompsonville, the most male-oriented occupations are Cleaning & Maintenance (78.9%), Food Preparation & Serving (50.0%), and Personal Care & Service (25.0%), while the most female-oriented occupations are Healthcare Support (100.0%), Security & Protection (100.0%), and Law Enforcement (100.0%).
| Occupation | Male | Female |
| Healthcare Support | 0 (0.0%) | 10 (100.0%) |
| Security & Protection | 0 (0.0%) | 2 (100.0%) |
| Firefighting & Prevention | 0 (0.0%) | 0 (0.0%) |
| Law Enforcement | 0 (0.0%) | 2 (100.0%) |
| Food Preparation & Serving | 16 (50.0%) | 16 (50.0%) |
| Cleaning & Maintenance | 15 (78.9%) | 4 (21.0%) |
| Personal Care & Service | 2 (25.0%) | 6 (75.0%) |
| Total (Category) | 33 (46.5%) | 38 (53.5%) |
| Total (Overall) | 122 (53.0%) | 108 (47.0%) |
Sales and Office Occupations
The most common Sales and Office occupations in Thompsonville are Office & Administration (33 | 14.3%), and Sales & Related (11 | 4.8%).
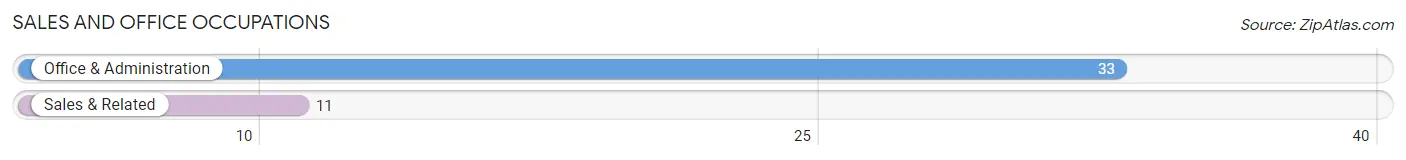
Sales and Office Occupations by Sex
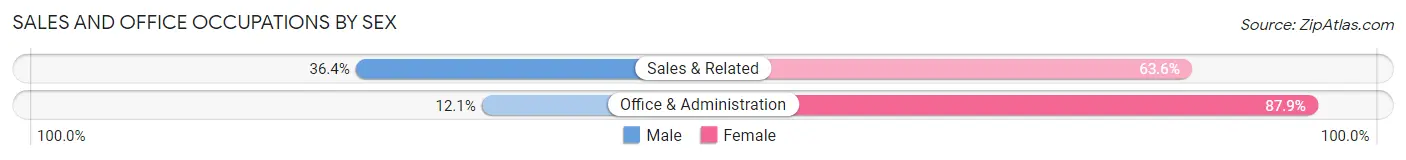
| Occupation | Male | Female |
| Sales & Related | 4 (36.4%) | 7 (63.6%) |
| Office & Administration | 4 (12.1%) | 29 (87.9%) |
| Total (Category) | 8 (18.2%) | 36 (81.8%) |
| Total (Overall) | 122 (53.0%) | 108 (47.0%) |
Natural Resources, Construction and Maintenance Occupations
The most common Natural Resources, Construction and Maintenance occupations in Thompsonville are Construction & Extraction (19 | 8.3%), and Installation, Maintenance & Repair (11 | 4.8%).
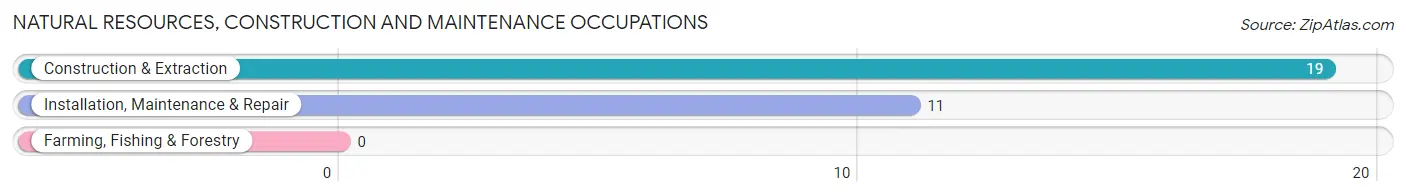
Natural Resources, Construction and Maintenance Occupations by Sex
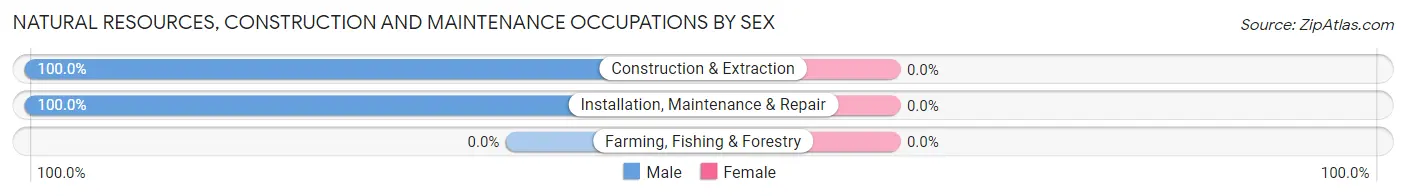
| Occupation | Male | Female |
| Farming, Fishing & Forestry | 0 (0.0%) | 0 (0.0%) |
| Construction & Extraction | 19 (100.0%) | 0 (0.0%) |
| Installation, Maintenance & Repair | 11 (100.0%) | 0 (0.0%) |
| Total (Category) | 30 (100.0%) | 0 (0.0%) |
| Total (Overall) | 122 (53.0%) | 108 (47.0%) |
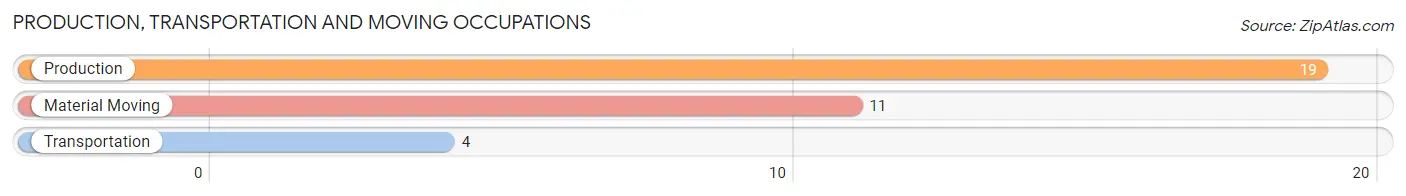
Production, Transportation and Moving Occupations
The most common Production, Transportation and Moving occupations in Thompsonville are Production (19 | 8.3%), Material Moving (11 | 4.8%), and Transportation (4 | 1.7%).
Production, Transportation and Moving Occupations by Sex
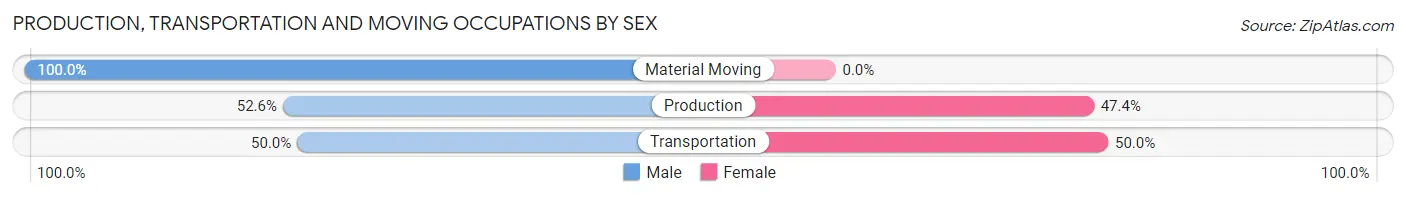
| Occupation | Male | Female |
| Production | 10 (52.6%) | 9 (47.4%) |
| Transportation | 2 (50.0%) | 2 (50.0%) |
| Material Moving | 11 (100.0%) | 0 (0.0%) |
| Total (Category) | 23 (67.6%) | 11 (32.4%) |
| Total (Overall) | 122 (53.0%) | 108 (47.0%) |
Employment Industries by Sex in Thompsonville
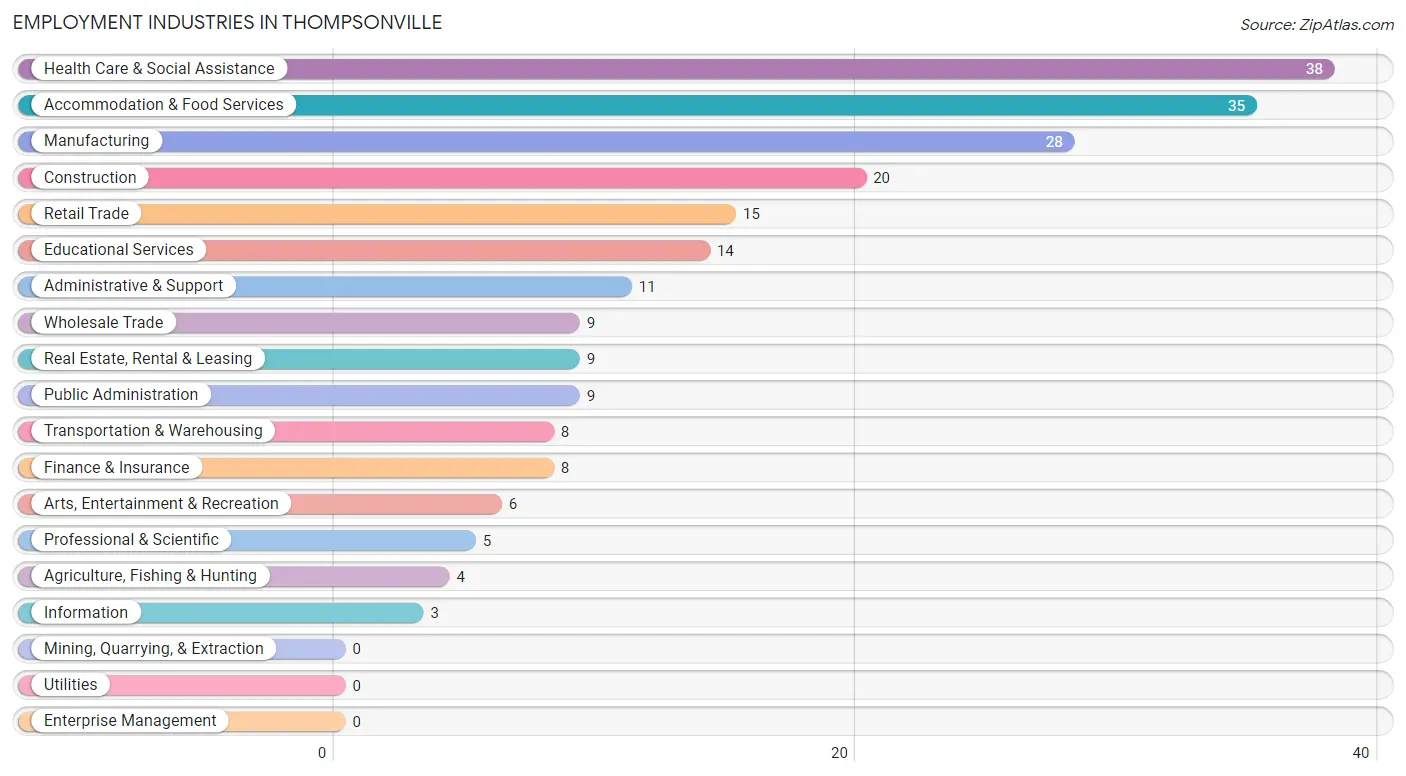
Employment Industries in Thompsonville
The major employment industries in Thompsonville include Health Care & Social Assistance (38 | 16.5%), Accommodation & Food Services (35 | 15.2%), Manufacturing (28 | 12.2%), Construction (20 | 8.7%), and Retail Trade (15 | 6.5%).
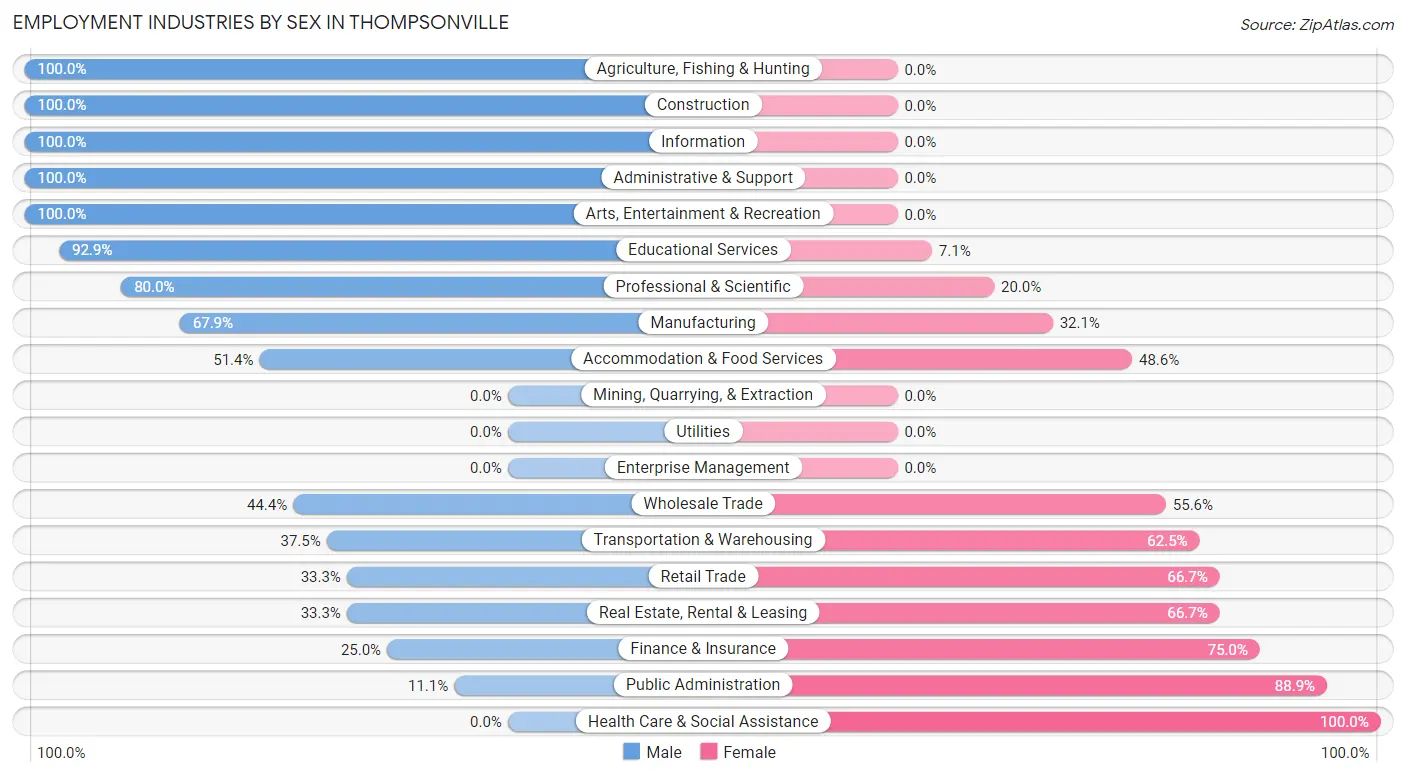
Employment Industries by Sex in Thompsonville
The Thompsonville industries that see more men than women are Agriculture, Fishing & Hunting (100.0%), Construction (100.0%), and Information (100.0%), whereas the industries that tend to have a higher number of women are Health Care & Social Assistance (100.0%), Public Administration (88.9%), and Finance & Insurance (75.0%).
| Industry | Male | Female |
| Agriculture, Fishing & Hunting | 4 (100.0%) | 0 (0.0%) |
| Mining, Quarrying, & Extraction | 0 (0.0%) | 0 (0.0%) |
| Construction | 20 (100.0%) | 0 (0.0%) |
| Manufacturing | 19 (67.9%) | 9 (32.1%) |
| Wholesale Trade | 4 (44.4%) | 5 (55.6%) |
| Retail Trade | 5 (33.3%) | 10 (66.7%) |
| Transportation & Warehousing | 3 (37.5%) | 5 (62.5%) |
| Utilities | 0 (0.0%) | 0 (0.0%) |
| Information | 3 (100.0%) | 0 (0.0%) |
| Finance & Insurance | 2 (25.0%) | 6 (75.0%) |
| Real Estate, Rental & Leasing | 3 (33.3%) | 6 (66.7%) |
| Professional & Scientific | 4 (80.0%) | 1 (20.0%) |
| Enterprise Management | 0 (0.0%) | 0 (0.0%) |
| Administrative & Support | 11 (100.0%) | 0 (0.0%) |
| Educational Services | 13 (92.9%) | 1 (7.1%) |
| Health Care & Social Assistance | 0 (0.0%) | 38 (100.0%) |
| Arts, Entertainment & Recreation | 6 (100.0%) | 0 (0.0%) |
| Accommodation & Food Services | 18 (51.4%) | 17 (48.6%) |
| Public Administration | 1 (11.1%) | 8 (88.9%) |
| Total | 122 (53.0%) | 108 (47.0%) |
Education in Thompsonville
School Enrollment in Thompsonville
The most common levels of schooling among the 92 students in Thompsonville are high school (41 | 44.6%), elementary school (19 | 20.6%), and graduate / professional (13 | 14.1%).
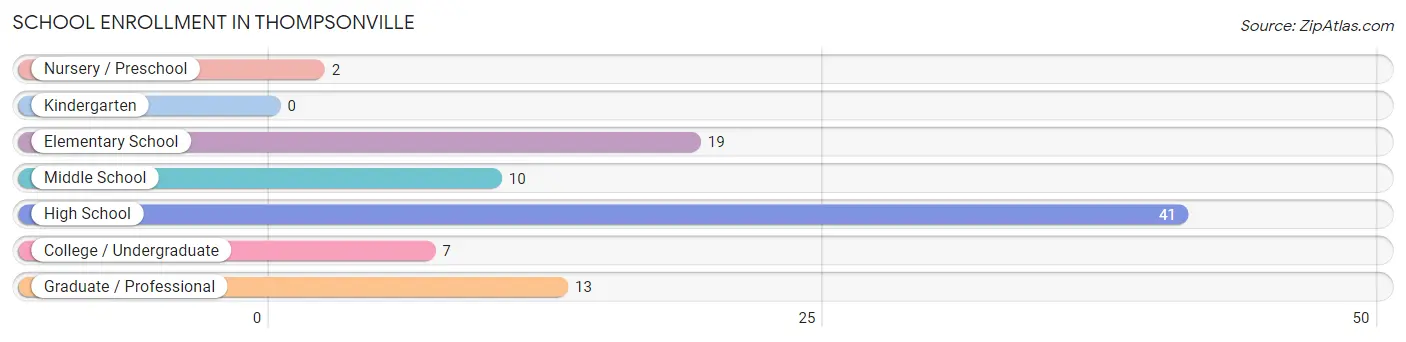
| School Level | # Students | % Students |
| Nursery / Preschool | 2 | 2.2% |
| Kindergarten | 0 | 0.0% |
| Elementary School | 19 | 20.6% |
| Middle School | 10 | 10.9% |
| High School | 41 | 44.6% |
| College / Undergraduate | 7 | 7.6% |
| Graduate / Professional | 13 | 14.1% |
| Total | 92 | 100.0% |
School Enrollment by Age by Funding Source in Thompsonville
Out of a total of 92 students who are enrolled in schools in Thompsonville, 8 (8.7%) attend a private institution, while the remaining 84 (91.3%) are enrolled in public schools. The age group of 35 years and over has the highest likelihood of being enrolled in private schools, with 1 (100.0% in the age bracket) enrolled. Conversely, the age group of 5 to 9 year old has the lowest likelihood of being enrolled in a private school, with 21 (100.0% in the age bracket) attending a public institution.
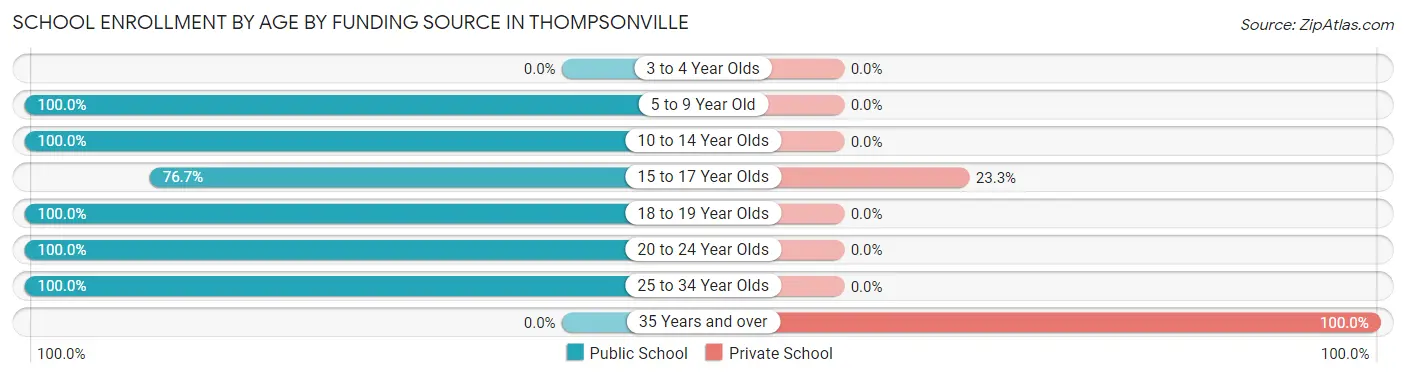
| Age Bracket | Public School | Private School |
| 3 to 4 Year Olds | 0 (0.0%) | 0 (0.0%) |
| 5 to 9 Year Old | 21 (100.0%) | 0 (0.0%) |
| 10 to 14 Year Olds | 15 (100.0%) | 0 (0.0%) |
| 15 to 17 Year Olds | 23 (76.7%) | 7 (23.3%) |
| 18 to 19 Year Olds | 4 (100.0%) | 0 (0.0%) |
| 20 to 24 Year Olds | 6 (100.0%) | 0 (0.0%) |
| 25 to 34 Year Olds | 15 (100.0%) | 0 (0.0%) |
| 35 Years and over | 0 (0.0%) | 1 (100.0%) |
| Total | 84 (91.3%) | 8 (8.7%) |
Educational Attainment by Field of Study in Thompsonville
Business (9 | 27.3%), engineering (8 | 24.2%), bio, nature & agricultural (5 | 15.1%), education (5 | 15.1%), and computers & mathematics (2 | 6.1%) are the most common fields of study among 33 individuals in Thompsonville who have obtained a bachelor's degree or higher.
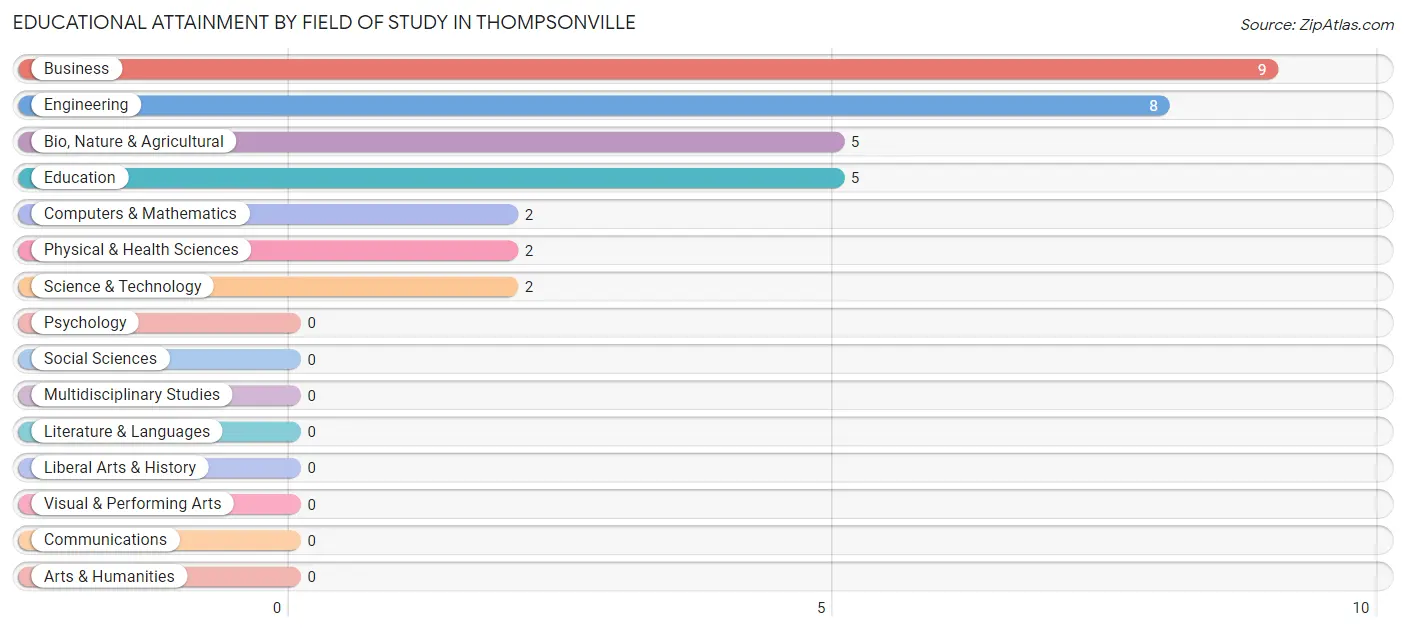
| Field of Study | # Graduates | % Graduates |
| Computers & Mathematics | 2 | 6.1% |
| Bio, Nature & Agricultural | 5 | 15.1% |
| Physical & Health Sciences | 2 | 6.1% |
| Psychology | 0 | 0.0% |
| Social Sciences | 0 | 0.0% |
| Engineering | 8 | 24.2% |
| Multidisciplinary Studies | 0 | 0.0% |
| Science & Technology | 2 | 6.1% |
| Business | 9 | 27.3% |
| Education | 5 | 15.1% |
| Literature & Languages | 0 | 0.0% |
| Liberal Arts & History | 0 | 0.0% |
| Visual & Performing Arts | 0 | 0.0% |
| Communications | 0 | 0.0% |
| Arts & Humanities | 0 | 0.0% |
| Total | 33 | 100.0% |
Transportation & Commute in Thompsonville
Vehicle Availability by Sex in Thompsonville
The most prevalent vehicle ownership categories in Thompsonville are males with 1 vehicle (42, accounting for 35.0%) and females with 1 vehicle (18, making up 41.6%).
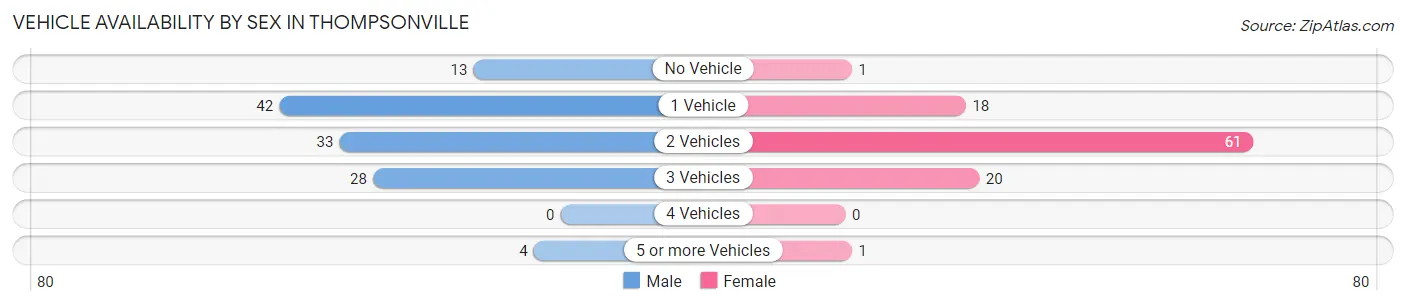
| Vehicles Available | Male | Female |
| No Vehicle | 13 (10.8%) | 1 (1.0%) |
| 1 Vehicle | 42 (35.0%) | 18 (17.8%) |
| 2 Vehicles | 33 (27.5%) | 61 (60.4%) |
| 3 Vehicles | 28 (23.3%) | 20 (19.8%) |
| 4 Vehicles | 0 (0.0%) | 0 (0.0%) |
| 5 or more Vehicles | 4 (3.3%) | 1 (1.0%) |
| Total | 120 (100.0%) | 101 (100.0%) |
Commute Time in Thompsonville
The most frequently occuring commute durations in Thompsonville are 30 to 34 minutes (41 commuters, 19.5%), 5 to 9 minutes (36 commuters, 17.1%), and less than 5 minutes (28 commuters, 13.3%).
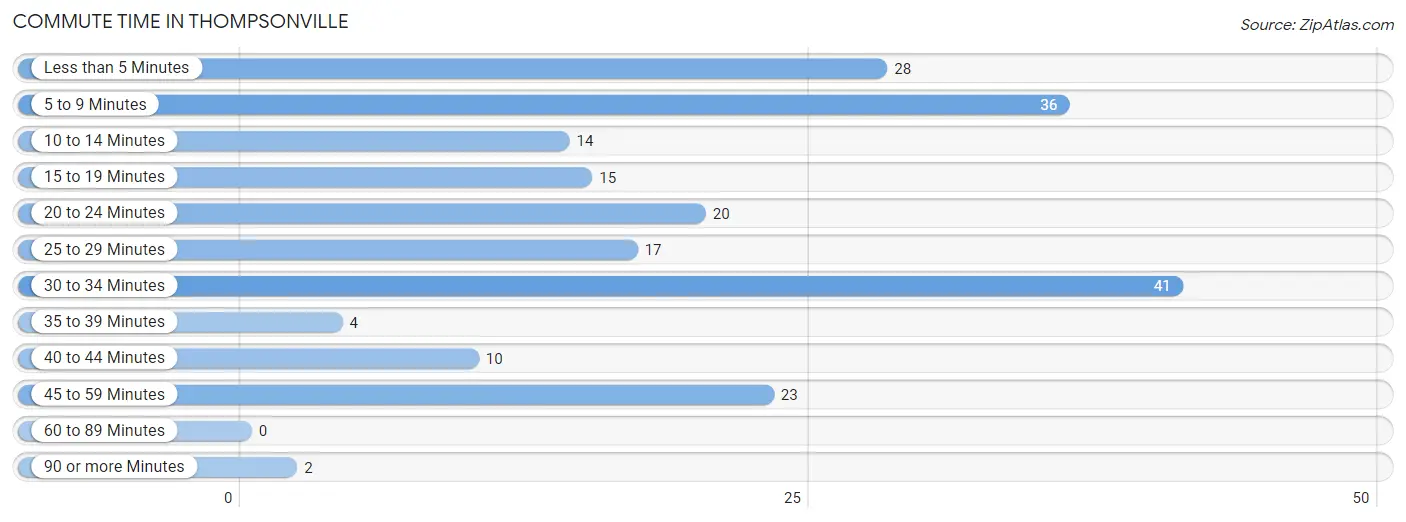
| Commute Time | # Commuters | % Commuters |
| Less than 5 Minutes | 28 | 13.3% |
| 5 to 9 Minutes | 36 | 17.1% |
| 10 to 14 Minutes | 14 | 6.7% |
| 15 to 19 Minutes | 15 | 7.1% |
| 20 to 24 Minutes | 20 | 9.5% |
| 25 to 29 Minutes | 17 | 8.1% |
| 30 to 34 Minutes | 41 | 19.5% |
| 35 to 39 Minutes | 4 | 1.9% |
| 40 to 44 Minutes | 10 | 4.8% |
| 45 to 59 Minutes | 23 | 11.0% |
| 60 to 89 Minutes | 0 | 0.0% |
| 90 or more Minutes | 2 | 0.9% |
Commute Time by Sex in Thompsonville
The most common commute times in Thompsonville are 5 to 9 minutes (27 commuters, 22.7%) for males and less than 5 minutes (16 commuters, 17.6%) for females.
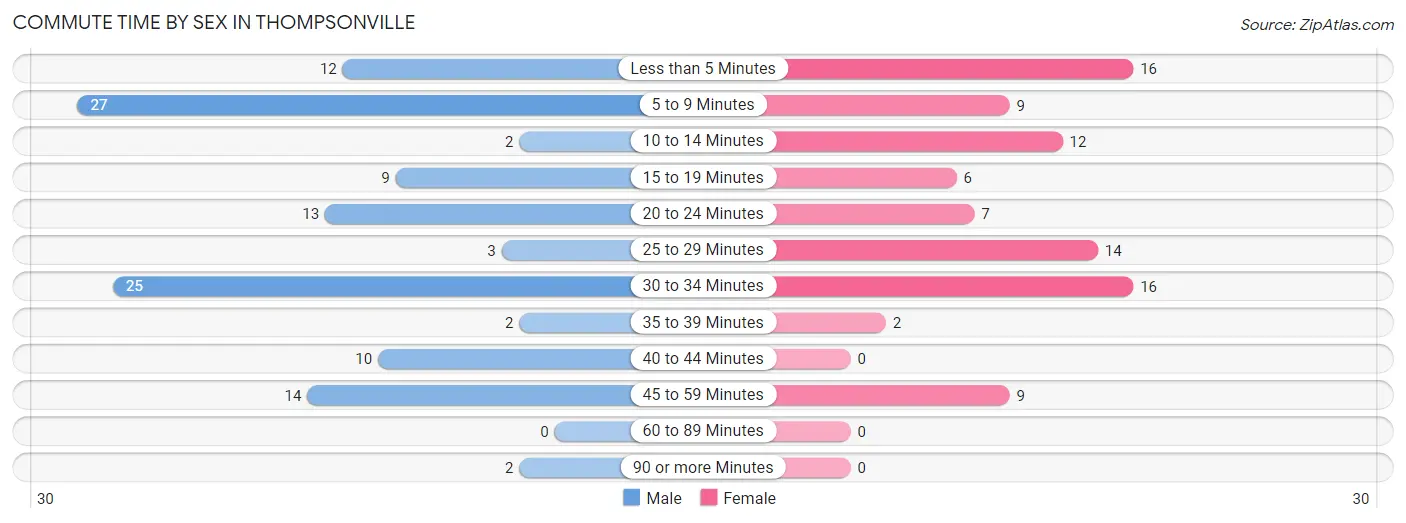
| Commute Time | Male | Female |
| Less than 5 Minutes | 12 (10.1%) | 16 (17.6%) |
| 5 to 9 Minutes | 27 (22.7%) | 9 (9.9%) |
| 10 to 14 Minutes | 2 (1.7%) | 12 (13.2%) |
| 15 to 19 Minutes | 9 (7.6%) | 6 (6.6%) |
| 20 to 24 Minutes | 13 (10.9%) | 7 (7.7%) |
| 25 to 29 Minutes | 3 (2.5%) | 14 (15.4%) |
| 30 to 34 Minutes | 25 (21.0%) | 16 (17.6%) |
| 35 to 39 Minutes | 2 (1.7%) | 2 (2.2%) |
| 40 to 44 Minutes | 10 (8.4%) | 0 (0.0%) |
| 45 to 59 Minutes | 14 (11.8%) | 9 (9.9%) |
| 60 to 89 Minutes | 0 (0.0%) | 0 (0.0%) |
| 90 or more Minutes | 2 (1.7%) | 0 (0.0%) |
Time of Departure to Work by Sex in Thompsonville
The most frequent times of departure to work in Thompsonville are 12:00 PM to 3:59 PM (32, 26.9%) for males and 12:00 PM to 3:59 PM (30, 33.0%) for females.
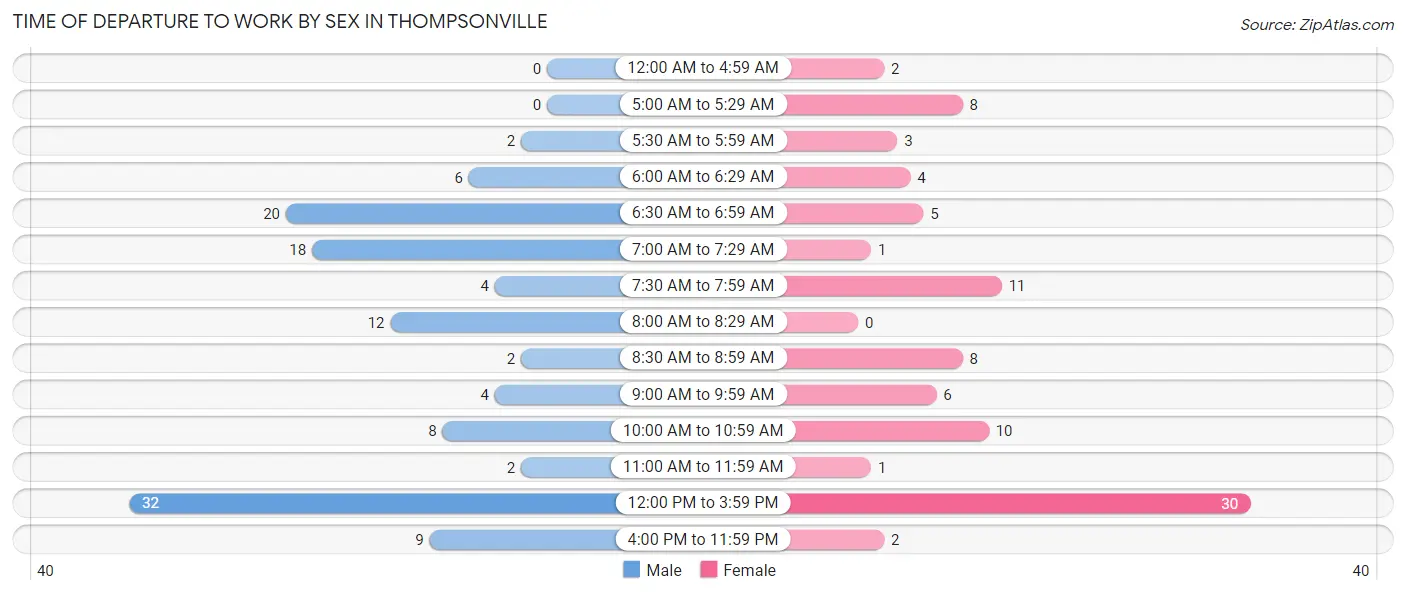
| Time of Departure | Male | Female |
| 12:00 AM to 4:59 AM | 0 (0.0%) | 2 (2.2%) |
| 5:00 AM to 5:29 AM | 0 (0.0%) | 8 (8.8%) |
| 5:30 AM to 5:59 AM | 2 (1.7%) | 3 (3.3%) |
| 6:00 AM to 6:29 AM | 6 (5.0%) | 4 (4.4%) |
| 6:30 AM to 6:59 AM | 20 (16.8%) | 5 (5.5%) |
| 7:00 AM to 7:29 AM | 18 (15.1%) | 1 (1.1%) |
| 7:30 AM to 7:59 AM | 4 (3.4%) | 11 (12.1%) |
| 8:00 AM to 8:29 AM | 12 (10.1%) | 0 (0.0%) |
| 8:30 AM to 8:59 AM | 2 (1.7%) | 8 (8.8%) |
| 9:00 AM to 9:59 AM | 4 (3.4%) | 6 (6.6%) |
| 10:00 AM to 10:59 AM | 8 (6.7%) | 10 (11.0%) |
| 11:00 AM to 11:59 AM | 2 (1.7%) | 1 (1.1%) |
| 12:00 PM to 3:59 PM | 32 (26.9%) | 30 (33.0%) |
| 4:00 PM to 11:59 PM | 9 (7.6%) | 2 (2.2%) |
| Total | 119 (100.0%) | 91 (100.0%) |
Housing Occupancy in Thompsonville
Occupancy by Ownership in Thompsonville
Of the total 206 dwellings in Thompsonville, owner-occupied units account for 153 (74.3%), while renter-occupied units make up 53 (25.7%).
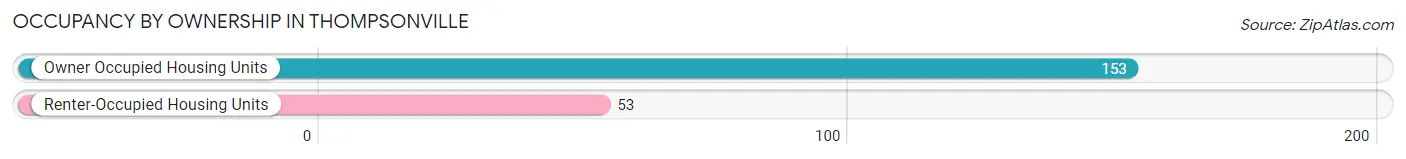
| Occupancy | # Housing Units | % Housing Units |
| Owner Occupied Housing Units | 153 | 74.3% |
| Renter-Occupied Housing Units | 53 | 25.7% |
| Total Occupied Housing Units | 206 | 100.0% |
Occupancy by Household Size in Thompsonville
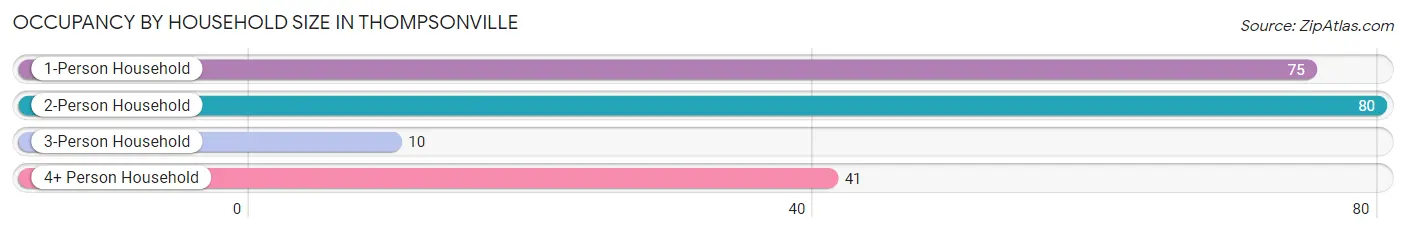
| Household Size | # Housing Units | % Housing Units |
| 1-Person Household | 75 | 36.4% |
| 2-Person Household | 80 | 38.8% |
| 3-Person Household | 10 | 4.9% |
| 4+ Person Household | 41 | 19.9% |
| Total Housing Units | 206 | 100.0% |
Occupancy by Ownership by Household Size in Thompsonville
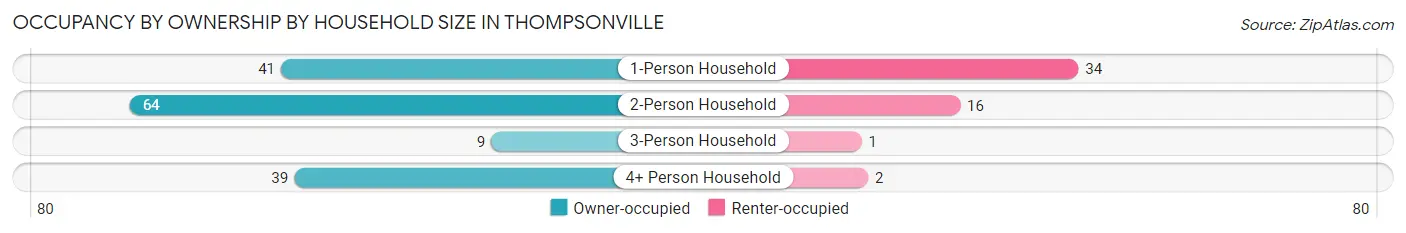
| Household Size | Owner-occupied | Renter-occupied |
| 1-Person Household | 41 (54.7%) | 34 (45.3%) |
| 2-Person Household | 64 (80.0%) | 16 (20.0%) |
| 3-Person Household | 9 (90.0%) | 1 (10.0%) |
| 4+ Person Household | 39 (95.1%) | 2 (4.9%) |
| Total Housing Units | 153 (74.3%) | 53 (25.7%) |
Occupancy by Educational Attainment in Thompsonville
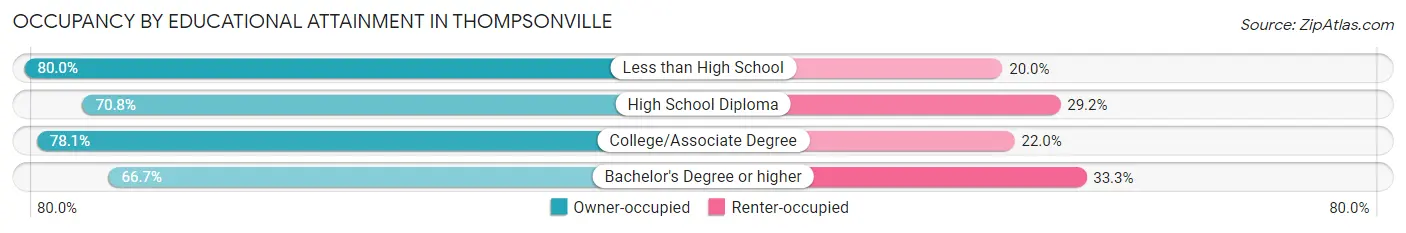
| Household Size | Owner-occupied | Renter-occupied |
| Less than High School | 16 (80.0%) | 4 (20.0%) |
| High School Diploma | 63 (70.8%) | 26 (29.2%) |
| College/Associate Degree | 64 (78.0%) | 18 (22.0%) |
| Bachelor's Degree or higher | 10 (66.7%) | 5 (33.3%) |
Occupancy by Age of Householder in Thompsonville
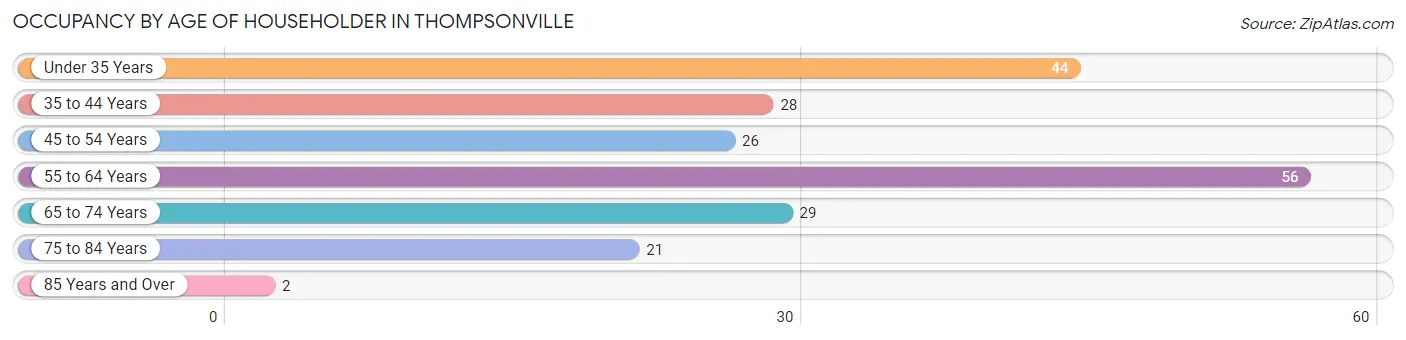
| Age Bracket | # Households | % Households |
| Under 35 Years | 44 | 21.4% |
| 35 to 44 Years | 28 | 13.6% |
| 45 to 54 Years | 26 | 12.6% |
| 55 to 64 Years | 56 | 27.2% |
| 65 to 74 Years | 29 | 14.1% |
| 75 to 84 Years | 21 | 10.2% |
| 85 Years and Over | 2 | 1.0% |
| Total | 206 | 100.0% |
Housing Finances in Thompsonville
Median Income by Occupancy in Thompsonville
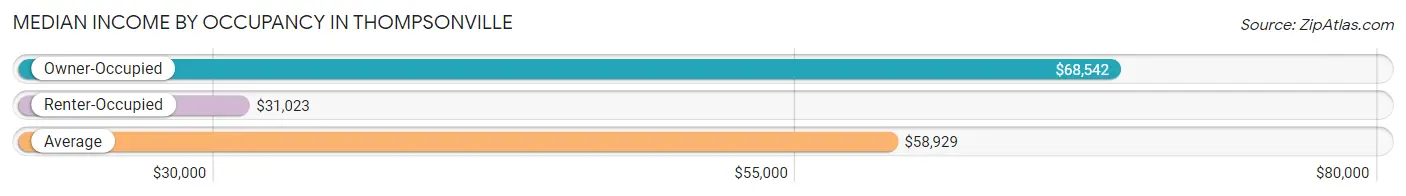
| Occupancy Type | # Households | Median Income |
| Owner-Occupied | 153 (74.3%) | $68,542 |
| Renter-Occupied | 53 (25.7%) | $31,023 |
| Average | 206 (100.0%) | $58,929 |
Occupancy by Householder Income Bracket in Thompsonville
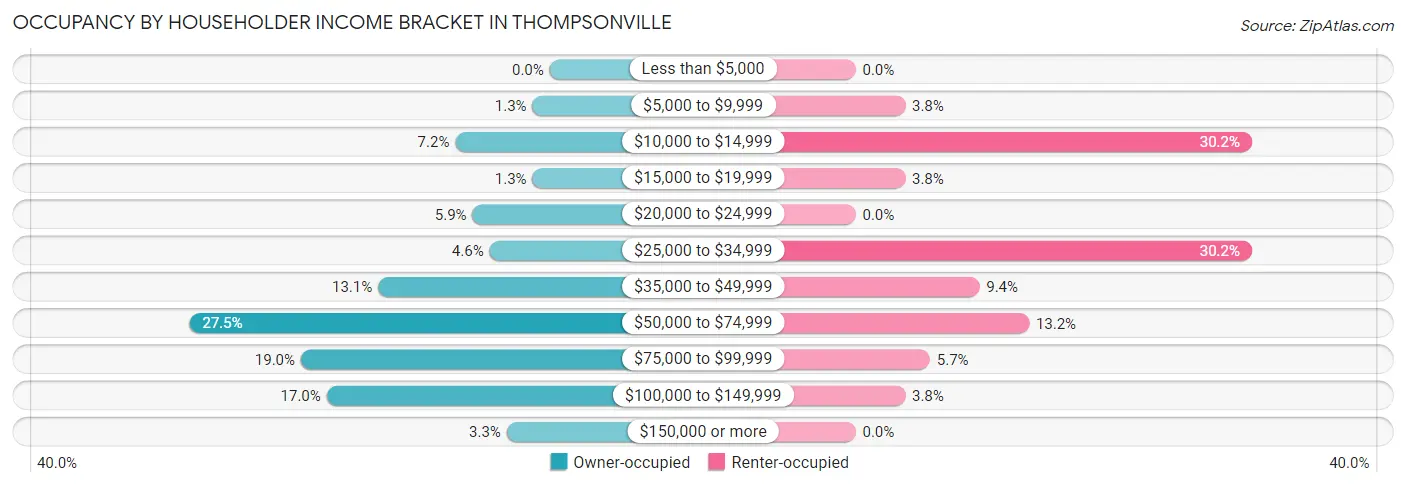
| Income Bracket | Owner-occupied | Renter-occupied |
| Less than $5,000 | 0 (0.0%) | 0 (0.0%) |
| $5,000 to $9,999 | 2 (1.3%) | 2 (3.8%) |
| $10,000 to $14,999 | 11 (7.2%) | 16 (30.2%) |
| $15,000 to $19,999 | 2 (1.3%) | 2 (3.8%) |
| $20,000 to $24,999 | 9 (5.9%) | 0 (0.0%) |
| $25,000 to $34,999 | 7 (4.6%) | 16 (30.2%) |
| $35,000 to $49,999 | 20 (13.1%) | 5 (9.4%) |
| $50,000 to $74,999 | 42 (27.5%) | 7 (13.2%) |
| $75,000 to $99,999 | 29 (19.0%) | 3 (5.7%) |
| $100,000 to $149,999 | 26 (17.0%) | 2 (3.8%) |
| $150,000 or more | 5 (3.3%) | 0 (0.0%) |
| Total | 153 (100.0%) | 53 (100.0%) |
Monthly Housing Cost Tiers in Thompsonville
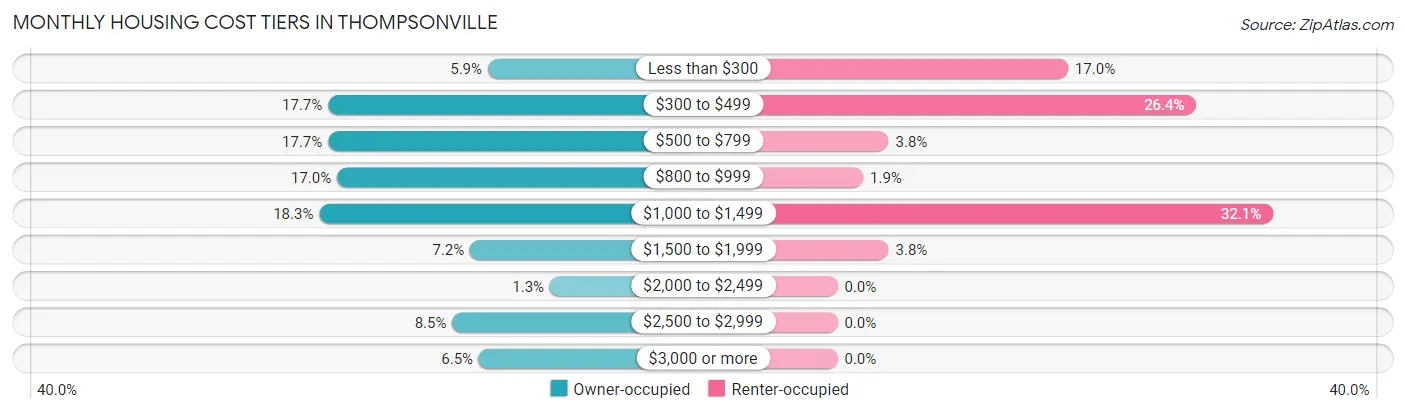
| Monthly Cost | Owner-occupied | Renter-occupied |
| Less than $300 | 9 (5.9%) | 9 (17.0%) |
| $300 to $499 | 27 (17.6%) | 14 (26.4%) |
| $500 to $799 | 27 (17.6%) | 2 (3.8%) |
| $800 to $999 | 26 (17.0%) | 1 (1.9%) |
| $1,000 to $1,499 | 28 (18.3%) | 17 (32.1%) |
| $1,500 to $1,999 | 11 (7.2%) | 2 (3.8%) |
| $2,000 to $2,499 | 2 (1.3%) | 0 (0.0%) |
| $2,500 to $2,999 | 13 (8.5%) | 0 (0.0%) |
| $3,000 or more | 10 (6.5%) | 0 (0.0%) |
| Total | 153 (100.0%) | 53 (100.0%) |
Physical Housing Characteristics in Thompsonville
Housing Structures in Thompsonville
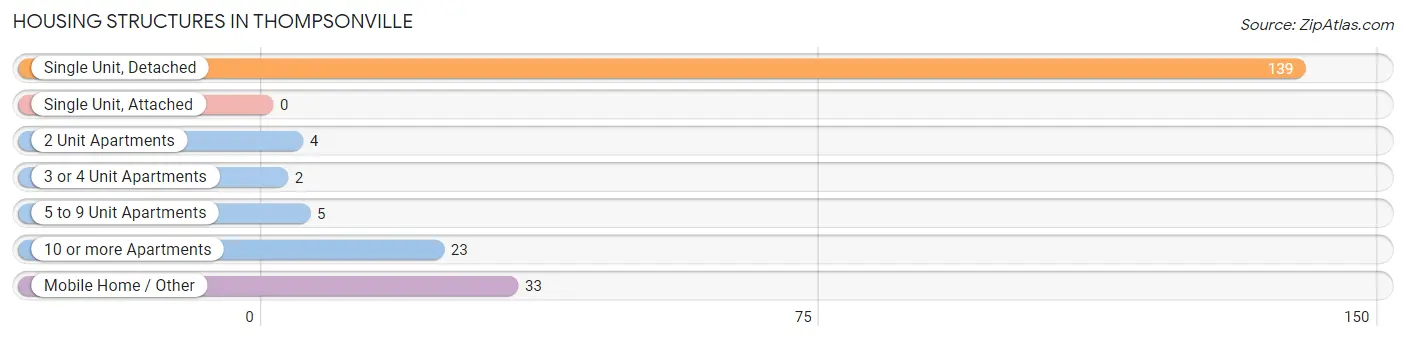
| Structure Type | # Housing Units | % Housing Units |
| Single Unit, Detached | 139 | 67.5% |
| Single Unit, Attached | 0 | 0.0% |
| 2 Unit Apartments | 4 | 1.9% |
| 3 or 4 Unit Apartments | 2 | 1.0% |
| 5 to 9 Unit Apartments | 5 | 2.4% |
| 10 or more Apartments | 23 | 11.2% |
| Mobile Home / Other | 33 | 16.0% |
| Total | 206 | 100.0% |
Housing Structures by Occupancy in Thompsonville
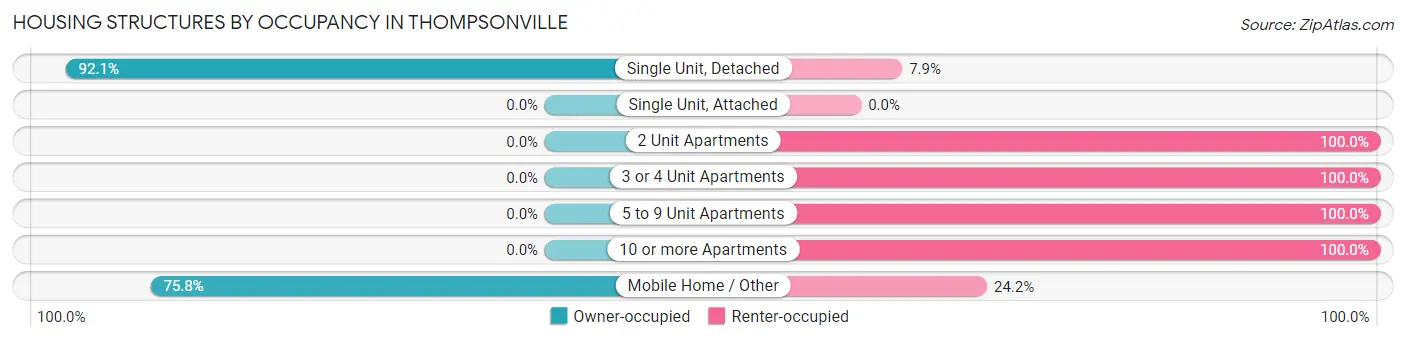
| Structure Type | Owner-occupied | Renter-occupied |
| Single Unit, Detached | 128 (92.1%) | 11 (7.9%) |
| Single Unit, Attached | 0 (0.0%) | 0 (0.0%) |
| 2 Unit Apartments | 0 (0.0%) | 4 (100.0%) |
| 3 or 4 Unit Apartments | 0 (0.0%) | 2 (100.0%) |
| 5 to 9 Unit Apartments | 0 (0.0%) | 5 (100.0%) |
| 10 or more Apartments | 0 (0.0%) | 23 (100.0%) |
| Mobile Home / Other | 25 (75.8%) | 8 (24.2%) |
| Total | 153 (74.3%) | 53 (25.7%) |
Housing Structures by Number of Rooms in Thompsonville
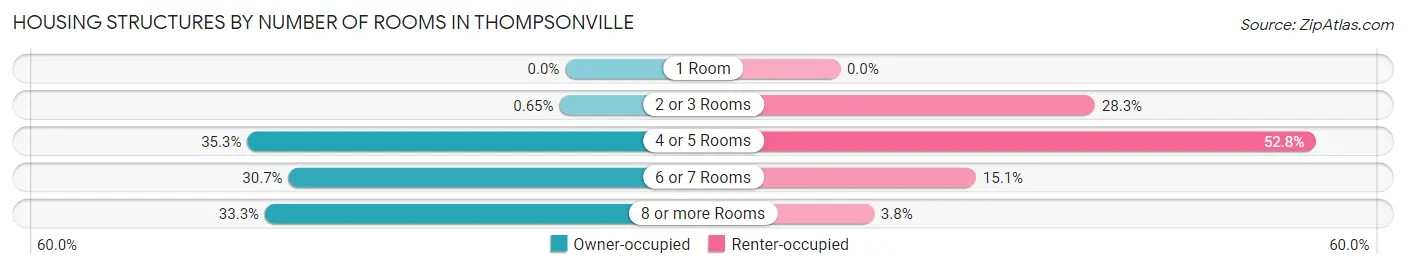
| Number of Rooms | Owner-occupied | Renter-occupied |
| 1 Room | 0 (0.0%) | 0 (0.0%) |
| 2 or 3 Rooms | 1 (0.6%) | 15 (28.3%) |
| 4 or 5 Rooms | 54 (35.3%) | 28 (52.8%) |
| 6 or 7 Rooms | 47 (30.7%) | 8 (15.1%) |
| 8 or more Rooms | 51 (33.3%) | 2 (3.8%) |
| Total | 153 (100.0%) | 53 (100.0%) |
Housing Structure by Heating Type in Thompsonville
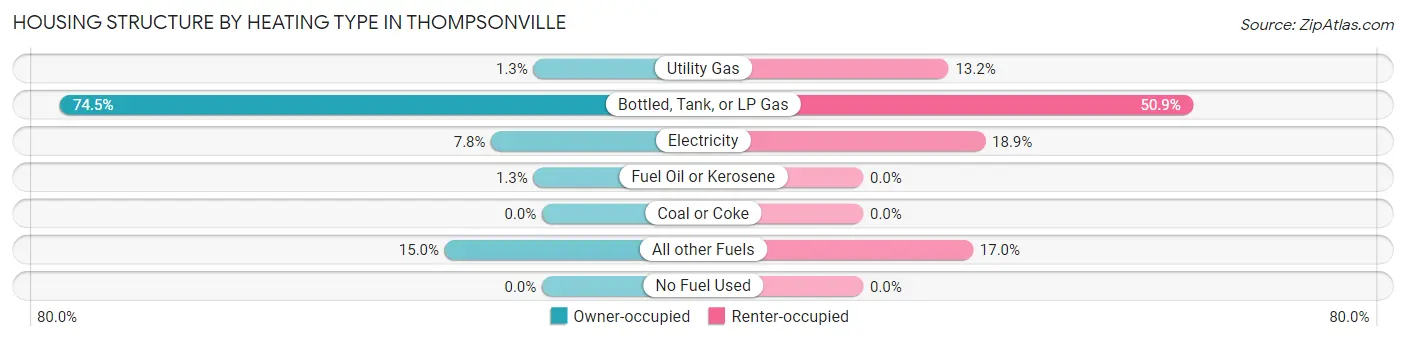
| Heating Type | Owner-occupied | Renter-occupied |
| Utility Gas | 2 (1.3%) | 7 (13.2%) |
| Bottled, Tank, or LP Gas | 114 (74.5%) | 27 (50.9%) |
| Electricity | 12 (7.8%) | 10 (18.9%) |
| Fuel Oil or Kerosene | 2 (1.3%) | 0 (0.0%) |
| Coal or Coke | 0 (0.0%) | 0 (0.0%) |
| All other Fuels | 23 (15.0%) | 9 (17.0%) |
| No Fuel Used | 0 (0.0%) | 0 (0.0%) |
| Total | 153 (100.0%) | 53 (100.0%) |
Household Vehicle Usage in Thompsonville
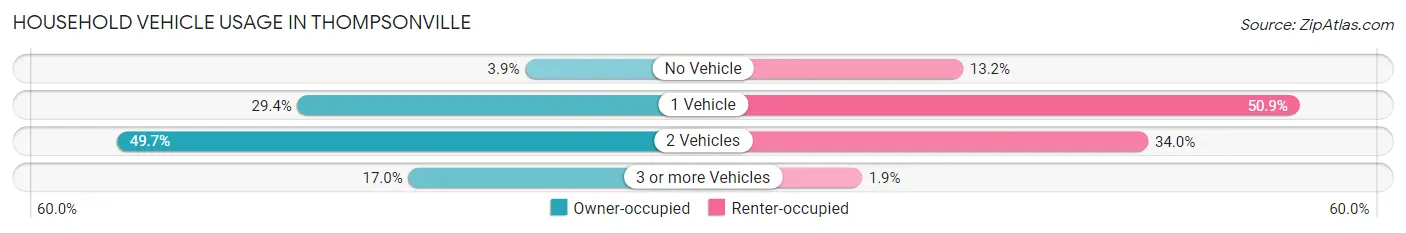
| Vehicles per Household | Owner-occupied | Renter-occupied |
| No Vehicle | 6 (3.9%) | 7 (13.2%) |
| 1 Vehicle | 45 (29.4%) | 27 (50.9%) |
| 2 Vehicles | 76 (49.7%) | 18 (34.0%) |
| 3 or more Vehicles | 26 (17.0%) | 1 (1.9%) |
| Total | 153 (100.0%) | 53 (100.0%) |
Real Estate & Mortgages in Thompsonville
Real Estate and Mortgage Overview in Thompsonville
| Characteristic | Without Mortgage | With Mortgage |
| Housing Units | 59 | 94 |
| Median Property Value | $75,000 | $125,000 |
| Median Household Income | $68,958 | $3 |
| Monthly Housing Costs | $441 | $10 |
| Real Estate Taxes | $900 | $6 |
Property Value by Mortgage Status in Thompsonville
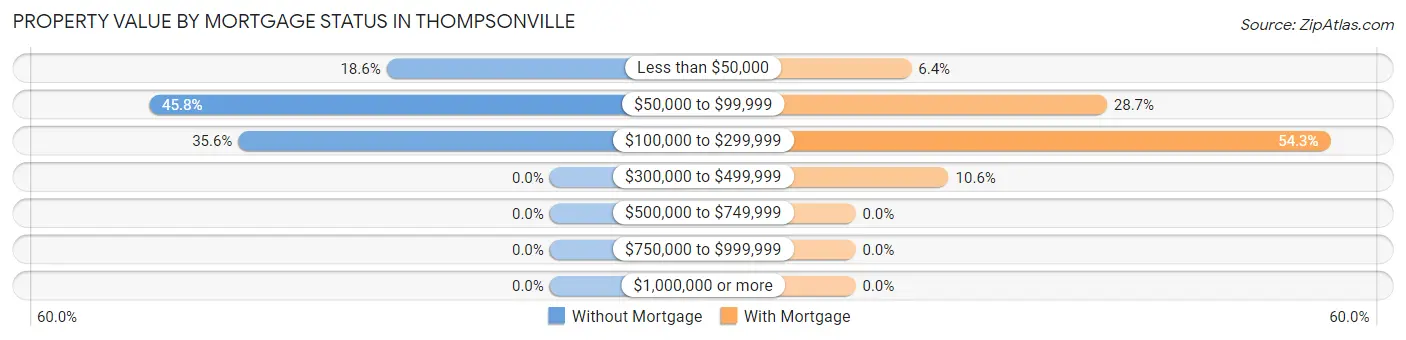
| Property Value | Without Mortgage | With Mortgage |
| Less than $50,000 | 11 (18.6%) | 6 (6.4%) |
| $50,000 to $99,999 | 27 (45.8%) | 27 (28.7%) |
| $100,000 to $299,999 | 21 (35.6%) | 51 (54.3%) |
| $300,000 to $499,999 | 0 (0.0%) | 10 (10.6%) |
| $500,000 to $749,999 | 0 (0.0%) | 0 (0.0%) |
| $750,000 to $999,999 | 0 (0.0%) | 0 (0.0%) |
| $1,000,000 or more | 0 (0.0%) | 0 (0.0%) |
| Total | 59 (100.0%) | 94 (100.0%) |
Household Income by Mortgage Status in Thompsonville
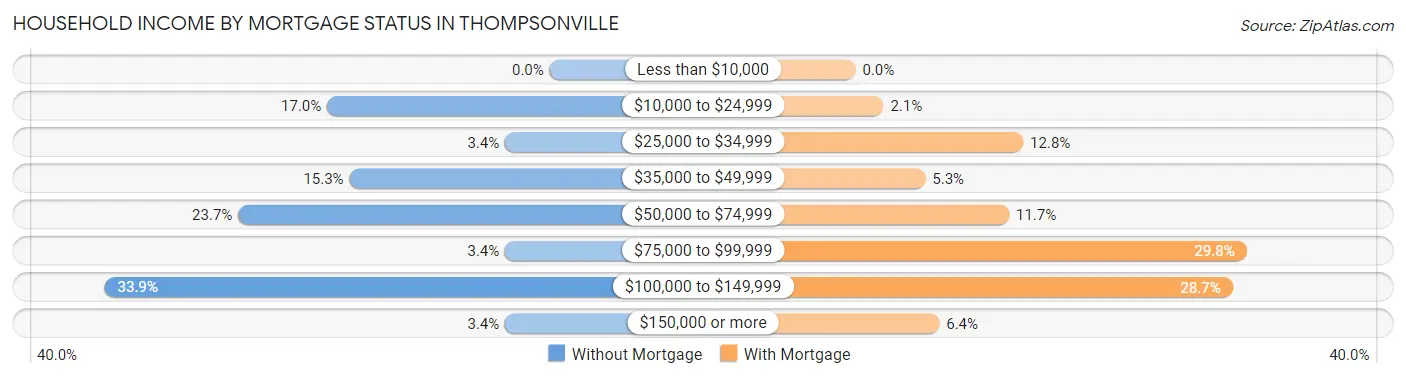
| Household Income | Without Mortgage | With Mortgage |
| Less than $10,000 | 0 (0.0%) | 0 (0.0%) |
| $10,000 to $24,999 | 10 (17.0%) | 2 (2.1%) |
| $25,000 to $34,999 | 2 (3.4%) | 12 (12.8%) |
| $35,000 to $49,999 | 9 (15.2%) | 5 (5.3%) |
| $50,000 to $74,999 | 14 (23.7%) | 11 (11.7%) |
| $75,000 to $99,999 | 2 (3.4%) | 28 (29.8%) |
| $100,000 to $149,999 | 20 (33.9%) | 27 (28.7%) |
| $150,000 or more | 2 (3.4%) | 6 (6.4%) |
| Total | 59 (100.0%) | 94 (100.0%) |
Property Value to Household Income Ratio in Thompsonville
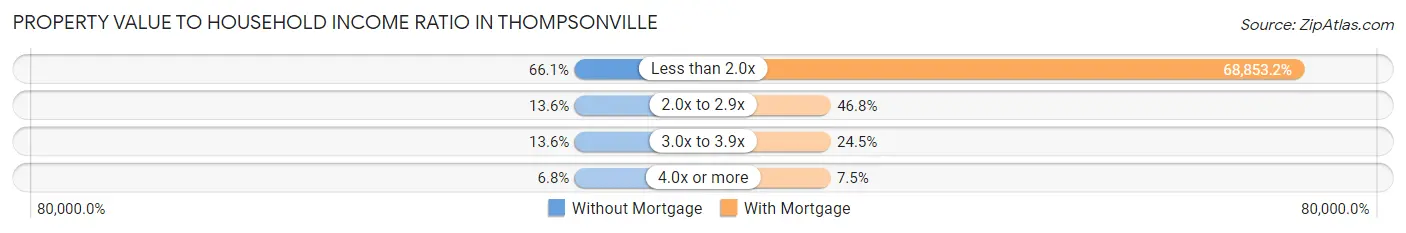
| Value-to-Income Ratio | Without Mortgage | With Mortgage |
| Less than 2.0x | 39 (66.1%) | 64,722 (68,853.2%) |
| 2.0x to 2.9x | 8 (13.6%) | 44 (46.8%) |
| 3.0x to 3.9x | 8 (13.6%) | 23 (24.5%) |
| 4.0x or more | 4 (6.8%) | 7 (7.4%) |
| Total | 59 (100.0%) | 94 (100.0%) |
Real Estate Taxes by Mortgage Status in Thompsonville
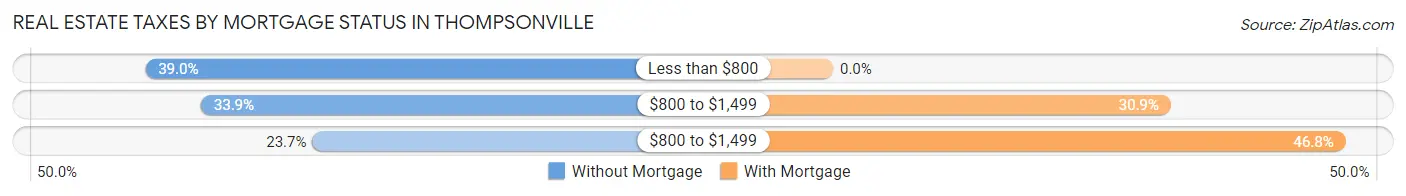
| Property Taxes | Without Mortgage | With Mortgage |
| Less than $800 | 23 (39.0%) | 0 (0.0%) |
| $800 to $1,499 | 20 (33.9%) | 29 (30.8%) |
| $800 to $1,499 | 14 (23.7%) | 44 (46.8%) |
| Total | 59 (100.0%) | 94 (100.0%) |
Health & Disability in Thompsonville
Health Insurance Coverage by Age in Thompsonville
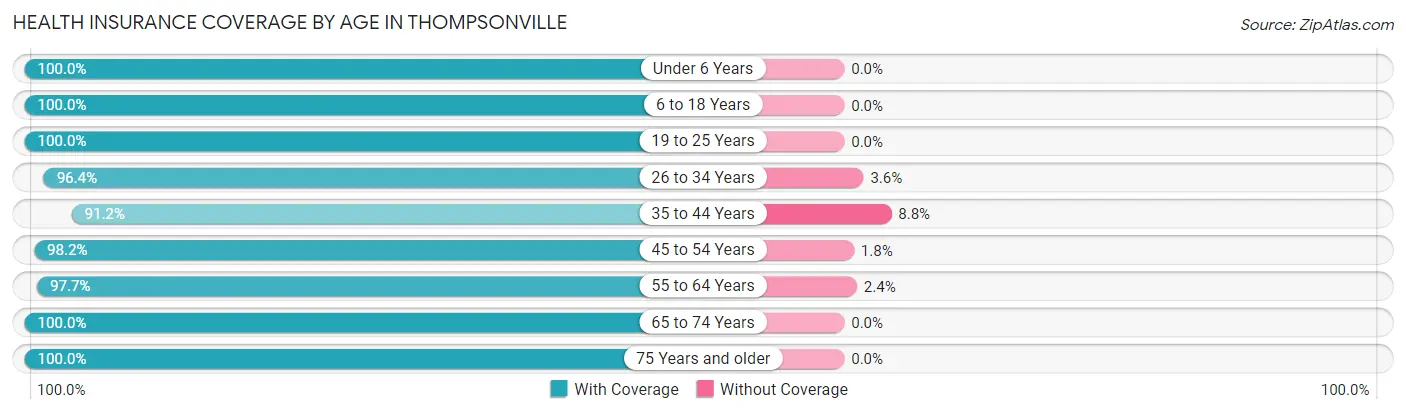
| Age Bracket | With Coverage | Without Coverage |
| Under 6 Years | 26 (100.0%) | 0 (0.0%) |
| 6 to 18 Years | 72 (100.0%) | 0 (0.0%) |
| 19 to 25 Years | 31 (100.0%) | 0 (0.0%) |
| 26 to 34 Years | 54 (96.4%) | 2 (3.6%) |
| 35 to 44 Years | 52 (91.2%) | 5 (8.8%) |
| 45 to 54 Years | 55 (98.2%) | 1 (1.8%) |
| 55 to 64 Years | 83 (97.7%) | 2 (2.4%) |
| 65 to 74 Years | 40 (100.0%) | 0 (0.0%) |
| 75 Years and older | 29 (100.0%) | 0 (0.0%) |
| Total | 442 (97.8%) | 10 (2.2%) |
Health Insurance Coverage by Citizenship Status in Thompsonville
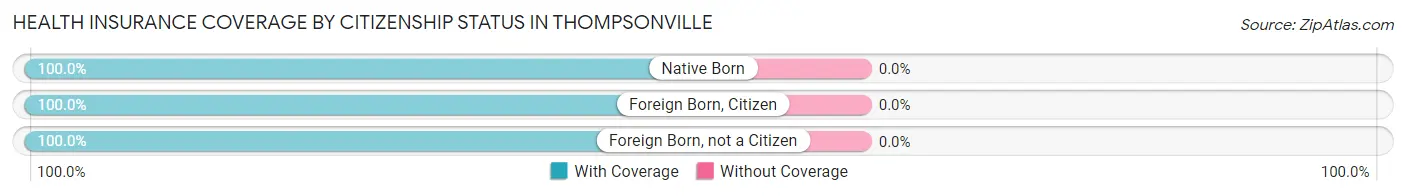
| Citizenship Status | With Coverage | Without Coverage |
| Native Born | 26 (100.0%) | 0 (0.0%) |
| Foreign Born, Citizen | 72 (100.0%) | 0 (0.0%) |
| Foreign Born, not a Citizen | 31 (100.0%) | 0 (0.0%) |
Health Insurance Coverage by Household Income in Thompsonville
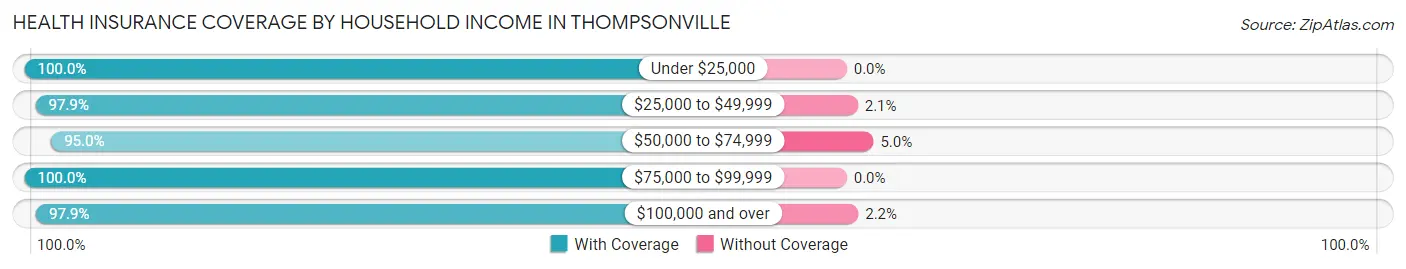
| Household Income | With Coverage | Without Coverage |
| Under $25,000 | 78 (100.0%) | 0 (0.0%) |
| $25,000 to $49,999 | 95 (97.9%) | 2 (2.1%) |
| $50,000 to $74,999 | 114 (95.0%) | 6 (5.0%) |
| $75,000 to $99,999 | 64 (100.0%) | 0 (0.0%) |
| $100,000 and over | 91 (97.9%) | 2 (2.1%) |
Public vs Private Health Insurance Coverage by Age in Thompsonville
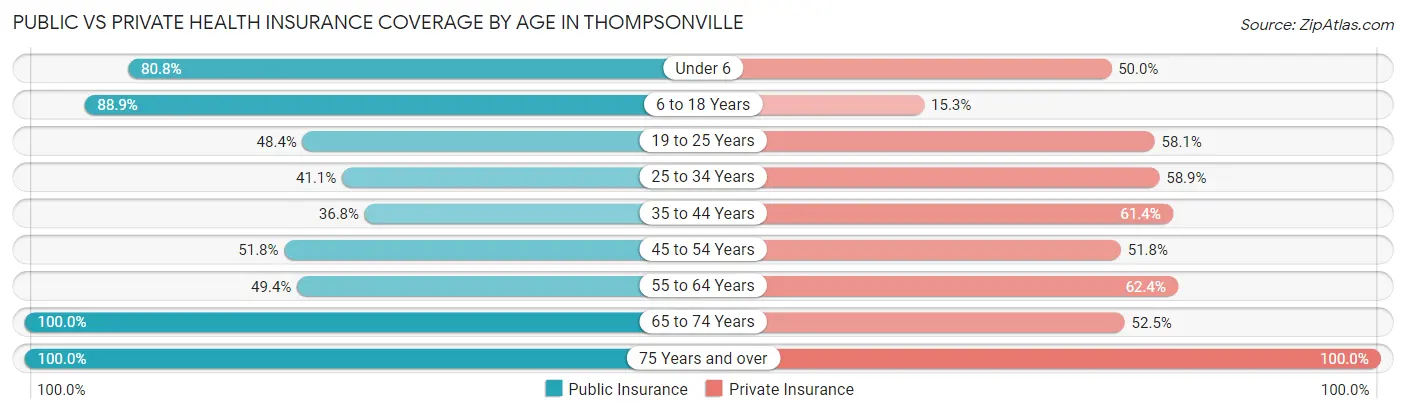
| Age Bracket | Public Insurance | Private Insurance |
| Under 6 | 21 (80.8%) | 13 (50.0%) |
| 6 to 18 Years | 64 (88.9%) | 11 (15.3%) |
| 19 to 25 Years | 15 (48.4%) | 18 (58.1%) |
| 25 to 34 Years | 23 (41.1%) | 33 (58.9%) |
| 35 to 44 Years | 21 (36.8%) | 35 (61.4%) |
| 45 to 54 Years | 29 (51.8%) | 29 (51.8%) |
| 55 to 64 Years | 42 (49.4%) | 53 (62.4%) |
| 65 to 74 Years | 40 (100.0%) | 21 (52.5%) |
| 75 Years and over | 29 (100.0%) | 29 (100.0%) |
| Total | 284 (62.8%) | 242 (53.5%) |
Disability Status by Sex by Age in Thompsonville
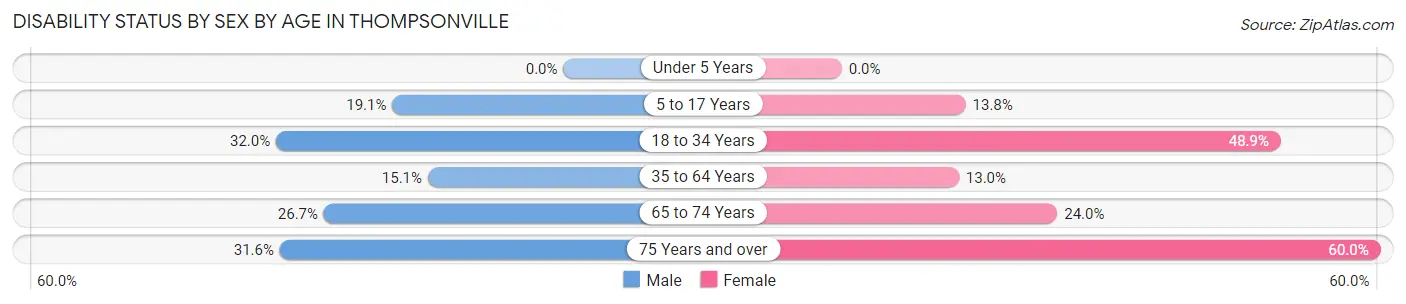
| Age Bracket | Male | Female |
| Under 5 Years | 0 (0.0%) | 0 (0.0%) |
| 5 to 17 Years | 8 (19.1%) | 4 (13.8%) |
| 18 to 34 Years | 16 (32.0%) | 22 (48.9%) |
| 35 to 64 Years | 16 (15.1%) | 12 (13.0%) |
| 65 to 74 Years | 4 (26.7%) | 6 (24.0%) |
| 75 Years and over | 6 (31.6%) | 6 (60.0%) |
Disability Class by Sex by Age in Thompsonville
Disability Class: Hearing Difficulty
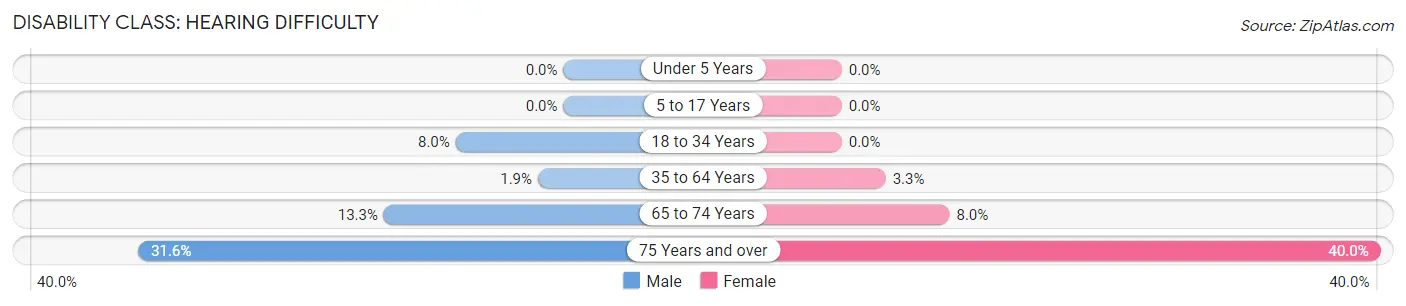
| Age Bracket | Male | Female |
| Under 5 Years | 0 (0.0%) | 0 (0.0%) |
| 5 to 17 Years | 0 (0.0%) | 0 (0.0%) |
| 18 to 34 Years | 4 (8.0%) | 0 (0.0%) |
| 35 to 64 Years | 2 (1.9%) | 3 (3.3%) |
| 65 to 74 Years | 2 (13.3%) | 2 (8.0%) |
| 75 Years and over | 6 (31.6%) | 4 (40.0%) |
Disability Class: Vision Difficulty
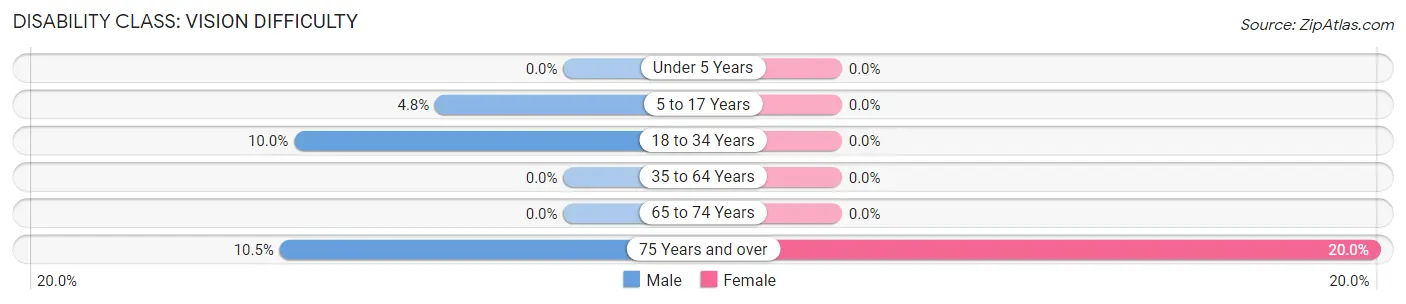
| Age Bracket | Male | Female |
| Under 5 Years | 0 (0.0%) | 0 (0.0%) |
| 5 to 17 Years | 2 (4.8%) | 0 (0.0%) |
| 18 to 34 Years | 5 (10.0%) | 0 (0.0%) |
| 35 to 64 Years | 0 (0.0%) | 0 (0.0%) |
| 65 to 74 Years | 0 (0.0%) | 0 (0.0%) |
| 75 Years and over | 2 (10.5%) | 2 (20.0%) |
Disability Class: Cognitive Difficulty
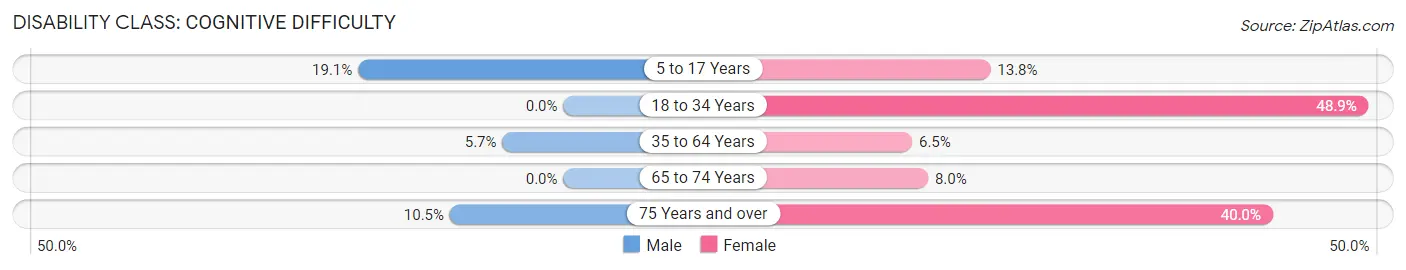
| Age Bracket | Male | Female |
| 5 to 17 Years | 8 (19.1%) | 4 (13.8%) |
| 18 to 34 Years | 0 (0.0%) | 22 (48.9%) |
| 35 to 64 Years | 6 (5.7%) | 6 (6.5%) |
| 65 to 74 Years | 0 (0.0%) | 2 (8.0%) |
| 75 Years and over | 2 (10.5%) | 4 (40.0%) |
Disability Class: Ambulatory Difficulty
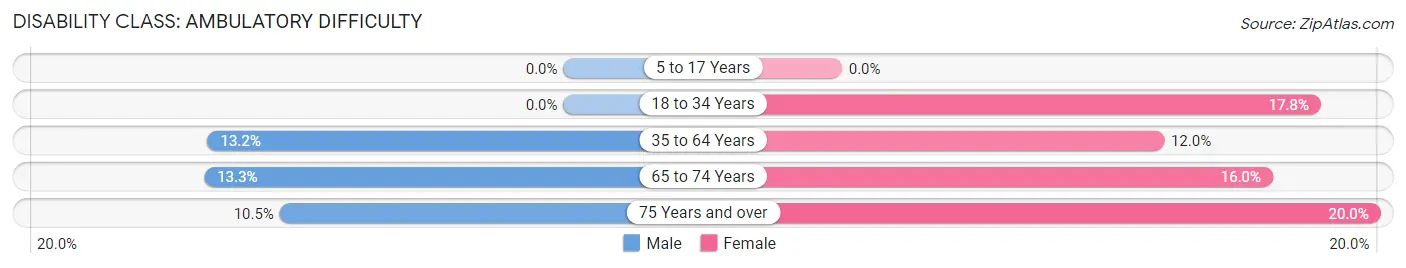
| Age Bracket | Male | Female |
| 5 to 17 Years | 0 (0.0%) | 0 (0.0%) |
| 18 to 34 Years | 0 (0.0%) | 8 (17.8%) |
| 35 to 64 Years | 14 (13.2%) | 11 (12.0%) |
| 65 to 74 Years | 2 (13.3%) | 4 (16.0%) |
| 75 Years and over | 2 (10.5%) | 2 (20.0%) |
Disability Class: Self-Care Difficulty
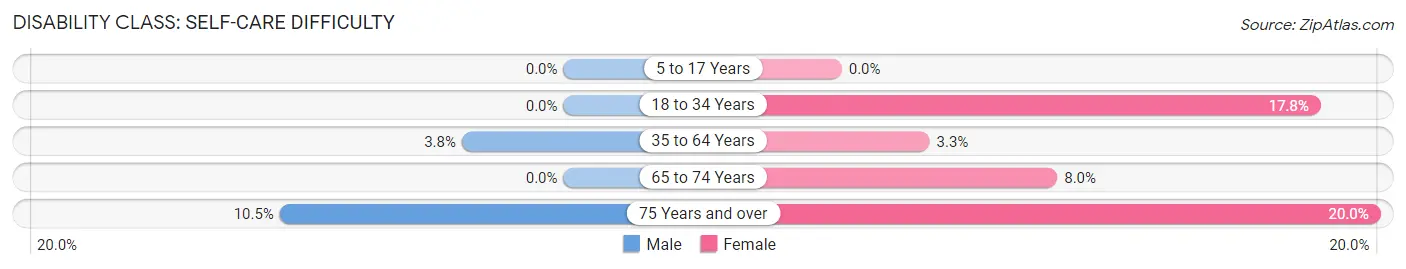
| Age Bracket | Male | Female |
| 5 to 17 Years | 0 (0.0%) | 0 (0.0%) |
| 18 to 34 Years | 0 (0.0%) | 8 (17.8%) |
| 35 to 64 Years | 4 (3.8%) | 3 (3.3%) |
| 65 to 74 Years | 0 (0.0%) | 2 (8.0%) |
| 75 Years and over | 2 (10.5%) | 2 (20.0%) |
Technology Access in Thompsonville
Computing Device Access in Thompsonville
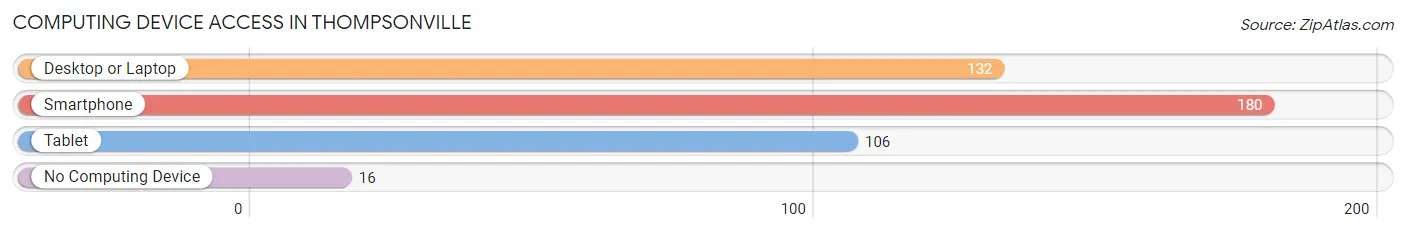
| Device Type | # Households | % Households |
| Desktop or Laptop | 132 | 64.1% |
| Smartphone | 180 | 87.4% |
| Tablet | 106 | 51.5% |
| No Computing Device | 16 | 7.8% |
| Total | 206 | 100.0% |
Internet Access in Thompsonville
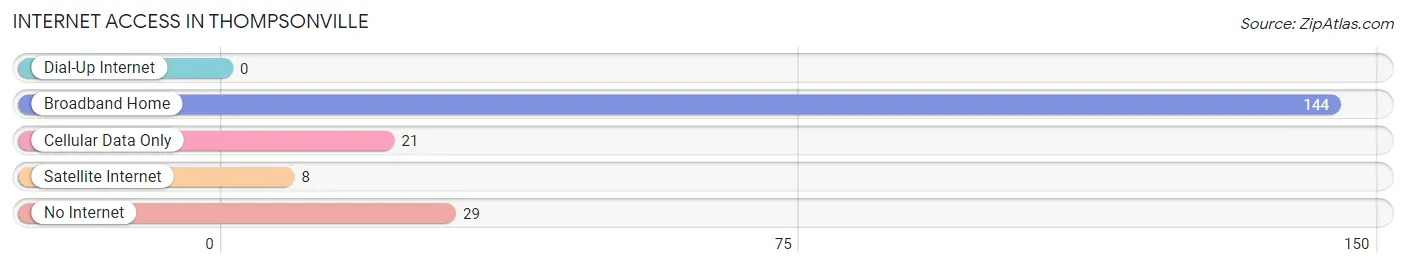
| Internet Type | # Households | % Households |
| Dial-Up Internet | 0 | 0.0% |
| Broadband Home | 144 | 69.9% |
| Cellular Data Only | 21 | 10.2% |
| Satellite Internet | 8 | 3.9% |
| No Internet | 29 | 14.1% |
| Total | 206 | 100.0% |
Thompsonville Summary
Thompsonville is a small unincorporated community located in Benzie County, Michigan. It is situated in the northwest corner of the state, near the border of Wisconsin and Lake Michigan. The population of Thompsonville was estimated to be around 1,000 people in 2020.
History
Thompsonville was founded in 1871 by William Thompson, a lumberman from Wisconsin. He purchased land in the area and built a sawmill, which became the center of the community. The town was named after him. The sawmill was the main source of employment for the town, and it was also the center of the local economy.
In the late 19th century, Thompsonville was a thriving lumber town. The sawmill was the largest employer in the area, and it provided jobs for many of the town’s residents. The town also had a general store, a post office, a blacksmith shop, and a few other businesses.
In the early 20th century, the sawmill closed and the town’s economy shifted to tourism. The town became a popular destination for vacationers, and it was known for its beautiful scenery and outdoor activities.
Geography
Thompsonville is located in the northwest corner of Michigan, near the border of Wisconsin and Lake Michigan. The town is situated in a rural area, surrounded by forests and rolling hills. The nearby Platte River is a popular spot for fishing and canoeing.
The climate in Thompsonville is typical of the Midwest, with cold winters and warm summers. The average temperature in the winter is around 20 degrees Fahrenheit, and the average temperature in the summer is around 70 degrees Fahrenheit.
Economy
The economy of Thompsonville is largely based on tourism. The town is a popular destination for vacationers, and it is known for its beautiful scenery and outdoor activities. The town also has a few small businesses, such as a general store, a post office, and a few restaurants.
The town is also home to a few small manufacturing companies, such as a furniture factory and a woodworking shop. These businesses provide jobs for the local residents.
Demographics
The population of Thompsonville was estimated to be around 1,000 people in 2020. The town is predominantly white, with a small percentage of African American and Hispanic residents. The median household income in the town is around $40,000, and the median home value is around $150,000.
Conclusion
Thompsonville is a small unincorporated community located in Benzie County, Michigan. It is situated in the northwest corner of the state, near the border of Wisconsin and Lake Michigan. The town was founded in 1871 by William Thompson, a lumberman from Wisconsin. The town’s economy is largely based on tourism, and it is known for its beautiful scenery and outdoor activities. The population of Thompsonville was estimated to be around 1,000 people in 2020.
Common Questions
What is Per Capita Income in Thompsonville?
Per Capita income in Thompsonville is $29,358.
What is the Median Family Income in Thompsonville?
Median Family Income in Thompsonville is $70,875.
What is the Median Household income in Thompsonville?
Median Household Income in Thompsonville is $58,929.
What is Income or Wage Gap in Thompsonville?
Income or Wage Gap in Thompsonville is 16.0%.
Women in Thompsonville earn 84.0 cents for every dollar earned by a man.
What is Inequality or Gini Index in Thompsonville?
Inequality or Gini Index in Thompsonville is 0.37.
What is the Total Population of Thompsonville?
Total Population of Thompsonville is 452.
What is the Total Male Population of Thompsonville?
Total Male Population of Thompsonville is 248.
What is the Total Female Population of Thompsonville?
Total Female Population of Thompsonville is 204.
What is the Ratio of Males per 100 Females in Thompsonville?
There are 121.57 Males per 100 Females in Thompsonville.
What is the Ratio of Females per 100 Males in Thompsonville?
There are 82.26 Females per 100 Males in Thompsonville.
What is the Median Population Age in Thompsonville?
Median Population Age in Thompsonville is 41.0 Years.
What is the Average Family Size in Thompsonville
Average Family Size in Thompsonville is 2.9 People.
What is the Average Household Size in Thompsonville
Average Household Size in Thompsonville is 2.2 People.
How Large is the Labor Force in Thompsonville?
There are 237 People in the Labor Forcein in Thompsonville.
What is the Percentage of People in the Labor Force in Thompsonville?
61.9% of People are in the Labor Force in Thompsonville.
What is the Unemployment Rate in Thompsonville?
Unemployment Rate in Thompsonville is 3.0%.