Bellaire, MI Map & Demographics
Bellaire Map
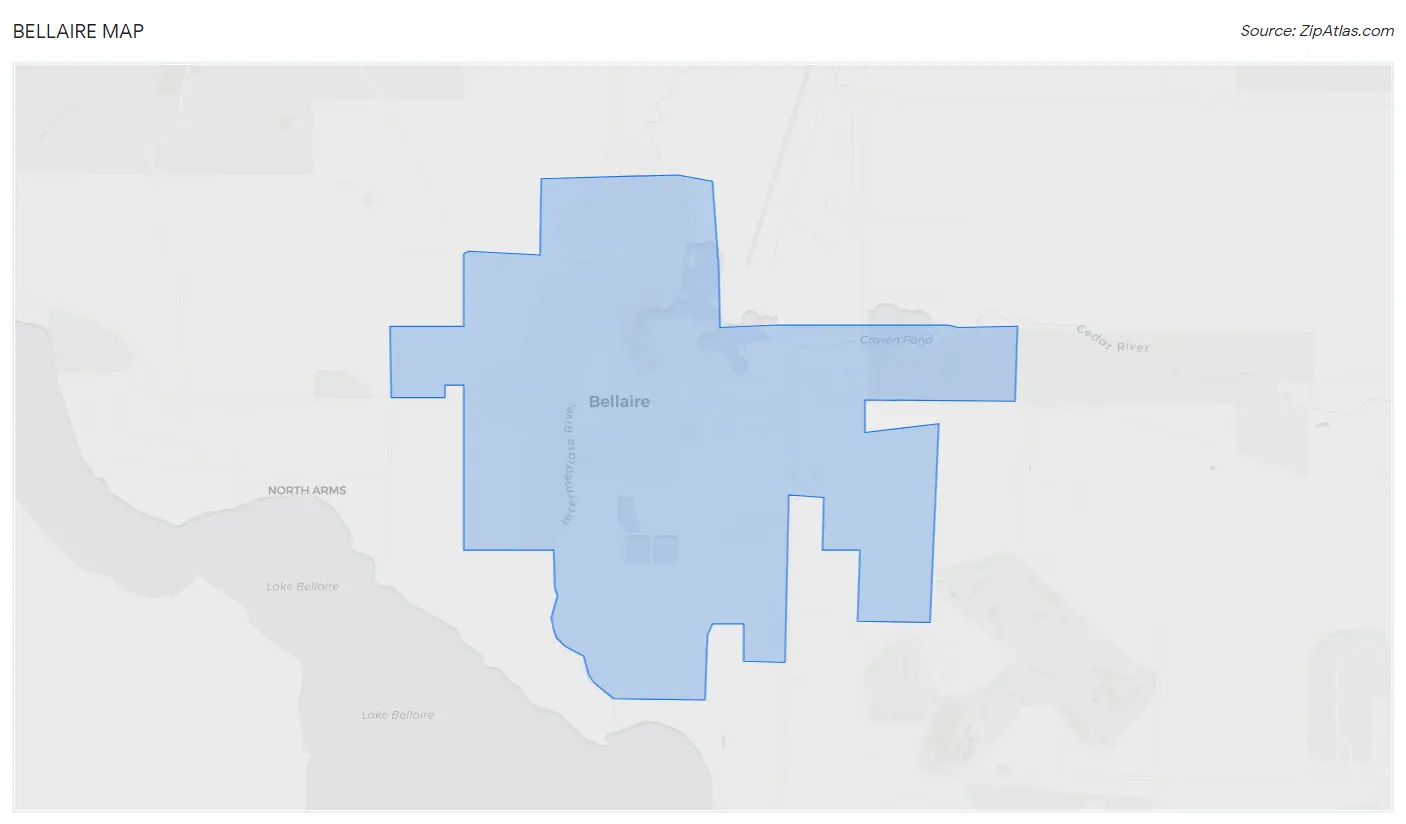
Bellaire Overview
$28,593
PER CAPITA INCOME
$71,250
AVG FAMILY INCOME
$44,896
AVG HOUSEHOLD INCOME
6.8%
WAGE / INCOME GAP [ % ]
93.2¢/ $1
WAGE / INCOME GAP [ $ ]
0.41
INEQUALITY / GINI INDEX
955
TOTAL POPULATION
502
MALE POPULATION
453
FEMALE POPULATION
110.82
MALES / 100 FEMALES
90.24
FEMALES / 100 MALES
44.6
MEDIAN AGE
2.9
AVG FAMILY SIZE
2.0
AVG HOUSEHOLD SIZE
435
LABOR FORCE [ PEOPLE ]
52.6%
PERCENT IN LABOR FORCE
1.1%
UNEMPLOYMENT RATE
Bellaire Zip Codes
Bellaire Area Codes
Income in Bellaire
Income Overview in Bellaire
Per Capita Income in Bellaire is $28,593, while median incomes of families and households are $71,250 and $44,896 respectively.
| Characteristic | Number | Measure |
| Per Capita Income | 955 | $28,593 |
| Median Family Income | 226 | $71,250 |
| Mean Family Income | 226 | $76,314 |
| Median Household Income | 453 | $44,896 |
| Mean Household Income | 453 | $60,050 |
| Income Deficit | 226 | $0 |
| Wage / Income Gap (%) | 955 | 6.84% |
| Wage / Income Gap ($) | 955 | 93.16¢ per $1 |
| Gini / Inequality Index | 955 | 0.41 |
Earnings by Sex in Bellaire
Average Earnings in Bellaire are $30,700, $31,667 for men and $29,500 for women, a difference of 6.8%.
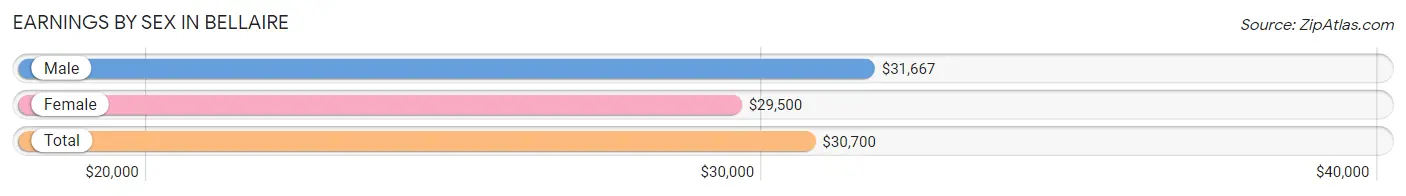
| Sex | Number | Average Earnings |
| Male | 284 (57.7%) | $31,667 |
| Female | 208 (42.3%) | $29,500 |
| Total | 492 (100.0%) | $30,700 |
Earnings by Sex by Income Bracket in Bellaire
The most common earnings brackets in Bellaire are $17,500 to $19,999 for men (25 | 8.8%) and $35,000 to $39,999 for women (32 | 15.4%).
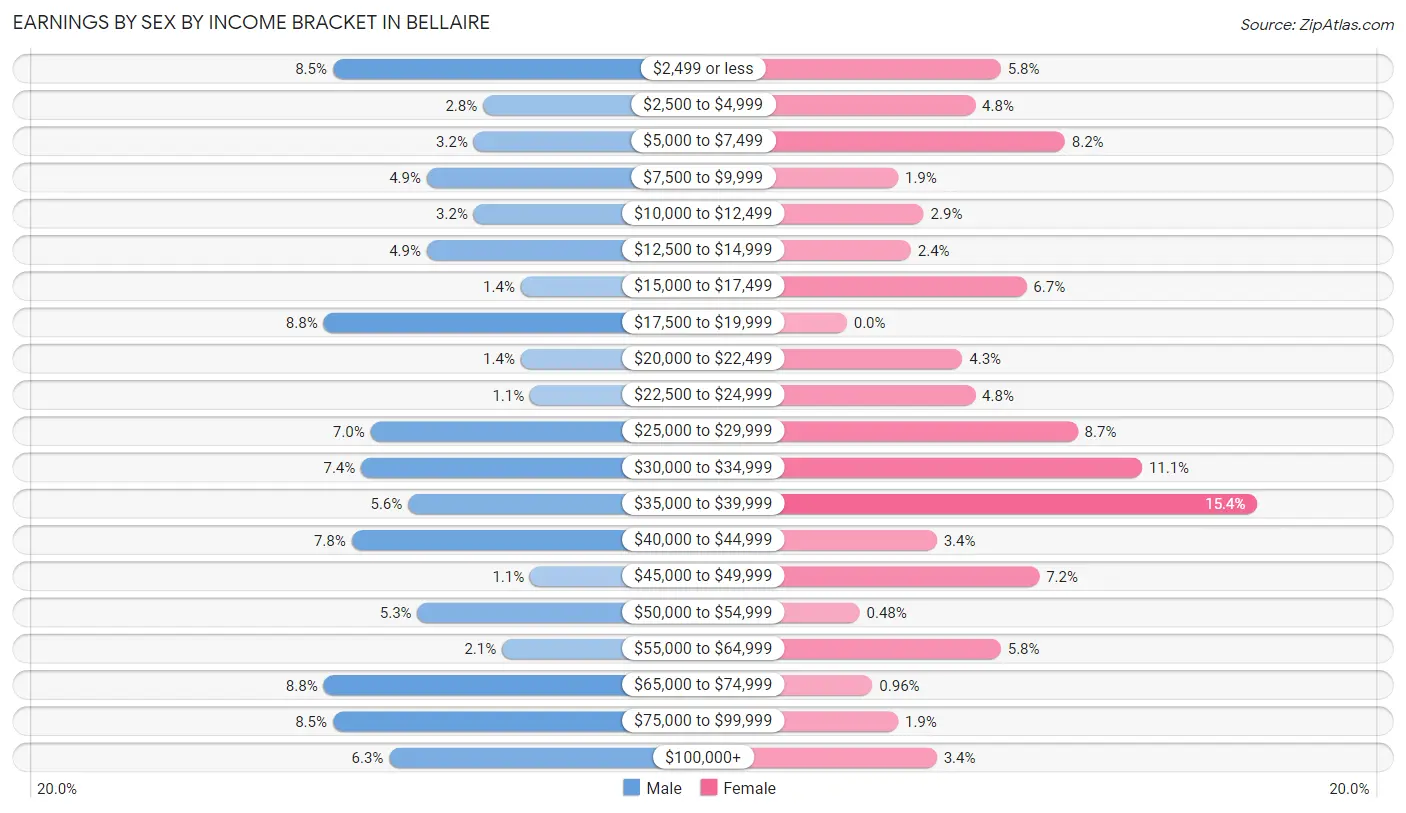
| Income | Male | Female |
| $2,499 or less | 24 (8.5%) | 12 (5.8%) |
| $2,500 to $4,999 | 8 (2.8%) | 10 (4.8%) |
| $5,000 to $7,499 | 9 (3.2%) | 17 (8.2%) |
| $7,500 to $9,999 | 14 (4.9%) | 4 (1.9%) |
| $10,000 to $12,499 | 9 (3.2%) | 6 (2.9%) |
| $12,500 to $14,999 | 14 (4.9%) | 5 (2.4%) |
| $15,000 to $17,499 | 4 (1.4%) | 14 (6.7%) |
| $17,500 to $19,999 | 25 (8.8%) | 0 (0.0%) |
| $20,000 to $22,499 | 4 (1.4%) | 9 (4.3%) |
| $22,500 to $24,999 | 3 (1.1%) | 10 (4.8%) |
| $25,000 to $29,999 | 20 (7.0%) | 18 (8.6%) |
| $30,000 to $34,999 | 21 (7.4%) | 23 (11.1%) |
| $35,000 to $39,999 | 16 (5.6%) | 32 (15.4%) |
| $40,000 to $44,999 | 22 (7.7%) | 7 (3.4%) |
| $45,000 to $49,999 | 3 (1.1%) | 15 (7.2%) |
| $50,000 to $54,999 | 15 (5.3%) | 1 (0.5%) |
| $55,000 to $64,999 | 6 (2.1%) | 12 (5.8%) |
| $65,000 to $74,999 | 25 (8.8%) | 2 (1.0%) |
| $75,000 to $99,999 | 24 (8.5%) | 4 (1.9%) |
| $100,000+ | 18 (6.3%) | 7 (3.4%) |
| Total | 284 (100.0%) | 208 (100.0%) |
Earnings by Sex by Educational Attainment in Bellaire
Average earnings in Bellaire are $40,469 for men and $29,000 for women, a difference of 28.3%. Men with an educational attainment of bachelor's degree enjoy the highest average annual earnings of $52,167, while those with high school diploma education earn the least with $29,250. Women with an educational attainment of college or associate's degree earn the most with the average annual earnings of $35,547, while those with high school diploma education have the smallest earnings of $23,750.
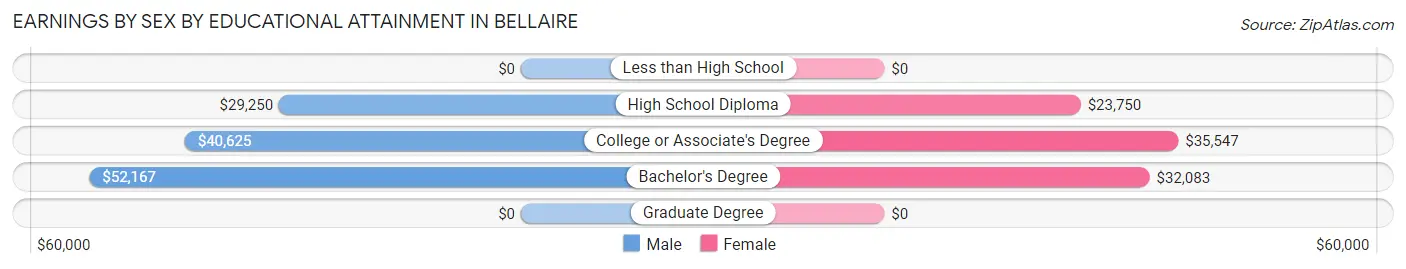
| Educational Attainment | Male Income | Female Income |
| Less than High School | - | - |
| High School Diploma | $29,250 | $23,750 |
| College or Associate's Degree | $40,625 | $35,547 |
| Bachelor's Degree | $52,167 | $32,083 |
| Graduate Degree | - | - |
| Total | $40,469 | $29,000 |
Family Income in Bellaire
Family Income Brackets in Bellaire
According to the Bellaire family income data, there are 54 families falling into the $75,000 to $99,999 income range, which is the most common income bracket and makes up 23.9% of all families. Conversely, the less than $10,000 income bracket is the least frequent group with only 4 families (1.8%) belonging to this category.
| Income Bracket | # Families | % Families |
| Less than $10,000 | 4 | 1.8% |
| $10,000 to $14,999 | 12 | 5.3% |
| $15,000 to $24,999 | 5 | 2.2% |
| $25,000 to $34,999 | 33 | 14.6% |
| $35,000 to $49,999 | 35 | 15.5% |
| $50,000 to $74,999 | 33 | 14.6% |
| $75,000 to $99,999 | 54 | 23.9% |
| $100,000 to $149,999 | 33 | 14.6% |
| $150,000 to $199,999 | 12 | 5.3% |
| $200,000+ | 5 | 2.2% |
Family Income by Famaliy Size in Bellaire
5-person families (18 | 8.0%) account for the highest median family income in Bellaire with $96,250 per family, while 2-person families (118 | 52.2%) have the highest median income of $32,188 per family member.
| Income Bracket | # Families | Median Income |
| 2-Person Families | 118 (52.2%) | $64,375 |
| 3-Person Families | 40 (17.7%) | $0 |
| 4-Person Families | 34 (15.0%) | $0 |
| 5-Person Families | 18 (8.0%) | $96,250 |
| 6-Person Families | 16 (7.1%) | $0 |
| 7+ Person Families | 0 (0.0%) | $0 |
| Total | 226 (100.0%) | $71,250 |
Family Income by Number of Earners in Bellaire
The median family income in Bellaire is $71,250, with families comprising 3+ earners (25) having the highest median family income of $95,972, while families with no earners (48) have the lowest median family income of $41,875, accounting for 11.1% and 21.2% of families, respectively.
| Number of Earners | # Families | Median Income |
| No Earners | 48 (21.2%) | $41,875 |
| 1 Earner | 43 (19.0%) | $49,063 |
| 2 Earners | 110 (48.7%) | $73,750 |
| 3+ Earners | 25 (11.1%) | $95,972 |
| Total | 226 (100.0%) | $71,250 |
Household Income in Bellaire
Household Income Brackets in Bellaire
With 81 households falling in the category, the $50,000 to $74,999 income range is the most frequent in Bellaire, accounting for 17.9% of all households. In contrast, only 5 households (1.1%) fall into the $200,000+ income bracket, making it the least populous group.
| Income Bracket | # Households | % Households |
| Less than $10,000 | 10 | 2.2% |
| $10,000 to $14,999 | 34 | 7.5% |
| $15,000 to $24,999 | 77 | 17.0% |
| $25,000 to $34,999 | 51 | 11.3% |
| $35,000 to $49,999 | 63 | 13.9% |
| $50,000 to $74,999 | 81 | 17.9% |
| $75,000 to $99,999 | 69 | 15.2% |
| $100,000 to $149,999 | 49 | 10.8% |
| $150,000 to $199,999 | 14 | 3.1% |
| $200,000+ | 5 | 1.1% |
Household Income by Householder Age in Bellaire
The median household income in Bellaire is $44,896, with the highest median household income of $76,429 found in the 25 to 44 years age bracket for the primary householder. A total of 116 households (25.6%) fall into this category. Meanwhile, the 15 to 24 years age bracket for the primary householder has the lowest median household income of $0, with 11 households (2.4%) in this group.
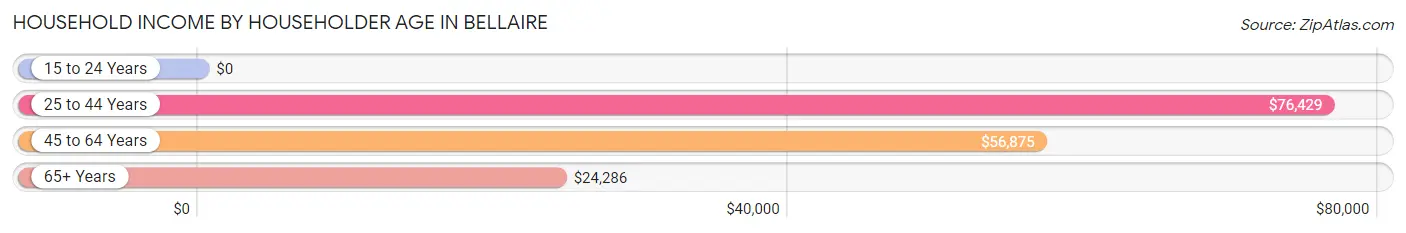
| Income Bracket | # Households | Median Income |
| 15 to 24 Years | 11 (2.4%) | $0 |
| 25 to 44 Years | 116 (25.6%) | $76,429 |
| 45 to 64 Years | 156 (34.4%) | $56,875 |
| 65+ Years | 170 (37.5%) | $24,286 |
| Total | 453 (100.0%) | $44,896 |
Poverty in Bellaire
Income Below Poverty by Sex and Age in Bellaire
With 8.9% poverty level for males and 15.2% for females among the residents of Bellaire, 12 to 14 year old males and 6 to 11 year old females are the most vulnerable to poverty, with 4 males (100.0%) and 9 females (50.0%) in their respective age groups living below the poverty level.
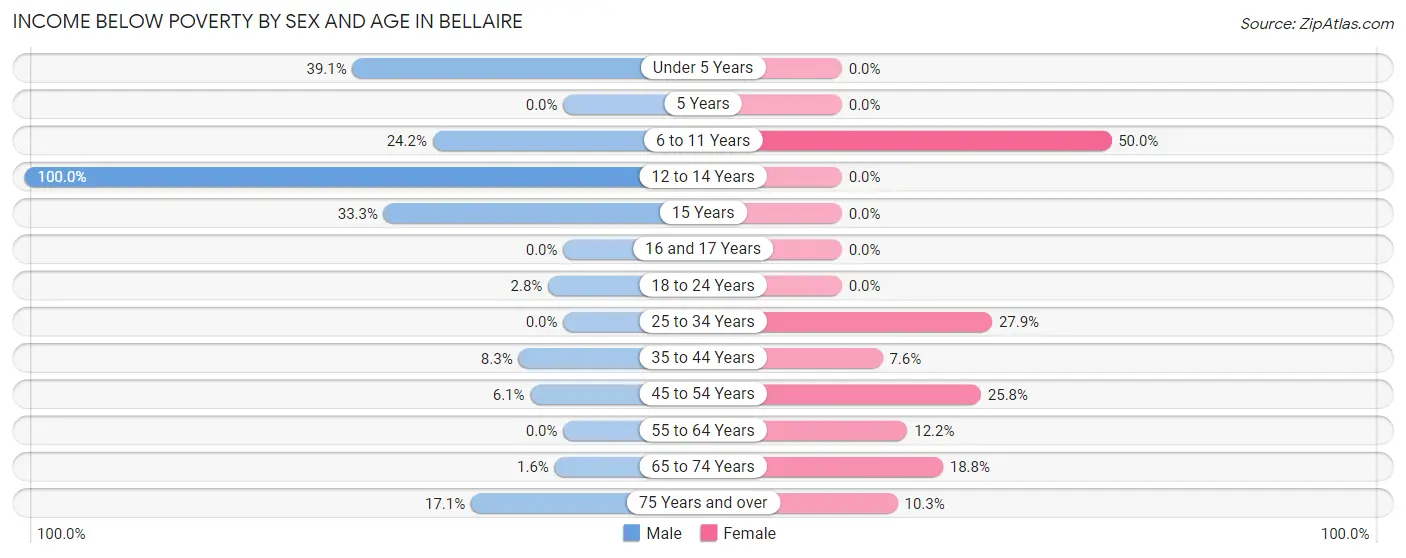
| Age Bracket | Male | Female |
| Under 5 Years | 9 (39.1%) | 0 (0.0%) |
| 5 Years | 0 (0.0%) | 0 (0.0%) |
| 6 to 11 Years | 8 (24.2%) | 9 (50.0%) |
| 12 to 14 Years | 4 (100.0%) | 0 (0.0%) |
| 15 Years | 4 (33.3%) | 0 (0.0%) |
| 16 and 17 Years | 0 (0.0%) | 0 (0.0%) |
| 18 to 24 Years | 2 (2.8%) | 0 (0.0%) |
| 25 to 34 Years | 0 (0.0%) | 17 (27.9%) |
| 35 to 44 Years | 5 (8.3%) | 4 (7.5%) |
| 45 to 54 Years | 3 (6.1%) | 8 (25.8%) |
| 55 to 64 Years | 0 (0.0%) | 9 (12.2%) |
| 65 to 74 Years | 1 (1.6%) | 15 (18.8%) |
| 75 Years and over | 6 (17.1%) | 6 (10.3%) |
| Total | 42 (8.9%) | 68 (15.2%) |
Income Above Poverty by Sex and Age in Bellaire
According to the poverty statistics in Bellaire, males aged 5 years and females aged under 5 years are the age groups that are most secure financially, with 100.0% of males and 100.0% of females in these age groups living above the poverty line.
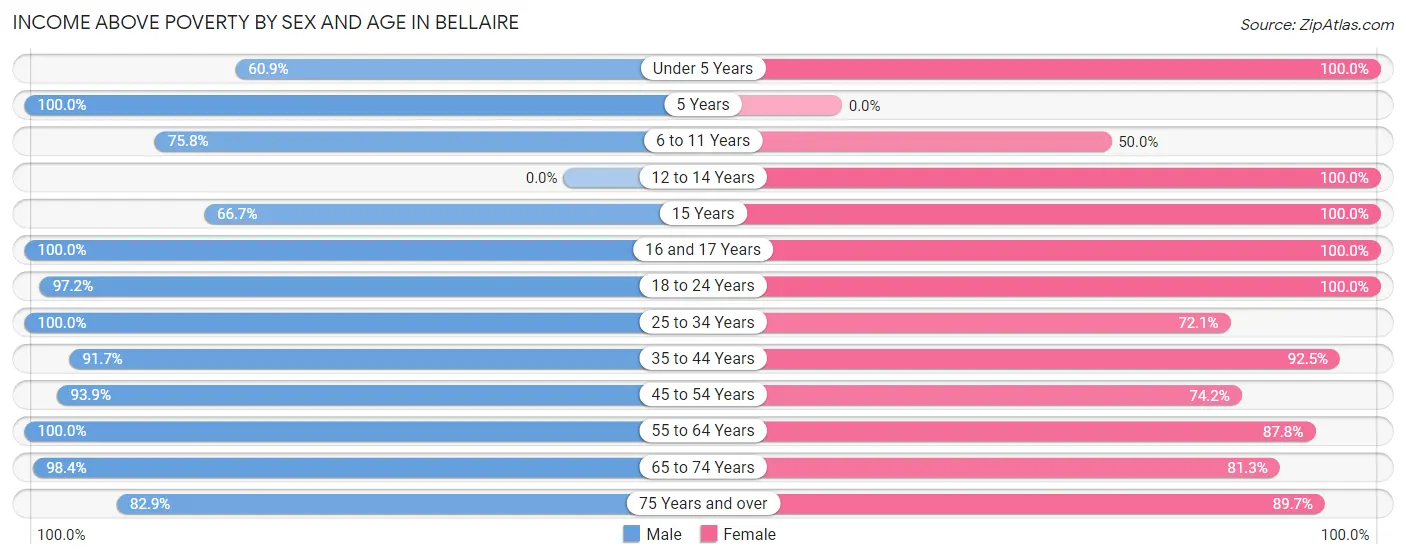
| Age Bracket | Male | Female |
| Under 5 Years | 14 (60.9%) | 17 (100.0%) |
| 5 Years | 3 (100.0%) | 0 (0.0%) |
| 6 to 11 Years | 25 (75.8%) | 9 (50.0%) |
| 12 to 14 Years | 0 (0.0%) | 14 (100.0%) |
| 15 Years | 8 (66.7%) | 4 (100.0%) |
| 16 and 17 Years | 4 (100.0%) | 12 (100.0%) |
| 18 to 24 Years | 69 (97.2%) | 25 (100.0%) |
| 25 to 34 Years | 40 (100.0%) | 44 (72.1%) |
| 35 to 44 Years | 55 (91.7%) | 49 (92.4%) |
| 45 to 54 Years | 46 (93.9%) | 23 (74.2%) |
| 55 to 64 Years | 78 (100.0%) | 65 (87.8%) |
| 65 to 74 Years | 61 (98.4%) | 65 (81.2%) |
| 75 Years and over | 29 (82.9%) | 52 (89.7%) |
| Total | 432 (91.1%) | 379 (84.8%) |
Income Below Poverty Among Married-Couple Families in Bellaire
The poverty statistics for married-couple families in Bellaire show that 0.6% or 1 of the total 166 families live below the poverty line. Families with no children have the highest poverty rate of 0.9%, comprising of 1 families. On the other hand, families with 1 or 2 children have the lowest poverty rate of 0.0%, which includes 0 families.
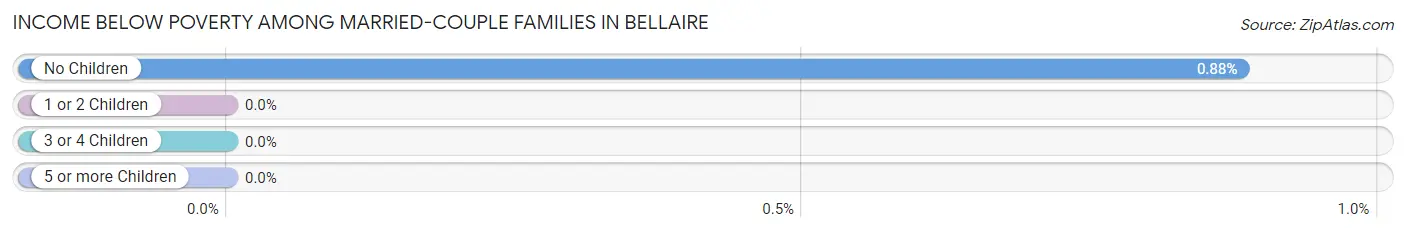
| Children | Above Poverty | Below Poverty |
| No Children | 112 (99.1%) | 1 (0.9%) |
| 1 or 2 Children | 46 (100.0%) | 0 (0.0%) |
| 3 or 4 Children | 7 (100.0%) | 0 (0.0%) |
| 5 or more Children | 0 (0.0%) | 0 (0.0%) |
| Total | 165 (99.4%) | 1 (0.6%) |
Income Below Poverty Among Single-Parent Households in Bellaire
According to the poverty data in Bellaire, 56.2% or 9 single-father households and 25.0% or 11 single-mother households are living below the poverty line. Among single-father households, those with 1 or 2 children have the highest poverty rate, with 5 households (62.5%) experiencing poverty. Likewise, among single-mother households, those with 1 or 2 children have the highest poverty rate, with 11 households (35.5%) falling below the poverty line.
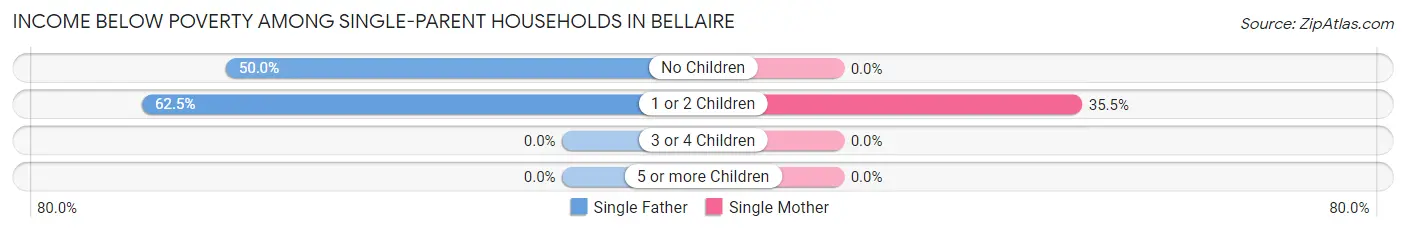
| Children | Single Father | Single Mother |
| No Children | 4 (50.0%) | 0 (0.0%) |
| 1 or 2 Children | 5 (62.5%) | 11 (35.5%) |
| 3 or 4 Children | 0 (0.0%) | 0 (0.0%) |
| 5 or more Children | 0 (0.0%) | 0 (0.0%) |
| Total | 9 (56.2%) | 11 (25.0%) |
Income Below Poverty Among Married-Couple vs Single-Parent Households in Bellaire
The poverty data for Bellaire shows that 1 of the married-couple family households (0.6%) and 20 of the single-parent households (33.3%) are living below the poverty level. Within the married-couple family households, those with no children have the highest poverty rate, with 1 households (0.9%) falling below the poverty line. Among the single-parent households, those with 1 or 2 children have the highest poverty rate, with 16 household (41.0%) living below poverty.
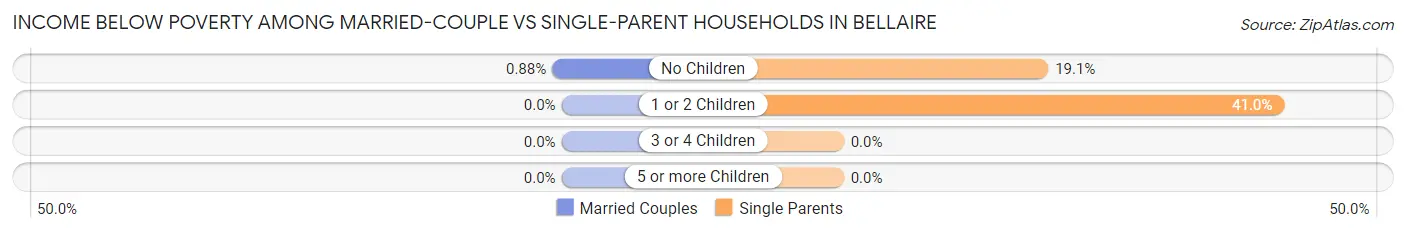
| Children | Married-Couple Families | Single-Parent Households |
| No Children | 1 (0.9%) | 4 (19.1%) |
| 1 or 2 Children | 0 (0.0%) | 16 (41.0%) |
| 3 or 4 Children | 0 (0.0%) | 0 (0.0%) |
| 5 or more Children | 0 (0.0%) | 0 (0.0%) |
| Total | 1 (0.6%) | 20 (33.3%) |
Race in Bellaire
The most populous races in Bellaire are White / Caucasian (892 | 93.4%), Two or more Races (39 | 4.1%), and Hispanic or Latino (16 | 1.7%).
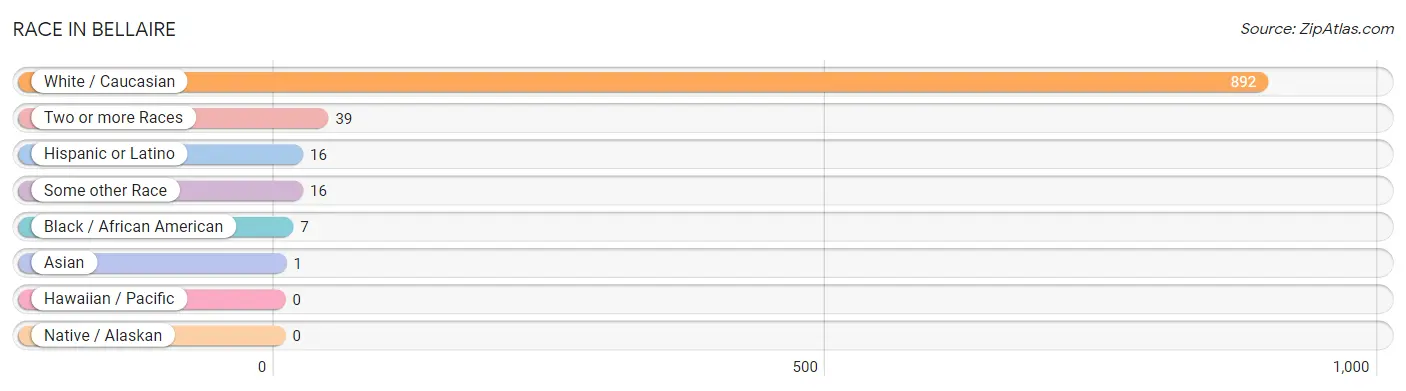
| Race | # Population | % Population |
| Asian | 1 | 0.1% |
| Black / African American | 7 | 0.7% |
| Hawaiian / Pacific | 0 | 0.0% |
| Hispanic or Latino | 16 | 1.7% |
| Native / Alaskan | 0 | 0.0% |
| White / Caucasian | 892 | 93.4% |
| Two or more Races | 39 | 4.1% |
| Some other Race | 16 | 1.7% |
| Total | 955 | 100.0% |
Ancestry in Bellaire
The most populous ancestries reported in Bellaire are German (247 | 25.9%), English (176 | 18.4%), Irish (107 | 11.2%), French (81 | 8.5%), and American (55 | 5.8%), together accounting for 69.7% of all Bellaire residents.
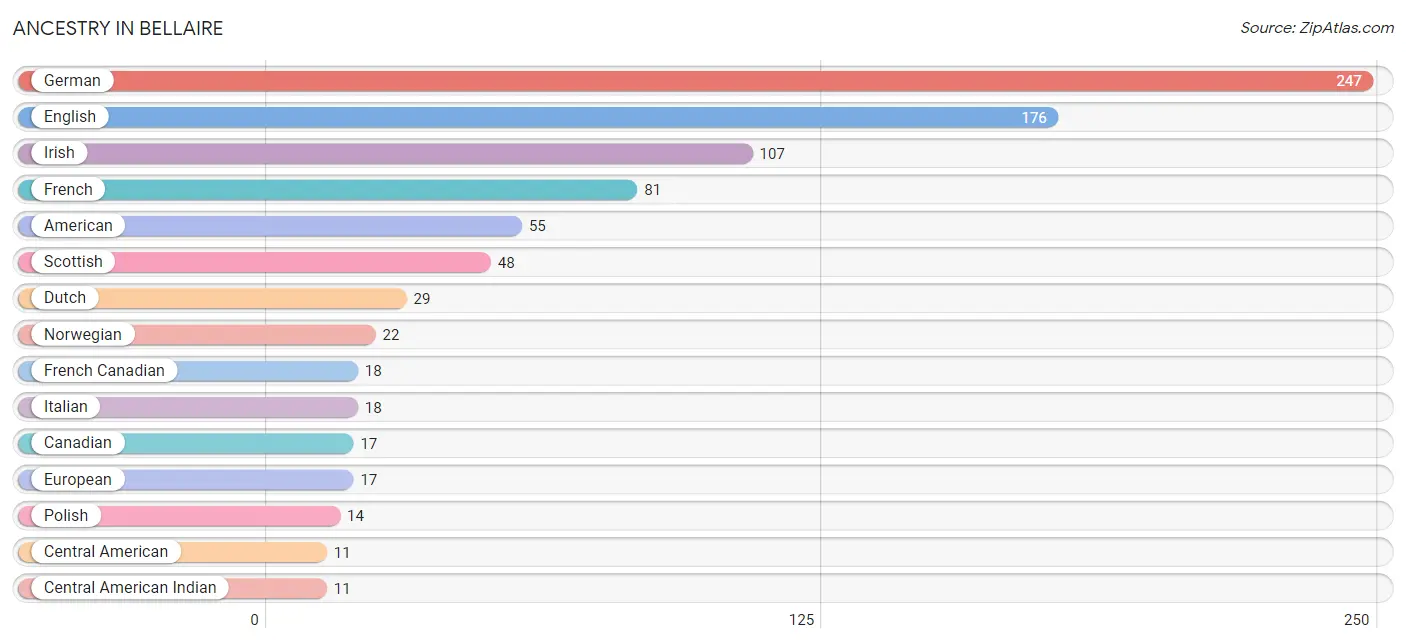
| Ancestry | # Population | % Population |
| American | 55 | 5.8% |
| Burmese | 9 | 0.9% |
| Canadian | 17 | 1.8% |
| Central American | 11 | 1.1% |
| Central American Indian | 11 | 1.1% |
| Danish | 4 | 0.4% |
| Dutch | 29 | 3.0% |
| English | 176 | 18.4% |
| European | 17 | 1.8% |
| Finnish | 5 | 0.5% |
| French | 81 | 8.5% |
| French Canadian | 18 | 1.9% |
| German | 247 | 25.9% |
| Guatemalan | 11 | 1.1% |
| Indian (Asian) | 1 | 0.1% |
| Irish | 107 | 11.2% |
| Italian | 18 | 1.9% |
| Kenyan | 2 | 0.2% |
| Latvian | 2 | 0.2% |
| Mexican | 1 | 0.1% |
| Mexican American Indian | 1 | 0.1% |
| Northern European | 3 | 0.3% |
| Norwegian | 22 | 2.3% |
| Polish | 14 | 1.5% |
| Puerto Rican | 2 | 0.2% |
| Russian | 3 | 0.3% |
| Scandinavian | 4 | 0.4% |
| Scotch-Irish | 10 | 1.1% |
| Scottish | 48 | 5.0% |
| Spaniard | 2 | 0.2% |
| Subsaharan African | 2 | 0.2% |
| Swedish | 10 | 1.1% |
| Swiss | 2 | 0.2% |
| Welsh | 4 | 0.4% |
| Yugoslavian | 4 | 0.4% | View All 35 Rows |
Immigrants in Bellaire
The most numerous immigrant groups reported in Bellaire came from Canada (9 | 0.9%), Europe (2 | 0.2%), Germany (2 | 0.2%), and Western Europe (2 | 0.2%), together accounting for 1.6% of all Bellaire residents.
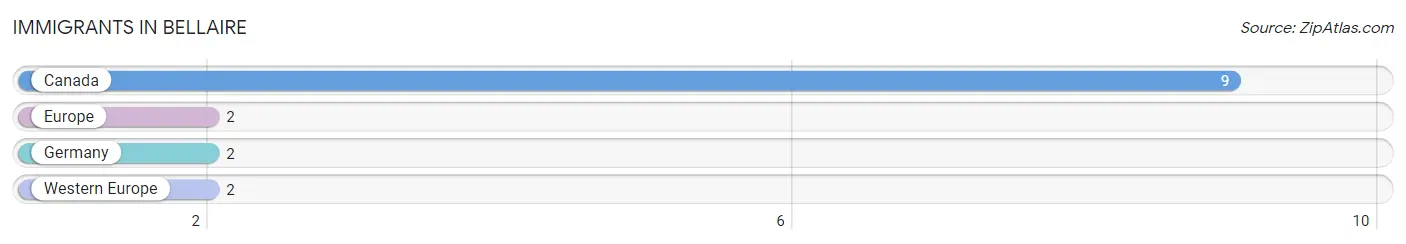
| Immigration Origin | # Population | % Population |
| Canada | 9 | 0.9% |
| Europe | 2 | 0.2% |
| Germany | 2 | 0.2% |
| Western Europe | 2 | 0.2% | View All 4 Rows |
Sex and Age in Bellaire
Sex and Age in Bellaire
The most populous age groups in Bellaire are 15 to 19 Years (55 | 11.0%) for men and 65 to 69 Years (54 | 11.9%) for women.
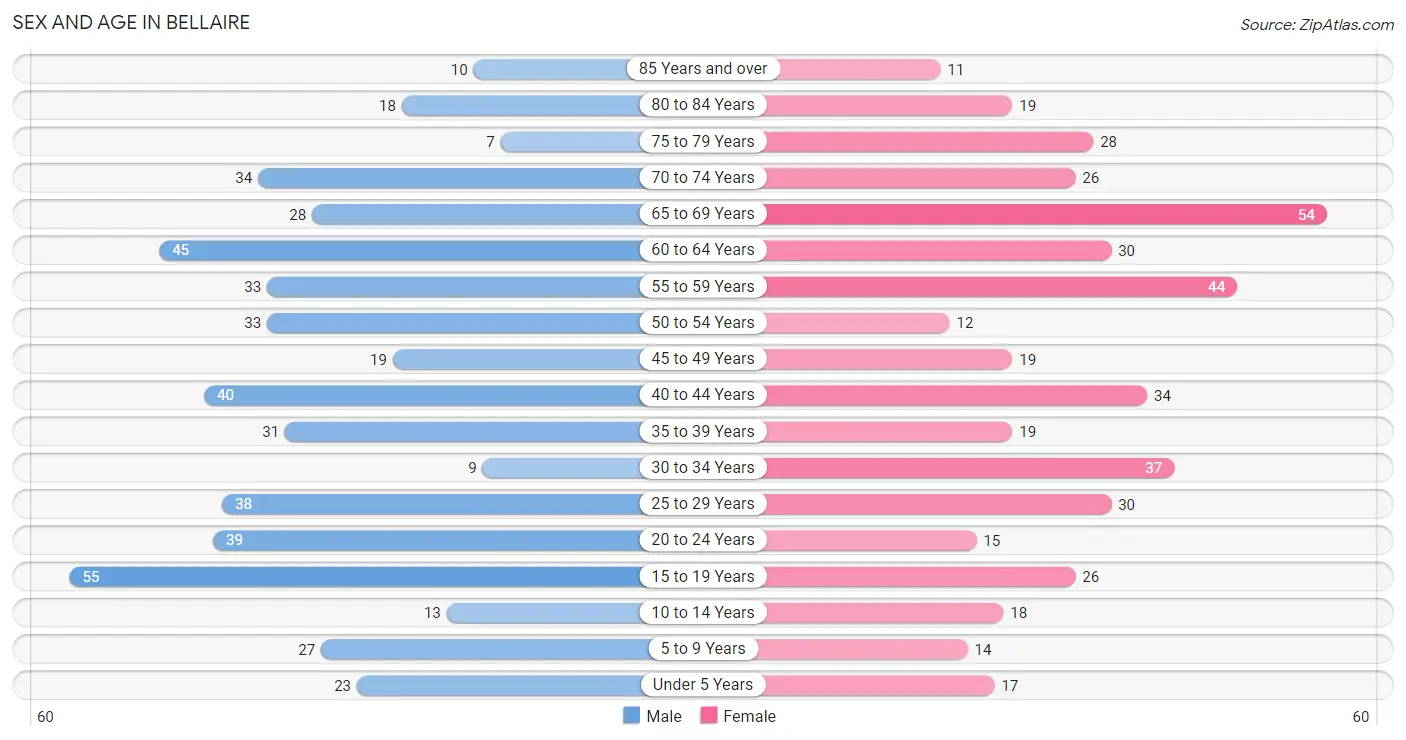
| Age Bracket | Male | Female |
| Under 5 Years | 23 (4.6%) | 17 (3.7%) |
| 5 to 9 Years | 27 (5.4%) | 14 (3.1%) |
| 10 to 14 Years | 13 (2.6%) | 18 (4.0%) |
| 15 to 19 Years | 55 (11.0%) | 26 (5.7%) |
| 20 to 24 Years | 39 (7.8%) | 15 (3.3%) |
| 25 to 29 Years | 38 (7.6%) | 30 (6.6%) |
| 30 to 34 Years | 9 (1.8%) | 37 (8.2%) |
| 35 to 39 Years | 31 (6.2%) | 19 (4.2%) |
| 40 to 44 Years | 40 (8.0%) | 34 (7.5%) |
| 45 to 49 Years | 19 (3.8%) | 19 (4.2%) |
| 50 to 54 Years | 33 (6.6%) | 12 (2.6%) |
| 55 to 59 Years | 33 (6.6%) | 44 (9.7%) |
| 60 to 64 Years | 45 (9.0%) | 30 (6.6%) |
| 65 to 69 Years | 28 (5.6%) | 54 (11.9%) |
| 70 to 74 Years | 34 (6.8%) | 26 (5.7%) |
| 75 to 79 Years | 7 (1.4%) | 28 (6.2%) |
| 80 to 84 Years | 18 (3.6%) | 19 (4.2%) |
| 85 Years and over | 10 (2.0%) | 11 (2.4%) |
| Total | 502 (100.0%) | 453 (100.0%) |
Families and Households in Bellaire
Median Family Size in Bellaire
The median family size in Bellaire is 2.85 persons per family, with married-couple families (166 | 73.5%) accounting for the largest median family size of 2.9 persons per family. On the other hand, single male/father families (16 | 7.1%) represent the smallest median family size with 2.38 persons per family.
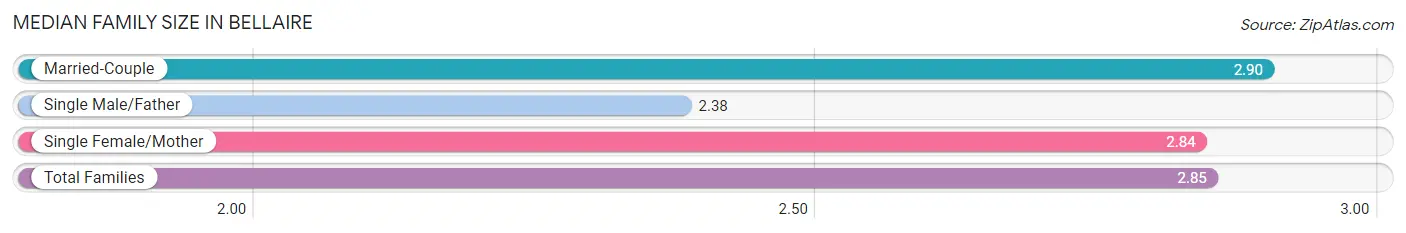
| Family Type | # Families | Family Size |
| Married-Couple | 166 (73.5%) | 2.90 |
| Single Male/Father | 16 (7.1%) | 2.38 |
| Single Female/Mother | 44 (19.5%) | 2.84 |
| Total Families | 226 (100.0%) | 2.85 |
Median Household Size in Bellaire
The median household size in Bellaire is 2.03 persons per household, with single female/mother households (44 | 9.7%) accounting for the largest median household size of 3.07 persons per household. non-family households (227 | 50.1%) represent the smallest median household size with 1.15 persons per household.
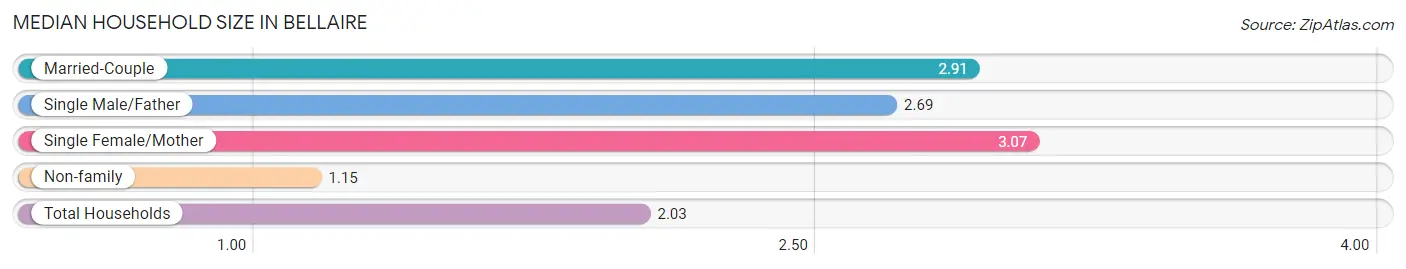
| Household Type | # Households | Household Size |
| Married-Couple | 166 (36.6%) | 2.91 |
| Single Male/Father | 16 (3.5%) | 2.69 |
| Single Female/Mother | 44 (9.7%) | 3.07 |
| Non-family | 227 (50.1%) | 1.15 |
| Total Households | 453 (100.0%) | 2.03 |
Household Size by Marriage Status in Bellaire
Out of a total of 453 households in Bellaire, 226 (49.9%) are family households, while 227 (50.1%) are nonfamily households. The most numerous type of family households are 2-person households, comprising 113, and the most common type of nonfamily households are 1-person households, comprising 198.
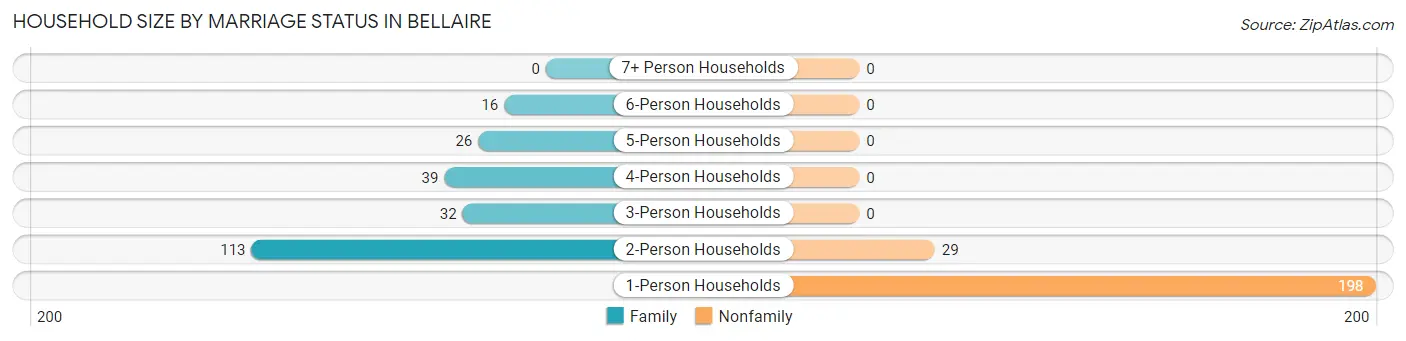
| Household Size | Family Households | Nonfamily Households |
| 1-Person Households | - | 198 (43.7%) |
| 2-Person Households | 113 (24.9%) | 29 (6.4%) |
| 3-Person Households | 32 (7.1%) | 0 (0.0%) |
| 4-Person Households | 39 (8.6%) | 0 (0.0%) |
| 5-Person Households | 26 (5.7%) | 0 (0.0%) |
| 6-Person Households | 16 (3.5%) | 0 (0.0%) |
| 7+ Person Households | 0 (0.0%) | 0 (0.0%) |
| Total | 226 (49.9%) | 227 (50.1%) |
Female Fertility in Bellaire
Fertility by Age in Bellaire
Average fertility rate in Bellaire is 121.0 births per 1,000 women. Women in the age bracket of 20 to 34 years have the highest fertility rate with 232.0 births per 1,000 women. Women in the age bracket of 20 to 34 years acount for 86.4% of all women with births.
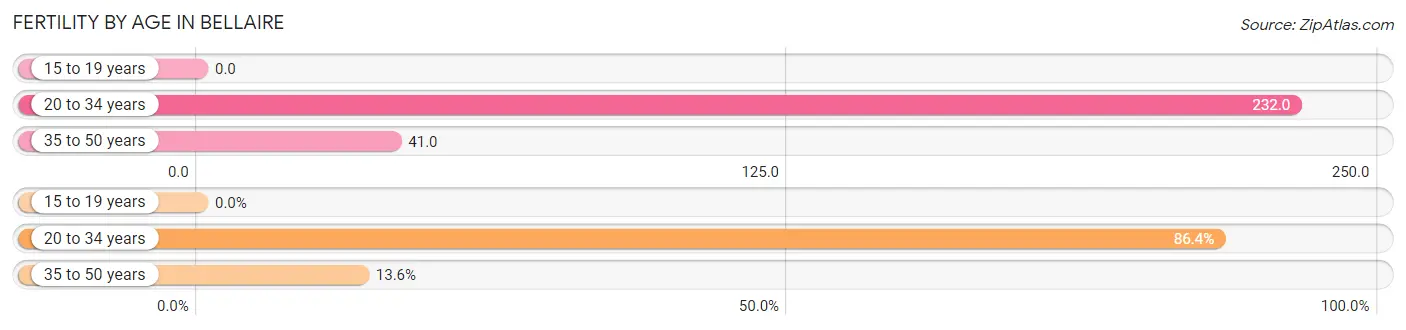
| Age Bracket | Women with Births | Births / 1,000 Women |
| 15 to 19 years | 0 (0.0%) | 0.0 |
| 20 to 34 years | 19 (86.4%) | 232.0 |
| 35 to 50 years | 3 (13.6%) | 41.0 |
| Total | 22 (100.0%) | 121.0 |
Fertility by Age by Marriage Status in Bellaire
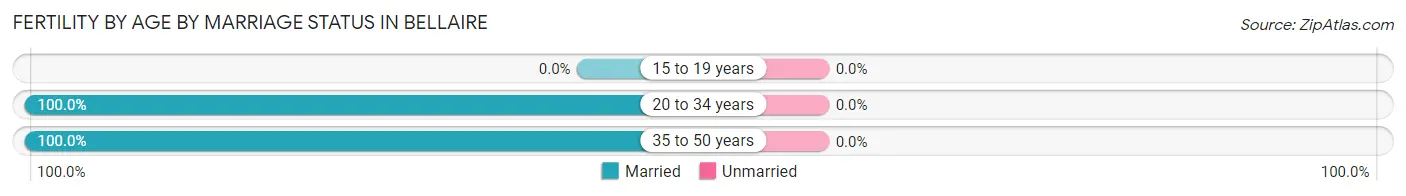
| Age Bracket | Married | Unmarried |
| 15 to 19 years | 0 (0.0%) | 0 (0.0%) |
| 20 to 34 years | 19 (100.0%) | 0 (0.0%) |
| 35 to 50 years | 3 (100.0%) | 0 (0.0%) |
| Total | 22 (100.0%) | 0 (0.0%) |
Fertility by Education in Bellaire
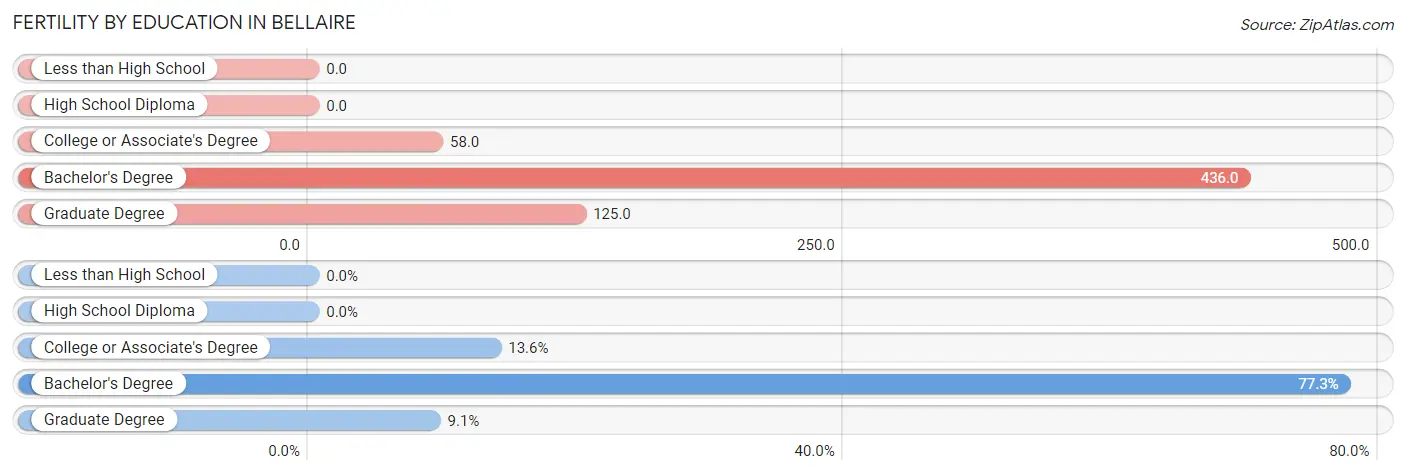
| Educational Attainment | Women with Births | Births / 1,000 Women |
| Less than High School | 0 (0.0%) | 0.0 |
| High School Diploma | 0 (0.0%) | 0.0 |
| College or Associate's Degree | 3 (13.6%) | 58.0 |
| Bachelor's Degree | 17 (77.3%) | 436.0 |
| Graduate Degree | 2 (9.1%) | 125.0 |
| Total | 22 (100.0%) | 121.0 |
Fertility by Education by Marriage Status in Bellaire
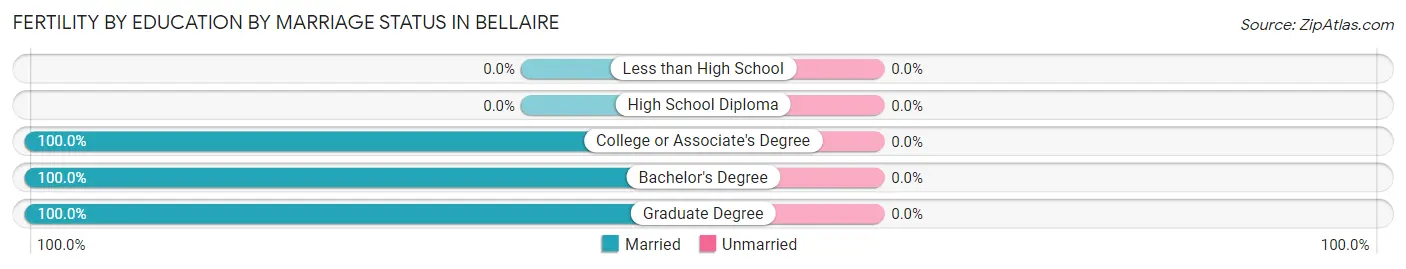
| Educational Attainment | Married | Unmarried |
| Less than High School | 0 (0.0%) | 0 (0.0%) |
| High School Diploma | 0 (0.0%) | 0 (0.0%) |
| College or Associate's Degree | 3 (100.0%) | 0 (0.0%) |
| Bachelor's Degree | 17 (100.0%) | 0 (0.0%) |
| Graduate Degree | 2 (100.0%) | 0 (0.0%) |
| Total | 22 (100.0%) | 0 (0.0%) |
Employment Characteristics in Bellaire
Employment by Class of Employer in Bellaire
Among the 430 employed individuals in Bellaire, private company employees (315 | 73.3%), self-employed (not incorporated) (42 | 9.8%), and local government employees (26 | 6.0%) make up the most common classes of employment.
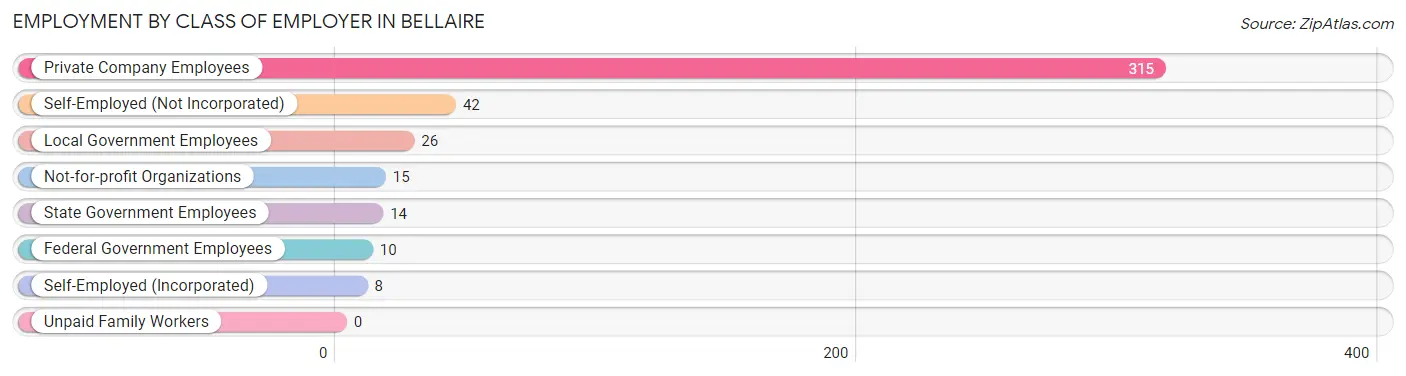
| Employer Class | # Employees | % Employees |
| Private Company Employees | 315 | 73.3% |
| Self-Employed (Incorporated) | 8 | 1.9% |
| Self-Employed (Not Incorporated) | 42 | 9.8% |
| Not-for-profit Organizations | 15 | 3.5% |
| Local Government Employees | 26 | 6.0% |
| State Government Employees | 14 | 3.3% |
| Federal Government Employees | 10 | 2.3% |
| Unpaid Family Workers | 0 | 0.0% |
| Total | 430 | 100.0% |
Employment Status by Age in Bellaire
According to the labor force statistics for Bellaire, out of the total population over 16 years of age (827), 52.6% or 435 individuals are in the labor force, with 1.1% or 5 of them unemployed. The age group with the highest labor force participation rate is 30 to 34 years, with 87.0% or 40 individuals in the labor force. Within the labor force, the 16 to 19 years age range has the highest percentage of unemployed individuals, with 14.3% or 4 of them being unemployed.
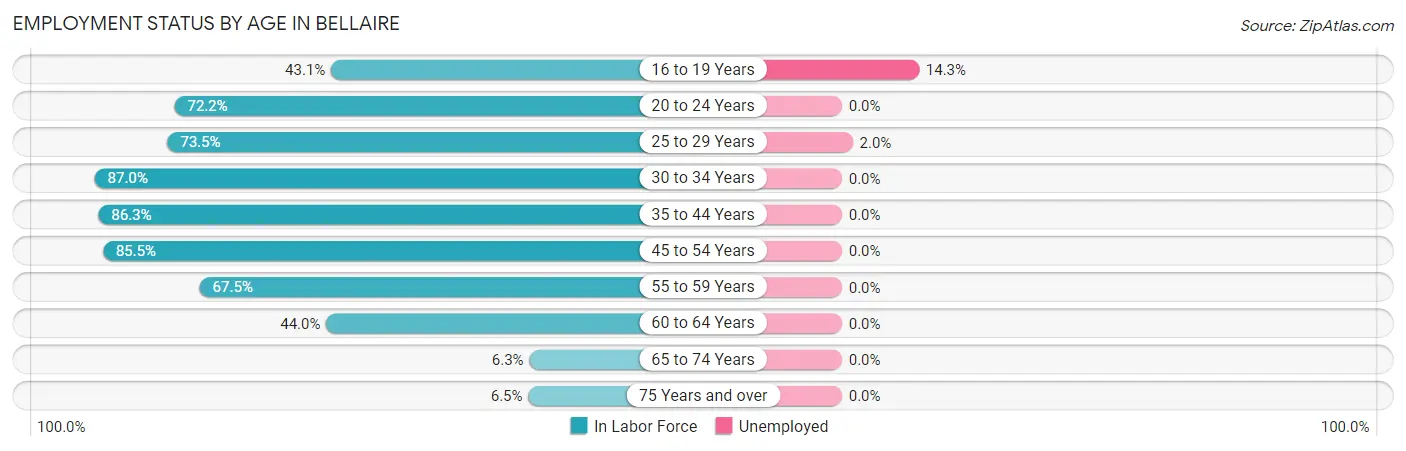
| Age Bracket | In Labor Force | Unemployed |
| 16 to 19 Years | 28 (43.1%) | 4 (14.3%) |
| 20 to 24 Years | 39 (72.2%) | 0 (0.0%) |
| 25 to 29 Years | 50 (73.5%) | 1 (2.0%) |
| 30 to 34 Years | 40 (87.0%) | 0 (0.0%) |
| 35 to 44 Years | 107 (86.3%) | 0 (0.0%) |
| 45 to 54 Years | 71 (85.5%) | 0 (0.0%) |
| 55 to 59 Years | 52 (67.5%) | 0 (0.0%) |
| 60 to 64 Years | 33 (44.0%) | 0 (0.0%) |
| 65 to 74 Years | 9 (6.3%) | 0 (0.0%) |
| 75 Years and over | 6 (6.5%) | 0 (0.0%) |
| Total | 435 (52.6%) | 5 (1.1%) |
Employment Status by Educational Attainment in Bellaire
According to labor force statistics for Bellaire, 74.6% of individuals (353) out of the total population between 25 and 64 years of age (473) are in the labor force, with 0.3% or 1 of them being unemployed. The group with the highest labor force participation rate are those with the educational attainment of bachelor's degree or higher, with 85.0% or 147 individuals in the labor force. Within the labor force, individuals with high school diploma education have the highest percentage of unemployment, with 1.0% or 1 of them being unemployed.
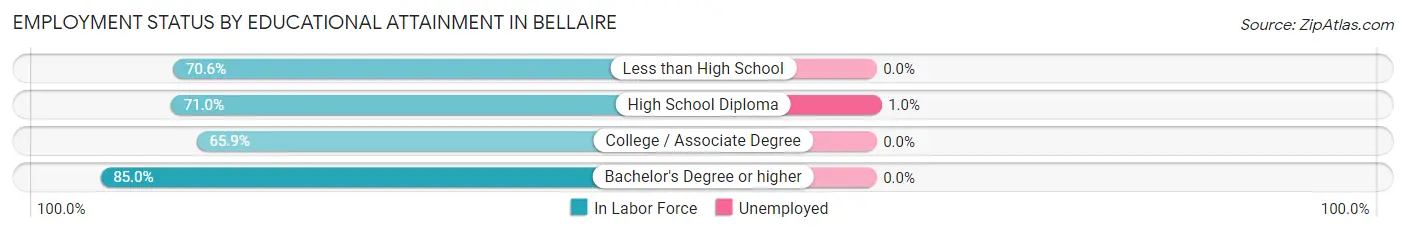
| Educational Attainment | In Labor Force | Unemployed |
| Less than High School | 12 (70.6%) | 0 (0.0%) |
| High School Diploma | 103 (71.0%) | 1 (1.0%) |
| College / Associate Degree | 91 (65.9%) | 0 (0.0%) |
| Bachelor's Degree or higher | 147 (85.0%) | 0 (0.0%) |
| Total | 353 (74.6%) | 1 (0.3%) |
Employment Occupations by Sex in Bellaire
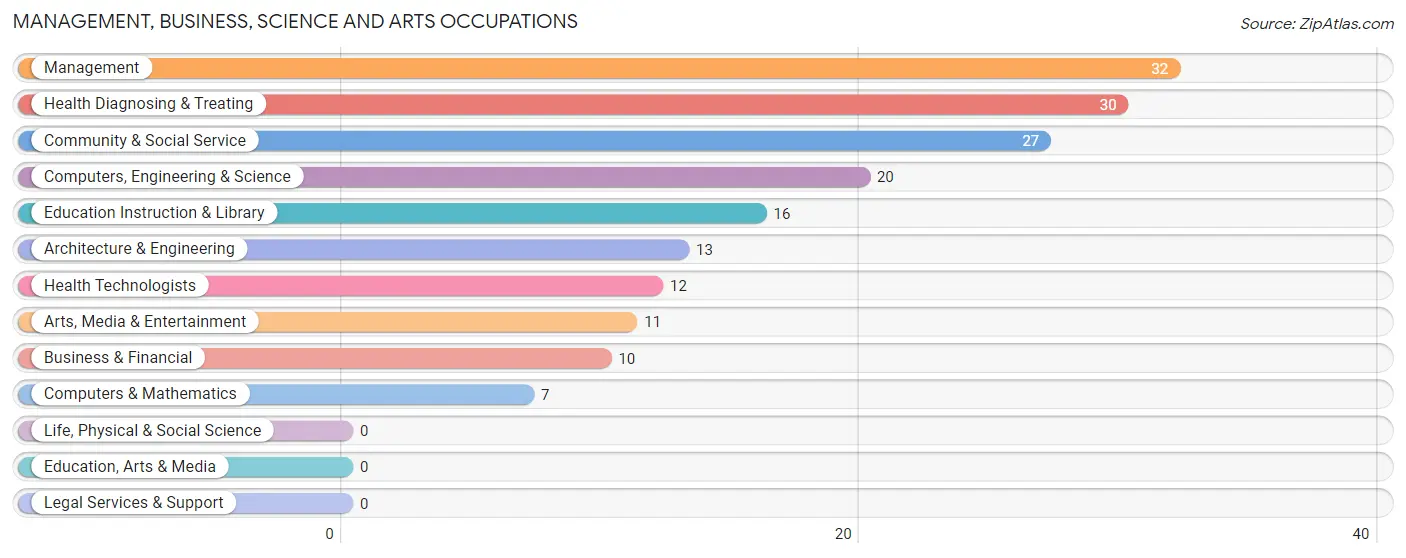
Management, Business, Science and Arts Occupations
The most common Management, Business, Science and Arts occupations in Bellaire are Management (32 | 7.4%), Health Diagnosing & Treating (30 | 7.0%), Community & Social Service (27 | 6.3%), Computers, Engineering & Science (20 | 4.6%), and Education Instruction & Library (16 | 3.7%).
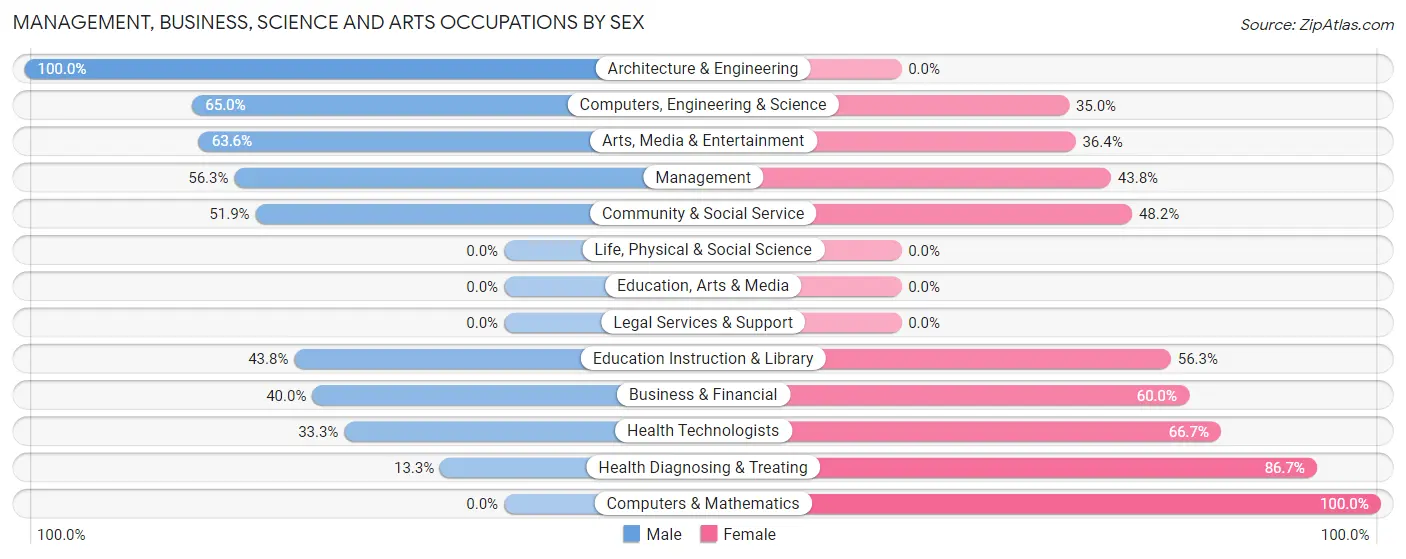
Management, Business, Science and Arts Occupations by Sex
Within the Management, Business, Science and Arts occupations in Bellaire, the most male-oriented occupations are Architecture & Engineering (100.0%), Computers, Engineering & Science (65.0%), and Arts, Media & Entertainment (63.6%), while the most female-oriented occupations are Computers & Mathematics (100.0%), Health Diagnosing & Treating (86.7%), and Health Technologists (66.7%).
| Occupation | Male | Female |
| Management | 18 (56.2%) | 14 (43.8%) |
| Business & Financial | 4 (40.0%) | 6 (60.0%) |
| Computers, Engineering & Science | 13 (65.0%) | 7 (35.0%) |
| Computers & Mathematics | 0 (0.0%) | 7 (100.0%) |
| Architecture & Engineering | 13 (100.0%) | 0 (0.0%) |
| Life, Physical & Social Science | 0 (0.0%) | 0 (0.0%) |
| Community & Social Service | 14 (51.8%) | 13 (48.1%) |
| Education, Arts & Media | 0 (0.0%) | 0 (0.0%) |
| Legal Services & Support | 0 (0.0%) | 0 (0.0%) |
| Education Instruction & Library | 7 (43.8%) | 9 (56.2%) |
| Arts, Media & Entertainment | 7 (63.6%) | 4 (36.4%) |
| Health Diagnosing & Treating | 4 (13.3%) | 26 (86.7%) |
| Health Technologists | 4 (33.3%) | 8 (66.7%) |
| Total (Category) | 53 (44.5%) | 66 (55.5%) |
| Total (Overall) | 233 (54.2%) | 197 (45.8%) |
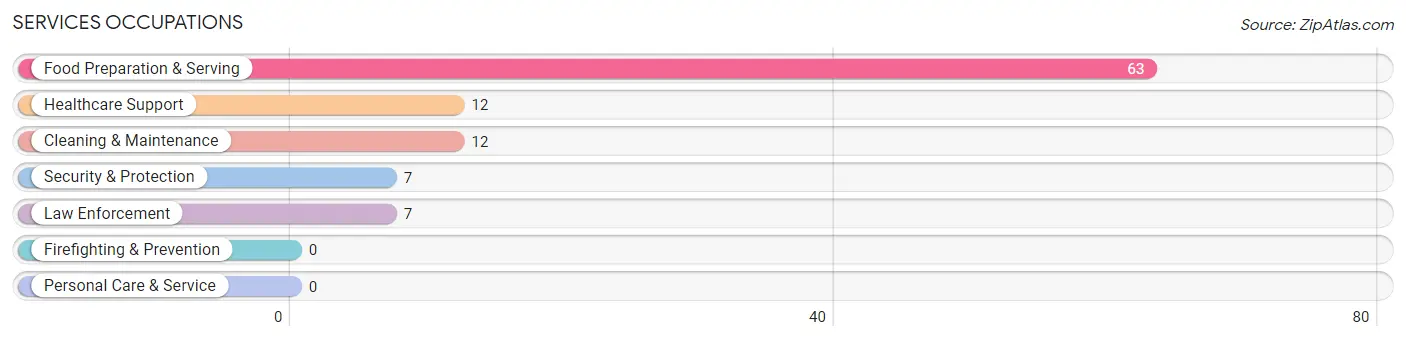
Services Occupations
The most common Services occupations in Bellaire are Food Preparation & Serving (63 | 14.6%), Healthcare Support (12 | 2.8%), Cleaning & Maintenance (12 | 2.8%), Security & Protection (7 | 1.6%), and Law Enforcement (7 | 1.6%).
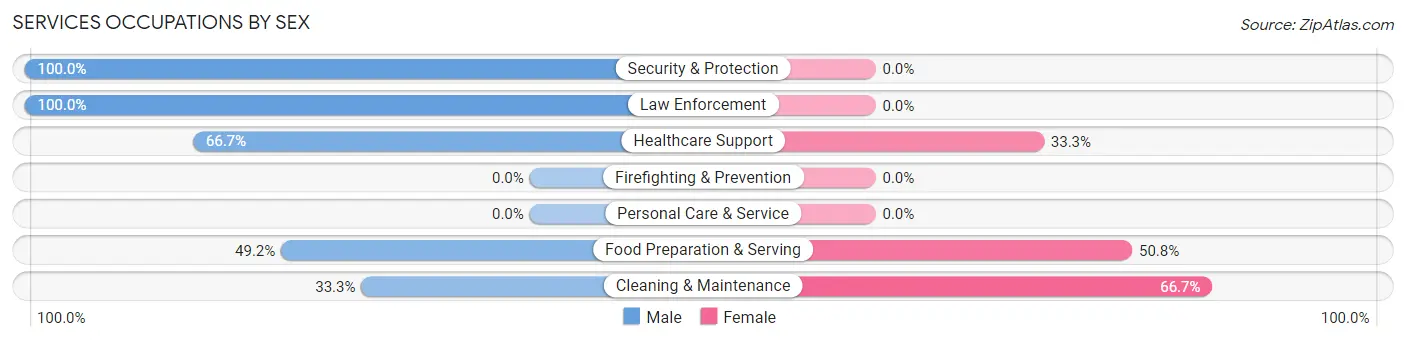
Services Occupations by Sex
Within the Services occupations in Bellaire, the most male-oriented occupations are Security & Protection (100.0%), Law Enforcement (100.0%), and Healthcare Support (66.7%), while the most female-oriented occupations are Cleaning & Maintenance (66.7%), Food Preparation & Serving (50.8%), and Healthcare Support (33.3%).
| Occupation | Male | Female |
| Healthcare Support | 8 (66.7%) | 4 (33.3%) |
| Security & Protection | 7 (100.0%) | 0 (0.0%) |
| Firefighting & Prevention | 0 (0.0%) | 0 (0.0%) |
| Law Enforcement | 7 (100.0%) | 0 (0.0%) |
| Food Preparation & Serving | 31 (49.2%) | 32 (50.8%) |
| Cleaning & Maintenance | 4 (33.3%) | 8 (66.7%) |
| Personal Care & Service | 0 (0.0%) | 0 (0.0%) |
| Total (Category) | 50 (53.2%) | 44 (46.8%) |
| Total (Overall) | 233 (54.2%) | 197 (45.8%) |
Sales and Office Occupations
The most common Sales and Office occupations in Bellaire are Sales & Related (70 | 16.3%), and Office & Administration (34 | 7.9%).
Sales and Office Occupations by Sex
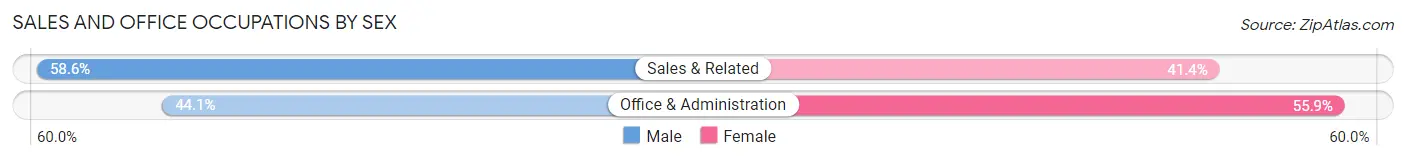
| Occupation | Male | Female |
| Sales & Related | 41 (58.6%) | 29 (41.4%) |
| Office & Administration | 15 (44.1%) | 19 (55.9%) |
| Total (Category) | 56 (53.8%) | 48 (46.2%) |
| Total (Overall) | 233 (54.2%) | 197 (45.8%) |
Natural Resources, Construction and Maintenance Occupations
The most common Natural Resources, Construction and Maintenance occupations in Bellaire are Construction & Extraction (31 | 7.2%), and Installation, Maintenance & Repair (14 | 3.3%).
Natural Resources, Construction and Maintenance Occupations by Sex
| Occupation | Male | Female |
| Farming, Fishing & Forestry | 0 (0.0%) | 0 (0.0%) |
| Construction & Extraction | 31 (100.0%) | 0 (0.0%) |
| Installation, Maintenance & Repair | 4 (28.6%) | 10 (71.4%) |
| Total (Category) | 35 (77.8%) | 10 (22.2%) |
| Total (Overall) | 233 (54.2%) | 197 (45.8%) |
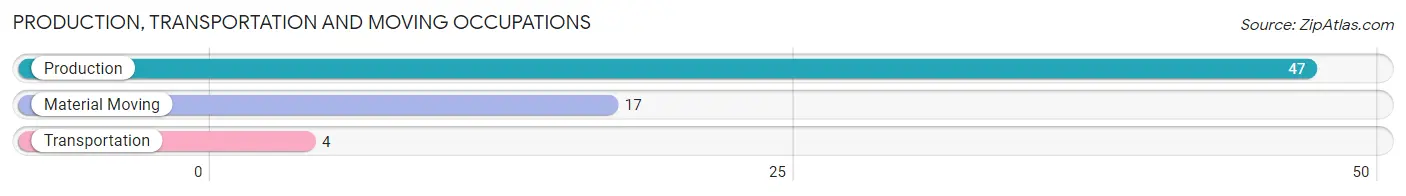
Production, Transportation and Moving Occupations
The most common Production, Transportation and Moving occupations in Bellaire are Production (47 | 10.9%), Material Moving (17 | 4.0%), and Transportation (4 | 0.9%).
Production, Transportation and Moving Occupations by Sex
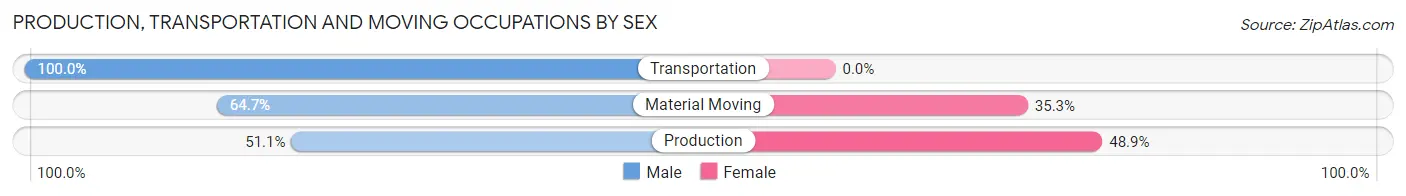
| Occupation | Male | Female |
| Production | 24 (51.1%) | 23 (48.9%) |
| Transportation | 4 (100.0%) | 0 (0.0%) |
| Material Moving | 11 (64.7%) | 6 (35.3%) |
| Total (Category) | 39 (57.4%) | 29 (42.6%) |
| Total (Overall) | 233 (54.2%) | 197 (45.8%) |
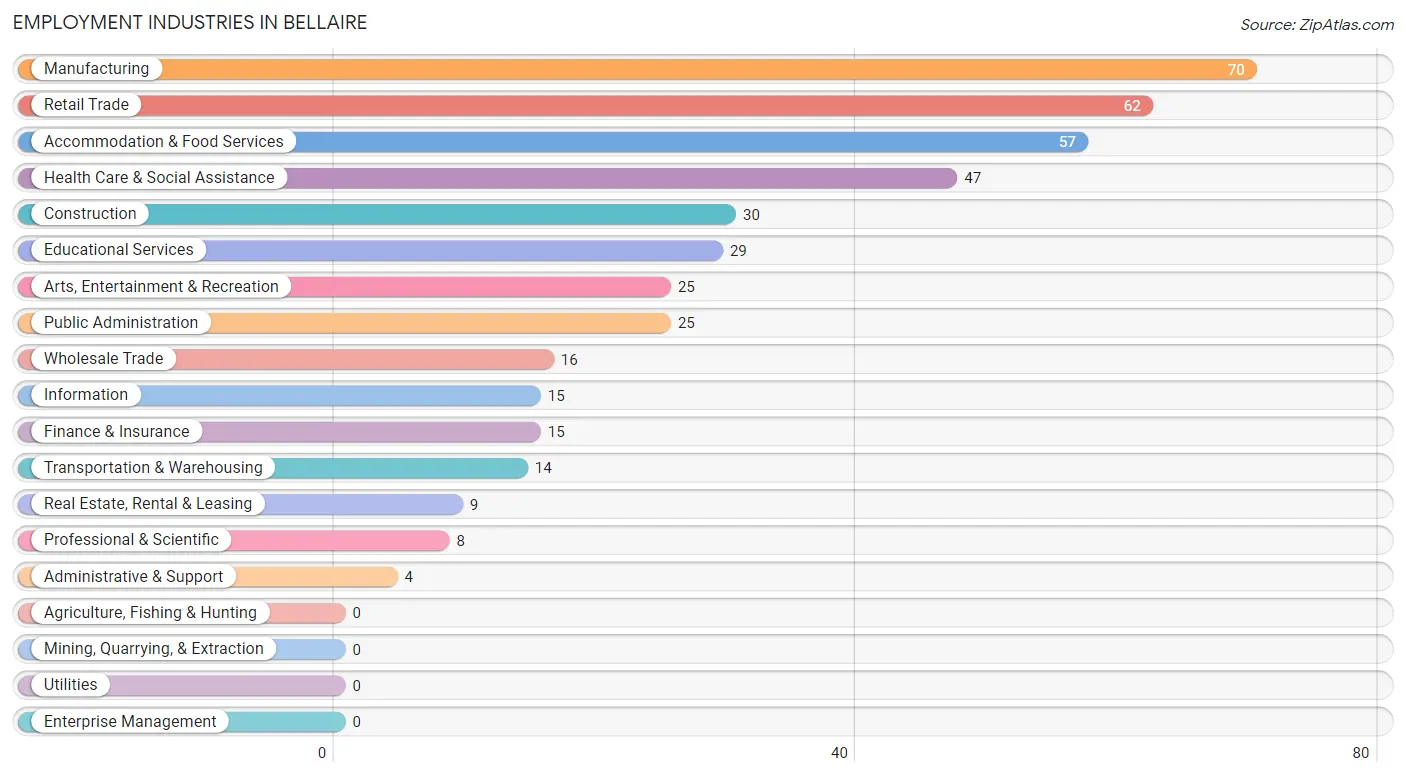
Employment Industries by Sex in Bellaire
Employment Industries in Bellaire
The major employment industries in Bellaire include Manufacturing (70 | 16.3%), Retail Trade (62 | 14.4%), Accommodation & Food Services (57 | 13.3%), Health Care & Social Assistance (47 | 10.9%), and Construction (30 | 7.0%).
Employment Industries by Sex in Bellaire
The Bellaire industries that see more men than women are Transportation & Warehousing (100.0%), Administrative & Support (100.0%), and Construction (90.0%), whereas the industries that tend to have a higher number of women are Professional & Scientific (100.0%), Retail Trade (79.0%), and Finance & Insurance (66.7%).
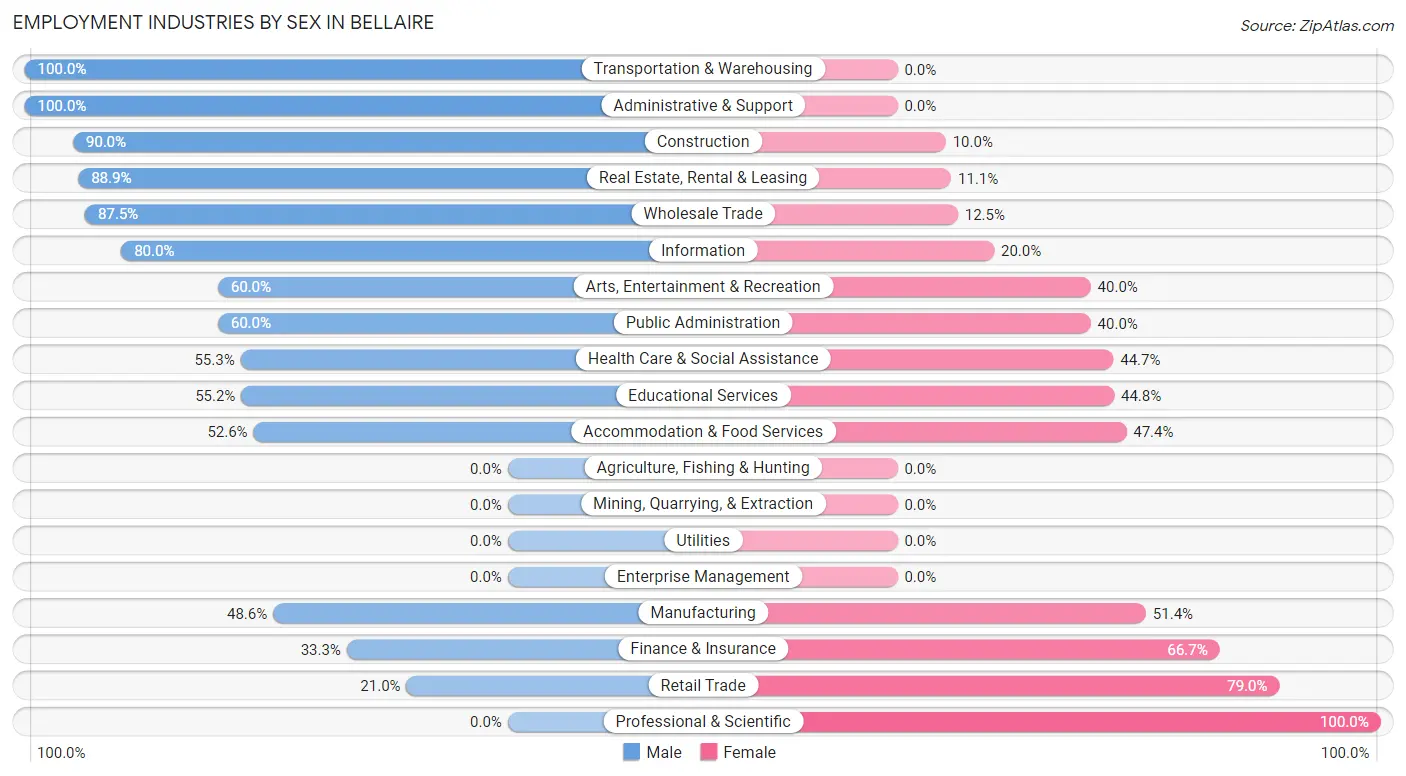
| Industry | Male | Female |
| Agriculture, Fishing & Hunting | 0 (0.0%) | 0 (0.0%) |
| Mining, Quarrying, & Extraction | 0 (0.0%) | 0 (0.0%) |
| Construction | 27 (90.0%) | 3 (10.0%) |
| Manufacturing | 34 (48.6%) | 36 (51.4%) |
| Wholesale Trade | 14 (87.5%) | 2 (12.5%) |
| Retail Trade | 13 (21.0%) | 49 (79.0%) |
| Transportation & Warehousing | 14 (100.0%) | 0 (0.0%) |
| Utilities | 0 (0.0%) | 0 (0.0%) |
| Information | 12 (80.0%) | 3 (20.0%) |
| Finance & Insurance | 5 (33.3%) | 10 (66.7%) |
| Real Estate, Rental & Leasing | 8 (88.9%) | 1 (11.1%) |
| Professional & Scientific | 0 (0.0%) | 8 (100.0%) |
| Enterprise Management | 0 (0.0%) | 0 (0.0%) |
| Administrative & Support | 4 (100.0%) | 0 (0.0%) |
| Educational Services | 16 (55.2%) | 13 (44.8%) |
| Health Care & Social Assistance | 26 (55.3%) | 21 (44.7%) |
| Arts, Entertainment & Recreation | 15 (60.0%) | 10 (40.0%) |
| Accommodation & Food Services | 30 (52.6%) | 27 (47.4%) |
| Public Administration | 15 (60.0%) | 10 (40.0%) |
| Total | 233 (54.2%) | 197 (45.8%) |
Education in Bellaire
School Enrollment in Bellaire
The most common levels of schooling among the 121 students in Bellaire are elementary school (38 | 31.4%), high school (37 | 30.6%), and middle school (31 | 25.6%).
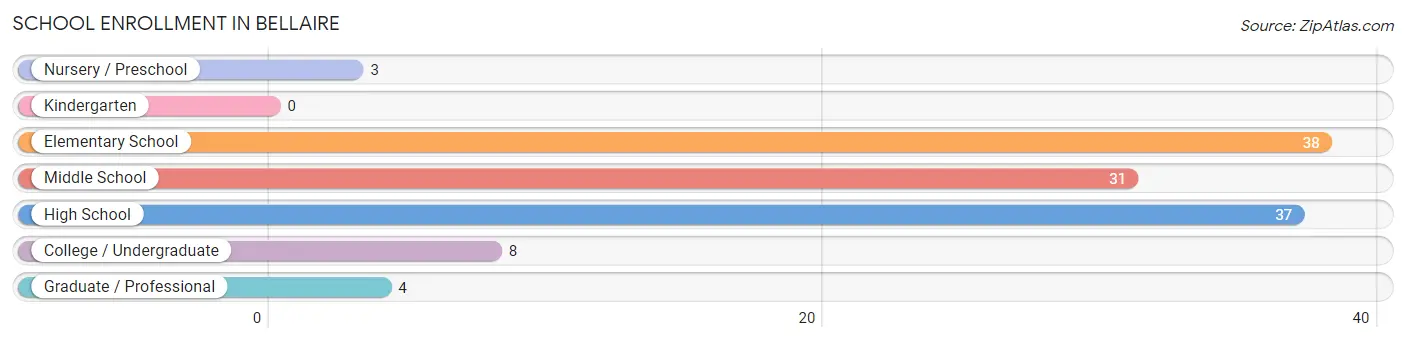
| School Level | # Students | % Students |
| Nursery / Preschool | 3 | 2.5% |
| Kindergarten | 0 | 0.0% |
| Elementary School | 38 | 31.4% |
| Middle School | 31 | 25.6% |
| High School | 37 | 30.6% |
| College / Undergraduate | 8 | 6.6% |
| Graduate / Professional | 4 | 3.3% |
| Total | 121 | 100.0% |
School Enrollment by Age by Funding Source in Bellaire
Out of a total of 121 students who are enrolled in schools in Bellaire, 18 (14.9%) attend a private institution, while the remaining 103 (85.1%) are enrolled in public schools. The age group of 20 to 24 year olds has the highest likelihood of being enrolled in private schools, with 2 (100.0% in the age bracket) enrolled. Conversely, the age group of 15 to 17 year olds has the lowest likelihood of being enrolled in a private school, with 22 (100.0% in the age bracket) attending a public institution.
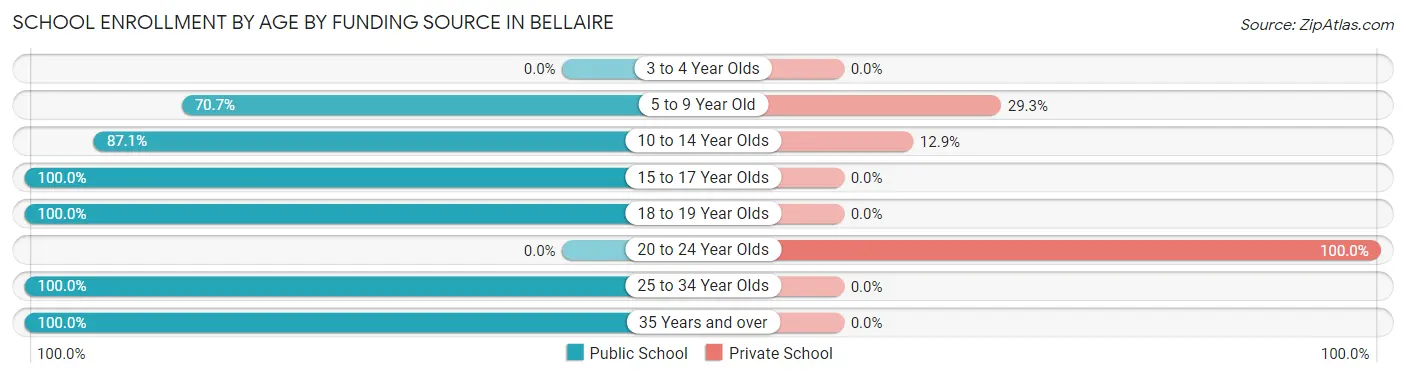
| Age Bracket | Public School | Private School |
| 3 to 4 Year Olds | 0 (0.0%) | 0 (0.0%) |
| 5 to 9 Year Old | 29 (70.7%) | 12 (29.3%) |
| 10 to 14 Year Olds | 27 (87.1%) | 4 (12.9%) |
| 15 to 17 Year Olds | 22 (100.0%) | 0 (0.0%) |
| 18 to 19 Year Olds | 18 (100.0%) | 0 (0.0%) |
| 20 to 24 Year Olds | 0 (0.0%) | 2 (100.0%) |
| 25 to 34 Year Olds | 3 (100.0%) | 0 (0.0%) |
| 35 Years and over | 4 (100.0%) | 0 (0.0%) |
| Total | 103 (85.1%) | 18 (14.9%) |
Educational Attainment by Field of Study in Bellaire
Business (56 | 21.5%), education (52 | 19.9%), science & technology (47 | 18.0%), engineering (19 | 7.3%), and bio, nature & agricultural (16 | 6.1%) are the most common fields of study among 261 individuals in Bellaire who have obtained a bachelor's degree or higher.
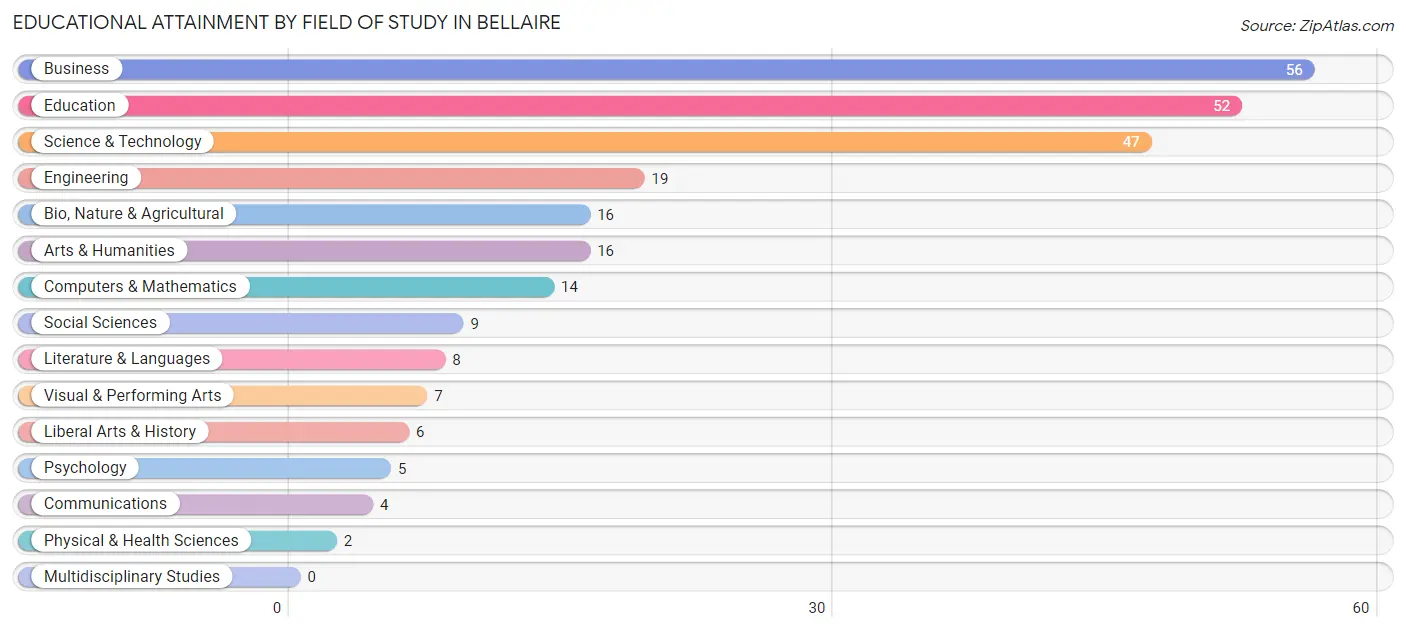
| Field of Study | # Graduates | % Graduates |
| Computers & Mathematics | 14 | 5.4% |
| Bio, Nature & Agricultural | 16 | 6.1% |
| Physical & Health Sciences | 2 | 0.8% |
| Psychology | 5 | 1.9% |
| Social Sciences | 9 | 3.5% |
| Engineering | 19 | 7.3% |
| Multidisciplinary Studies | 0 | 0.0% |
| Science & Technology | 47 | 18.0% |
| Business | 56 | 21.5% |
| Education | 52 | 19.9% |
| Literature & Languages | 8 | 3.1% |
| Liberal Arts & History | 6 | 2.3% |
| Visual & Performing Arts | 7 | 2.7% |
| Communications | 4 | 1.5% |
| Arts & Humanities | 16 | 6.1% |
| Total | 261 | 100.0% |
Transportation & Commute in Bellaire
Vehicle Availability by Sex in Bellaire
The most prevalent vehicle ownership categories in Bellaire are males with 2 vehicles (108, accounting for 46.4%) and females with 2 vehicles (100, making up 54.8%).
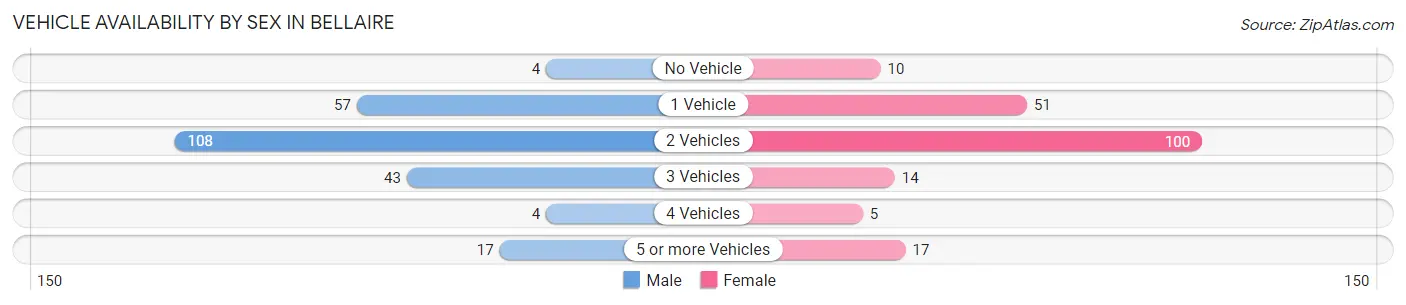
| Vehicles Available | Male | Female |
| No Vehicle | 4 (1.7%) | 10 (5.1%) |
| 1 Vehicle | 57 (24.5%) | 51 (25.9%) |
| 2 Vehicles | 108 (46.4%) | 100 (50.8%) |
| 3 Vehicles | 43 (18.4%) | 14 (7.1%) |
| 4 Vehicles | 4 (1.7%) | 5 (2.5%) |
| 5 or more Vehicles | 17 (7.3%) | 17 (8.6%) |
| Total | 233 (100.0%) | 197 (100.0%) |
Commute Time in Bellaire
The most frequently occuring commute durations in Bellaire are 5 to 9 minutes (122 commuters, 32.7%), less than 5 minutes (56 commuters, 15.0%), and 10 to 14 minutes (47 commuters, 12.6%).
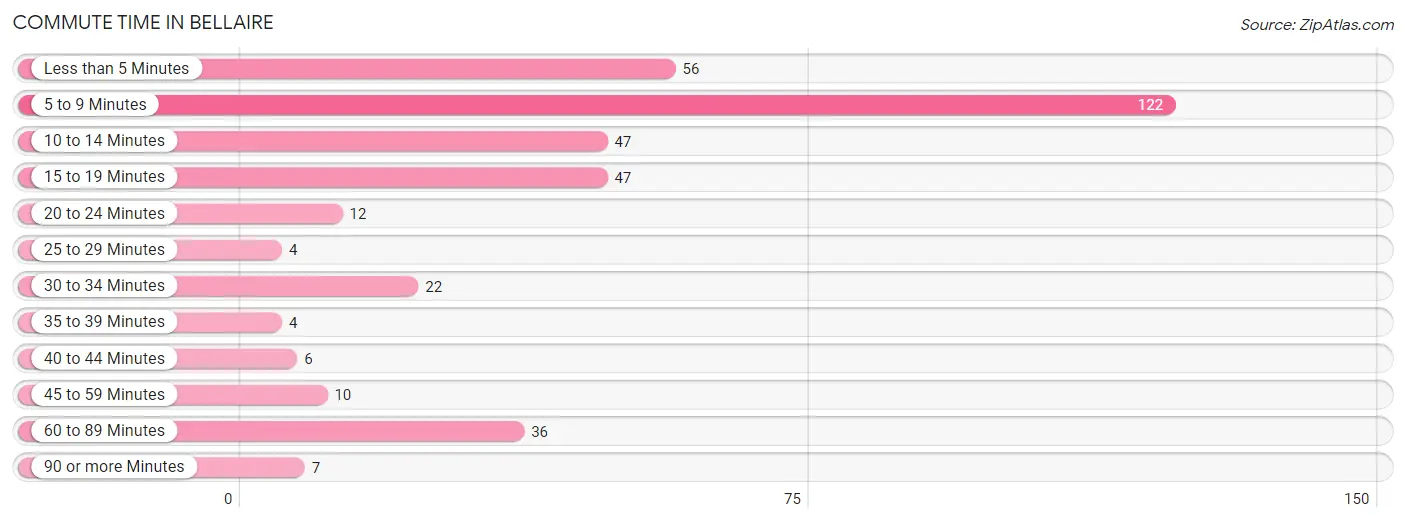
| Commute Time | # Commuters | % Commuters |
| Less than 5 Minutes | 56 | 15.0% |
| 5 to 9 Minutes | 122 | 32.7% |
| 10 to 14 Minutes | 47 | 12.6% |
| 15 to 19 Minutes | 47 | 12.6% |
| 20 to 24 Minutes | 12 | 3.2% |
| 25 to 29 Minutes | 4 | 1.1% |
| 30 to 34 Minutes | 22 | 5.9% |
| 35 to 39 Minutes | 4 | 1.1% |
| 40 to 44 Minutes | 6 | 1.6% |
| 45 to 59 Minutes | 10 | 2.7% |
| 60 to 89 Minutes | 36 | 9.7% |
| 90 or more Minutes | 7 | 1.9% |
Commute Time by Sex in Bellaire
The most common commute times in Bellaire are 5 to 9 minutes (47 commuters, 22.4%) for males and 5 to 9 minutes (75 commuters, 46.0%) for females.
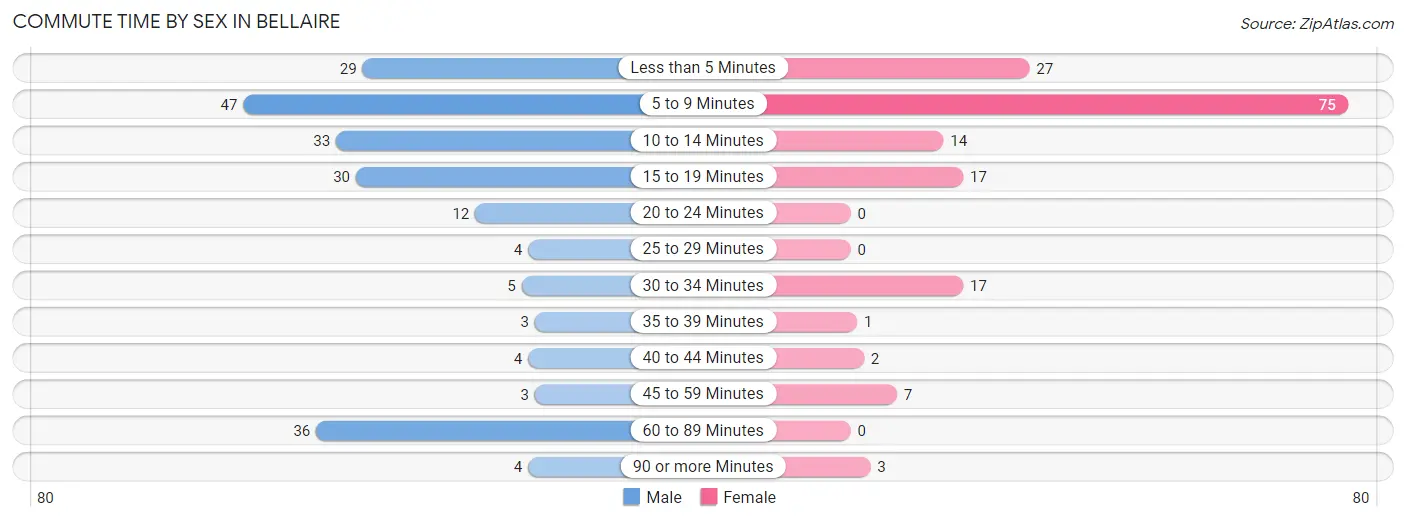
| Commute Time | Male | Female |
| Less than 5 Minutes | 29 (13.8%) | 27 (16.6%) |
| 5 to 9 Minutes | 47 (22.4%) | 75 (46.0%) |
| 10 to 14 Minutes | 33 (15.7%) | 14 (8.6%) |
| 15 to 19 Minutes | 30 (14.3%) | 17 (10.4%) |
| 20 to 24 Minutes | 12 (5.7%) | 0 (0.0%) |
| 25 to 29 Minutes | 4 (1.9%) | 0 (0.0%) |
| 30 to 34 Minutes | 5 (2.4%) | 17 (10.4%) |
| 35 to 39 Minutes | 3 (1.4%) | 1 (0.6%) |
| 40 to 44 Minutes | 4 (1.9%) | 2 (1.2%) |
| 45 to 59 Minutes | 3 (1.4%) | 7 (4.3%) |
| 60 to 89 Minutes | 36 (17.1%) | 0 (0.0%) |
| 90 or more Minutes | 4 (1.9%) | 3 (1.8%) |
Time of Departure to Work by Sex in Bellaire
The most frequent times of departure to work in Bellaire are 7:30 AM to 7:59 AM (34, 16.2%) for males and 8:30 AM to 8:59 AM (45, 27.6%) for females.
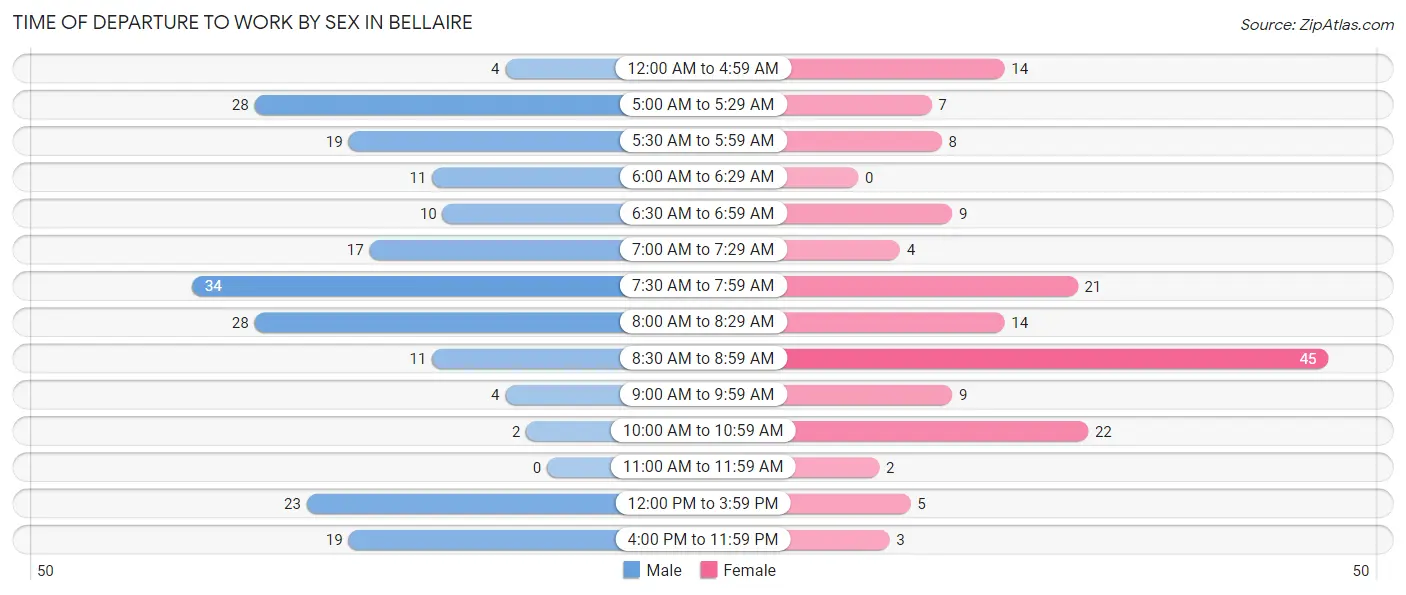
| Time of Departure | Male | Female |
| 12:00 AM to 4:59 AM | 4 (1.9%) | 14 (8.6%) |
| 5:00 AM to 5:29 AM | 28 (13.3%) | 7 (4.3%) |
| 5:30 AM to 5:59 AM | 19 (9.0%) | 8 (4.9%) |
| 6:00 AM to 6:29 AM | 11 (5.2%) | 0 (0.0%) |
| 6:30 AM to 6:59 AM | 10 (4.8%) | 9 (5.5%) |
| 7:00 AM to 7:29 AM | 17 (8.1%) | 4 (2.5%) |
| 7:30 AM to 7:59 AM | 34 (16.2%) | 21 (12.9%) |
| 8:00 AM to 8:29 AM | 28 (13.3%) | 14 (8.6%) |
| 8:30 AM to 8:59 AM | 11 (5.2%) | 45 (27.6%) |
| 9:00 AM to 9:59 AM | 4 (1.9%) | 9 (5.5%) |
| 10:00 AM to 10:59 AM | 2 (0.9%) | 22 (13.5%) |
| 11:00 AM to 11:59 AM | 0 (0.0%) | 2 (1.2%) |
| 12:00 PM to 3:59 PM | 23 (11.0%) | 5 (3.1%) |
| 4:00 PM to 11:59 PM | 19 (9.0%) | 3 (1.8%) |
| Total | 210 (100.0%) | 163 (100.0%) |
Housing Occupancy in Bellaire
Occupancy by Ownership in Bellaire
Of the total 453 dwellings in Bellaire, owner-occupied units account for 329 (72.6%), while renter-occupied units make up 124 (27.4%).
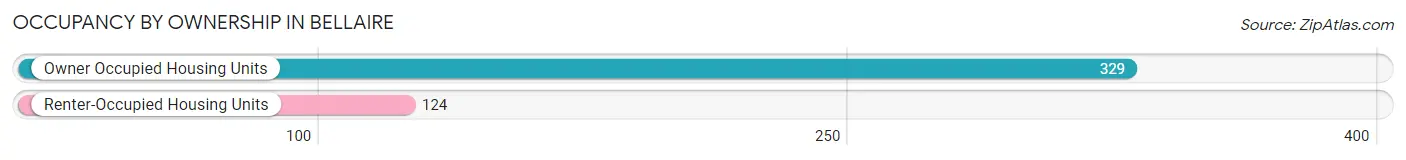
| Occupancy | # Housing Units | % Housing Units |
| Owner Occupied Housing Units | 329 | 72.6% |
| Renter-Occupied Housing Units | 124 | 27.4% |
| Total Occupied Housing Units | 453 | 100.0% |
Occupancy by Household Size in Bellaire
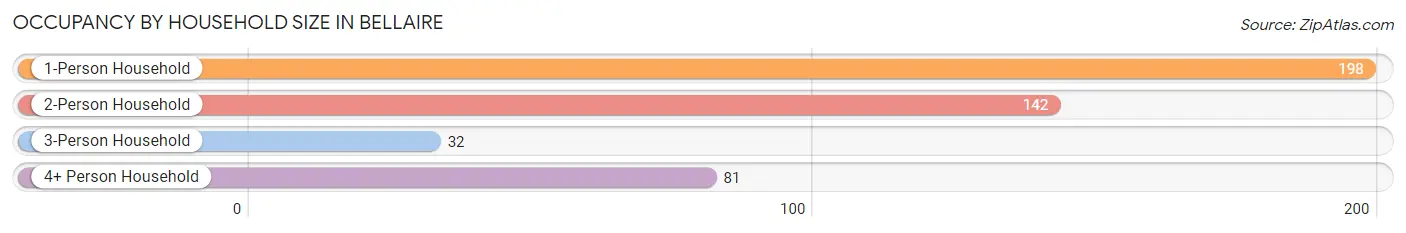
| Household Size | # Housing Units | % Housing Units |
| 1-Person Household | 198 | 43.7% |
| 2-Person Household | 142 | 31.4% |
| 3-Person Household | 32 | 7.1% |
| 4+ Person Household | 81 | 17.9% |
| Total Housing Units | 453 | 100.0% |
Occupancy by Ownership by Household Size in Bellaire
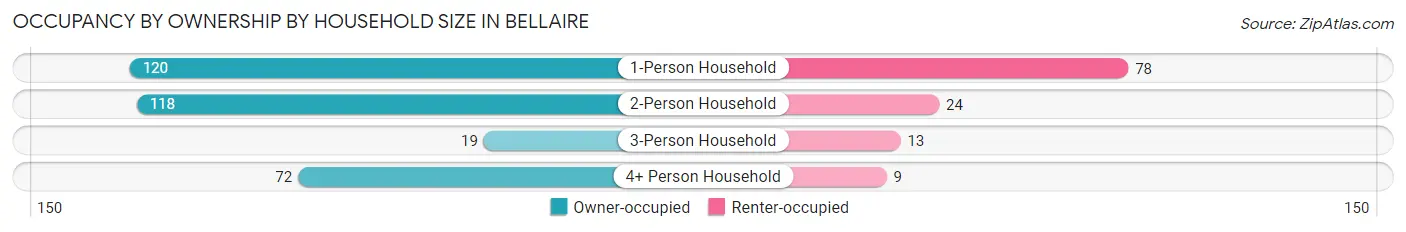
| Household Size | Owner-occupied | Renter-occupied |
| 1-Person Household | 120 (60.6%) | 78 (39.4%) |
| 2-Person Household | 118 (83.1%) | 24 (16.9%) |
| 3-Person Household | 19 (59.4%) | 13 (40.6%) |
| 4+ Person Household | 72 (88.9%) | 9 (11.1%) |
| Total Housing Units | 329 (72.6%) | 124 (27.4%) |
Occupancy by Educational Attainment in Bellaire
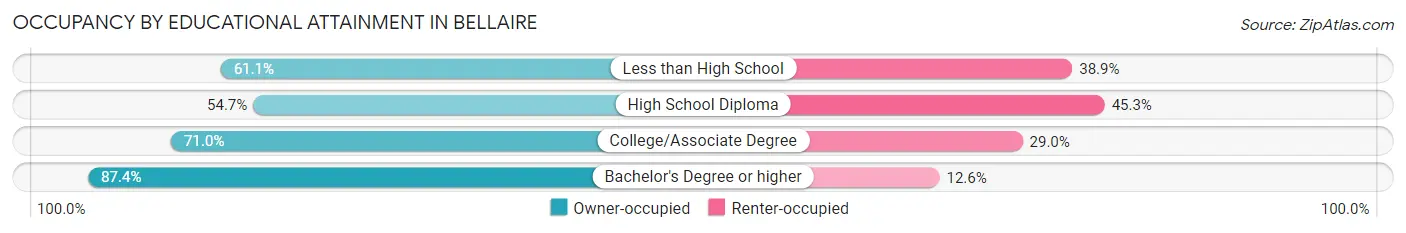
| Household Size | Owner-occupied | Renter-occupied |
| Less than High School | 11 (61.1%) | 7 (38.9%) |
| High School Diploma | 70 (54.7%) | 58 (45.3%) |
| College/Associate Degree | 88 (71.0%) | 36 (29.0%) |
| Bachelor's Degree or higher | 160 (87.4%) | 23 (12.6%) |
Occupancy by Age of Householder in Bellaire
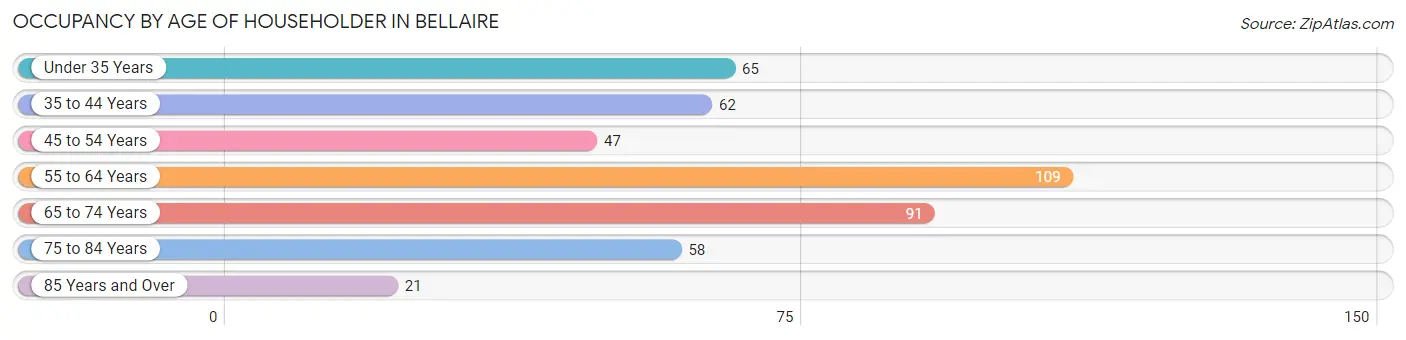
| Age Bracket | # Households | % Households |
| Under 35 Years | 65 | 14.3% |
| 35 to 44 Years | 62 | 13.7% |
| 45 to 54 Years | 47 | 10.4% |
| 55 to 64 Years | 109 | 24.1% |
| 65 to 74 Years | 91 | 20.1% |
| 75 to 84 Years | 58 | 12.8% |
| 85 Years and Over | 21 | 4.6% |
| Total | 453 | 100.0% |
Housing Finances in Bellaire
Median Income by Occupancy in Bellaire
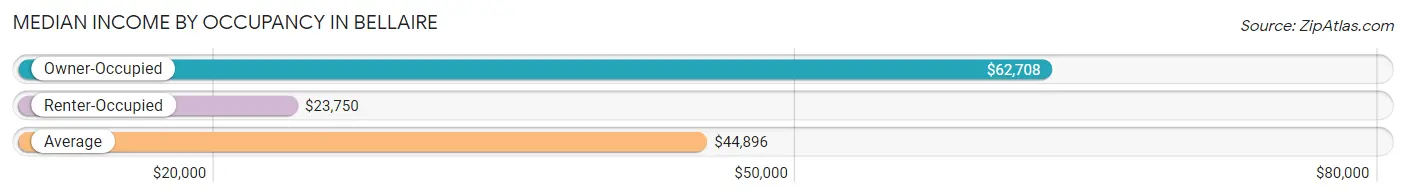
| Occupancy Type | # Households | Median Income |
| Owner-Occupied | 329 (72.6%) | $62,708 |
| Renter-Occupied | 124 (27.4%) | $23,750 |
| Average | 453 (100.0%) | $44,896 |
Occupancy by Householder Income Bracket in Bellaire
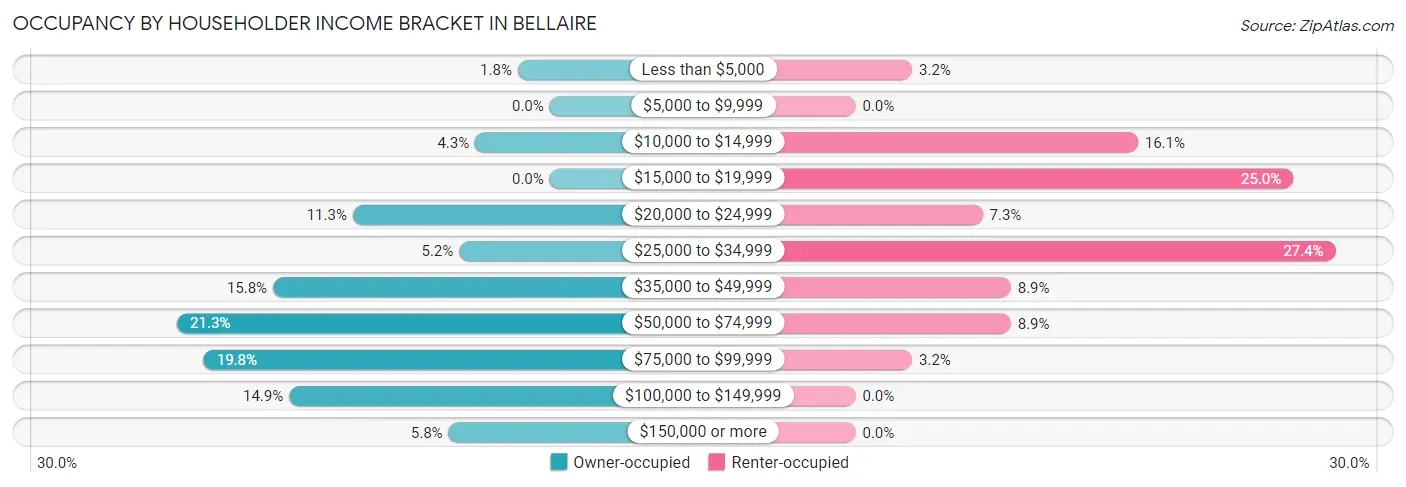
| Income Bracket | Owner-occupied | Renter-occupied |
| Less than $5,000 | 6 (1.8%) | 4 (3.2%) |
| $5,000 to $9,999 | 0 (0.0%) | 0 (0.0%) |
| $10,000 to $14,999 | 14 (4.3%) | 20 (16.1%) |
| $15,000 to $19,999 | 0 (0.0%) | 31 (25.0%) |
| $20,000 to $24,999 | 37 (11.3%) | 9 (7.3%) |
| $25,000 to $34,999 | 17 (5.2%) | 34 (27.4%) |
| $35,000 to $49,999 | 52 (15.8%) | 11 (8.9%) |
| $50,000 to $74,999 | 70 (21.3%) | 11 (8.9%) |
| $75,000 to $99,999 | 65 (19.8%) | 4 (3.2%) |
| $100,000 to $149,999 | 49 (14.9%) | 0 (0.0%) |
| $150,000 or more | 19 (5.8%) | 0 (0.0%) |
| Total | 329 (100.0%) | 124 (100.0%) |
Monthly Housing Cost Tiers in Bellaire
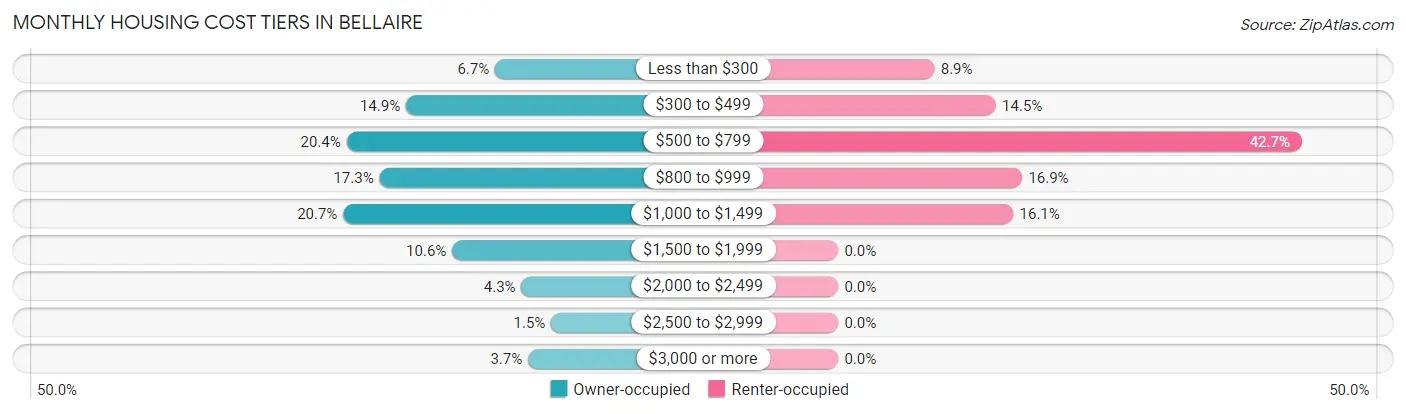
| Monthly Cost | Owner-occupied | Renter-occupied |
| Less than $300 | 22 (6.7%) | 11 (8.9%) |
| $300 to $499 | 49 (14.9%) | 18 (14.5%) |
| $500 to $799 | 67 (20.4%) | 53 (42.7%) |
| $800 to $999 | 57 (17.3%) | 21 (16.9%) |
| $1,000 to $1,499 | 68 (20.7%) | 20 (16.1%) |
| $1,500 to $1,999 | 35 (10.6%) | 0 (0.0%) |
| $2,000 to $2,499 | 14 (4.3%) | 0 (0.0%) |
| $2,500 to $2,999 | 5 (1.5%) | 0 (0.0%) |
| $3,000 or more | 12 (3.6%) | 0 (0.0%) |
| Total | 329 (100.0%) | 124 (100.0%) |
Physical Housing Characteristics in Bellaire
Housing Structures in Bellaire
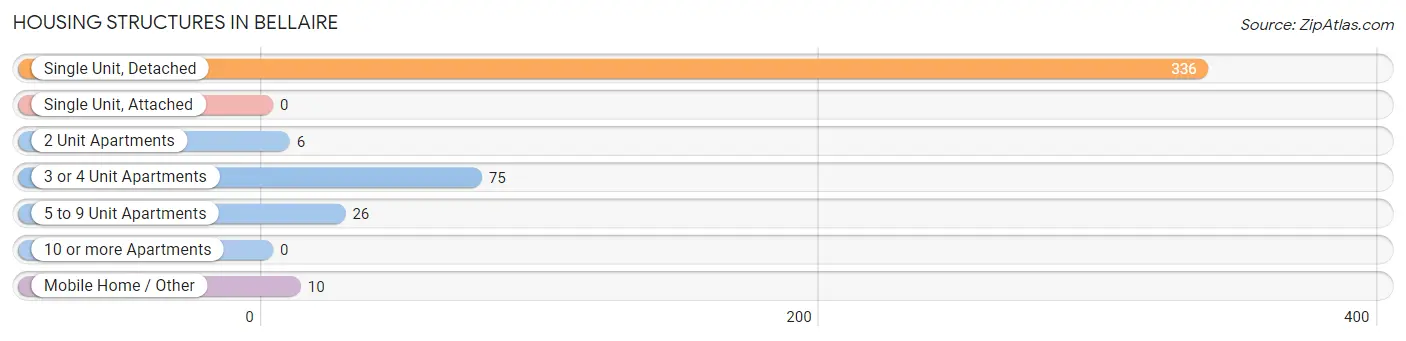
| Structure Type | # Housing Units | % Housing Units |
| Single Unit, Detached | 336 | 74.2% |
| Single Unit, Attached | 0 | 0.0% |
| 2 Unit Apartments | 6 | 1.3% |
| 3 or 4 Unit Apartments | 75 | 16.6% |
| 5 to 9 Unit Apartments | 26 | 5.7% |
| 10 or more Apartments | 0 | 0.0% |
| Mobile Home / Other | 10 | 2.2% |
| Total | 453 | 100.0% |
Housing Structures by Occupancy in Bellaire
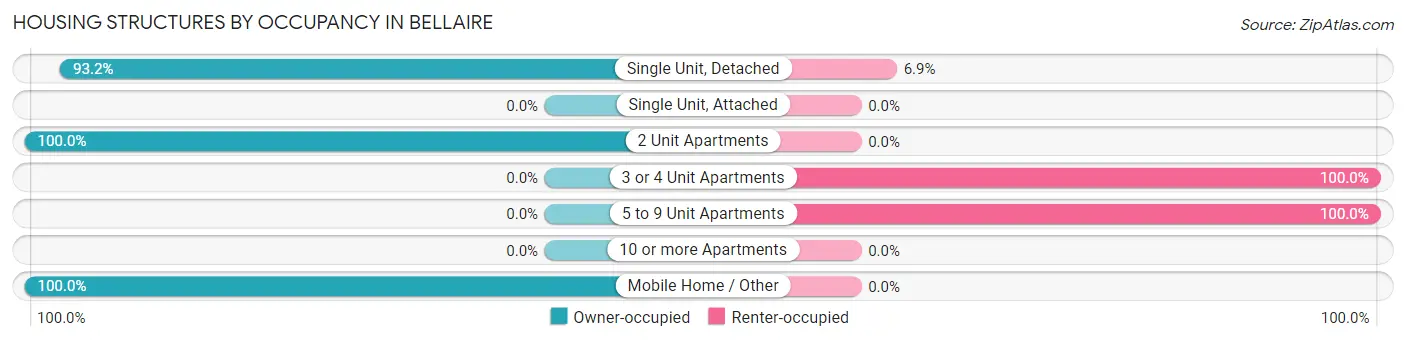
| Structure Type | Owner-occupied | Renter-occupied |
| Single Unit, Detached | 313 (93.1%) | 23 (6.9%) |
| Single Unit, Attached | 0 (0.0%) | 0 (0.0%) |
| 2 Unit Apartments | 6 (100.0%) | 0 (0.0%) |
| 3 or 4 Unit Apartments | 0 (0.0%) | 75 (100.0%) |
| 5 to 9 Unit Apartments | 0 (0.0%) | 26 (100.0%) |
| 10 or more Apartments | 0 (0.0%) | 0 (0.0%) |
| Mobile Home / Other | 10 (100.0%) | 0 (0.0%) |
| Total | 329 (72.6%) | 124 (27.4%) |
Housing Structures by Number of Rooms in Bellaire
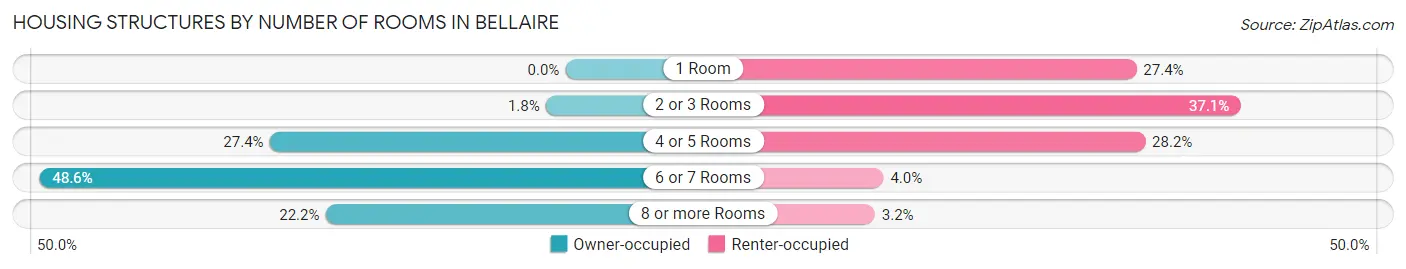
| Number of Rooms | Owner-occupied | Renter-occupied |
| 1 Room | 0 (0.0%) | 34 (27.4%) |
| 2 or 3 Rooms | 6 (1.8%) | 46 (37.1%) |
| 4 or 5 Rooms | 90 (27.4%) | 35 (28.2%) |
| 6 or 7 Rooms | 160 (48.6%) | 5 (4.0%) |
| 8 or more Rooms | 73 (22.2%) | 4 (3.2%) |
| Total | 329 (100.0%) | 124 (100.0%) |
Housing Structure by Heating Type in Bellaire
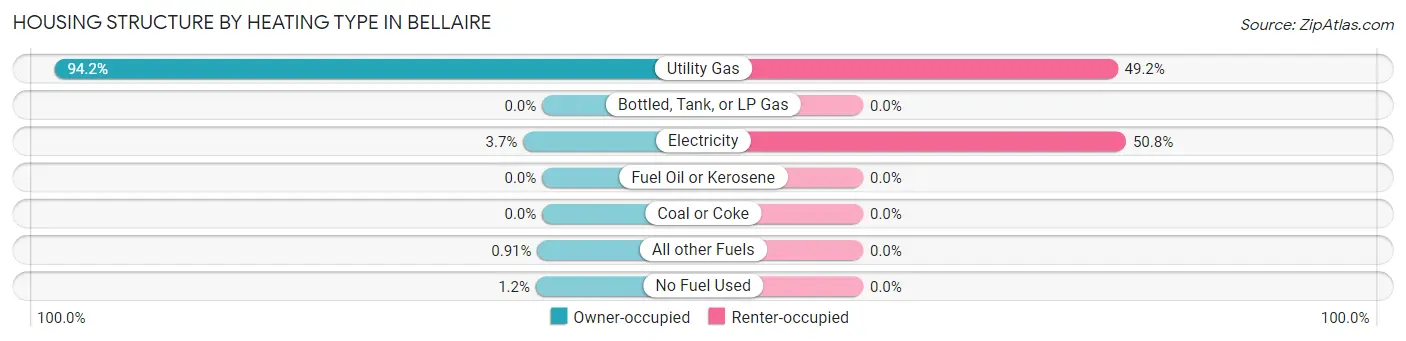
| Heating Type | Owner-occupied | Renter-occupied |
| Utility Gas | 310 (94.2%) | 61 (49.2%) |
| Bottled, Tank, or LP Gas | 0 (0.0%) | 0 (0.0%) |
| Electricity | 12 (3.6%) | 63 (50.8%) |
| Fuel Oil or Kerosene | 0 (0.0%) | 0 (0.0%) |
| Coal or Coke | 0 (0.0%) | 0 (0.0%) |
| All other Fuels | 3 (0.9%) | 0 (0.0%) |
| No Fuel Used | 4 (1.2%) | 0 (0.0%) |
| Total | 329 (100.0%) | 124 (100.0%) |
Household Vehicle Usage in Bellaire
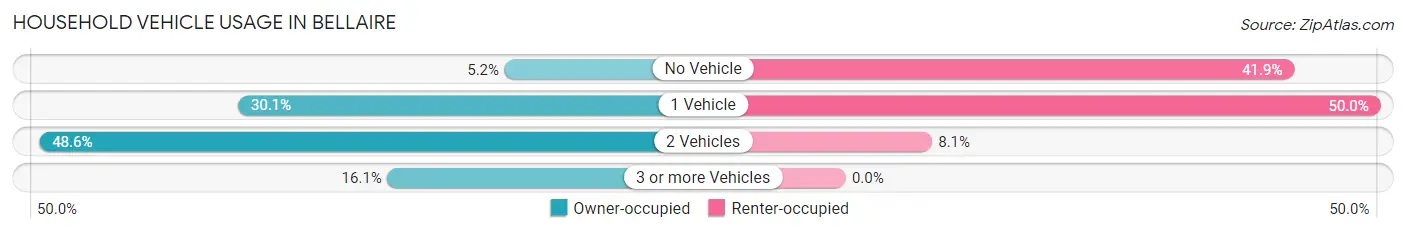
| Vehicles per Household | Owner-occupied | Renter-occupied |
| No Vehicle | 17 (5.2%) | 52 (41.9%) |
| 1 Vehicle | 99 (30.1%) | 62 (50.0%) |
| 2 Vehicles | 160 (48.6%) | 10 (8.1%) |
| 3 or more Vehicles | 53 (16.1%) | 0 (0.0%) |
| Total | 329 (100.0%) | 124 (100.0%) |
Real Estate & Mortgages in Bellaire
Real Estate and Mortgage Overview in Bellaire
| Characteristic | Without Mortgage | With Mortgage |
| Housing Units | 127 | 202 |
| Median Property Value | $161,300 | $152,500 |
| Median Household Income | $51,875 | $5 |
| Monthly Housing Costs | $475 | $12 |
| Real Estate Taxes | $1,913 | $7 |
Property Value by Mortgage Status in Bellaire
| Property Value | Without Mortgage | With Mortgage |
| Less than $50,000 | 9 (7.1%) | 21 (10.4%) |
| $50,000 to $99,999 | 26 (20.5%) | 34 (16.8%) |
| $100,000 to $299,999 | 73 (57.5%) | 105 (52.0%) |
| $300,000 to $499,999 | 12 (9.5%) | 29 (14.4%) |
| $500,000 to $749,999 | 7 (5.5%) | 5 (2.5%) |
| $750,000 to $999,999 | 0 (0.0%) | 8 (4.0%) |
| $1,000,000 or more | 0 (0.0%) | 0 (0.0%) |
| Total | 127 (100.0%) | 202 (100.0%) |
Household Income by Mortgage Status in Bellaire
| Household Income | Without Mortgage | With Mortgage |
| Less than $10,000 | 6 (4.7%) | 16 (7.9%) |
| $10,000 to $24,999 | 26 (20.5%) | 0 (0.0%) |
| $25,000 to $34,999 | 5 (3.9%) | 25 (12.4%) |
| $35,000 to $49,999 | 25 (19.7%) | 12 (5.9%) |
| $50,000 to $74,999 | 24 (18.9%) | 27 (13.4%) |
| $75,000 to $99,999 | 6 (4.7%) | 46 (22.8%) |
| $100,000 to $149,999 | 21 (16.5%) | 59 (29.2%) |
| $150,000 or more | 14 (11.0%) | 28 (13.9%) |
| Total | 127 (100.0%) | 202 (100.0%) |
Property Value to Household Income Ratio in Bellaire
| Value-to-Income Ratio | Without Mortgage | With Mortgage |
| Less than 2.0x | 45 (35.4%) | 70,750 (35,024.8%) |
| 2.0x to 2.9x | 26 (20.5%) | 84 (41.6%) |
| 3.0x to 3.9x | 5 (3.9%) | 27 (13.4%) |
| 4.0x or more | 45 (35.4%) | 26 (12.9%) |
| Total | 127 (100.0%) | 202 (100.0%) |
Real Estate Taxes by Mortgage Status in Bellaire
| Property Taxes | Without Mortgage | With Mortgage |
| Less than $800 | 8 (6.3%) | 0 (0.0%) |
| $800 to $1,499 | 32 (25.2%) | 4 (2.0%) |
| $800 to $1,499 | 78 (61.4%) | 51 (25.3%) |
| Total | 127 (100.0%) | 202 (100.0%) |
Health & Disability in Bellaire
Health Insurance Coverage by Age in Bellaire
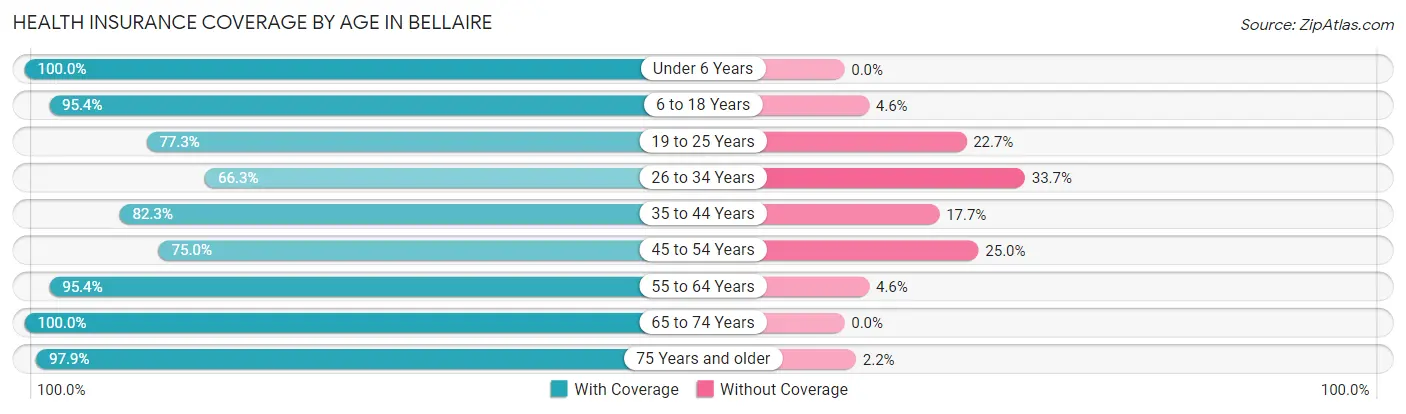
| Age Bracket | With Coverage | Without Coverage |
| Under 6 Years | 43 (100.0%) | 0 (0.0%) |
| 6 to 18 Years | 125 (95.4%) | 6 (4.6%) |
| 19 to 25 Years | 51 (77.3%) | 15 (22.7%) |
| 26 to 34 Years | 67 (66.3%) | 34 (33.7%) |
| 35 to 44 Years | 93 (82.3%) | 20 (17.7%) |
| 45 to 54 Years | 60 (75.0%) | 20 (25.0%) |
| 55 to 64 Years | 145 (95.4%) | 7 (4.6%) |
| 65 to 74 Years | 142 (100.0%) | 0 (0.0%) |
| 75 Years and older | 91 (97.9%) | 2 (2.1%) |
| Total | 817 (88.7%) | 104 (11.3%) |
Health Insurance Coverage by Citizenship Status in Bellaire
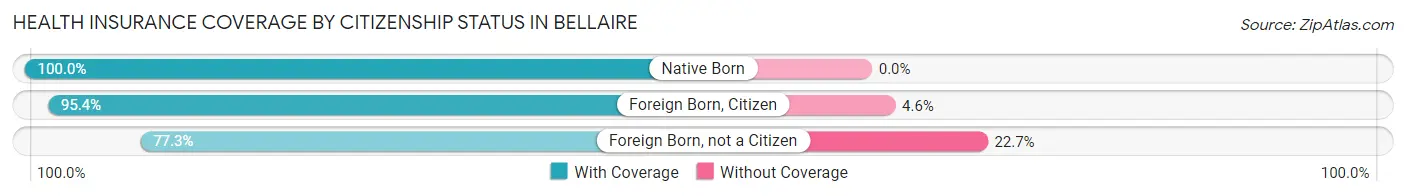
| Citizenship Status | With Coverage | Without Coverage |
| Native Born | 43 (100.0%) | 0 (0.0%) |
| Foreign Born, Citizen | 125 (95.4%) | 6 (4.6%) |
| Foreign Born, not a Citizen | 51 (77.3%) | 15 (22.7%) |
Health Insurance Coverage by Household Income in Bellaire
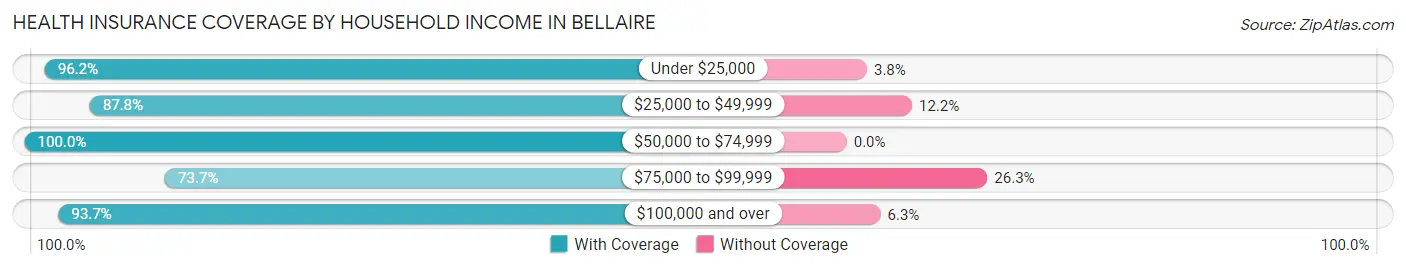
| Household Income | With Coverage | Without Coverage |
| Under $25,000 | 127 (96.2%) | 5 (3.8%) |
| $25,000 to $49,999 | 194 (87.8%) | 27 (12.2%) |
| $50,000 to $74,999 | 139 (100.0%) | 0 (0.0%) |
| $75,000 to $99,999 | 165 (73.7%) | 59 (26.3%) |
| $100,000 and over | 192 (93.7%) | 13 (6.3%) |
Public vs Private Health Insurance Coverage by Age in Bellaire
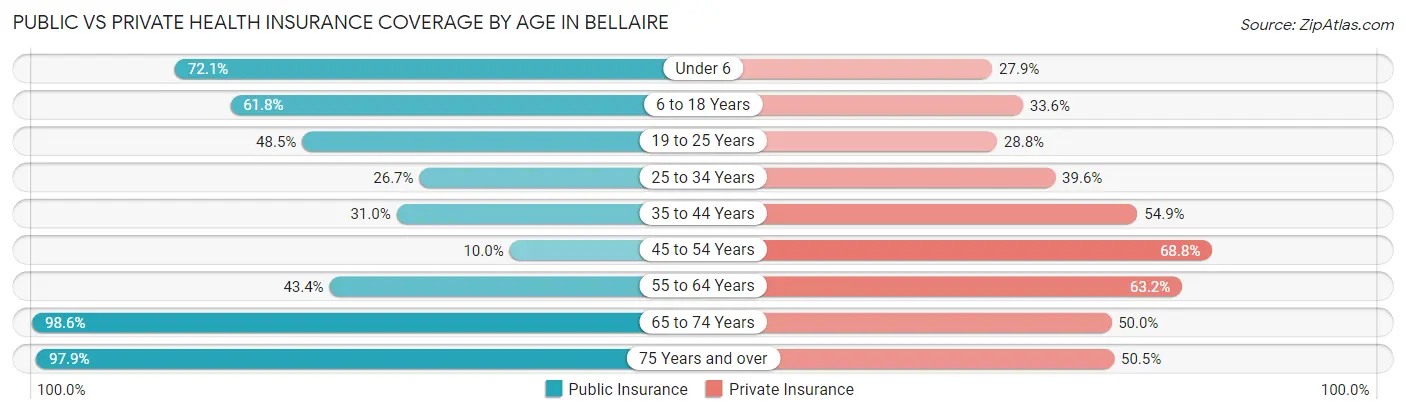
| Age Bracket | Public Insurance | Private Insurance |
| Under 6 | 31 (72.1%) | 12 (27.9%) |
| 6 to 18 Years | 81 (61.8%) | 44 (33.6%) |
| 19 to 25 Years | 32 (48.5%) | 19 (28.8%) |
| 25 to 34 Years | 27 (26.7%) | 40 (39.6%) |
| 35 to 44 Years | 35 (31.0%) | 62 (54.9%) |
| 45 to 54 Years | 8 (10.0%) | 55 (68.8%) |
| 55 to 64 Years | 66 (43.4%) | 96 (63.2%) |
| 65 to 74 Years | 140 (98.6%) | 71 (50.0%) |
| 75 Years and over | 91 (97.9%) | 47 (50.5%) |
| Total | 511 (55.5%) | 446 (48.4%) |
Disability Status by Sex by Age in Bellaire
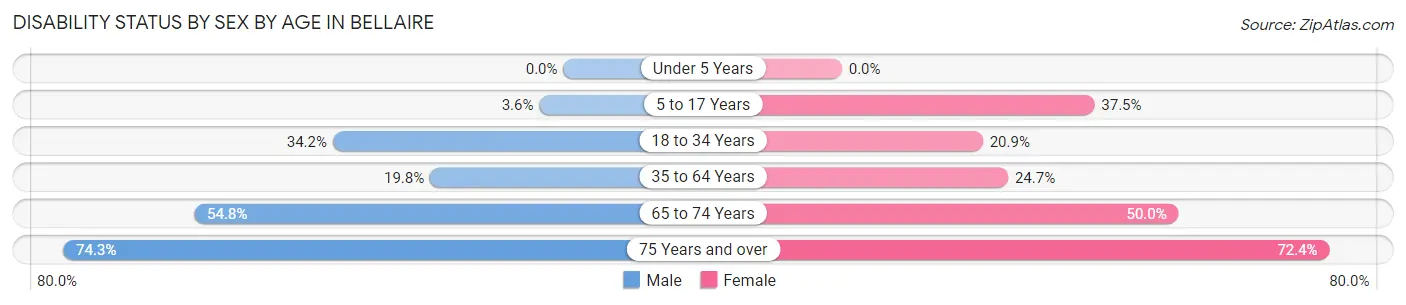
| Age Bracket | Male | Female |
| Under 5 Years | 0 (0.0%) | 0 (0.0%) |
| 5 to 17 Years | 2 (3.6%) | 18 (37.5%) |
| 18 to 34 Years | 38 (34.2%) | 18 (20.9%) |
| 35 to 64 Years | 37 (19.8%) | 39 (24.7%) |
| 65 to 74 Years | 34 (54.8%) | 40 (50.0%) |
| 75 Years and over | 26 (74.3%) | 42 (72.4%) |
Disability Class by Sex by Age in Bellaire
Disability Class: Hearing Difficulty
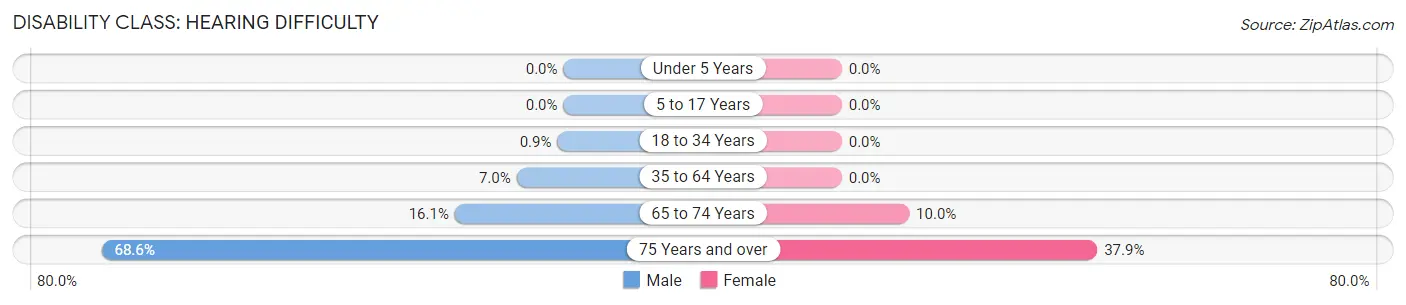
| Age Bracket | Male | Female |
| Under 5 Years | 0 (0.0%) | 0 (0.0%) |
| 5 to 17 Years | 0 (0.0%) | 0 (0.0%) |
| 18 to 34 Years | 1 (0.9%) | 0 (0.0%) |
| 35 to 64 Years | 13 (7.0%) | 0 (0.0%) |
| 65 to 74 Years | 10 (16.1%) | 8 (10.0%) |
| 75 Years and over | 24 (68.6%) | 22 (37.9%) |
Disability Class: Vision Difficulty
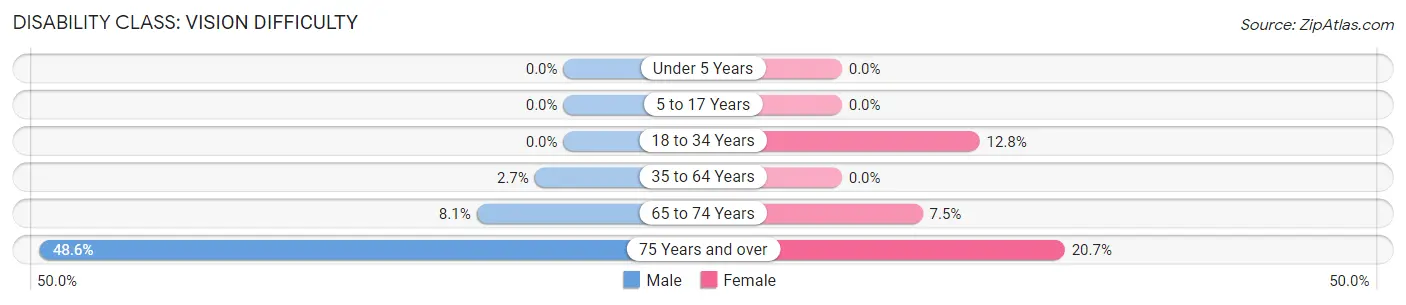
| Age Bracket | Male | Female |
| Under 5 Years | 0 (0.0%) | 0 (0.0%) |
| 5 to 17 Years | 0 (0.0%) | 0 (0.0%) |
| 18 to 34 Years | 0 (0.0%) | 11 (12.8%) |
| 35 to 64 Years | 5 (2.7%) | 0 (0.0%) |
| 65 to 74 Years | 5 (8.1%) | 6 (7.5%) |
| 75 Years and over | 17 (48.6%) | 12 (20.7%) |
Disability Class: Cognitive Difficulty
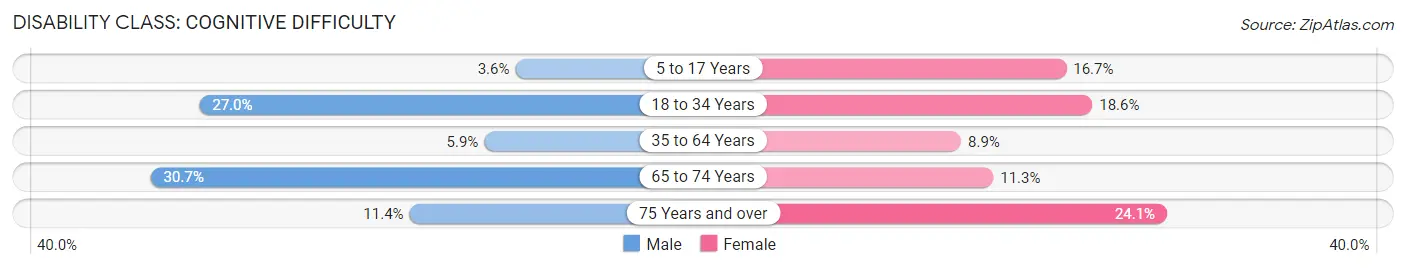
| Age Bracket | Male | Female |
| 5 to 17 Years | 2 (3.6%) | 8 (16.7%) |
| 18 to 34 Years | 30 (27.0%) | 16 (18.6%) |
| 35 to 64 Years | 11 (5.9%) | 14 (8.9%) |
| 65 to 74 Years | 19 (30.6%) | 9 (11.3%) |
| 75 Years and over | 4 (11.4%) | 14 (24.1%) |
Disability Class: Ambulatory Difficulty

| Age Bracket | Male | Female |
| 5 to 17 Years | 0 (0.0%) | 4 (8.3%) |
| 18 to 34 Years | 0 (0.0%) | 0 (0.0%) |
| 35 to 64 Years | 8 (4.3%) | 22 (13.9%) |
| 65 to 74 Years | 12 (19.4%) | 34 (42.5%) |
| 75 Years and over | 18 (51.4%) | 33 (56.9%) |
Disability Class: Self-Care Difficulty
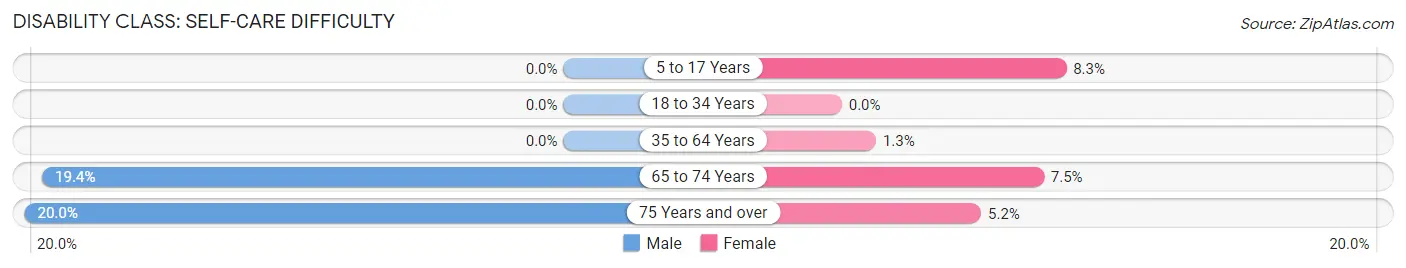
| Age Bracket | Male | Female |
| 5 to 17 Years | 0 (0.0%) | 4 (8.3%) |
| 18 to 34 Years | 0 (0.0%) | 0 (0.0%) |
| 35 to 64 Years | 0 (0.0%) | 2 (1.3%) |
| 65 to 74 Years | 12 (19.4%) | 6 (7.5%) |
| 75 Years and over | 7 (20.0%) | 3 (5.2%) |
Technology Access in Bellaire
Computing Device Access in Bellaire
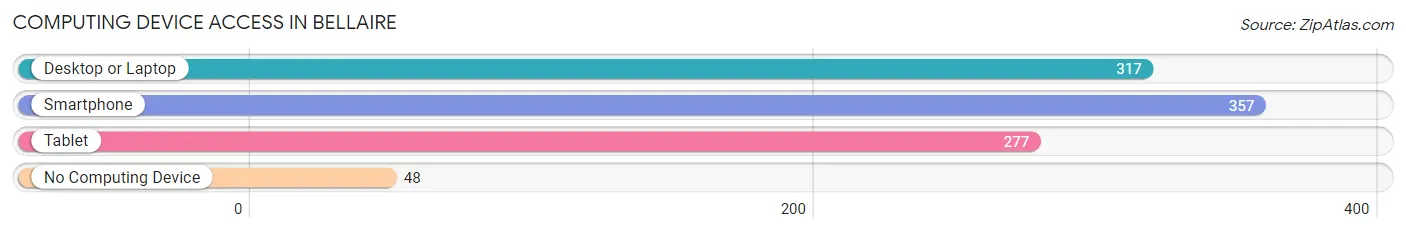
| Device Type | # Households | % Households |
| Desktop or Laptop | 317 | 70.0% |
| Smartphone | 357 | 78.8% |
| Tablet | 277 | 61.2% |
| No Computing Device | 48 | 10.6% |
| Total | 453 | 100.0% |
Internet Access in Bellaire
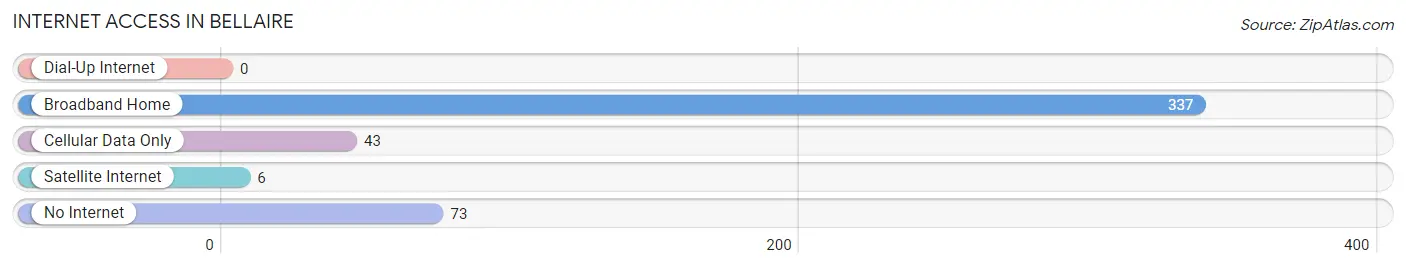
| Internet Type | # Households | % Households |
| Dial-Up Internet | 0 | 0.0% |
| Broadband Home | 337 | 74.4% |
| Cellular Data Only | 43 | 9.5% |
| Satellite Internet | 6 | 1.3% |
| No Internet | 73 | 16.1% |
| Total | 453 | 100.0% |
Bellaire Summary
Bellaire, Michigan is a small village located in Antrim County in the northern part of the state. It is situated on the east side of Torch Lake, which is part of the Chain of Lakes. The village is located about 20 miles northeast of Traverse City and is part of the Traverse City Micropolitan Statistical Area. The population of Bellaire was 1,093 at the 2010 census.
History
The area that is now Bellaire was first settled in the late 1800s by lumberjacks and farmers. The village was originally known as “Little Traverse” and was later renamed Bellaire in 1891. The name was chosen to honor the Bellaire family, who were prominent in the area. The village was incorporated in 1895.
In the early 1900s, Bellaire was a thriving lumber town. The village was home to several sawmills and a large shingle mill. The lumber industry was the main source of employment for the residents of Bellaire.
In the 1920s, the lumber industry began to decline and the village began to focus on tourism. The village was a popular destination for fishing, boating, and swimming. The village also became known for its resorts and cottages.
Geography
Bellaire is located at the northern tip of Torch Lake, which is part of the Chain of Lakes. The village is situated on the east side of the lake and is surrounded by rolling hills and forests. The village is located about 20 miles northeast of Traverse City and is part of the Traverse City Micropolitan Statistical Area.
The terrain around Bellaire is mostly flat with some rolling hills. The village is located in a temperate climate zone and has four distinct seasons. The average temperature in the summer is around 70 degrees Fahrenheit and the average temperature in the winter is around 20 degrees Fahrenheit.
Economy
The economy of Bellaire is largely based on tourism. The village is a popular destination for fishing, boating, and swimming. The village also has several resorts and cottages that attract visitors from all over the state.
The village also has several small businesses, including restaurants, shops, and a grocery store. The village is also home to several manufacturing companies, including a furniture factory and a boat manufacturing company.
Demographics
As of the 2010 census, the population of Bellaire was 1,093. The population is mostly white (97.2%) with a small percentage of African Americans (1.2%) and Native Americans (0.7%). The median household income is $37,917 and the median age is 44.7 years.
Conclusion
Bellaire, Michigan is a small village located in Antrim County in the northern part of the state. It is situated on the east side of Torch Lake, which is part of the Chain of Lakes. The village was originally settled in the late 1800s by lumberjacks and farmers and was later incorporated in 1895. The economy of Bellaire is largely based on tourism and the village is a popular destination for fishing, boating, and swimming. The population of Bellaire was 1,093 at the 2010 census and is mostly white with a small percentage of African Americans and Native Americans.
Common Questions
What is Per Capita Income in Bellaire?
Per Capita income in Bellaire is $28,593.
What is the Median Family Income in Bellaire?
Median Family Income in Bellaire is $71,250.
What is the Median Household income in Bellaire?
Median Household Income in Bellaire is $44,896.
What is Income or Wage Gap in Bellaire?
Income or Wage Gap in Bellaire is 6.8%.
Women in Bellaire earn 93.2 cents for every dollar earned by a man.
What is Inequality or Gini Index in Bellaire?
Inequality or Gini Index in Bellaire is 0.41.
What is the Total Population of Bellaire?
Total Population of Bellaire is 955.
What is the Total Male Population of Bellaire?
Total Male Population of Bellaire is 502.
What is the Total Female Population of Bellaire?
Total Female Population of Bellaire is 453.
What is the Ratio of Males per 100 Females in Bellaire?
There are 110.82 Males per 100 Females in Bellaire.
What is the Ratio of Females per 100 Males in Bellaire?
There are 90.24 Females per 100 Males in Bellaire.
What is the Median Population Age in Bellaire?
Median Population Age in Bellaire is 44.6 Years.
What is the Average Family Size in Bellaire
Average Family Size in Bellaire is 2.9 People.
What is the Average Household Size in Bellaire
Average Household Size in Bellaire is 2.0 People.
How Large is the Labor Force in Bellaire?
There are 435 People in the Labor Forcein in Bellaire.
What is the Percentage of People in the Labor Force in Bellaire?
52.6% of People are in the Labor Force in Bellaire.
What is the Unemployment Rate in Bellaire?
Unemployment Rate in Bellaire is 1.1%.