Mount Pleasant, MI Map & Demographics
Mount Pleasant Map
Mount Pleasant Overview
$23,962
PER CAPITA INCOME
$68,617
AVG FAMILY INCOME
$41,512
AVG HOUSEHOLD INCOME
50.2%
WAGE / INCOME GAP [ % ]
49.8¢/ $1
WAGE / INCOME GAP [ $ ]
$10,367
FAMILY INCOME DEFICIT
0.53
INEQUALITY / GINI INDEX
21,826
TOTAL POPULATION
10,176
MALE POPULATION
11,650
FEMALE POPULATION
87.35
MALES / 100 FEMALES
114.49
FEMALES / 100 MALES
22.9
MEDIAN AGE
2.8
AVG FAMILY SIZE
2.1
AVG HOUSEHOLD SIZE
12,042
LABOR FORCE [ PEOPLE ]
61.6%
PERCENT IN LABOR FORCE
9.5%
UNEMPLOYMENT RATE
Mount Pleasant Area Codes
Income in Mount Pleasant
Income Overview in Mount Pleasant
Per Capita Income in Mount Pleasant is $23,962, while median incomes of families and households are $68,617 and $41,512 respectively.
| Characteristic | Number | Measure |
| Per Capita Income | 21,826 | $23,962 |
| Median Family Income | 2,970 | $68,617 |
| Mean Family Income | 2,970 | $91,121 |
| Median Household Income | 7,665 | $41,512 |
| Mean Household Income | 7,665 | $60,700 |
| Income Deficit | 2,970 | $10,367 |
| Wage / Income Gap (%) | 21,826 | 50.24% |
| Wage / Income Gap ($) | 21,826 | 49.76¢ per $1 |
| Gini / Inequality Index | 21,826 | 0.53 |
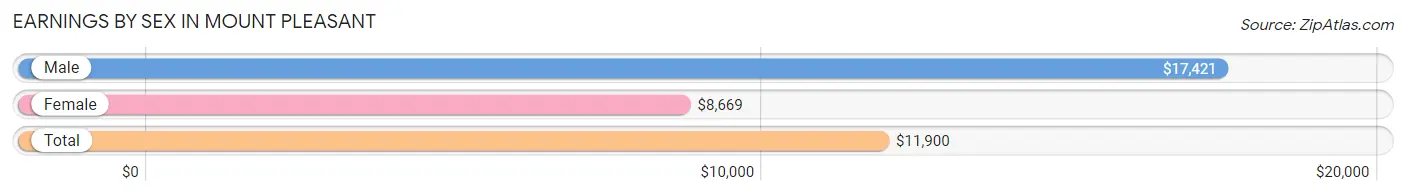
Earnings by Sex in Mount Pleasant
Average Earnings in Mount Pleasant are $11,900, $17,421 for men and $8,669 for women, a difference of 50.2%.
| Sex | Number | Average Earnings |
| Male | 7,069 (48.7%) | $17,421 |
| Female | 7,449 (51.3%) | $8,669 |
| Total | 14,518 (100.0%) | $11,900 |
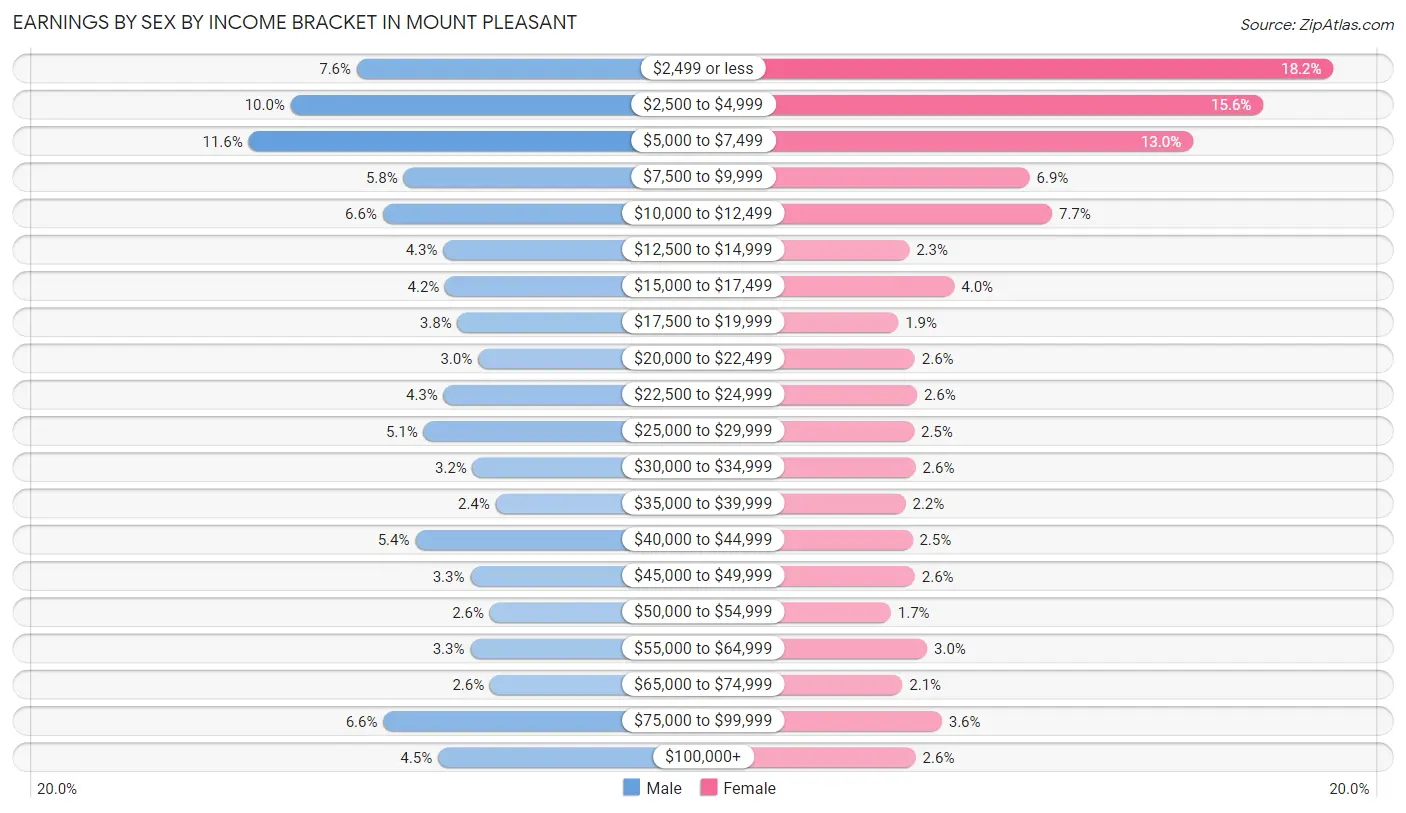
Earnings by Sex by Income Bracket in Mount Pleasant
The most common earnings brackets in Mount Pleasant are $5,000 to $7,499 for men (821 | 11.6%) and $2,499 or less for women (1,358 | 18.2%).
| Income | Male | Female |
| $2,499 or less | 534 (7.5%) | 1,358 (18.2%) |
| $2,500 to $4,999 | 709 (10.0%) | 1,162 (15.6%) |
| $5,000 to $7,499 | 821 (11.6%) | 966 (13.0%) |
| $7,500 to $9,999 | 410 (5.8%) | 510 (6.9%) |
| $10,000 to $12,499 | 465 (6.6%) | 573 (7.7%) |
| $12,500 to $14,999 | 305 (4.3%) | 174 (2.3%) |
| $15,000 to $17,499 | 300 (4.2%) | 300 (4.0%) |
| $17,500 to $19,999 | 267 (3.8%) | 144 (1.9%) |
| $20,000 to $22,499 | 213 (3.0%) | 190 (2.5%) |
| $22,500 to $24,999 | 304 (4.3%) | 196 (2.6%) |
| $25,000 to $29,999 | 357 (5.1%) | 188 (2.5%) |
| $30,000 to $34,999 | 227 (3.2%) | 192 (2.6%) |
| $35,000 to $39,999 | 166 (2.4%) | 164 (2.2%) |
| $40,000 to $44,999 | 379 (5.4%) | 183 (2.5%) |
| $45,000 to $49,999 | 233 (3.3%) | 190 (2.5%) |
| $50,000 to $54,999 | 182 (2.6%) | 123 (1.7%) |
| $55,000 to $64,999 | 233 (3.3%) | 224 (3.0%) |
| $65,000 to $74,999 | 181 (2.6%) | 155 (2.1%) |
| $75,000 to $99,999 | 464 (6.6%) | 265 (3.6%) |
| $100,000+ | 319 (4.5%) | 192 (2.6%) |
| Total | 7,069 (100.0%) | 7,449 (100.0%) |
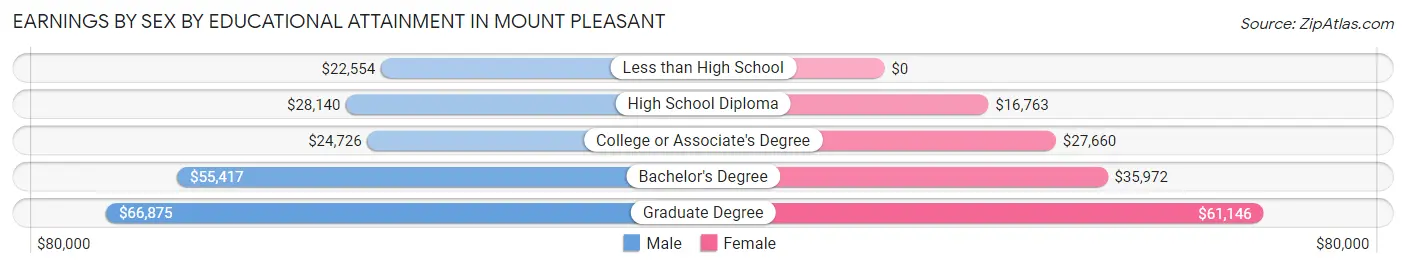
Earnings by Sex by Educational Attainment in Mount Pleasant
Average earnings in Mount Pleasant are $40,550 for men and $35,131 for women, a difference of 13.4%. Men with an educational attainment of graduate degree enjoy the highest average annual earnings of $66,875, while those with less than high school education earn the least with $22,554. Women with an educational attainment of graduate degree earn the most with the average annual earnings of $61,146, while those with high school diploma education have the smallest earnings of $16,763.
| Educational Attainment | Male Income | Female Income |
| Less than High School | $22,554 | $0 |
| High School Diploma | $28,140 | $16,763 |
| College or Associate's Degree | $24,726 | $27,660 |
| Bachelor's Degree | $55,417 | $35,972 |
| Graduate Degree | $66,875 | $61,146 |
| Total | $40,550 | $35,131 |
Family Income in Mount Pleasant
Family Income Brackets in Mount Pleasant
According to the Mount Pleasant family income data, there are 561 families falling into the $50,000 to $74,999 income range, which is the most common income bracket and makes up 18.9% of all families. Conversely, the $25,000 to $34,999 income bracket is the least frequent group with only 143 families (4.8%) belonging to this category.
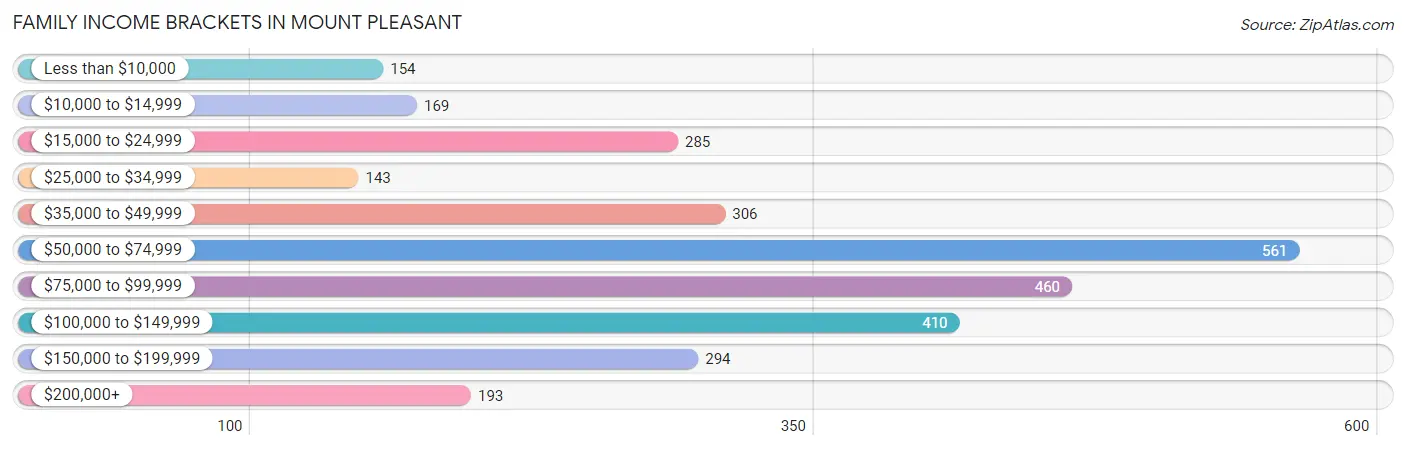
| Income Bracket | # Families | % Families |
| Less than $10,000 | 154 | 5.2% |
| $10,000 to $14,999 | 169 | 5.7% |
| $15,000 to $24,999 | 285 | 9.6% |
| $25,000 to $34,999 | 143 | 4.8% |
| $35,000 to $49,999 | 306 | 10.3% |
| $50,000 to $74,999 | 561 | 18.9% |
| $75,000 to $99,999 | 460 | 15.5% |
| $100,000 to $149,999 | 410 | 13.8% |
| $150,000 to $199,999 | 294 | 9.9% |
| $200,000+ | 193 | 6.5% |
Family Income by Famaliy Size in Mount Pleasant
4-person families (409 | 13.8%) account for the highest median family income in Mount Pleasant with $96,741 per family, while 2-person families (1,566 | 52.7%) have the highest median income of $30,394 per family member.
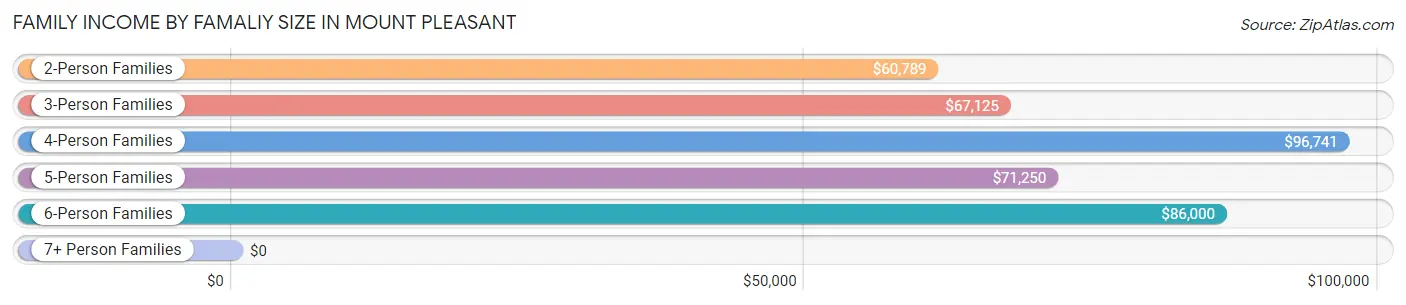
| Income Bracket | # Families | Median Income |
| 2-Person Families | 1,566 (52.7%) | $60,789 |
| 3-Person Families | 802 (27.0%) | $67,125 |
| 4-Person Families | 409 (13.8%) | $96,741 |
| 5-Person Families | 163 (5.5%) | $71,250 |
| 6-Person Families | 22 (0.7%) | $86,000 |
| 7+ Person Families | 8 (0.3%) | $0 |
| Total | 2,970 (100.0%) | $68,617 |
Family Income by Number of Earners in Mount Pleasant
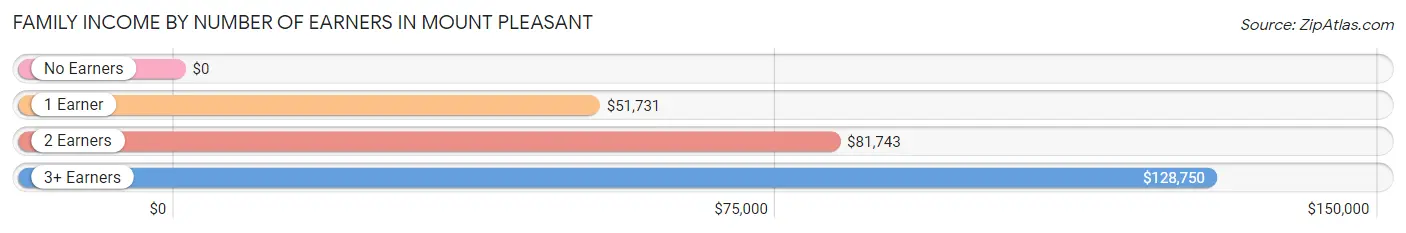
| Number of Earners | # Families | Median Income |
| No Earners | 336 (11.3%) | $0 |
| 1 Earner | 958 (32.3%) | $51,731 |
| 2 Earners | 1,509 (50.8%) | $81,743 |
| 3+ Earners | 167 (5.6%) | $128,750 |
| Total | 2,970 (100.0%) | $68,617 |
Household Income in Mount Pleasant
Household Income Brackets in Mount Pleasant
With 1,226 households falling in the category, the $50,000 to $74,999 income range is the most frequent in Mount Pleasant, accounting for 16.0% of all households. In contrast, only 261 households (3.4%) fall into the $200,000+ income bracket, making it the least populous group.
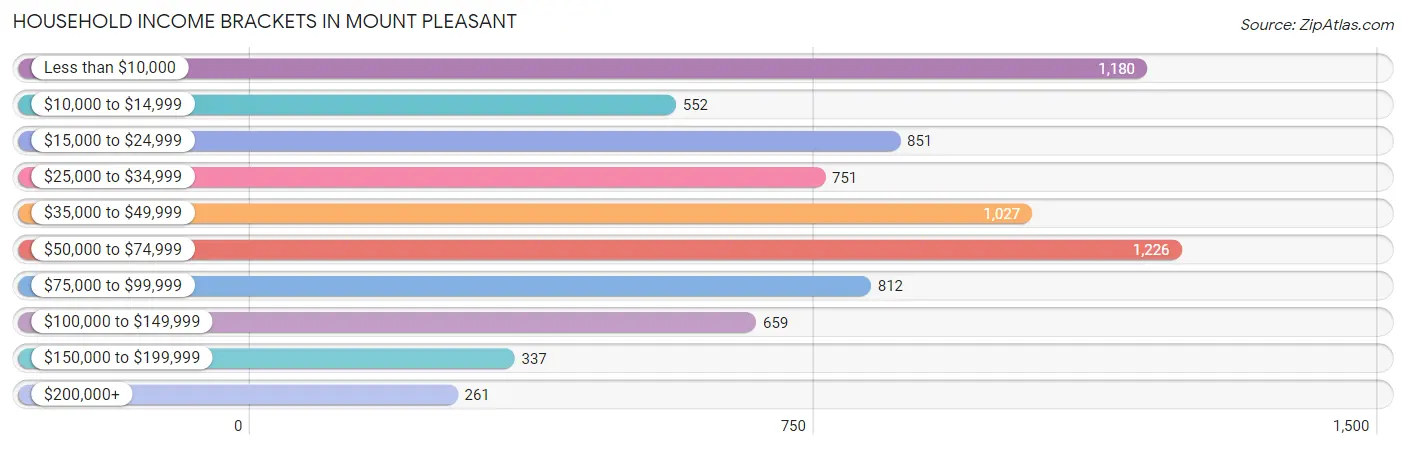
| Income Bracket | # Households | % Households |
| Less than $10,000 | 1,180 | 15.4% |
| $10,000 to $14,999 | 552 | 7.2% |
| $15,000 to $24,999 | 851 | 11.1% |
| $25,000 to $34,999 | 751 | 9.8% |
| $35,000 to $49,999 | 1,027 | 13.4% |
| $50,000 to $74,999 | 1,226 | 16.0% |
| $75,000 to $99,999 | 812 | 10.6% |
| $100,000 to $149,999 | 659 | 8.6% |
| $150,000 to $199,999 | 337 | 4.4% |
| $200,000+ | 261 | 3.4% |
Household Income by Householder Age in Mount Pleasant
The median household income in Mount Pleasant is $41,512, with the highest median household income of $58,547 found in the 45 to 64 years age bracket for the primary householder. A total of 1,729 households (22.6%) fall into this category. Meanwhile, the 15 to 24 years age bracket for the primary householder has the lowest median household income of $20,727, with 2,035 households (26.6%) in this group.
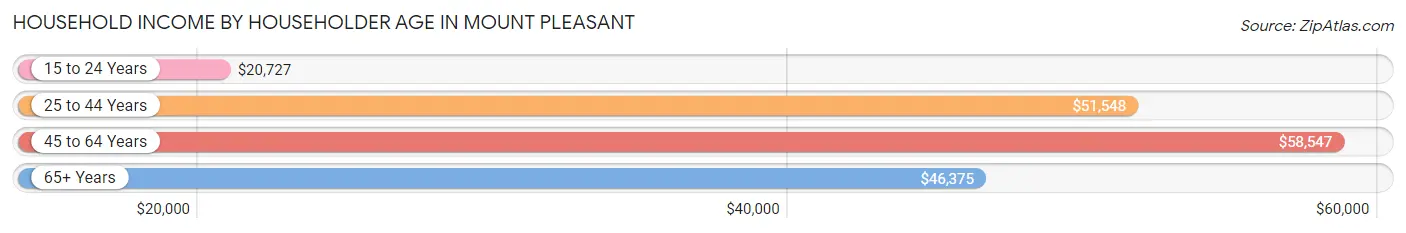
| Income Bracket | # Households | Median Income |
| 15 to 24 Years | 2,035 (26.6%) | $20,727 |
| 25 to 44 Years | 2,701 (35.2%) | $51,548 |
| 45 to 64 Years | 1,729 (22.6%) | $58,547 |
| 65+ Years | 1,200 (15.7%) | $46,375 |
| Total | 7,665 (100.0%) | $41,512 |
Poverty in Mount Pleasant
Income Below Poverty by Sex and Age in Mount Pleasant
With 29.8% poverty level for males and 38.7% for females among the residents of Mount Pleasant, 18 to 24 year old males and 18 to 24 year old females are the most vulnerable to poverty, with 1,212 males (53.3%) and 1,889 females (73.0%) in their respective age groups living below the poverty level.
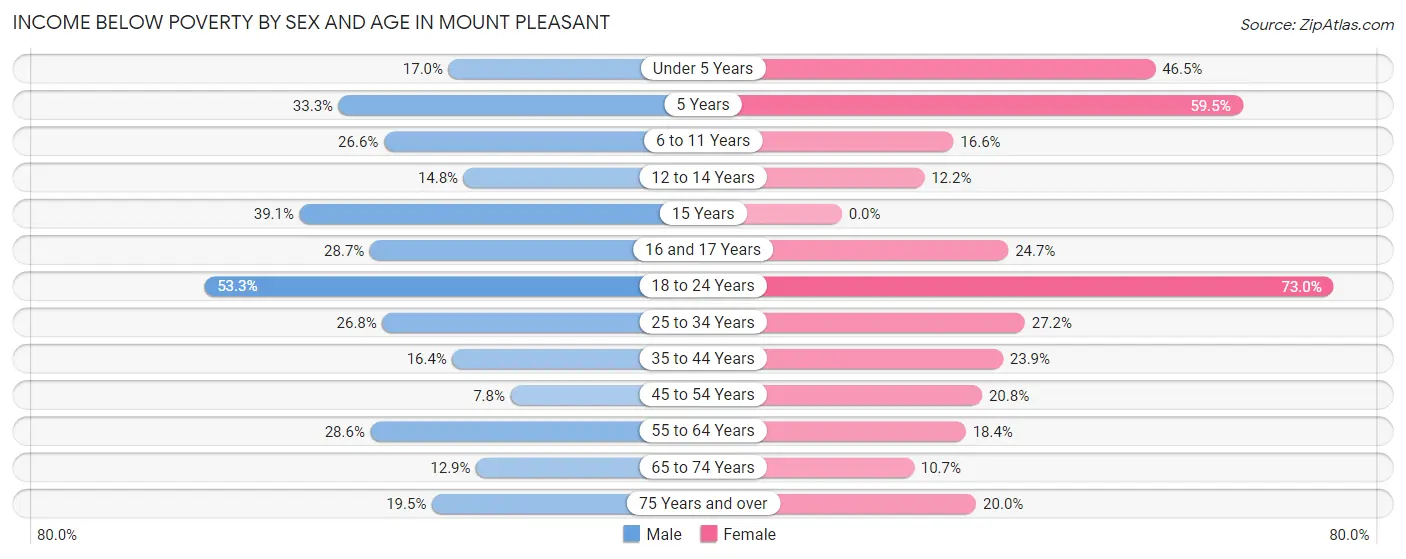
| Age Bracket | Male | Female |
| Under 5 Years | 59 (17.0%) | 229 (46.5%) |
| 5 Years | 25 (33.3%) | 94 (59.5%) |
| 6 to 11 Years | 95 (26.6%) | 57 (16.6%) |
| 12 to 14 Years | 31 (14.8%) | 18 (12.2%) |
| 15 Years | 9 (39.1%) | 0 (0.0%) |
| 16 and 17 Years | 35 (28.7%) | 21 (24.7%) |
| 18 to 24 Years | 1,212 (53.3%) | 1,889 (73.0%) |
| 25 to 34 Years | 390 (26.8%) | 344 (27.2%) |
| 35 to 44 Years | 193 (16.4%) | 216 (23.9%) |
| 45 to 54 Years | 55 (7.8%) | 157 (20.8%) |
| 55 to 64 Years | 159 (28.6%) | 124 (18.4%) |
| 65 to 74 Years | 50 (12.9%) | 68 (10.7%) |
| 75 Years and over | 37 (19.5%) | 85 (20.0%) |
| Total | 2,350 (29.8%) | 3,302 (38.7%) |
Income Above Poverty by Sex and Age in Mount Pleasant
According to the poverty statistics in Mount Pleasant, males aged 45 to 54 years and females aged 15 years are the age groups that are most secure financially, with 92.2% of males and 100.0% of females in these age groups living above the poverty line.
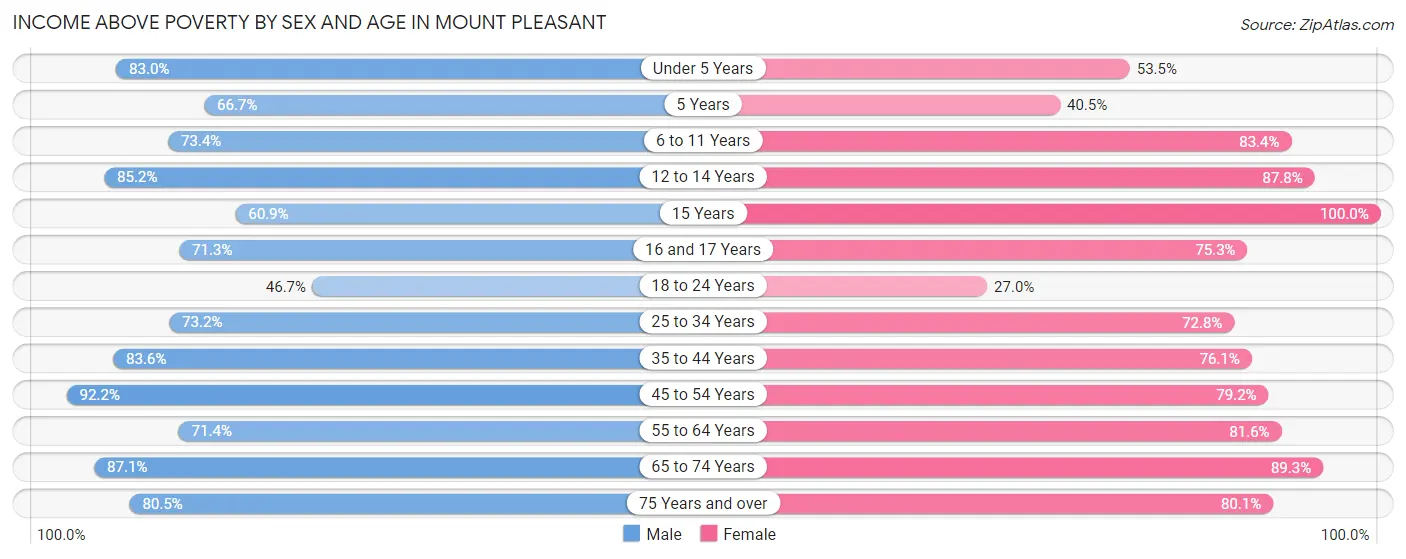
| Age Bracket | Male | Female |
| Under 5 Years | 288 (83.0%) | 263 (53.5%) |
| 5 Years | 50 (66.7%) | 64 (40.5%) |
| 6 to 11 Years | 262 (73.4%) | 287 (83.4%) |
| 12 to 14 Years | 179 (85.2%) | 129 (87.8%) |
| 15 Years | 14 (60.9%) | 69 (100.0%) |
| 16 and 17 Years | 87 (71.3%) | 64 (75.3%) |
| 18 to 24 Years | 1,061 (46.7%) | 698 (27.0%) |
| 25 to 34 Years | 1,063 (73.2%) | 922 (72.8%) |
| 35 to 44 Years | 982 (83.6%) | 687 (76.1%) |
| 45 to 54 Years | 649 (92.2%) | 597 (79.2%) |
| 55 to 64 Years | 397 (71.4%) | 550 (81.6%) |
| 65 to 74 Years | 337 (87.1%) | 568 (89.3%) |
| 75 Years and over | 153 (80.5%) | 341 (80.0%) |
| Total | 5,522 (70.2%) | 5,239 (61.3%) |
Income Below Poverty Among Married-Couple Families in Mount Pleasant
The poverty statistics for married-couple families in Mount Pleasant show that 8.4% or 161 of the total 1,929 families live below the poverty line. Families with 5 or more children have the highest poverty rate of 100.0%, comprising of 8 families. On the other hand, families with no children have the lowest poverty rate of 4.0%, which includes 44 families.
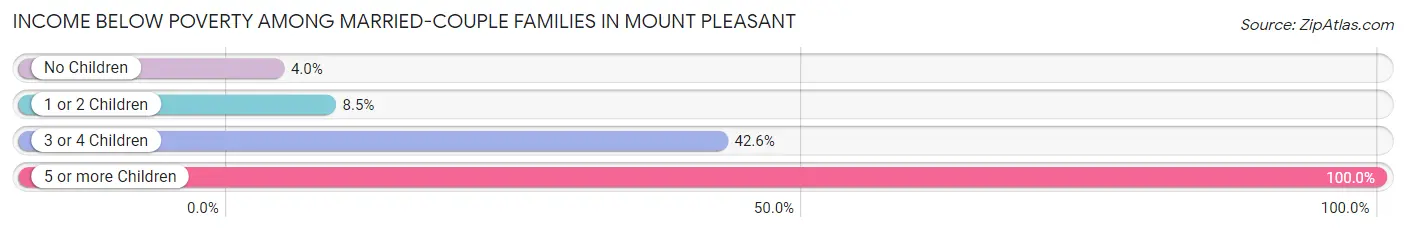
| Children | Above Poverty | Below Poverty |
| No Children | 1,055 (96.0%) | 44 (4.0%) |
| 1 or 2 Children | 647 (91.5%) | 60 (8.5%) |
| 3 or 4 Children | 66 (57.4%) | 49 (42.6%) |
| 5 or more Children | 0 (0.0%) | 8 (100.0%) |
| Total | 1,768 (91.6%) | 161 (8.4%) |
Income Below Poverty Among Single-Parent Households in Mount Pleasant
According to the poverty data in Mount Pleasant, 27.4% or 84 single-father households and 40.1% or 294 single-mother households are living below the poverty line. Among single-father households, those with 3 or 4 children have the highest poverty rate, with 5 households (100.0%) experiencing poverty. Likewise, among single-mother households, those with 3 or 4 children have the highest poverty rate, with 8 households (100.0%) falling below the poverty line.
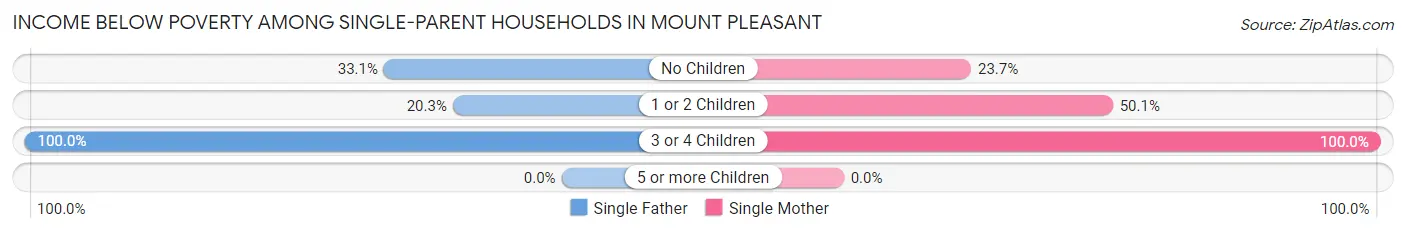
| Children | Single Father | Single Mother |
| No Children | 46 (33.1%) | 70 (23.7%) |
| 1 or 2 Children | 33 (20.3%) | 216 (50.1%) |
| 3 or 4 Children | 5 (100.0%) | 8 (100.0%) |
| 5 or more Children | 0 (0.0%) | 0 (0.0%) |
| Total | 84 (27.4%) | 294 (40.1%) |
Income Below Poverty Among Married-Couple vs Single-Parent Households in Mount Pleasant
The poverty data for Mount Pleasant shows that 161 of the married-couple family households (8.4%) and 378 of the single-parent households (36.3%) are living below the poverty level. Within the married-couple family households, those with 5 or more children have the highest poverty rate, with 8 households (100.0%) falling below the poverty line. Among the single-parent households, those with 3 or 4 children have the highest poverty rate, with 13 household (100.0%) living below poverty.
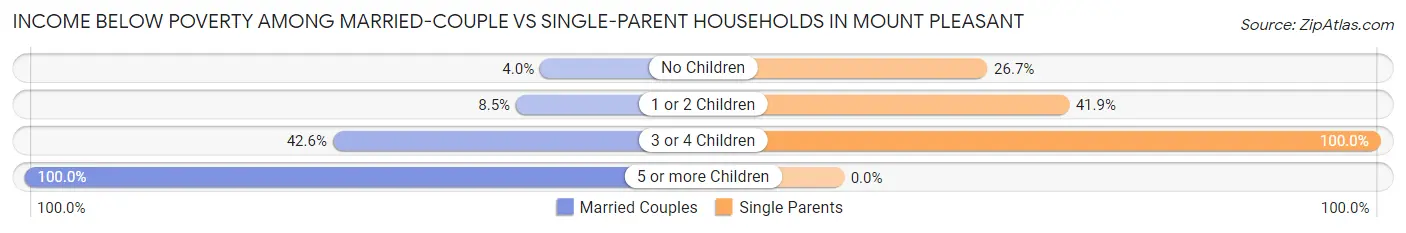
| Children | Married-Couple Families | Single-Parent Households |
| No Children | 44 (4.0%) | 116 (26.7%) |
| 1 or 2 Children | 60 (8.5%) | 249 (41.9%) |
| 3 or 4 Children | 49 (42.6%) | 13 (100.0%) |
| 5 or more Children | 8 (100.0%) | 0 (0.0%) |
| Total | 161 (8.4%) | 378 (36.3%) |
Race in Mount Pleasant
The most populous races in Mount Pleasant are White / Caucasian (18,104 | 83.0%), Hispanic or Latino (1,259 | 5.8%), and Two or more Races (1,240 | 5.7%).
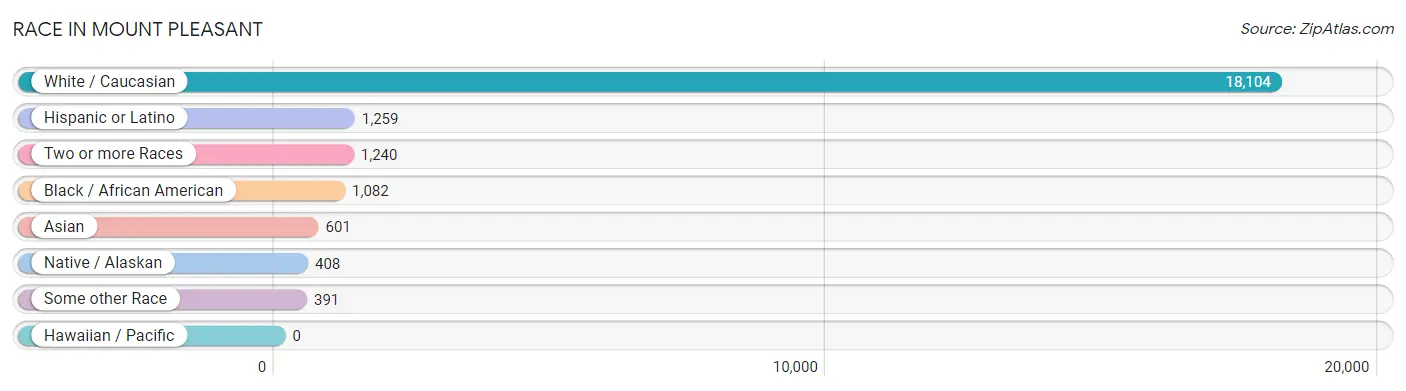
| Race | # Population | % Population |
| Asian | 601 | 2.8% |
| Black / African American | 1,082 | 5.0% |
| Hawaiian / Pacific | 0 | 0.0% |
| Hispanic or Latino | 1,259 | 5.8% |
| Native / Alaskan | 408 | 1.9% |
| White / Caucasian | 18,104 | 83.0% |
| Two or more Races | 1,240 | 5.7% |
| Some other Race | 391 | 1.8% |
| Total | 21,826 | 100.0% |
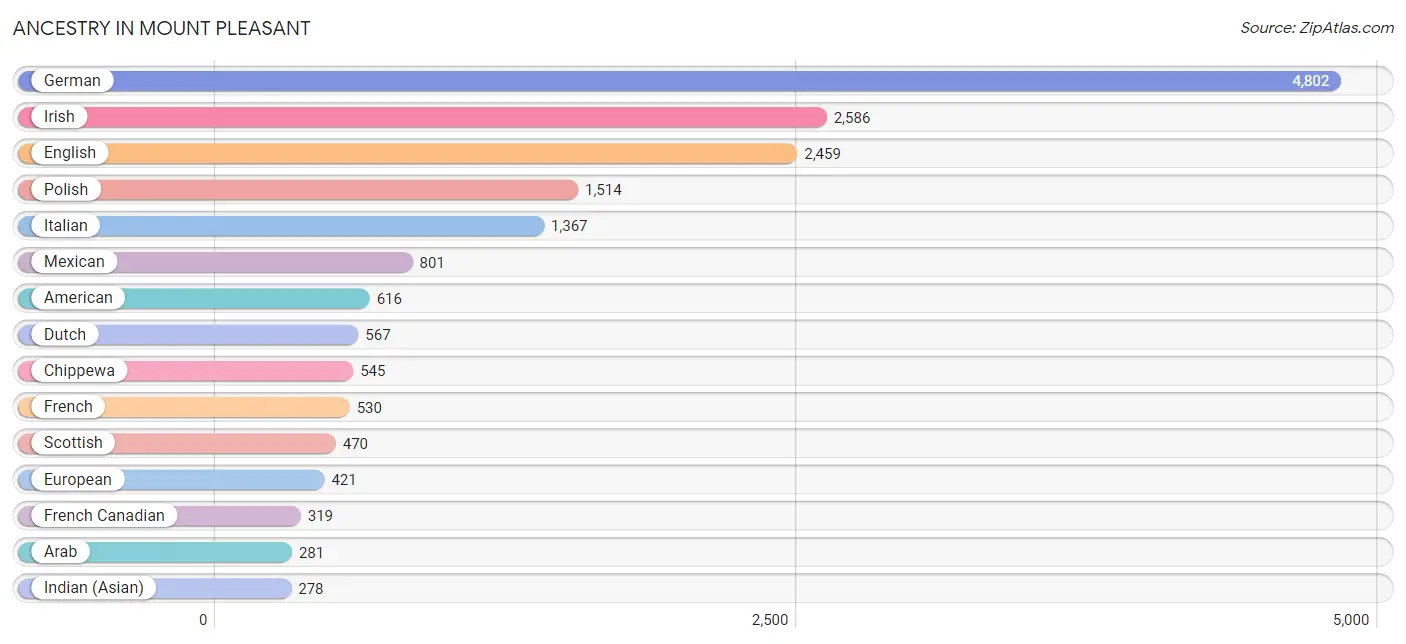
Ancestry in Mount Pleasant
The most populous ancestries reported in Mount Pleasant are German (4,802 | 22.0%), Irish (2,586 | 11.8%), English (2,459 | 11.3%), Polish (1,514 | 6.9%), and Italian (1,367 | 6.3%), together accounting for 58.3% of all Mount Pleasant residents.
| Ancestry | # Population | % Population |
| African | 128 | 0.6% |
| Alaska Native | 5 | 0.0% |
| Albanian | 4 | 0.0% |
| American | 616 | 2.8% |
| Arab | 281 | 1.3% |
| Argentinean | 7 | 0.0% |
| Armenian | 36 | 0.2% |
| Assyrian / Chaldean / Syriac | 16 | 0.1% |
| Australian | 5 | 0.0% |
| Austrian | 127 | 0.6% |
| Bangladeshi | 7 | 0.0% |
| Belgian | 84 | 0.4% |
| Bhutanese | 17 | 0.1% |
| British | 56 | 0.3% |
| British West Indian | 5 | 0.0% |
| Bulgarian | 10 | 0.1% |
| Burmese | 83 | 0.4% |
| Cambodian | 32 | 0.2% |
| Canadian | 111 | 0.5% |
| Celtic | 12 | 0.1% |
| Central American | 34 | 0.2% |
| Cherokee | 18 | 0.1% |
| Chilean | 7 | 0.0% |
| Chippewa | 545 | 2.5% |
| Colombian | 21 | 0.1% |
| Costa Rican | 6 | 0.0% |
| Croatian | 40 | 0.2% |
| Cuban | 6 | 0.0% |
| Czech | 157 | 0.7% |
| Czechoslovakian | 79 | 0.4% |
| Danish | 71 | 0.3% |
| Dutch | 567 | 2.6% |
| Eastern European | 63 | 0.3% |
| English | 2,459 | 11.3% |
| European | 421 | 1.9% |
| Filipino | 9 | 0.0% |
| Finnish | 148 | 0.7% |
| French | 530 | 2.4% |
| French American Indian | 11 | 0.1% |
| French Canadian | 319 | 1.5% |
| German | 4,802 | 22.0% |
| Ghanaian | 6 | 0.0% |
| Greek | 64 | 0.3% |
| Guatemalan | 17 | 0.1% |
| Haitian | 7 | 0.0% |
| Hungarian | 137 | 0.6% |
| Indian (Asian) | 278 | 1.3% |
| Indonesian | 7 | 0.0% |
| Iranian | 22 | 0.1% |
| Irish | 2,586 | 11.8% |
| Italian | 1,367 | 6.3% |
| Japanese | 25 | 0.1% |
| Korean | 58 | 0.3% |
| Lebanese | 86 | 0.4% |
| Lithuanian | 83 | 0.4% |
| Malaysian | 29 | 0.1% |
| Maltese | 49 | 0.2% |
| Mexican | 801 | 3.7% |
| Mongolian | 4 | 0.0% |
| Moroccan | 5 | 0.0% |
| Nigerian | 62 | 0.3% |
| Northern European | 32 | 0.2% |
| Norwegian | 172 | 0.8% |
| Ottawa | 52 | 0.2% |
| Pakistani | 15 | 0.1% |
| Palestinian | 8 | 0.0% |
| Paraguayan | 13 | 0.1% |
| Pennsylvania German | 13 | 0.1% |
| Peruvian | 34 | 0.2% |
| Polish | 1,514 | 6.9% |
| Portuguese | 57 | 0.3% |
| Potawatomi | 18 | 0.1% |
| Pueblo | 7 | 0.0% |
| Puerto Rican | 33 | 0.2% |
| Romanian | 78 | 0.4% |
| Russian | 154 | 0.7% |
| Salvadoran | 11 | 0.1% |
| Scandinavian | 128 | 0.6% |
| Scotch-Irish | 147 | 0.7% |
| Scottish | 470 | 2.1% |
| Serbian | 59 | 0.3% |
| Sioux | 11 | 0.1% |
| Slavic | 68 | 0.3% |
| Slovak | 84 | 0.4% |
| Slovene | 14 | 0.1% |
| South African | 5 | 0.0% |
| South American | 82 | 0.4% |
| South American Indian | 29 | 0.1% |
| Spaniard | 81 | 0.4% |
| Spanish | 112 | 0.5% |
| Sri Lankan | 19 | 0.1% |
| Subsaharan African | 193 | 0.9% |
| Swedish | 146 | 0.7% |
| Swiss | 61 | 0.3% |
| Syrian | 140 | 0.6% |
| Thai | 209 | 1.0% |
| Ukrainian | 68 | 0.3% |
| Welsh | 135 | 0.6% |
| West Indian | 9 | 0.0% |
| Yugoslavian | 30 | 0.1% | View All 100 Rows |
Immigrants in Mount Pleasant
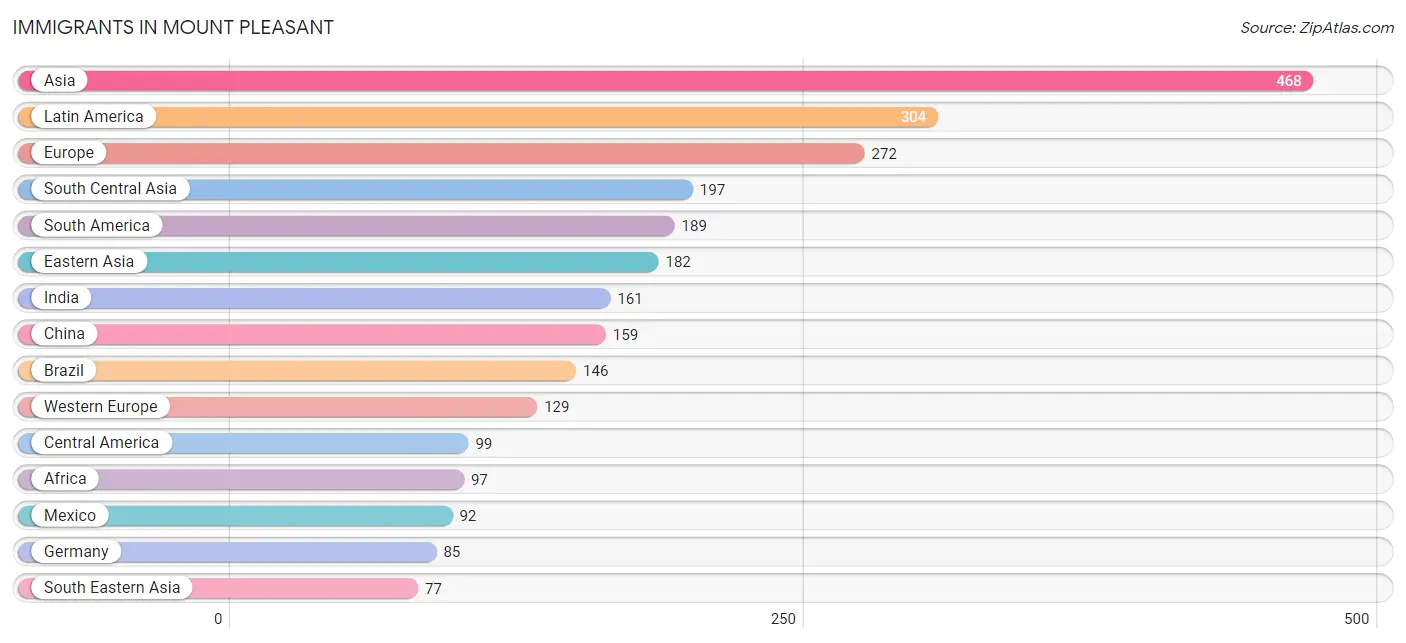
The most numerous immigrant groups reported in Mount Pleasant came from Asia (468 | 2.1%), Latin America (304 | 1.4%), Europe (272 | 1.3%), South Central Asia (197 | 0.9%), and South America (189 | 0.9%), together accounting for 6.6% of all Mount Pleasant residents.
| Immigration Origin | # Population | % Population |
| Africa | 97 | 0.4% |
| Argentina | 3 | 0.0% |
| Asia | 468 | 2.1% |
| Austria | 13 | 0.1% |
| Brazil | 146 | 0.7% |
| Bulgaria | 10 | 0.1% |
| Cambodia | 20 | 0.1% |
| Canada | 54 | 0.3% |
| Caribbean | 16 | 0.1% |
| Central America | 99 | 0.4% |
| China | 159 | 0.7% |
| Colombia | 6 | 0.0% |
| Dominica | 5 | 0.0% |
| Eastern Asia | 182 | 0.8% |
| Eastern Europe | 64 | 0.3% |
| Egypt | 10 | 0.1% |
| England | 36 | 0.2% |
| Europe | 272 | 1.3% |
| Germany | 85 | 0.4% |
| Ghana | 6 | 0.0% |
| Guatemala | 7 | 0.0% |
| Haiti | 7 | 0.0% |
| India | 161 | 0.7% |
| Indonesia | 11 | 0.1% |
| Iran | 9 | 0.0% |
| Iraq | 5 | 0.0% |
| Italy | 4 | 0.0% |
| Korea | 23 | 0.1% |
| Kuwait | 7 | 0.0% |
| Latin America | 304 | 1.4% |
| Mexico | 92 | 0.4% |
| Morocco | 5 | 0.0% |
| Netherlands | 31 | 0.1% |
| Nigeria | 62 | 0.3% |
| Northern Africa | 15 | 0.1% |
| Northern Europe | 54 | 0.3% |
| Norway | 5 | 0.0% |
| Pakistan | 27 | 0.1% |
| Peru | 34 | 0.2% |
| Philippines | 30 | 0.1% |
| Poland | 32 | 0.2% |
| Scotland | 8 | 0.0% |
| South Africa | 14 | 0.1% |
| South America | 189 | 0.9% |
| South Central Asia | 197 | 0.9% |
| South Eastern Asia | 77 | 0.4% |
| Southern Europe | 25 | 0.1% |
| Spain | 21 | 0.1% |
| Sweden | 5 | 0.0% |
| Taiwan | 25 | 0.1% |
| Thailand | 9 | 0.0% |
| Trinidad and Tobago | 4 | 0.0% |
| Western Africa | 68 | 0.3% |
| Western Asia | 12 | 0.1% |
| Western Europe | 129 | 0.6% | View All 55 Rows |
Sex and Age in Mount Pleasant
Sex and Age in Mount Pleasant
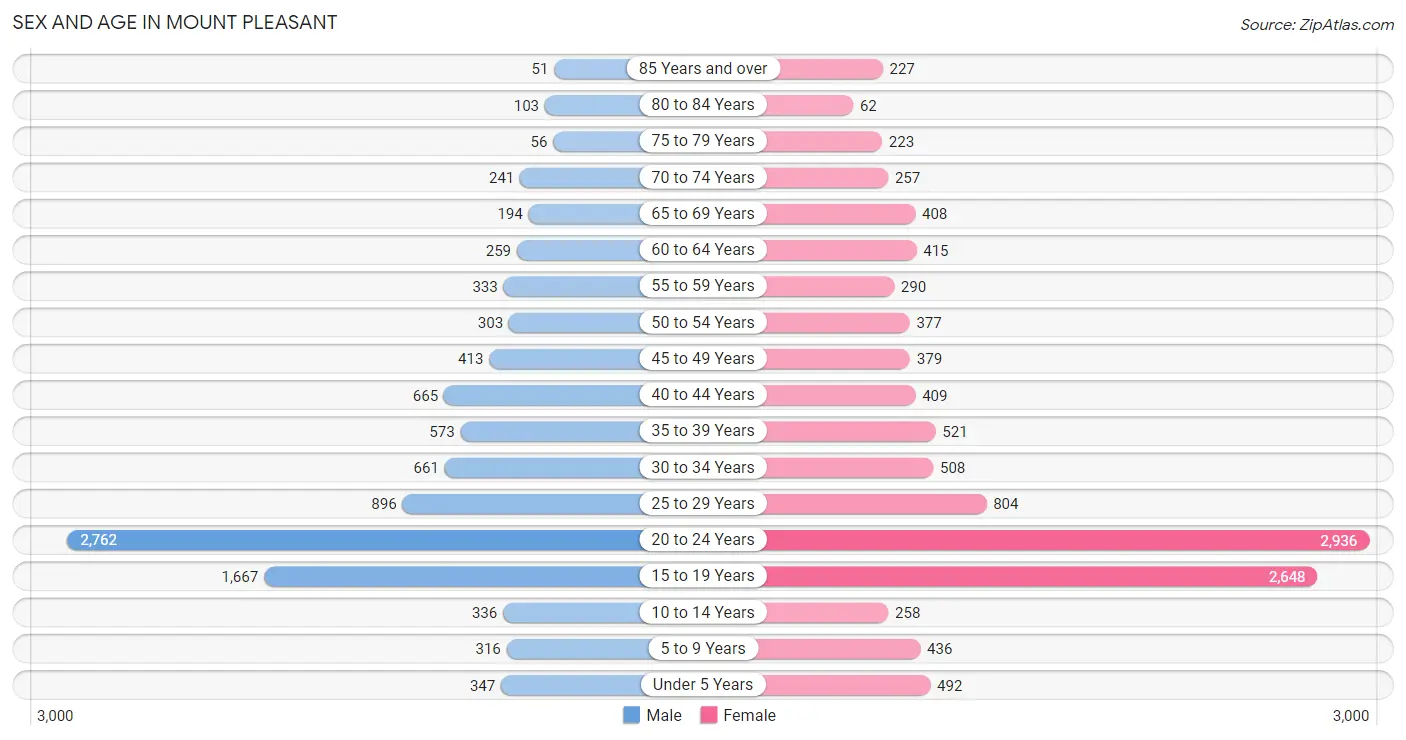
The most populous age groups in Mount Pleasant are 20 to 24 Years (2,762 | 27.1%) for men and 20 to 24 Years (2,936 | 25.2%) for women.
| Age Bracket | Male | Female |
| Under 5 Years | 347 (3.4%) | 492 (4.2%) |
| 5 to 9 Years | 316 (3.1%) | 436 (3.7%) |
| 10 to 14 Years | 336 (3.3%) | 258 (2.2%) |
| 15 to 19 Years | 1,667 (16.4%) | 2,648 (22.7%) |
| 20 to 24 Years | 2,762 (27.1%) | 2,936 (25.2%) |
| 25 to 29 Years | 896 (8.8%) | 804 (6.9%) |
| 30 to 34 Years | 661 (6.5%) | 508 (4.4%) |
| 35 to 39 Years | 573 (5.6%) | 521 (4.5%) |
| 40 to 44 Years | 665 (6.5%) | 409 (3.5%) |
| 45 to 49 Years | 413 (4.1%) | 379 (3.3%) |
| 50 to 54 Years | 303 (3.0%) | 377 (3.2%) |
| 55 to 59 Years | 333 (3.3%) | 290 (2.5%) |
| 60 to 64 Years | 259 (2.5%) | 415 (3.6%) |
| 65 to 69 Years | 194 (1.9%) | 408 (3.5%) |
| 70 to 74 Years | 241 (2.4%) | 257 (2.2%) |
| 75 to 79 Years | 56 (0.5%) | 223 (1.9%) |
| 80 to 84 Years | 103 (1.0%) | 62 (0.5%) |
| 85 Years and over | 51 (0.5%) | 227 (1.9%) |
| Total | 10,176 (100.0%) | 11,650 (100.0%) |
Families and Households in Mount Pleasant
Median Family Size in Mount Pleasant
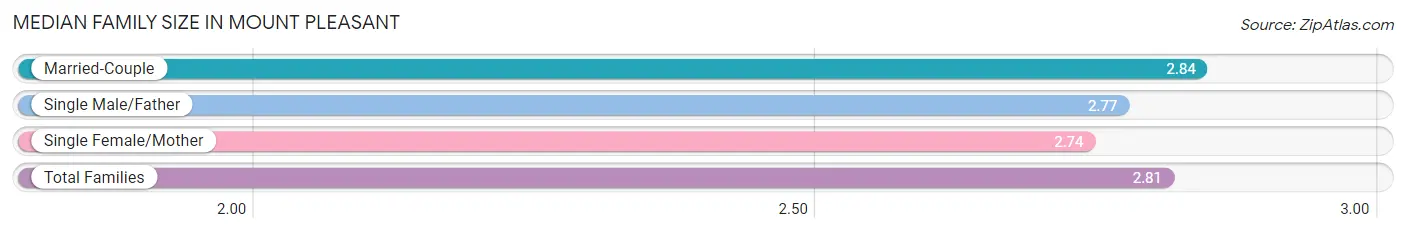
The median family size in Mount Pleasant is 2.81 persons per family, with married-couple families (1,929 | 64.9%) accounting for the largest median family size of 2.84 persons per family. On the other hand, single female/mother families (734 | 24.7%) represent the smallest median family size with 2.74 persons per family.
| Family Type | # Families | Family Size |
| Married-Couple | 1,929 (64.9%) | 2.84 |
| Single Male/Father | 307 (10.3%) | 2.77 |
| Single Female/Mother | 734 (24.7%) | 2.74 |
| Total Families | 2,970 (100.0%) | 2.81 |
Median Household Size in Mount Pleasant
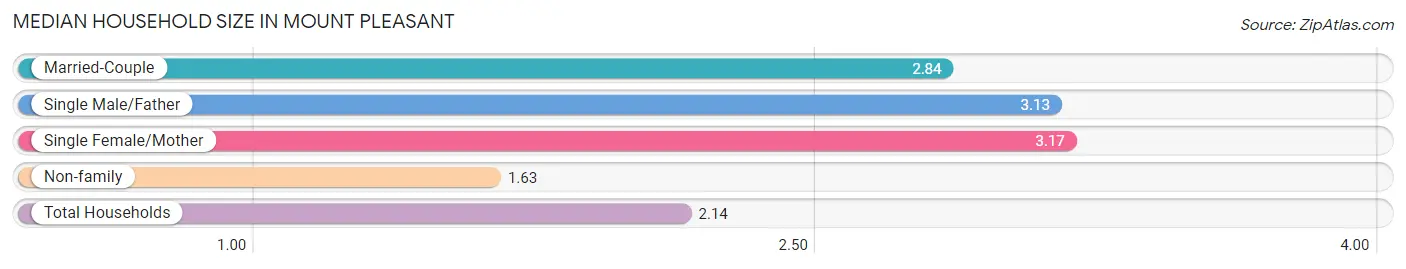
The median household size in Mount Pleasant is 2.14 persons per household, with single female/mother households (734 | 9.6%) accounting for the largest median household size of 3.17 persons per household. non-family households (4,695 | 61.3%) represent the smallest median household size with 1.63 persons per household.
| Household Type | # Households | Household Size |
| Married-Couple | 1,929 (25.2%) | 2.84 |
| Single Male/Father | 307 (4.0%) | 3.13 |
| Single Female/Mother | 734 (9.6%) | 3.17 |
| Non-family | 4,695 (61.3%) | 1.63 |
| Total Households | 7,665 (100.0%) | 2.14 |
Household Size by Marriage Status in Mount Pleasant
Out of a total of 7,665 households in Mount Pleasant, 2,970 (38.8%) are family households, while 4,695 (61.3%) are nonfamily households. The most numerous type of family households are 2-person households, comprising 1,366, and the most common type of nonfamily households are 1-person households, comprising 2,894.
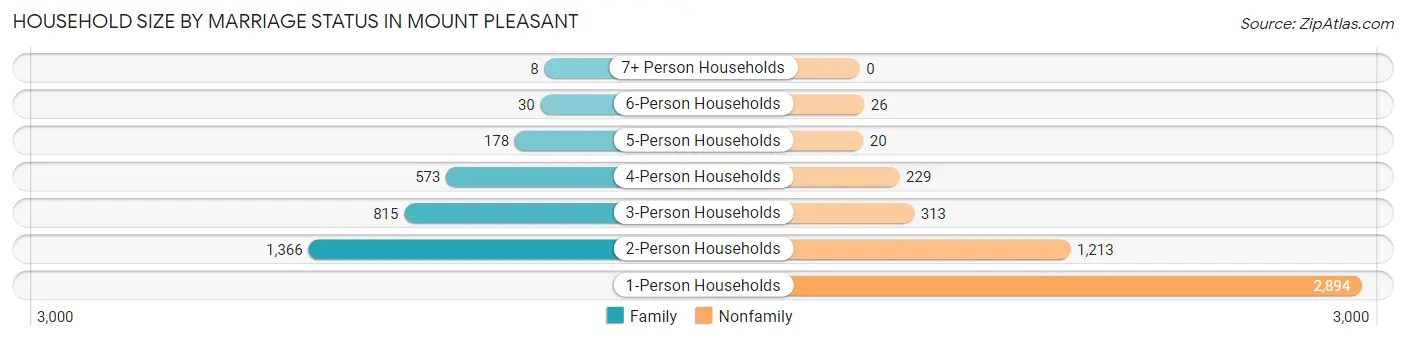
| Household Size | Family Households | Nonfamily Households |
| 1-Person Households | - | 2,894 (37.8%) |
| 2-Person Households | 1,366 (17.8%) | 1,213 (15.8%) |
| 3-Person Households | 815 (10.6%) | 313 (4.1%) |
| 4-Person Households | 573 (7.5%) | 229 (3.0%) |
| 5-Person Households | 178 (2.3%) | 20 (0.3%) |
| 6-Person Households | 30 (0.4%) | 26 (0.3%) |
| 7+ Person Households | 8 (0.1%) | 0 (0.0%) |
| Total | 2,970 (38.8%) | 4,695 (61.3%) |
Female Fertility in Mount Pleasant
Fertility by Age in Mount Pleasant
Average fertility rate in Mount Pleasant is 25.0 births per 1,000 women. Women in the age bracket of 20 to 34 years have the highest fertility rate with 34.0 births per 1,000 women. Women in the age bracket of 20 to 34 years acount for 68.4% of all women with births.
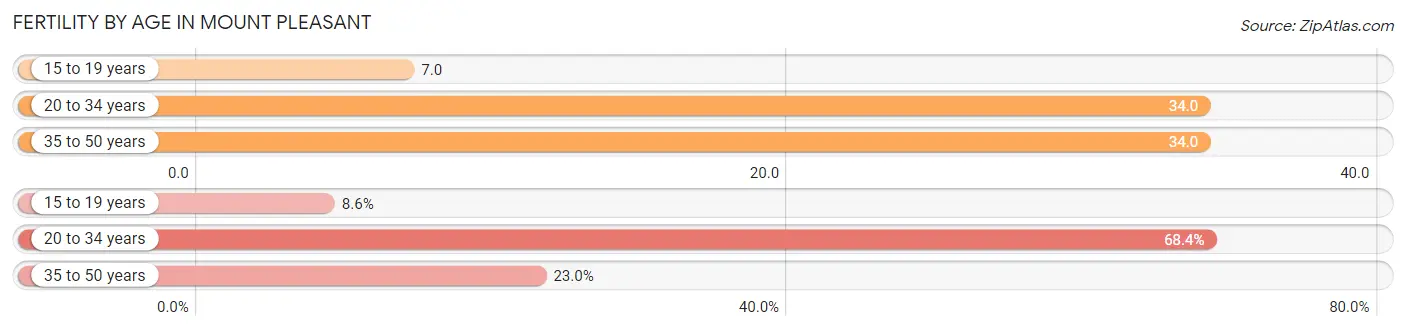
| Age Bracket | Women with Births | Births / 1,000 Women |
| 15 to 19 years | 18 (8.6%) | 7.0 |
| 20 to 34 years | 143 (68.4%) | 34.0 |
| 35 to 50 years | 48 (23.0%) | 34.0 |
| Total | 209 (100.0%) | 25.0 |
Fertility by Age by Marriage Status in Mount Pleasant
62.2% of women with births (209) in Mount Pleasant are married. The highest percentage of unmarried women with births falls into 15 to 19 years age bracket with 100.0% of them unmarried at the time of birth, while the lowest percentage of unmarried women with births belong to 35 to 50 years age bracket with 27.1% of them unmarried.
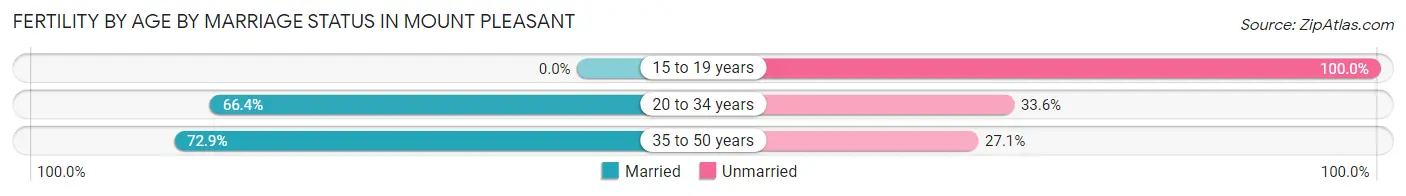
| Age Bracket | Married | Unmarried |
| 15 to 19 years | 0 (0.0%) | 18 (100.0%) |
| 20 to 34 years | 95 (66.4%) | 48 (33.6%) |
| 35 to 50 years | 35 (72.9%) | 13 (27.1%) |
| Total | 130 (62.2%) | 79 (37.8%) |
Fertility by Education in Mount Pleasant
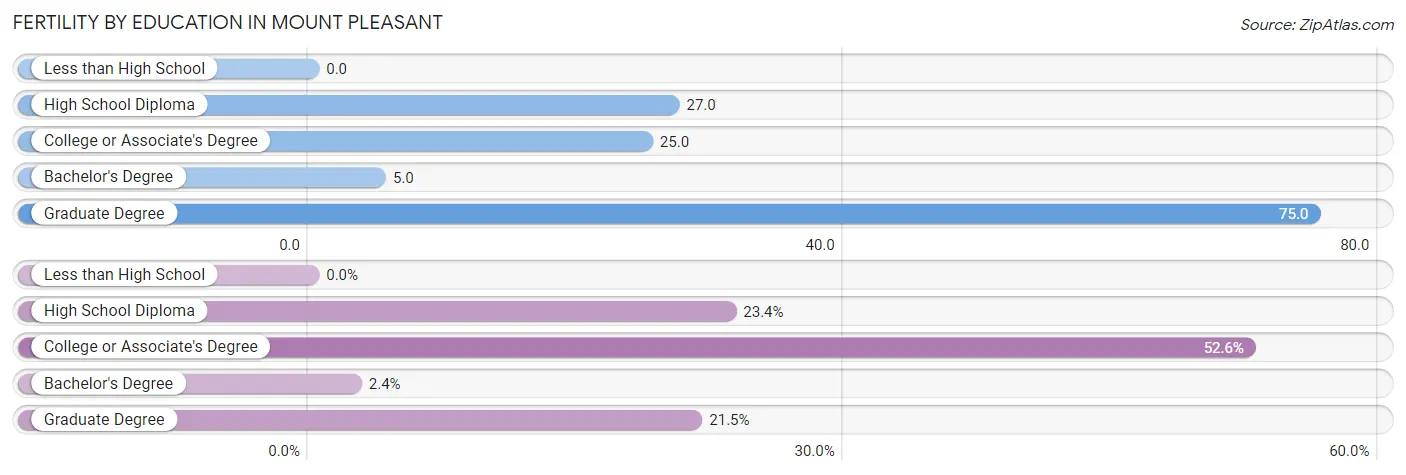
| Educational Attainment | Women with Births | Births / 1,000 Women |
| Less than High School | 0 (0.0%) | 0.0 |
| High School Diploma | 49 (23.4%) | 27.0 |
| College or Associate's Degree | 110 (52.6%) | 25.0 |
| Bachelor's Degree | 5 (2.4%) | 5.0 |
| Graduate Degree | 45 (21.5%) | 75.0 |
| Total | 209 (100.0%) | 25.0 |
Fertility by Education by Marriage Status in Mount Pleasant
37.8% of women with births in Mount Pleasant are unmarried. Women with the educational attainment of bachelor's degree are most likely to be married with 100.0% of them married at childbirth, while women with the educational attainment of college or associate's degree are least likely to be married with 55.4% of them unmarried at childbirth.
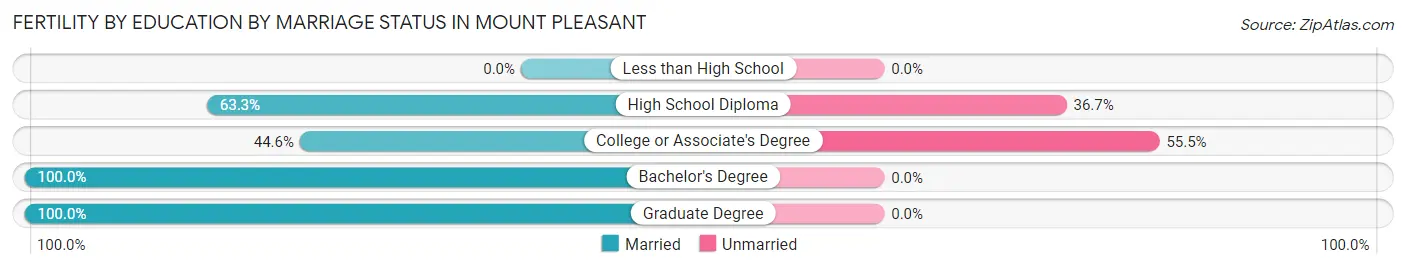
| Educational Attainment | Married | Unmarried |
| Less than High School | 0 (0.0%) | 0 (0.0%) |
| High School Diploma | 31 (63.3%) | 18 (36.7%) |
| College or Associate's Degree | 49 (44.6%) | 61 (55.4%) |
| Bachelor's Degree | 5 (100.0%) | 0 (0.0%) |
| Graduate Degree | 45 (100.0%) | 0 (0.0%) |
| Total | 130 (62.2%) | 79 (37.8%) |
Employment Characteristics in Mount Pleasant
Employment by Class of Employer in Mount Pleasant
Among the 10,497 employed individuals in Mount Pleasant, private company employees (6,510 | 62.0%), state government employees (1,374 | 13.1%), and not-for-profit organizations (1,219 | 11.6%) make up the most common classes of employment.
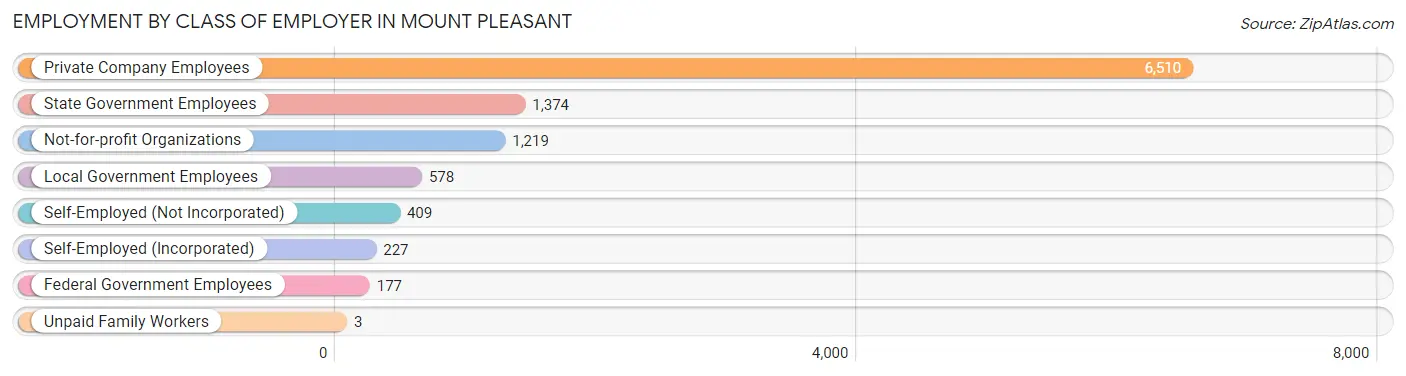
| Employer Class | # Employees | % Employees |
| Private Company Employees | 6,510 | 62.0% |
| Self-Employed (Incorporated) | 227 | 2.2% |
| Self-Employed (Not Incorporated) | 409 | 3.9% |
| Not-for-profit Organizations | 1,219 | 11.6% |
| Local Government Employees | 578 | 5.5% |
| State Government Employees | 1,374 | 13.1% |
| Federal Government Employees | 177 | 1.7% |
| Unpaid Family Workers | 3 | 0.0% |
| Total | 10,497 | 100.0% |
Employment Status by Age in Mount Pleasant
According to the labor force statistics for Mount Pleasant, out of the total population over 16 years of age (19,549), 61.6% or 12,042 individuals are in the labor force, with 9.5% or 1,144 of them unemployed. The age group with the highest labor force participation rate is 25 to 29 years, with 84.7% or 1,440 individuals in the labor force. Within the labor force, the 16 to 19 years age range has the highest percentage of unemployed individuals, with 15.7% or 316 of them being unemployed.
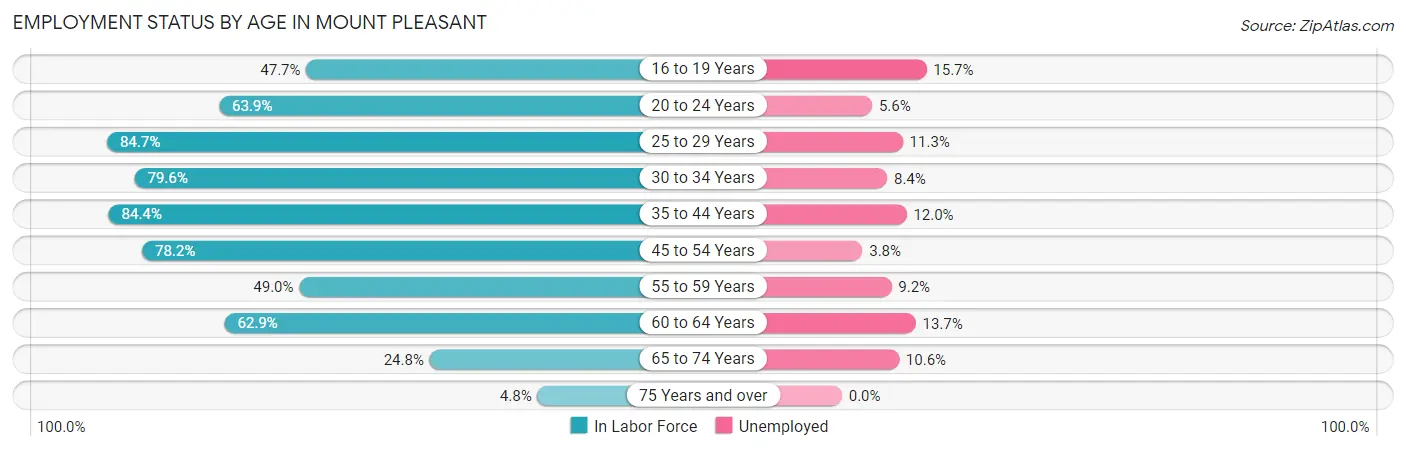
| Age Bracket | In Labor Force | Unemployed |
| 16 to 19 Years | 2,014 (47.7%) | 316 (15.7%) |
| 20 to 24 Years | 3,641 (63.9%) | 204 (5.6%) |
| 25 to 29 Years | 1,440 (84.7%) | 163 (11.3%) |
| 30 to 34 Years | 931 (79.6%) | 78 (8.4%) |
| 35 to 44 Years | 1,830 (84.4%) | 220 (12.0%) |
| 45 to 54 Years | 1,151 (78.2%) | 44 (3.8%) |
| 55 to 59 Years | 305 (49.0%) | 28 (9.2%) |
| 60 to 64 Years | 424 (62.9%) | 58 (13.7%) |
| 65 to 74 Years | 273 (24.8%) | 29 (10.6%) |
| 75 Years and over | 35 (4.8%) | 0 (0.0%) |
| Total | 12,042 (61.6%) | 1,144 (9.5%) |
Employment Status by Educational Attainment in Mount Pleasant
According to labor force statistics for Mount Pleasant, 77.9% of individuals (6,081) out of the total population between 25 and 64 years of age (7,806) are in the labor force, with 9.7% or 590 of them being unemployed. The group with the highest labor force participation rate are those with the educational attainment of bachelor's degree or higher, with 85.0% or 2,952 individuals in the labor force. Within the labor force, individuals with less than high school education have the highest percentage of unemployment, with 33.4% or 101 of them being unemployed.
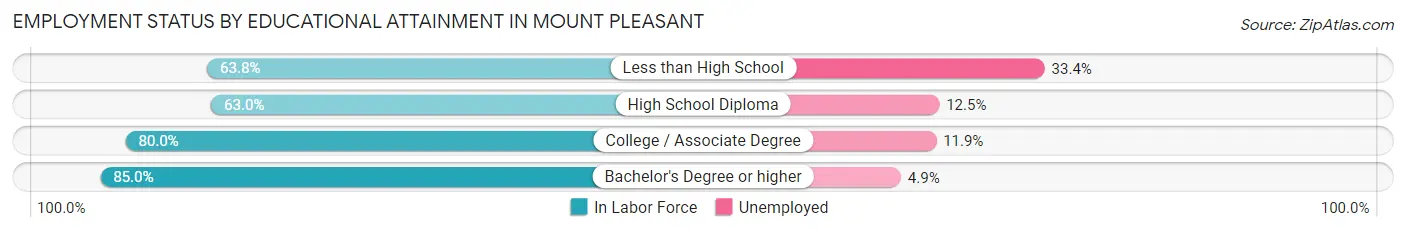
| Educational Attainment | In Labor Force | Unemployed |
| Less than High School | 302 (63.8%) | 158 (33.4%) |
| High School Diploma | 975 (63.0%) | 193 (12.5%) |
| College / Associate Degree | 1,850 (80.0%) | 275 (11.9%) |
| Bachelor's Degree or higher | 2,952 (85.0%) | 170 (4.9%) |
| Total | 6,081 (77.9%) | 757 (9.7%) |
Employment Occupations by Sex in Mount Pleasant
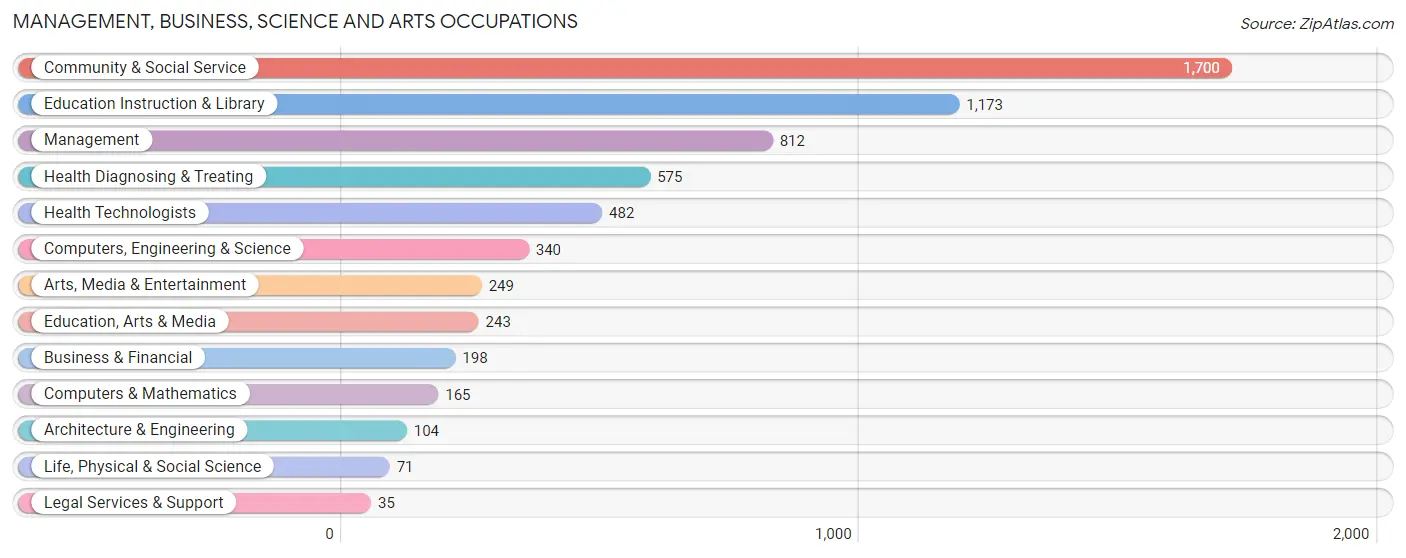
Management, Business, Science and Arts Occupations
The most common Management, Business, Science and Arts occupations in Mount Pleasant are Community & Social Service (1,700 | 15.6%), Education Instruction & Library (1,173 | 10.8%), Management (812 | 7.5%), Health Diagnosing & Treating (575 | 5.3%), and Health Technologists (482 | 4.4%).
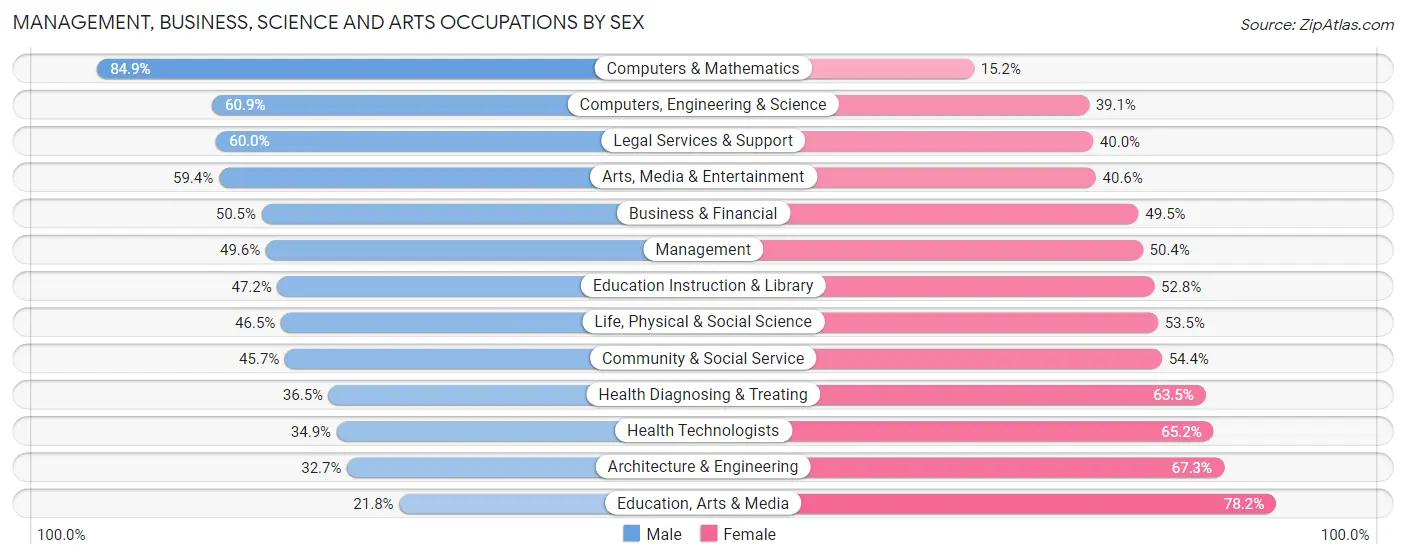
Management, Business, Science and Arts Occupations by Sex
Within the Management, Business, Science and Arts occupations in Mount Pleasant, the most male-oriented occupations are Computers & Mathematics (84.9%), Computers, Engineering & Science (60.9%), and Legal Services & Support (60.0%), while the most female-oriented occupations are Education, Arts & Media (78.2%), Architecture & Engineering (67.3%), and Health Technologists (65.1%).
| Occupation | Male | Female |
| Management | 403 (49.6%) | 409 (50.4%) |
| Business & Financial | 100 (50.5%) | 98 (49.5%) |
| Computers, Engineering & Science | 207 (60.9%) | 133 (39.1%) |
| Computers & Mathematics | 140 (84.9%) | 25 (15.1%) |
| Architecture & Engineering | 34 (32.7%) | 70 (67.3%) |
| Life, Physical & Social Science | 33 (46.5%) | 38 (53.5%) |
| Community & Social Service | 776 (45.7%) | 924 (54.3%) |
| Education, Arts & Media | 53 (21.8%) | 190 (78.2%) |
| Legal Services & Support | 21 (60.0%) | 14 (40.0%) |
| Education Instruction & Library | 554 (47.2%) | 619 (52.8%) |
| Arts, Media & Entertainment | 148 (59.4%) | 101 (40.6%) |
| Health Diagnosing & Treating | 210 (36.5%) | 365 (63.5%) |
| Health Technologists | 168 (34.8%) | 314 (65.1%) |
| Total (Category) | 1,696 (46.8%) | 1,929 (53.2%) |
| Total (Overall) | 5,372 (49.4%) | 5,512 (50.6%) |
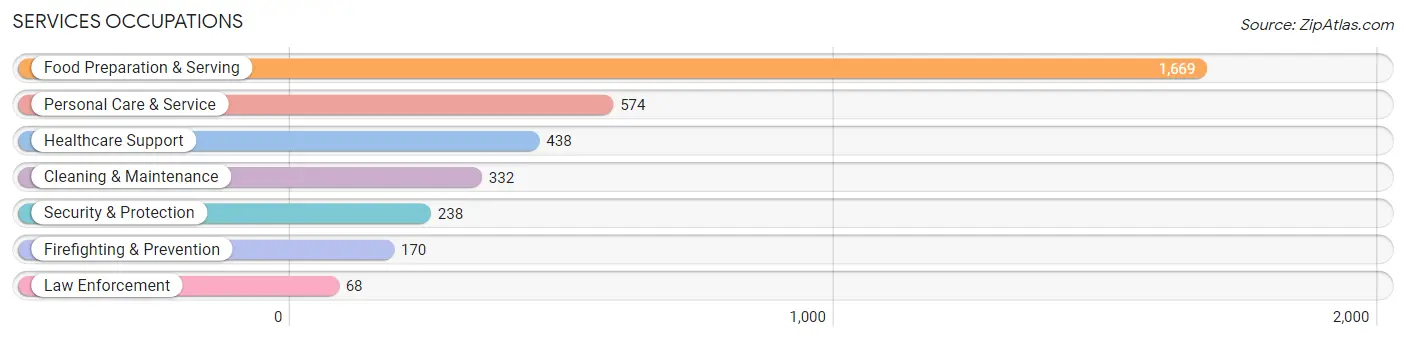
Services Occupations
The most common Services occupations in Mount Pleasant are Food Preparation & Serving (1,669 | 15.3%), Personal Care & Service (574 | 5.3%), Healthcare Support (438 | 4.0%), Cleaning & Maintenance (332 | 3.0%), and Security & Protection (238 | 2.2%).
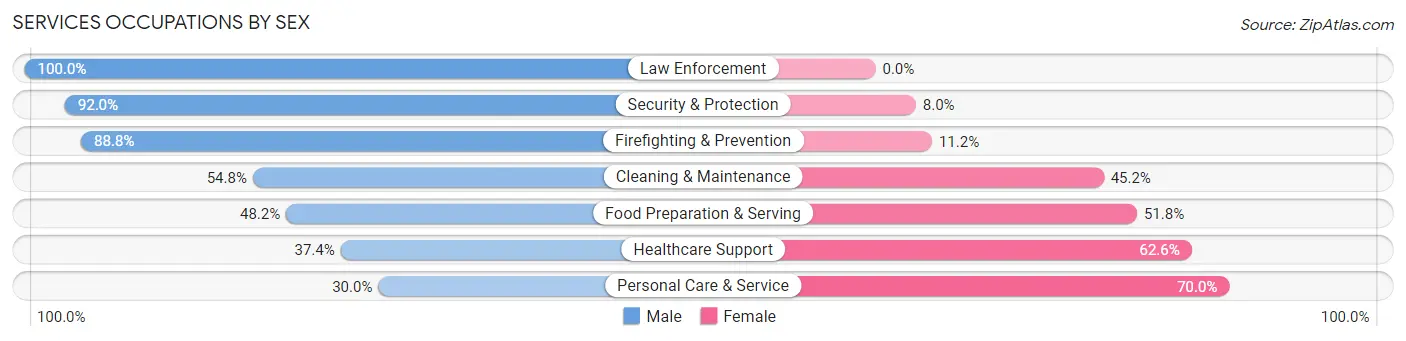
Services Occupations by Sex
Within the Services occupations in Mount Pleasant, the most male-oriented occupations are Law Enforcement (100.0%), Security & Protection (92.0%), and Firefighting & Prevention (88.8%), while the most female-oriented occupations are Personal Care & Service (70.0%), Healthcare Support (62.6%), and Food Preparation & Serving (51.8%).
| Occupation | Male | Female |
| Healthcare Support | 164 (37.4%) | 274 (62.6%) |
| Security & Protection | 219 (92.0%) | 19 (8.0%) |
| Firefighting & Prevention | 151 (88.8%) | 19 (11.2%) |
| Law Enforcement | 68 (100.0%) | 0 (0.0%) |
| Food Preparation & Serving | 805 (48.2%) | 864 (51.8%) |
| Cleaning & Maintenance | 182 (54.8%) | 150 (45.2%) |
| Personal Care & Service | 172 (30.0%) | 402 (70.0%) |
| Total (Category) | 1,542 (47.4%) | 1,709 (52.6%) |
| Total (Overall) | 5,372 (49.4%) | 5,512 (50.6%) |
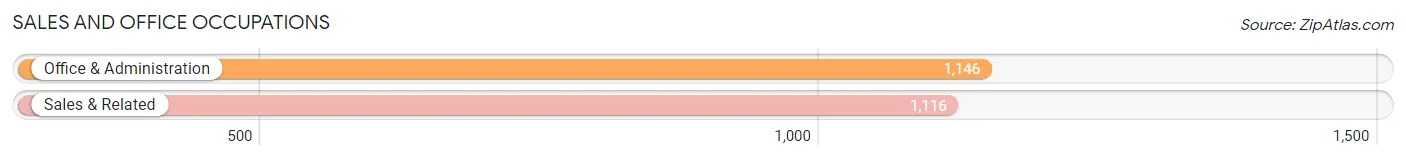
Sales and Office Occupations
The most common Sales and Office occupations in Mount Pleasant are Office & Administration (1,146 | 10.5%), and Sales & Related (1,116 | 10.2%).
Sales and Office Occupations by Sex
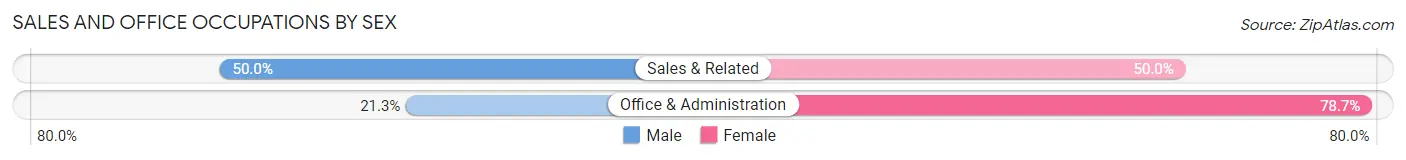
| Occupation | Male | Female |
| Sales & Related | 558 (50.0%) | 558 (50.0%) |
| Office & Administration | 244 (21.3%) | 902 (78.7%) |
| Total (Category) | 802 (35.5%) | 1,460 (64.5%) |
| Total (Overall) | 5,372 (49.4%) | 5,512 (50.6%) |
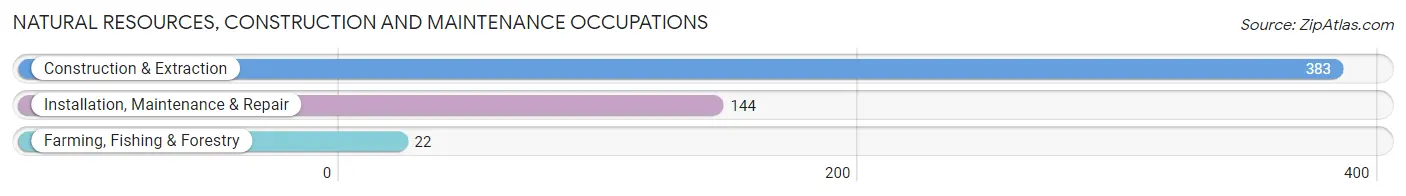
Natural Resources, Construction and Maintenance Occupations
The most common Natural Resources, Construction and Maintenance occupations in Mount Pleasant are Construction & Extraction (383 | 3.5%), Installation, Maintenance & Repair (144 | 1.3%), and Farming, Fishing & Forestry (22 | 0.2%).
Natural Resources, Construction and Maintenance Occupations by Sex
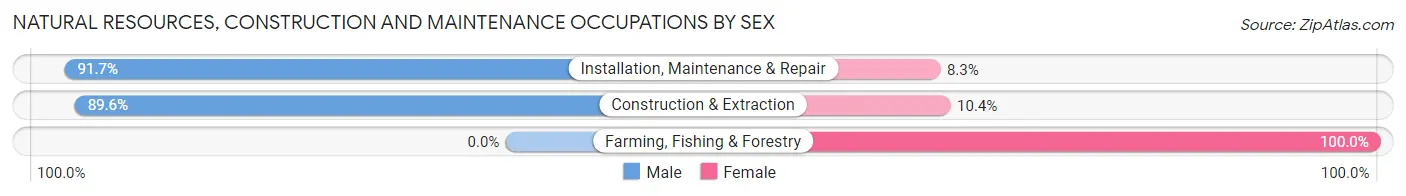
| Occupation | Male | Female |
| Farming, Fishing & Forestry | 0 (0.0%) | 22 (100.0%) |
| Construction & Extraction | 343 (89.6%) | 40 (10.4%) |
| Installation, Maintenance & Repair | 132 (91.7%) | 12 (8.3%) |
| Total (Category) | 475 (86.5%) | 74 (13.5%) |
| Total (Overall) | 5,372 (49.4%) | 5,512 (50.6%) |
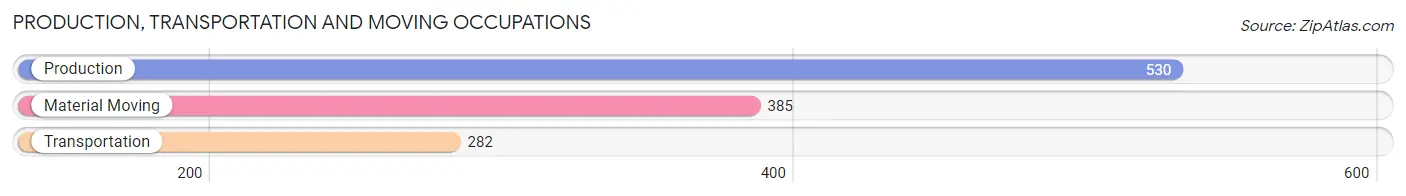
Production, Transportation and Moving Occupations
The most common Production, Transportation and Moving occupations in Mount Pleasant are Production (530 | 4.9%), Material Moving (385 | 3.5%), and Transportation (282 | 2.6%).
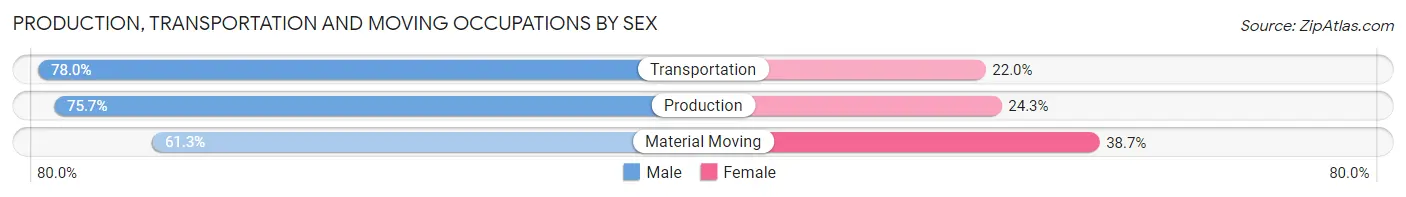
Production, Transportation and Moving Occupations by Sex
| Occupation | Male | Female |
| Production | 401 (75.7%) | 129 (24.3%) |
| Transportation | 220 (78.0%) | 62 (22.0%) |
| Material Moving | 236 (61.3%) | 149 (38.7%) |
| Total (Category) | 857 (71.6%) | 340 (28.4%) |
| Total (Overall) | 5,372 (49.4%) | 5,512 (50.6%) |
Employment Industries by Sex in Mount Pleasant
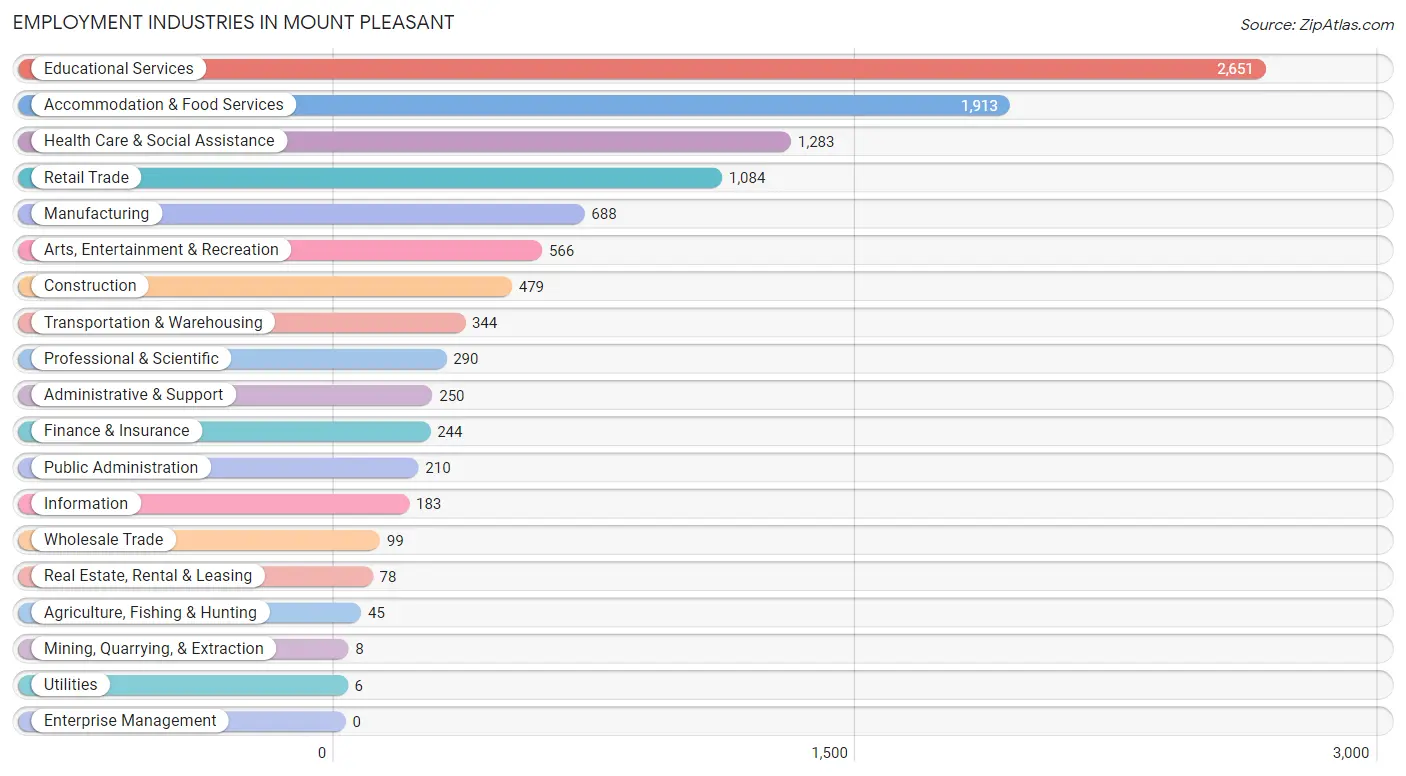
Employment Industries in Mount Pleasant
The major employment industries in Mount Pleasant include Educational Services (2,651 | 24.4%), Accommodation & Food Services (1,913 | 17.6%), Health Care & Social Assistance (1,283 | 11.8%), Retail Trade (1,084 | 10.0%), and Manufacturing (688 | 6.3%).
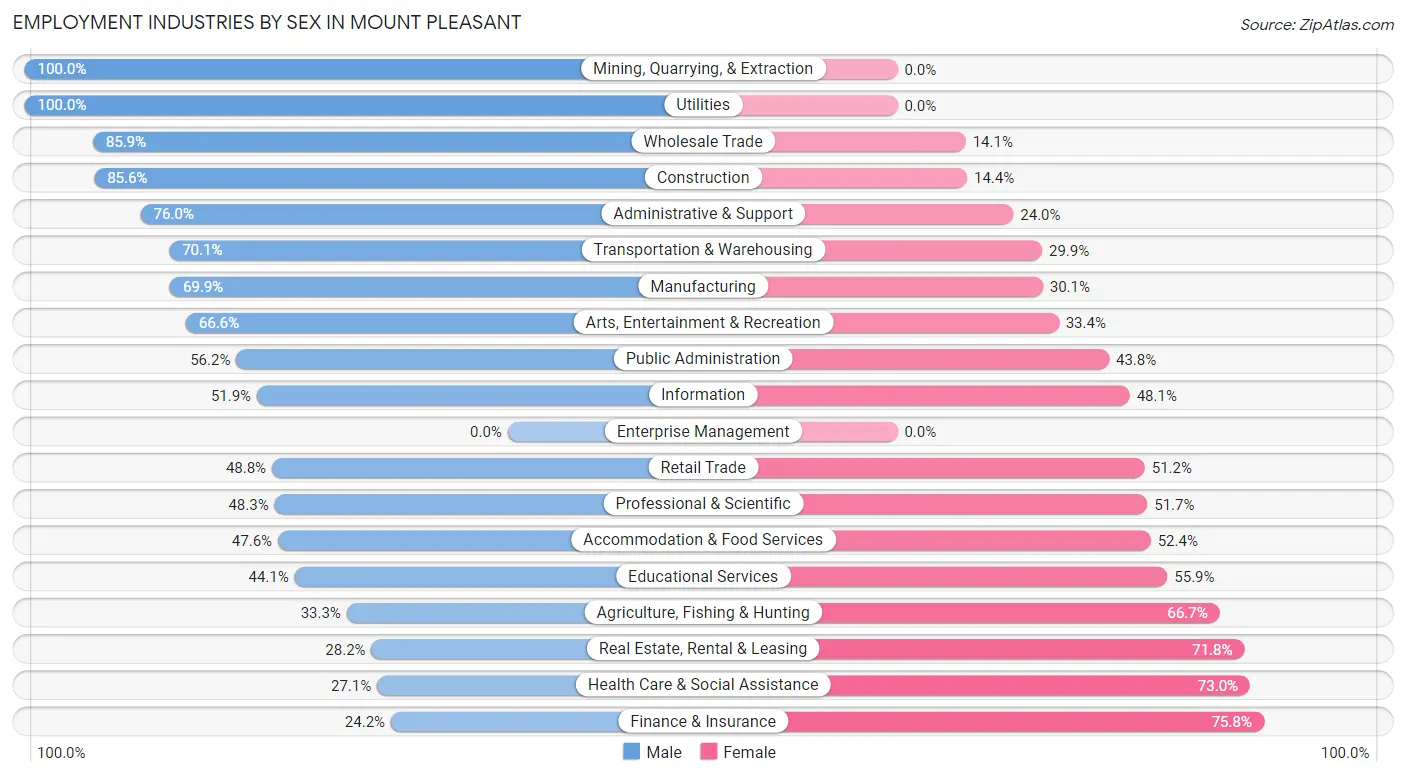
Employment Industries by Sex in Mount Pleasant
The Mount Pleasant industries that see more men than women are Mining, Quarrying, & Extraction (100.0%), Utilities (100.0%), and Wholesale Trade (85.9%), whereas the industries that tend to have a higher number of women are Finance & Insurance (75.8%), Health Care & Social Assistance (73.0%), and Real Estate, Rental & Leasing (71.8%).
| Industry | Male | Female |
| Agriculture, Fishing & Hunting | 15 (33.3%) | 30 (66.7%) |
| Mining, Quarrying, & Extraction | 8 (100.0%) | 0 (0.0%) |
| Construction | 410 (85.6%) | 69 (14.4%) |
| Manufacturing | 481 (69.9%) | 207 (30.1%) |
| Wholesale Trade | 85 (85.9%) | 14 (14.1%) |
| Retail Trade | 529 (48.8%) | 555 (51.2%) |
| Transportation & Warehousing | 241 (70.1%) | 103 (29.9%) |
| Utilities | 6 (100.0%) | 0 (0.0%) |
| Information | 95 (51.9%) | 88 (48.1%) |
| Finance & Insurance | 59 (24.2%) | 185 (75.8%) |
| Real Estate, Rental & Leasing | 22 (28.2%) | 56 (71.8%) |
| Professional & Scientific | 140 (48.3%) | 150 (51.7%) |
| Enterprise Management | 0 (0.0%) | 0 (0.0%) |
| Administrative & Support | 190 (76.0%) | 60 (24.0%) |
| Educational Services | 1,170 (44.1%) | 1,481 (55.9%) |
| Health Care & Social Assistance | 347 (27.1%) | 936 (73.0%) |
| Arts, Entertainment & Recreation | 377 (66.6%) | 189 (33.4%) |
| Accommodation & Food Services | 910 (47.6%) | 1,003 (52.4%) |
| Public Administration | 118 (56.2%) | 92 (43.8%) |
| Total | 5,372 (49.4%) | 5,512 (50.6%) |
Education in Mount Pleasant
School Enrollment in Mount Pleasant
The most common levels of schooling among the 10,676 students in Mount Pleasant are college / undergraduate (7,951 | 74.5%), graduate / professional (1,030 | 9.7%), and elementary school (484 | 4.5%).
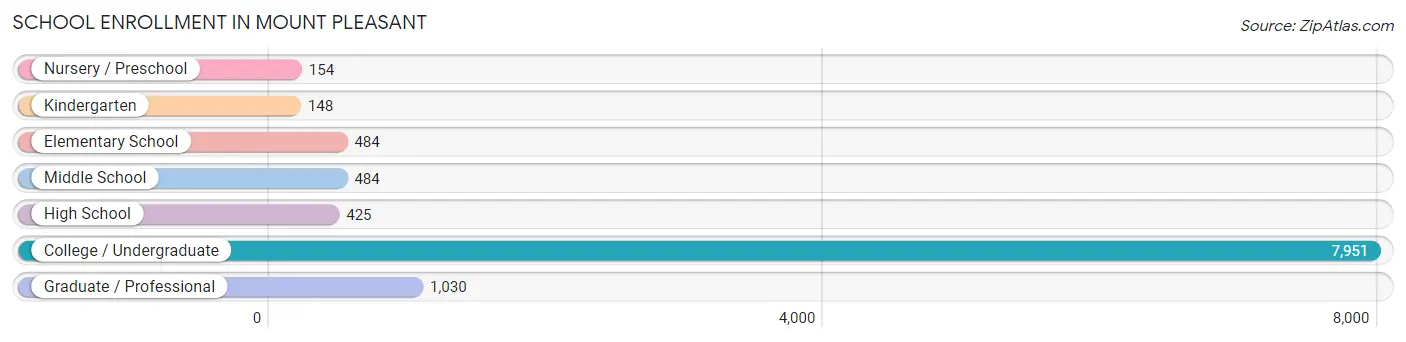
| School Level | # Students | % Students |
| Nursery / Preschool | 154 | 1.4% |
| Kindergarten | 148 | 1.4% |
| Elementary School | 484 | 4.5% |
| Middle School | 484 | 4.5% |
| High School | 425 | 4.0% |
| College / Undergraduate | 7,951 | 74.5% |
| Graduate / Professional | 1,030 | 9.7% |
| Total | 10,676 | 100.0% |
School Enrollment by Age by Funding Source in Mount Pleasant
Out of a total of 10,676 students who are enrolled in schools in Mount Pleasant, 907 (8.5%) attend a private institution, while the remaining 9,769 (91.5%) are enrolled in public schools. The age group of 3 to 4 year olds has the highest likelihood of being enrolled in private schools, with 46 (56.8% in the age bracket) enrolled. Conversely, the age group of 15 to 17 year olds has the lowest likelihood of being enrolled in a private school, with 358 (98.1% in the age bracket) attending a public institution.
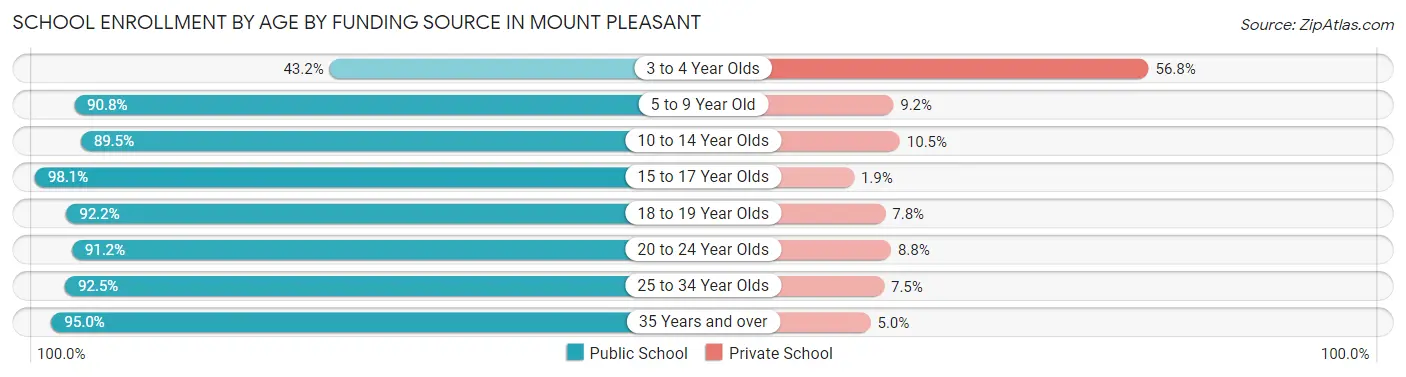
| Age Bracket | Public School | Private School |
| 3 to 4 Year Olds | 35 (43.2%) | 46 (56.8%) |
| 5 to 9 Year Old | 619 (90.8%) | 63 (9.2%) |
| 10 to 14 Year Olds | 513 (89.5%) | 60 (10.5%) |
| 15 to 17 Year Olds | 358 (98.1%) | 7 (1.9%) |
| 18 to 19 Year Olds | 3,504 (92.2%) | 295 (7.8%) |
| 20 to 24 Year Olds | 3,925 (91.2%) | 379 (8.8%) |
| 25 to 34 Year Olds | 529 (92.5%) | 43 (7.5%) |
| 35 Years and over | 285 (95.0%) | 15 (5.0%) |
| Total | 9,769 (91.5%) | 907 (8.5%) |
Educational Attainment by Field of Study in Mount Pleasant
Education (708 | 14.6%), business (626 | 12.9%), arts & humanities (529 | 10.9%), social sciences (489 | 10.1%), and science & technology (466 | 9.6%) are the most common fields of study among 4,852 individuals in Mount Pleasant who have obtained a bachelor's degree or higher.
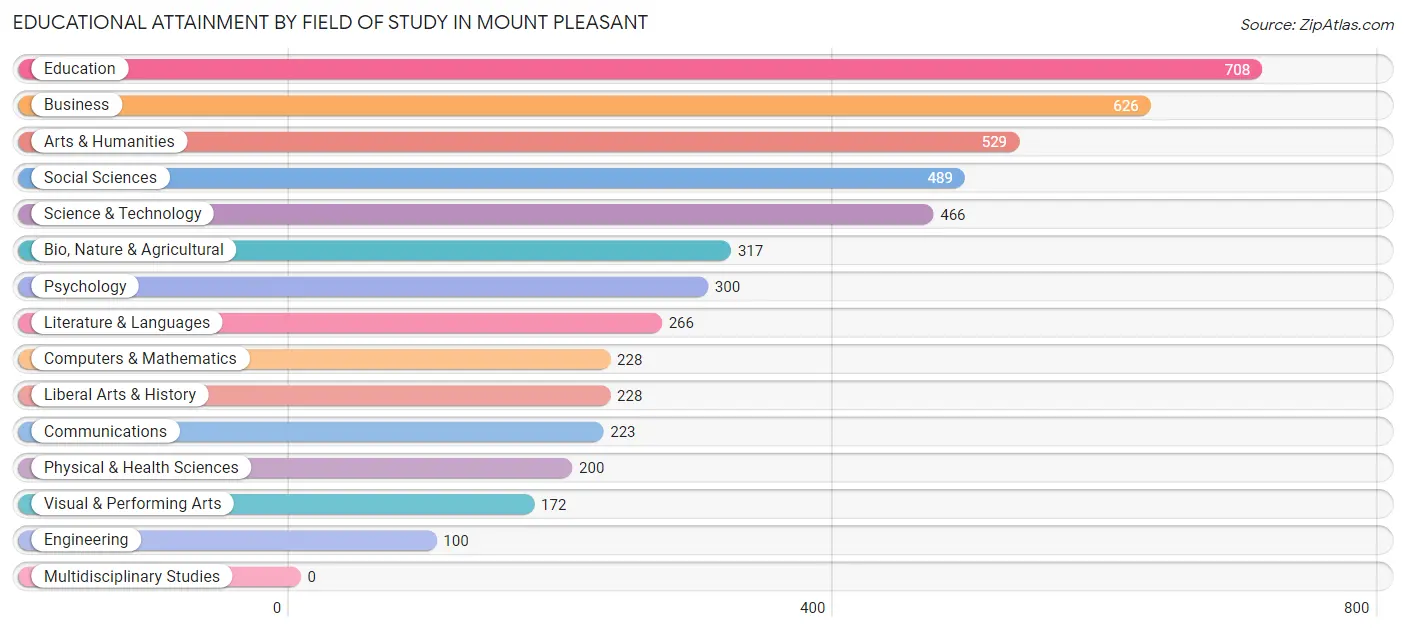
| Field of Study | # Graduates | % Graduates |
| Computers & Mathematics | 228 | 4.7% |
| Bio, Nature & Agricultural | 317 | 6.5% |
| Physical & Health Sciences | 200 | 4.1% |
| Psychology | 300 | 6.2% |
| Social Sciences | 489 | 10.1% |
| Engineering | 100 | 2.1% |
| Multidisciplinary Studies | 0 | 0.0% |
| Science & Technology | 466 | 9.6% |
| Business | 626 | 12.9% |
| Education | 708 | 14.6% |
| Literature & Languages | 266 | 5.5% |
| Liberal Arts & History | 228 | 4.7% |
| Visual & Performing Arts | 172 | 3.5% |
| Communications | 223 | 4.6% |
| Arts & Humanities | 529 | 10.9% |
| Total | 4,852 | 100.0% |
Transportation & Commute in Mount Pleasant
Vehicle Availability by Sex in Mount Pleasant
The most prevalent vehicle ownership categories in Mount Pleasant are males with 2 vehicles (2,006, accounting for 44.3%) and females with 2 vehicles (1,988, making up 48.7%).
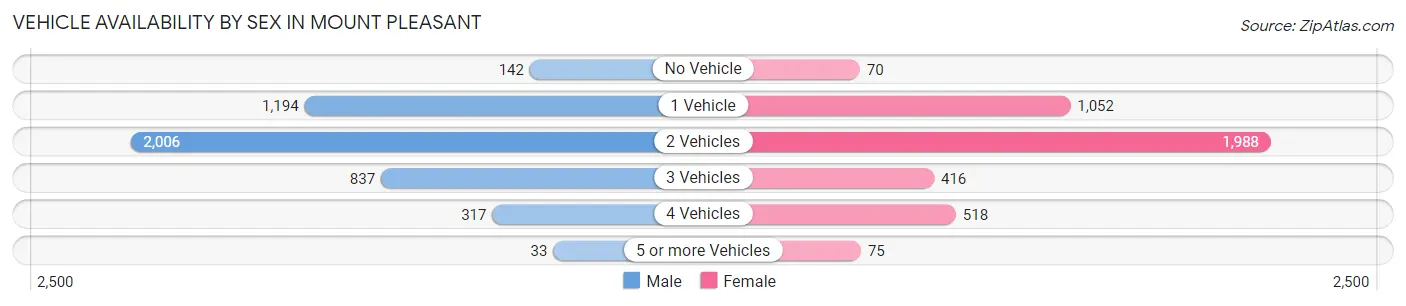
| Vehicles Available | Male | Female |
| No Vehicle | 142 (3.1%) | 70 (1.7%) |
| 1 Vehicle | 1,194 (26.4%) | 1,052 (25.5%) |
| 2 Vehicles | 2,006 (44.3%) | 1,988 (48.3%) |
| 3 Vehicles | 837 (18.5%) | 416 (10.1%) |
| 4 Vehicles | 317 (7.0%) | 518 (12.6%) |
| 5 or more Vehicles | 33 (0.7%) | 75 (1.8%) |
| Total | 4,529 (100.0%) | 4,119 (100.0%) |
Commute Time in Mount Pleasant
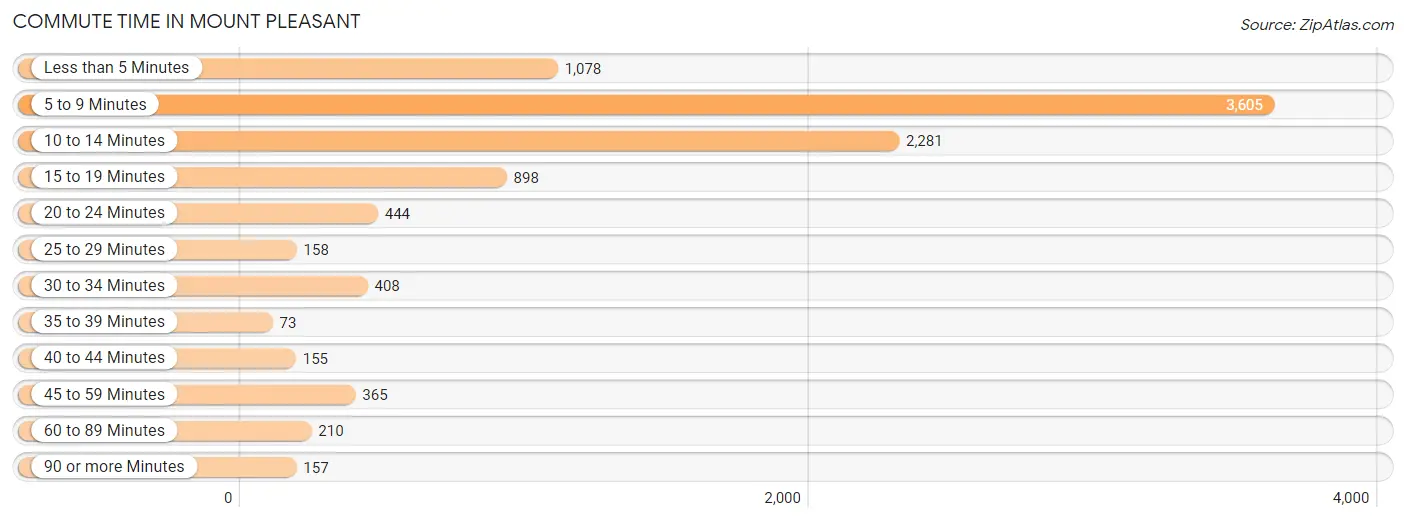
The most frequently occuring commute durations in Mount Pleasant are 5 to 9 minutes (3,605 commuters, 36.7%), 10 to 14 minutes (2,281 commuters, 23.2%), and less than 5 minutes (1,078 commuters, 11.0%).
| Commute Time | # Commuters | % Commuters |
| Less than 5 Minutes | 1,078 | 11.0% |
| 5 to 9 Minutes | 3,605 | 36.7% |
| 10 to 14 Minutes | 2,281 | 23.2% |
| 15 to 19 Minutes | 898 | 9.1% |
| 20 to 24 Minutes | 444 | 4.5% |
| 25 to 29 Minutes | 158 | 1.6% |
| 30 to 34 Minutes | 408 | 4.2% |
| 35 to 39 Minutes | 73 | 0.7% |
| 40 to 44 Minutes | 155 | 1.6% |
| 45 to 59 Minutes | 365 | 3.7% |
| 60 to 89 Minutes | 210 | 2.1% |
| 90 or more Minutes | 157 | 1.6% |
Commute Time by Sex in Mount Pleasant
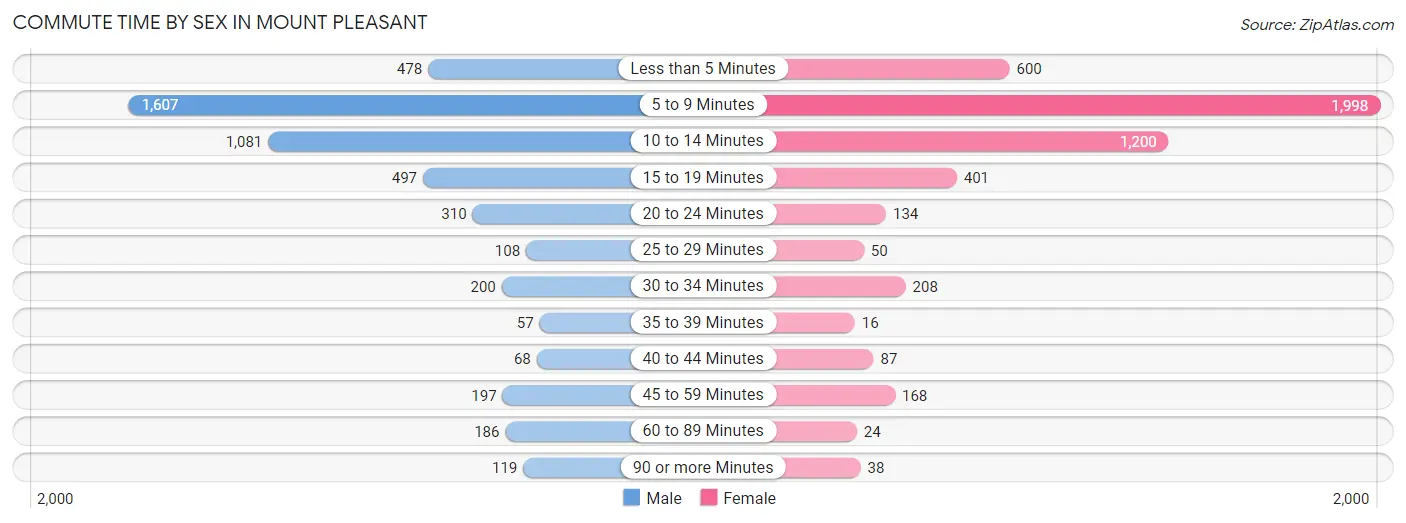
The most common commute times in Mount Pleasant are 5 to 9 minutes (1,607 commuters, 32.7%) for males and 5 to 9 minutes (1,998 commuters, 40.6%) for females.
| Commute Time | Male | Female |
| Less than 5 Minutes | 478 (9.7%) | 600 (12.2%) |
| 5 to 9 Minutes | 1,607 (32.7%) | 1,998 (40.6%) |
| 10 to 14 Minutes | 1,081 (22.0%) | 1,200 (24.4%) |
| 15 to 19 Minutes | 497 (10.1%) | 401 (8.1%) |
| 20 to 24 Minutes | 310 (6.3%) | 134 (2.7%) |
| 25 to 29 Minutes | 108 (2.2%) | 50 (1.0%) |
| 30 to 34 Minutes | 200 (4.1%) | 208 (4.2%) |
| 35 to 39 Minutes | 57 (1.2%) | 16 (0.3%) |
| 40 to 44 Minutes | 68 (1.4%) | 87 (1.8%) |
| 45 to 59 Minutes | 197 (4.0%) | 168 (3.4%) |
| 60 to 89 Minutes | 186 (3.8%) | 24 (0.5%) |
| 90 or more Minutes | 119 (2.4%) | 38 (0.8%) |
Time of Departure to Work by Sex in Mount Pleasant
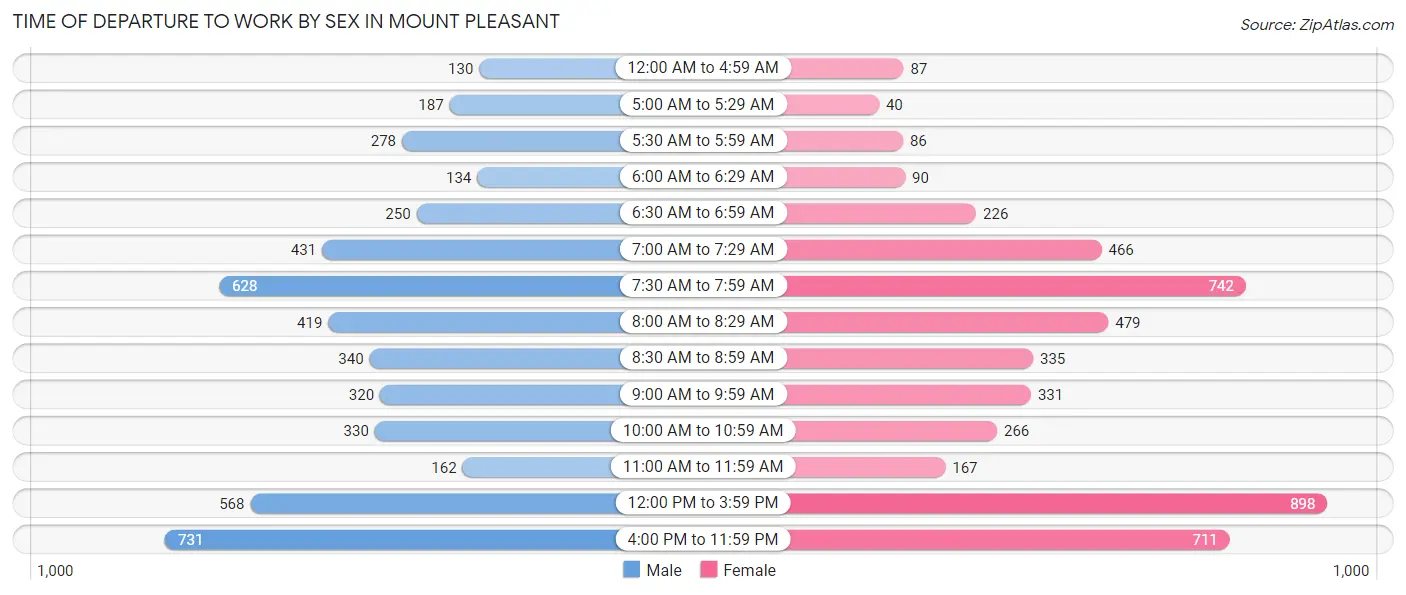
The most frequent times of departure to work in Mount Pleasant are 4:00 PM to 11:59 PM (731, 14.9%) for males and 12:00 PM to 3:59 PM (898, 18.2%) for females.
| Time of Departure | Male | Female |
| 12:00 AM to 4:59 AM | 130 (2.6%) | 87 (1.8%) |
| 5:00 AM to 5:29 AM | 187 (3.8%) | 40 (0.8%) |
| 5:30 AM to 5:59 AM | 278 (5.7%) | 86 (1.8%) |
| 6:00 AM to 6:29 AM | 134 (2.7%) | 90 (1.8%) |
| 6:30 AM to 6:59 AM | 250 (5.1%) | 226 (4.6%) |
| 7:00 AM to 7:29 AM | 431 (8.8%) | 466 (9.5%) |
| 7:30 AM to 7:59 AM | 628 (12.8%) | 742 (15.1%) |
| 8:00 AM to 8:29 AM | 419 (8.5%) | 479 (9.7%) |
| 8:30 AM to 8:59 AM | 340 (6.9%) | 335 (6.8%) |
| 9:00 AM to 9:59 AM | 320 (6.5%) | 331 (6.7%) |
| 10:00 AM to 10:59 AM | 330 (6.7%) | 266 (5.4%) |
| 11:00 AM to 11:59 AM | 162 (3.3%) | 167 (3.4%) |
| 12:00 PM to 3:59 PM | 568 (11.6%) | 898 (18.2%) |
| 4:00 PM to 11:59 PM | 731 (14.9%) | 711 (14.4%) |
| Total | 4,908 (100.0%) | 4,924 (100.0%) |
Housing Occupancy in Mount Pleasant
Occupancy by Ownership in Mount Pleasant
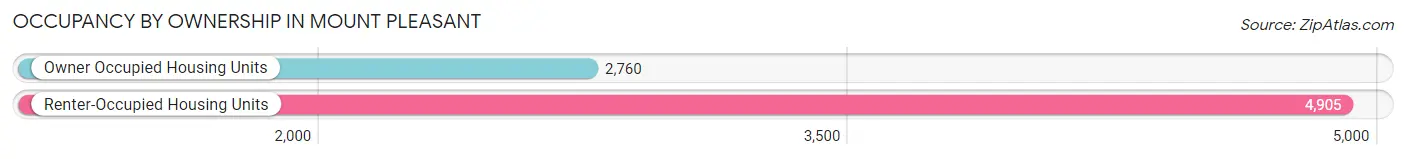
Of the total 7,665 dwellings in Mount Pleasant, owner-occupied units account for 2,760 (36.0%), while renter-occupied units make up 4,905 (64.0%).
| Occupancy | # Housing Units | % Housing Units |
| Owner Occupied Housing Units | 2,760 | 36.0% |
| Renter-Occupied Housing Units | 4,905 | 64.0% |
| Total Occupied Housing Units | 7,665 | 100.0% |
Occupancy by Household Size in Mount Pleasant
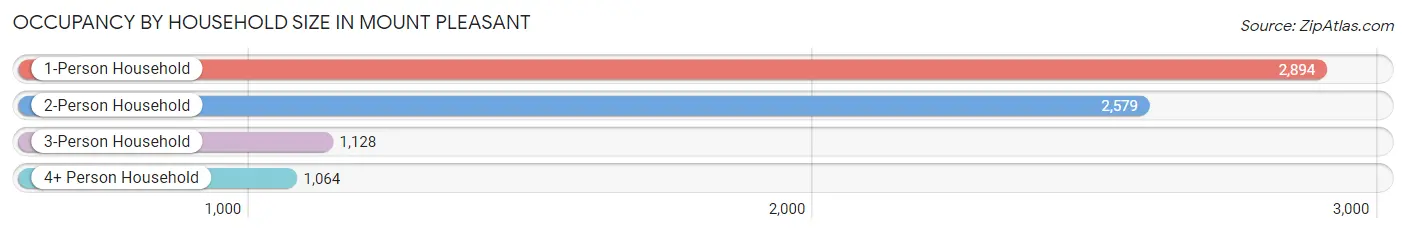
| Household Size | # Housing Units | % Housing Units |
| 1-Person Household | 2,894 | 37.8% |
| 2-Person Household | 2,579 | 33.7% |
| 3-Person Household | 1,128 | 14.7% |
| 4+ Person Household | 1,064 | 13.9% |
| Total Housing Units | 7,665 | 100.0% |
Occupancy by Ownership by Household Size in Mount Pleasant
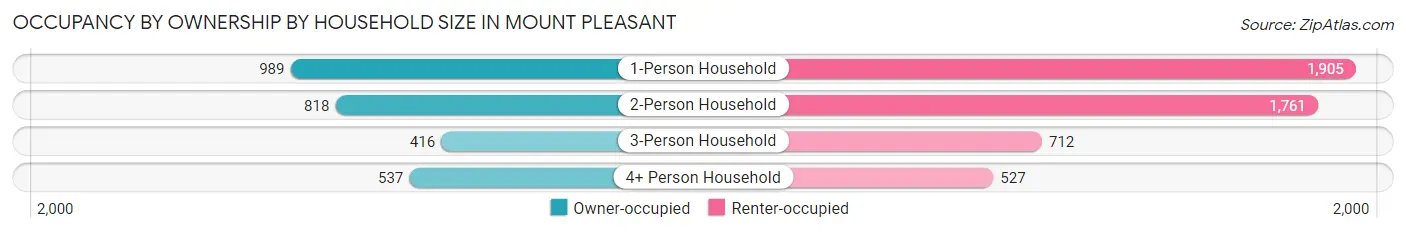
| Household Size | Owner-occupied | Renter-occupied |
| 1-Person Household | 989 (34.2%) | 1,905 (65.8%) |
| 2-Person Household | 818 (31.7%) | 1,761 (68.3%) |
| 3-Person Household | 416 (36.9%) | 712 (63.1%) |
| 4+ Person Household | 537 (50.5%) | 527 (49.5%) |
| Total Housing Units | 2,760 (36.0%) | 4,905 (64.0%) |
Occupancy by Educational Attainment in Mount Pleasant
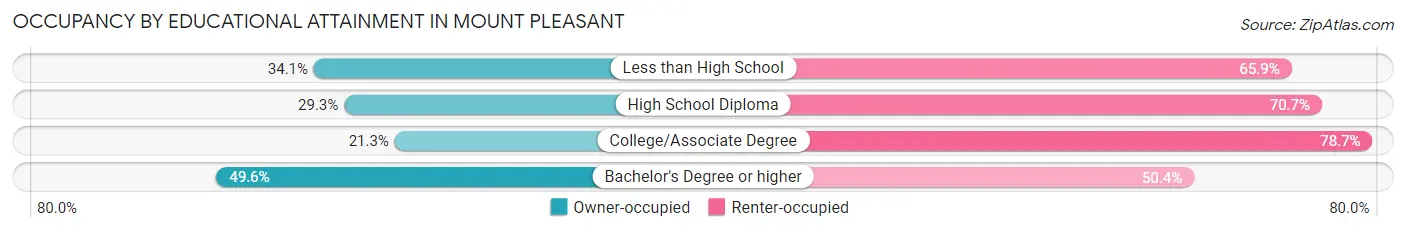
| Household Size | Owner-occupied | Renter-occupied |
| Less than High School | 115 (34.1%) | 222 (65.9%) |
| High School Diploma | 387 (29.3%) | 933 (70.7%) |
| College/Associate Degree | 543 (21.3%) | 2,006 (78.7%) |
| Bachelor's Degree or higher | 1,715 (49.6%) | 1,744 (50.4%) |
Occupancy by Age of Householder in Mount Pleasant
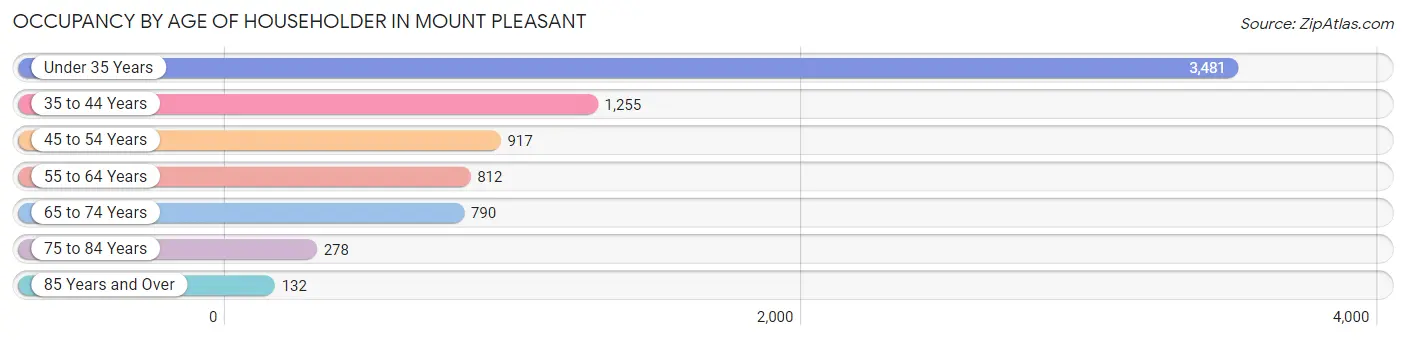
| Age Bracket | # Households | % Households |
| Under 35 Years | 3,481 | 45.4% |
| 35 to 44 Years | 1,255 | 16.4% |
| 45 to 54 Years | 917 | 12.0% |
| 55 to 64 Years | 812 | 10.6% |
| 65 to 74 Years | 790 | 10.3% |
| 75 to 84 Years | 278 | 3.6% |
| 85 Years and Over | 132 | 1.7% |
| Total | 7,665 | 100.0% |
Housing Finances in Mount Pleasant
Median Income by Occupancy in Mount Pleasant
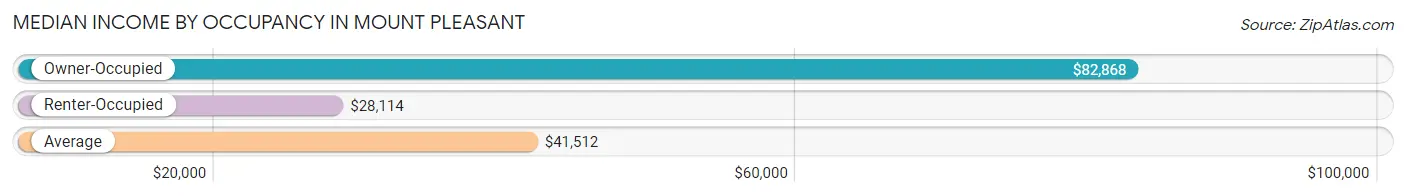
| Occupancy Type | # Households | Median Income |
| Owner-Occupied | 2,760 (36.0%) | $82,868 |
| Renter-Occupied | 4,905 (64.0%) | $28,114 |
| Average | 7,665 (100.0%) | $41,512 |
Occupancy by Householder Income Bracket in Mount Pleasant
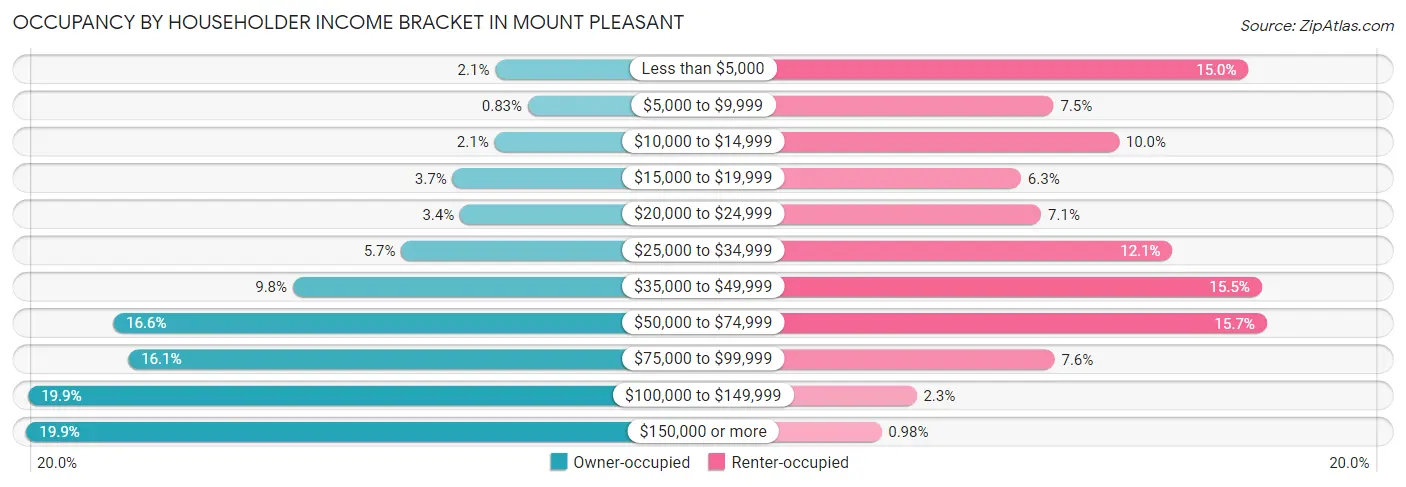
| Income Bracket | Owner-occupied | Renter-occupied |
| Less than $5,000 | 57 (2.1%) | 734 (15.0%) |
| $5,000 to $9,999 | 23 (0.8%) | 370 (7.5%) |
| $10,000 to $14,999 | 58 (2.1%) | 492 (10.0%) |
| $15,000 to $19,999 | 102 (3.7%) | 309 (6.3%) |
| $20,000 to $24,999 | 94 (3.4%) | 347 (7.1%) |
| $25,000 to $34,999 | 156 (5.7%) | 592 (12.1%) |
| $35,000 to $49,999 | 270 (9.8%) | 759 (15.5%) |
| $50,000 to $74,999 | 459 (16.6%) | 768 (15.7%) |
| $75,000 to $99,999 | 443 (16.1%) | 372 (7.6%) |
| $100,000 to $149,999 | 548 (19.9%) | 114 (2.3%) |
| $150,000 or more | 550 (19.9%) | 48 (1.0%) |
| Total | 2,760 (100.0%) | 4,905 (100.0%) |
Monthly Housing Cost Tiers in Mount Pleasant
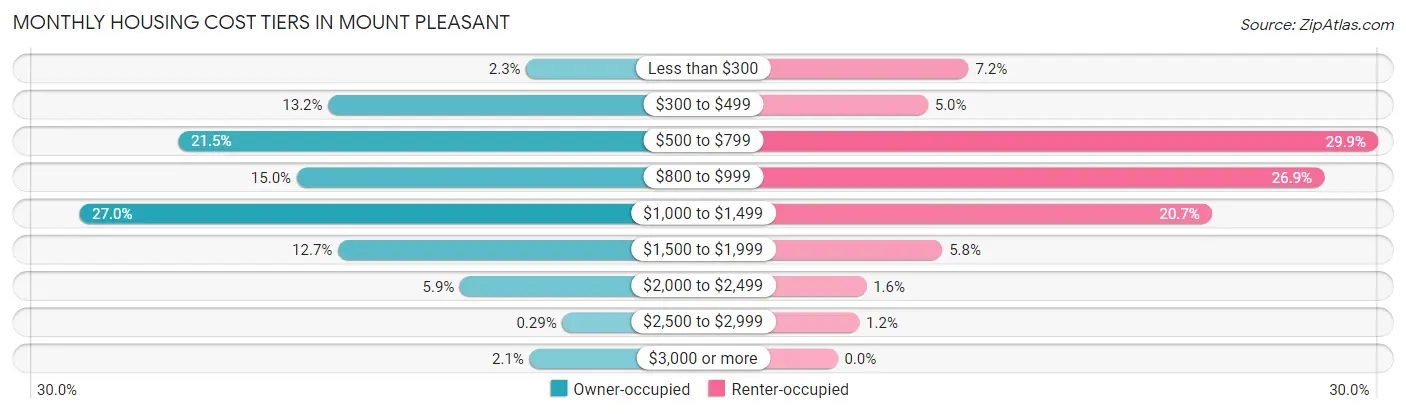
| Monthly Cost | Owner-occupied | Renter-occupied |
| Less than $300 | 63 (2.3%) | 355 (7.2%) |
| $300 to $499 | 365 (13.2%) | 245 (5.0%) |
| $500 to $799 | 594 (21.5%) | 1,464 (29.8%) |
| $800 to $999 | 413 (15.0%) | 1,318 (26.9%) |
| $1,000 to $1,499 | 745 (27.0%) | 1,014 (20.7%) |
| $1,500 to $1,999 | 350 (12.7%) | 284 (5.8%) |
| $2,000 to $2,499 | 164 (5.9%) | 78 (1.6%) |
| $2,500 to $2,999 | 8 (0.3%) | 59 (1.2%) |
| $3,000 or more | 58 (2.1%) | 0 (0.0%) |
| Total | 2,760 (100.0%) | 4,905 (100.0%) |
Physical Housing Characteristics in Mount Pleasant
Housing Structures in Mount Pleasant
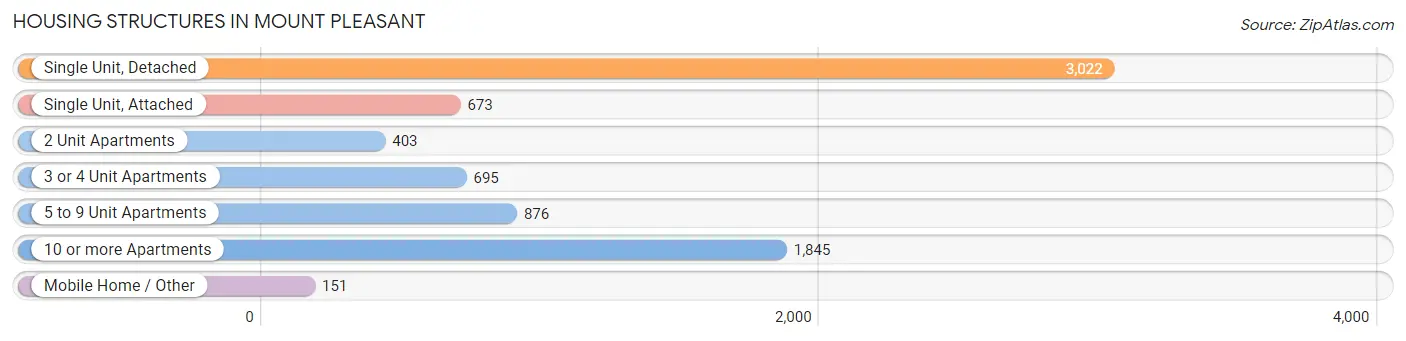
| Structure Type | # Housing Units | % Housing Units |
| Single Unit, Detached | 3,022 | 39.4% |
| Single Unit, Attached | 673 | 8.8% |
| 2 Unit Apartments | 403 | 5.3% |
| 3 or 4 Unit Apartments | 695 | 9.1% |
| 5 to 9 Unit Apartments | 876 | 11.4% |
| 10 or more Apartments | 1,845 | 24.1% |
| Mobile Home / Other | 151 | 2.0% |
| Total | 7,665 | 100.0% |
Housing Structures by Occupancy in Mount Pleasant
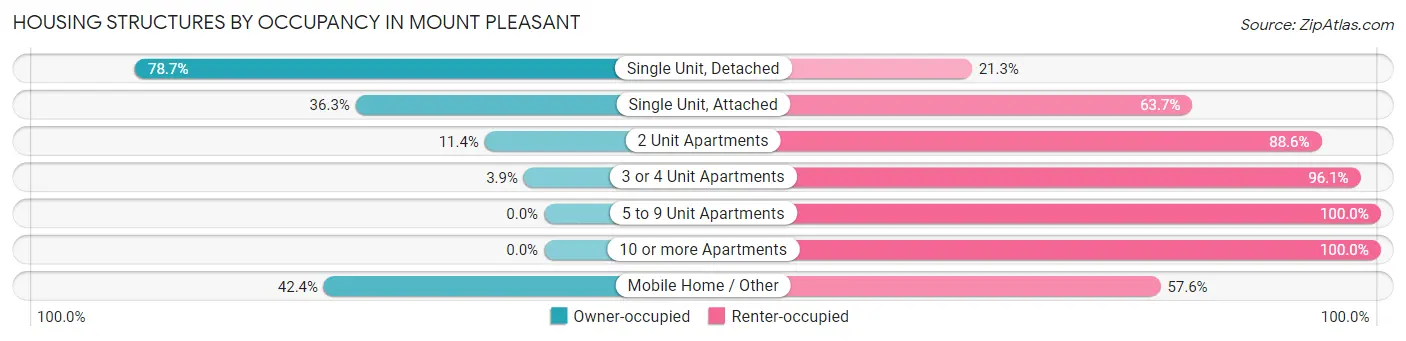
| Structure Type | Owner-occupied | Renter-occupied |
| Single Unit, Detached | 2,379 (78.7%) | 643 (21.3%) |
| Single Unit, Attached | 244 (36.3%) | 429 (63.7%) |
| 2 Unit Apartments | 46 (11.4%) | 357 (88.6%) |
| 3 or 4 Unit Apartments | 27 (3.9%) | 668 (96.1%) |
| 5 to 9 Unit Apartments | 0 (0.0%) | 876 (100.0%) |
| 10 or more Apartments | 0 (0.0%) | 1,845 (100.0%) |
| Mobile Home / Other | 64 (42.4%) | 87 (57.6%) |
| Total | 2,760 (36.0%) | 4,905 (64.0%) |
Housing Structures by Number of Rooms in Mount Pleasant
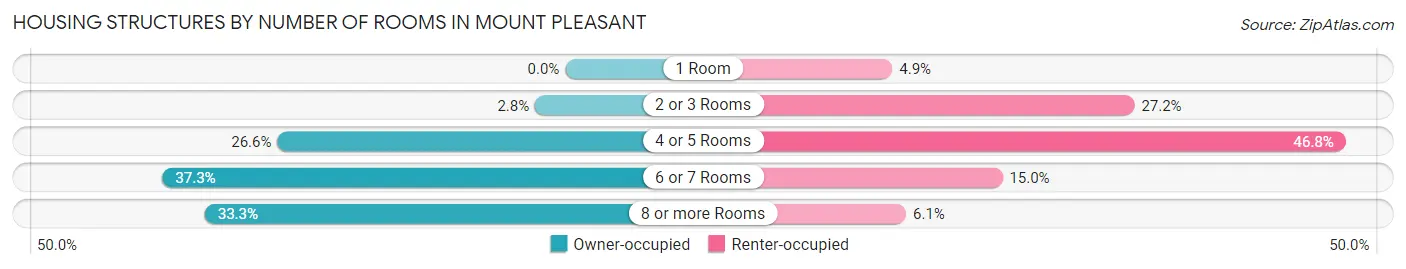
| Number of Rooms | Owner-occupied | Renter-occupied |
| 1 Room | 0 (0.0%) | 238 (4.9%) |
| 2 or 3 Rooms | 77 (2.8%) | 1,336 (27.2%) |
| 4 or 5 Rooms | 735 (26.6%) | 2,294 (46.8%) |
| 6 or 7 Rooms | 1,028 (37.2%) | 737 (15.0%) |
| 8 or more Rooms | 920 (33.3%) | 300 (6.1%) |
| Total | 2,760 (100.0%) | 4,905 (100.0%) |
Housing Structure by Heating Type in Mount Pleasant
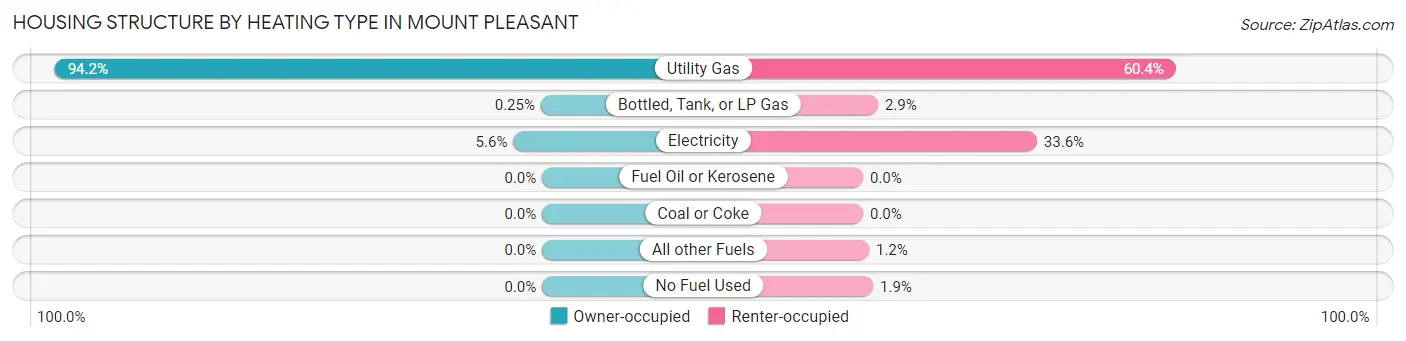
| Heating Type | Owner-occupied | Renter-occupied |
| Utility Gas | 2,599 (94.2%) | 2,963 (60.4%) |
| Bottled, Tank, or LP Gas | 7 (0.3%) | 142 (2.9%) |
| Electricity | 154 (5.6%) | 1,648 (33.6%) |
| Fuel Oil or Kerosene | 0 (0.0%) | 0 (0.0%) |
| Coal or Coke | 0 (0.0%) | 0 (0.0%) |
| All other Fuels | 0 (0.0%) | 57 (1.2%) |
| No Fuel Used | 0 (0.0%) | 95 (1.9%) |
| Total | 2,760 (100.0%) | 4,905 (100.0%) |
Household Vehicle Usage in Mount Pleasant
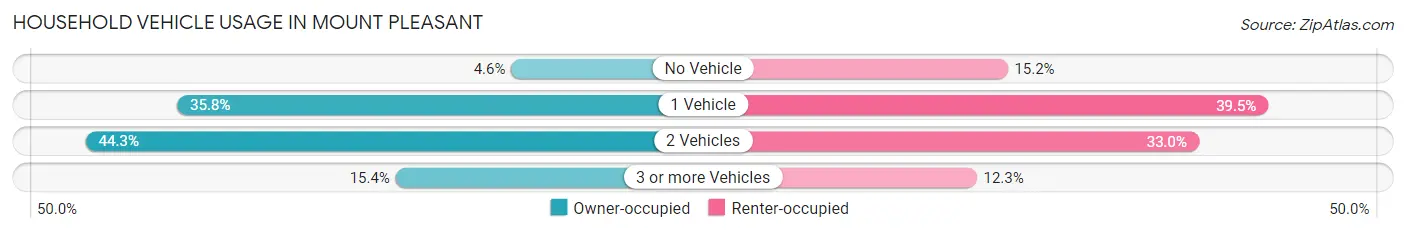
| Vehicles per Household | Owner-occupied | Renter-occupied |
| No Vehicle | 126 (4.6%) | 744 (15.2%) |
| 1 Vehicle | 987 (35.8%) | 1,938 (39.5%) |
| 2 Vehicles | 1,223 (44.3%) | 1,620 (33.0%) |
| 3 or more Vehicles | 424 (15.4%) | 603 (12.3%) |
| Total | 2,760 (100.0%) | 4,905 (100.0%) |
Real Estate & Mortgages in Mount Pleasant
Real Estate and Mortgage Overview in Mount Pleasant
| Characteristic | Without Mortgage | With Mortgage |
| Housing Units | 1,074 | 1,686 |
| Median Property Value | $160,700 | $163,400 |
| Median Household Income | $62,750 | $357 |
| Monthly Housing Costs | $574 | $58 |
| Real Estate Taxes | $3,207 | $22 |
Property Value by Mortgage Status in Mount Pleasant
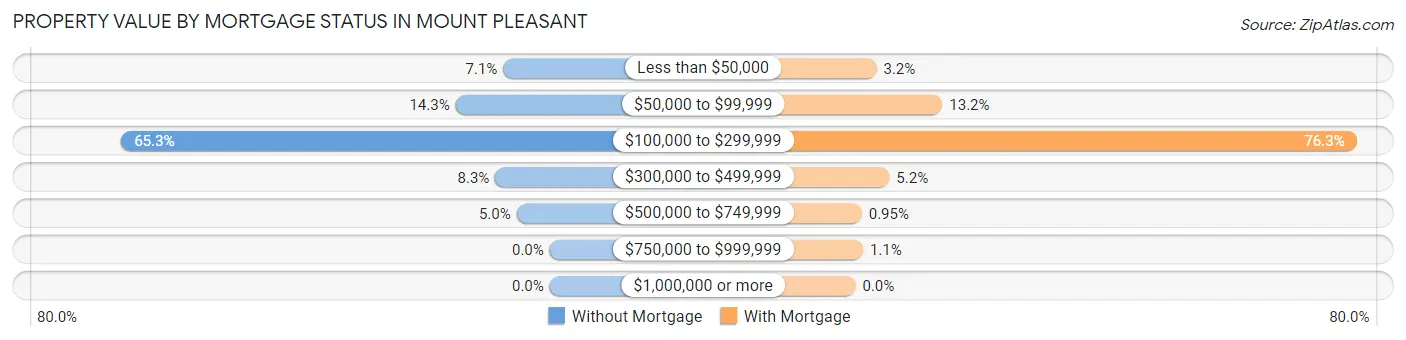
| Property Value | Without Mortgage | With Mortgage |
| Less than $50,000 | 76 (7.1%) | 54 (3.2%) |
| $50,000 to $99,999 | 154 (14.3%) | 223 (13.2%) |
| $100,000 to $299,999 | 701 (65.3%) | 1,287 (76.3%) |
| $300,000 to $499,999 | 89 (8.3%) | 87 (5.2%) |
| $500,000 to $749,999 | 54 (5.0%) | 16 (0.9%) |
| $750,000 to $999,999 | 0 (0.0%) | 19 (1.1%) |
| $1,000,000 or more | 0 (0.0%) | 0 (0.0%) |
| Total | 1,074 (100.0%) | 1,686 (100.0%) |
Household Income by Mortgage Status in Mount Pleasant
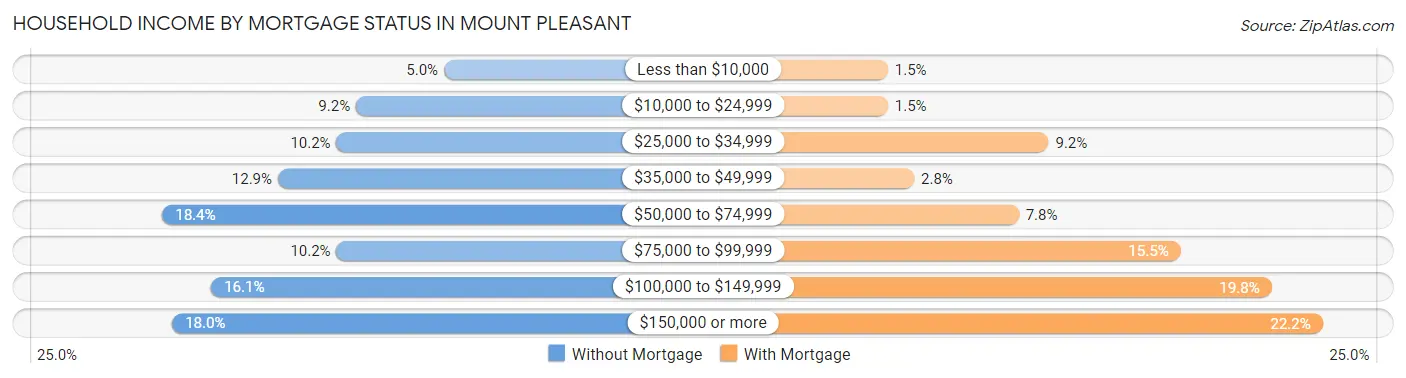
| Household Income | Without Mortgage | With Mortgage |
| Less than $10,000 | 54 (5.0%) | 26 (1.5%) |
| $10,000 to $24,999 | 99 (9.2%) | 26 (1.5%) |
| $25,000 to $34,999 | 109 (10.2%) | 155 (9.2%) |
| $35,000 to $49,999 | 139 (12.9%) | 47 (2.8%) |
| $50,000 to $74,999 | 198 (18.4%) | 131 (7.8%) |
| $75,000 to $99,999 | 109 (10.2%) | 261 (15.5%) |
| $100,000 to $149,999 | 173 (16.1%) | 334 (19.8%) |
| $150,000 or more | 193 (18.0%) | 375 (22.2%) |
| Total | 1,074 (100.0%) | 1,686 (100.0%) |
Property Value to Household Income Ratio in Mount Pleasant
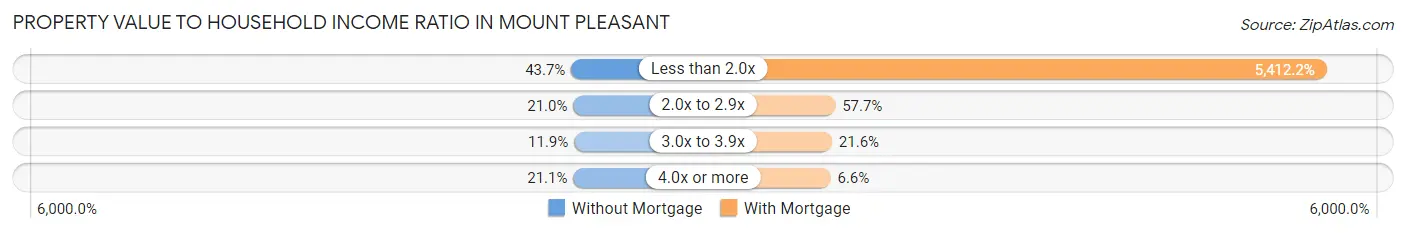
| Value-to-Income Ratio | Without Mortgage | With Mortgage |
| Less than 2.0x | 469 (43.7%) | 91,250 (5,412.2%) |
| 2.0x to 2.9x | 225 (20.9%) | 972 (57.7%) |
| 3.0x to 3.9x | 128 (11.9%) | 364 (21.6%) |
| 4.0x or more | 227 (21.1%) | 111 (6.6%) |
| Total | 1,074 (100.0%) | 1,686 (100.0%) |
Real Estate Taxes by Mortgage Status in Mount Pleasant
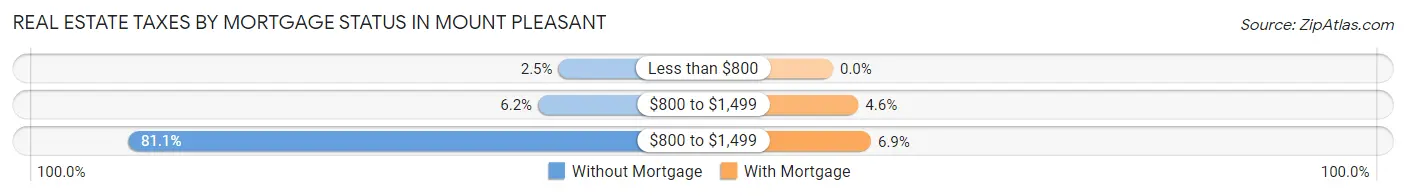
| Property Taxes | Without Mortgage | With Mortgage |
| Less than $800 | 27 (2.5%) | 0 (0.0%) |
| $800 to $1,499 | 67 (6.2%) | 78 (4.6%) |
| $800 to $1,499 | 871 (81.1%) | 117 (6.9%) |
| Total | 1,074 (100.0%) | 1,686 (100.0%) |
Health & Disability in Mount Pleasant
Health Insurance Coverage by Age in Mount Pleasant
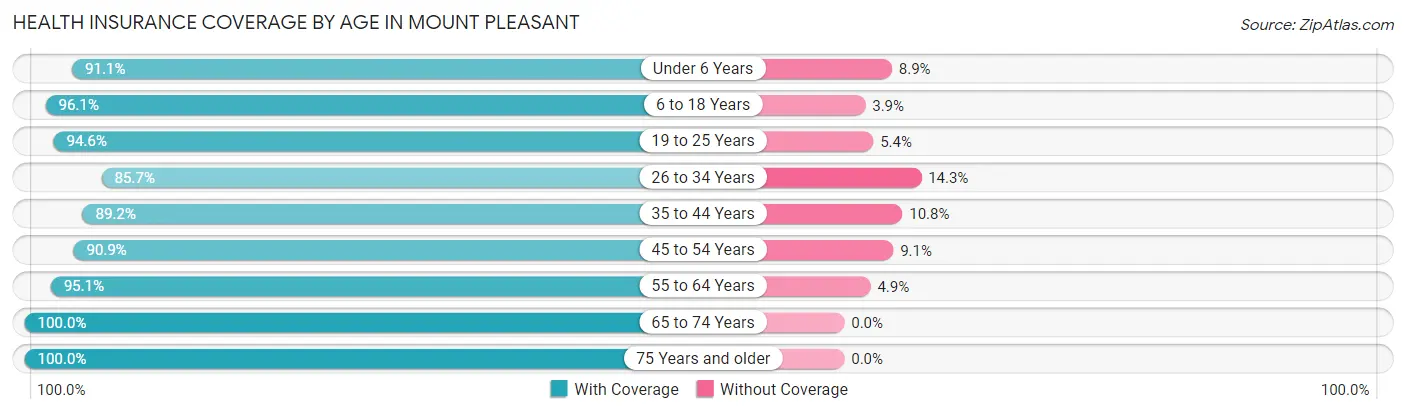
| Age Bracket | With Coverage | Without Coverage |
| Under 6 Years | 996 (91.1%) | 97 (8.9%) |
| 6 to 18 Years | 3,124 (96.1%) | 127 (3.9%) |
| 19 to 25 Years | 7,802 (94.6%) | 445 (5.4%) |
| 26 to 34 Years | 2,007 (85.7%) | 336 (14.3%) |
| 35 to 44 Years | 1,896 (89.2%) | 230 (10.8%) |
| 45 to 54 Years | 1,325 (90.9%) | 133 (9.1%) |
| 55 to 64 Years | 1,170 (95.1%) | 60 (4.9%) |
| 65 to 74 Years | 1,023 (100.0%) | 0 (0.0%) |
| 75 Years and older | 616 (100.0%) | 0 (0.0%) |
| Total | 19,959 (93.3%) | 1,428 (6.7%) |
Health Insurance Coverage by Citizenship Status in Mount Pleasant
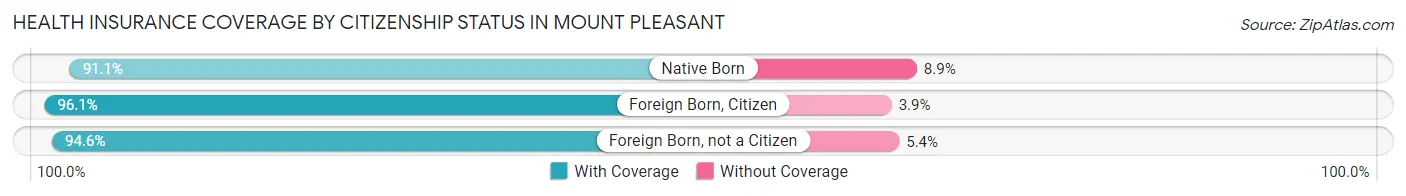
| Citizenship Status | With Coverage | Without Coverage |
| Native Born | 996 (91.1%) | 97 (8.9%) |
| Foreign Born, Citizen | 3,124 (96.1%) | 127 (3.9%) |
| Foreign Born, not a Citizen | 7,802 (94.6%) | 445 (5.4%) |
Health Insurance Coverage by Household Income in Mount Pleasant
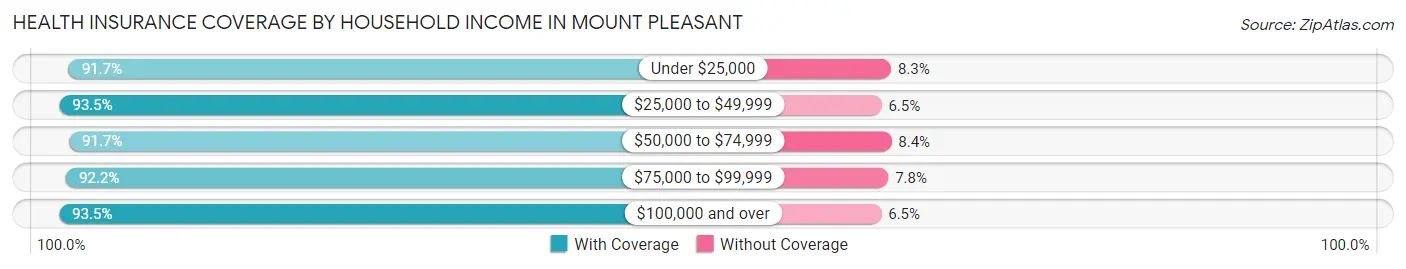
| Household Income | With Coverage | Without Coverage |
| Under $25,000 | 4,092 (91.7%) | 369 (8.3%) |
| $25,000 to $49,999 | 3,392 (93.5%) | 236 (6.5%) |
| $50,000 to $74,999 | 2,634 (91.6%) | 240 (8.4%) |
| $75,000 to $99,999 | 1,937 (92.2%) | 163 (7.8%) |
| $100,000 and over | 3,112 (93.5%) | 215 (6.5%) |
Public vs Private Health Insurance Coverage by Age in Mount Pleasant
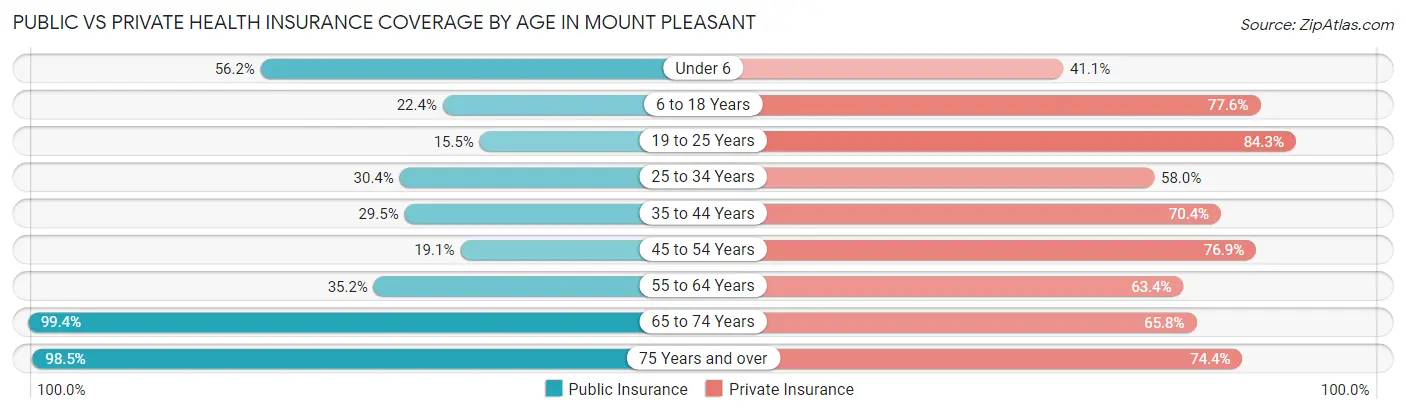
| Age Bracket | Public Insurance | Private Insurance |
| Under 6 | 614 (56.2%) | 449 (41.1%) |
| 6 to 18 Years | 728 (22.4%) | 2,524 (77.6%) |
| 19 to 25 Years | 1,281 (15.5%) | 6,948 (84.3%) |
| 25 to 34 Years | 712 (30.4%) | 1,358 (58.0%) |
| 35 to 44 Years | 627 (29.5%) | 1,496 (70.4%) |
| 45 to 54 Years | 279 (19.1%) | 1,121 (76.9%) |
| 55 to 64 Years | 433 (35.2%) | 780 (63.4%) |
| 65 to 74 Years | 1,017 (99.4%) | 673 (65.8%) |
| 75 Years and over | 607 (98.5%) | 458 (74.4%) |
| Total | 6,298 (29.4%) | 15,807 (73.9%) |
Disability Status by Sex by Age in Mount Pleasant
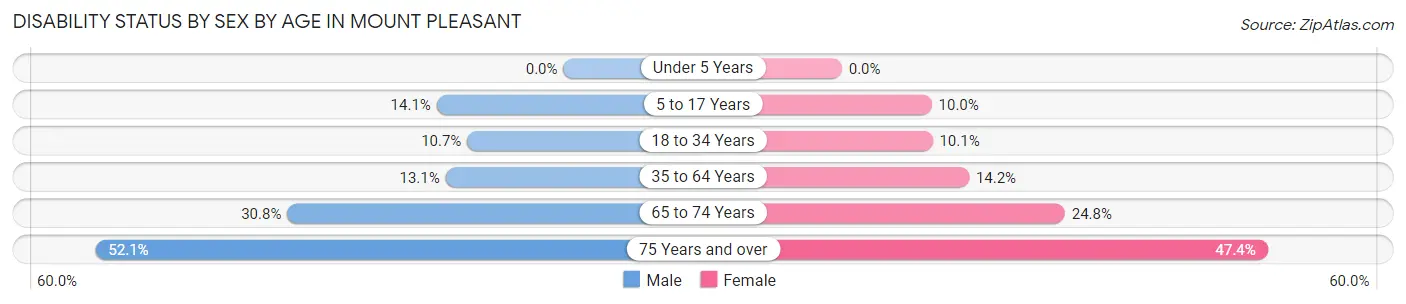
| Age Bracket | Male | Female |
| Under 5 Years | 0 (0.0%) | 0 (0.0%) |
| 5 to 17 Years | 113 (14.1%) | 93 (10.0%) |
| 18 to 34 Years | 614 (10.7%) | 670 (10.1%) |
| 35 to 64 Years | 323 (13.1%) | 333 (14.2%) |
| 65 to 74 Years | 119 (30.7%) | 158 (24.8%) |
| 75 Years and over | 99 (52.1%) | 202 (47.4%) |
Disability Class by Sex by Age in Mount Pleasant
Disability Class: Hearing Difficulty
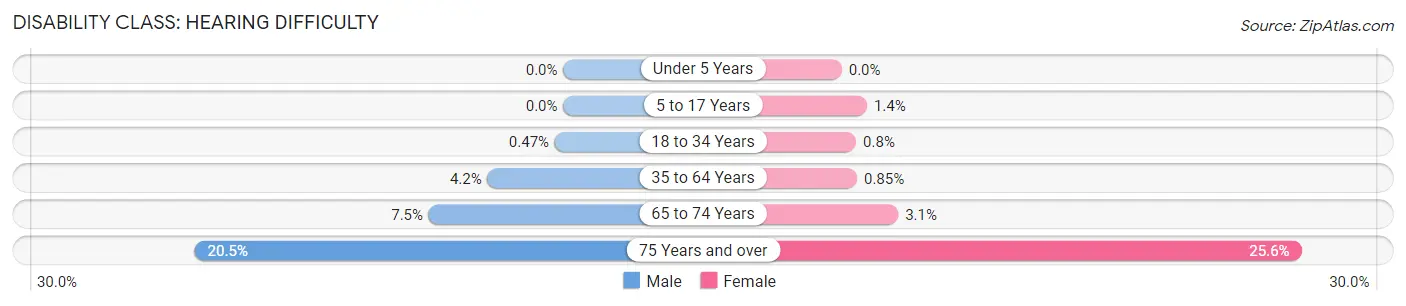
| Age Bracket | Male | Female |
| Under 5 Years | 0 (0.0%) | 0 (0.0%) |
| 5 to 17 Years | 0 (0.0%) | 13 (1.4%) |
| 18 to 34 Years | 27 (0.5%) | 53 (0.8%) |
| 35 to 64 Years | 104 (4.2%) | 20 (0.9%) |
| 65 to 74 Years | 29 (7.5%) | 20 (3.1%) |
| 75 Years and over | 39 (20.5%) | 109 (25.6%) |
Disability Class: Vision Difficulty
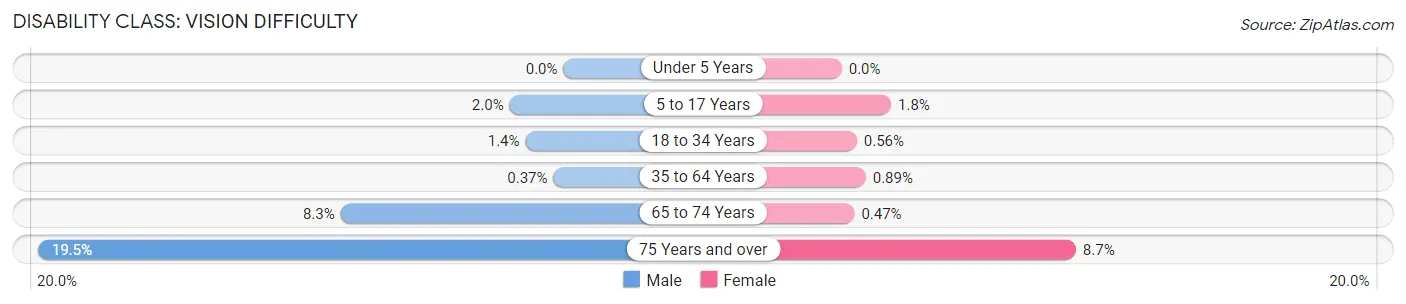
| Age Bracket | Male | Female |
| Under 5 Years | 0 (0.0%) | 0 (0.0%) |
| 5 to 17 Years | 16 (2.0%) | 17 (1.8%) |
| 18 to 34 Years | 81 (1.4%) | 37 (0.6%) |
| 35 to 64 Years | 9 (0.4%) | 21 (0.9%) |
| 65 to 74 Years | 32 (8.3%) | 3 (0.5%) |
| 75 Years and over | 37 (19.5%) | 37 (8.7%) |
Disability Class: Cognitive Difficulty
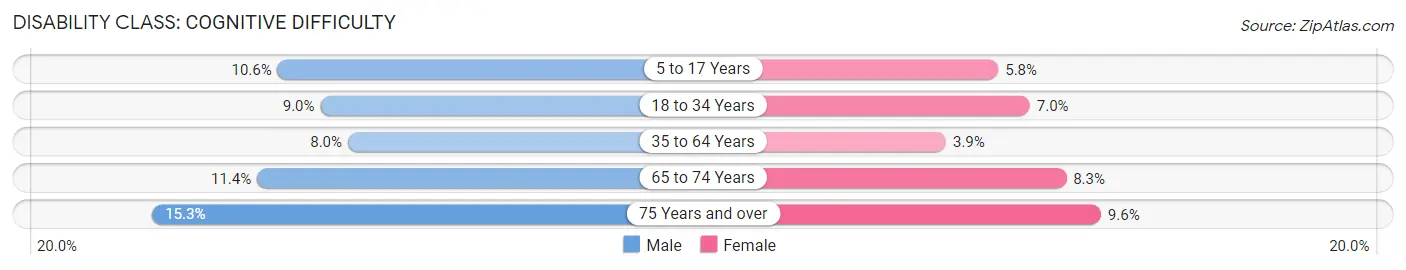
| Age Bracket | Male | Female |
| 5 to 17 Years | 85 (10.6%) | 54 (5.8%) |
| 18 to 34 Years | 517 (9.0%) | 463 (7.0%) |
| 35 to 64 Years | 197 (8.0%) | 91 (3.9%) |
| 65 to 74 Years | 44 (11.4%) | 53 (8.3%) |
| 75 Years and over | 29 (15.3%) | 41 (9.6%) |
Disability Class: Ambulatory Difficulty
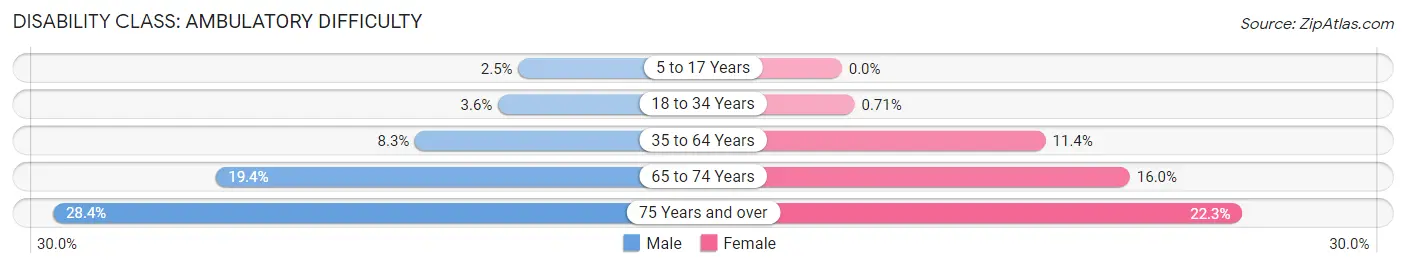
| Age Bracket | Male | Female |
| 5 to 17 Years | 20 (2.5%) | 0 (0.0%) |
| 18 to 34 Years | 208 (3.6%) | 47 (0.7%) |
| 35 to 64 Years | 203 (8.3%) | 267 (11.4%) |
| 65 to 74 Years | 75 (19.4%) | 102 (16.0%) |
| 75 Years and over | 54 (28.4%) | 95 (22.3%) |
Disability Class: Self-Care Difficulty
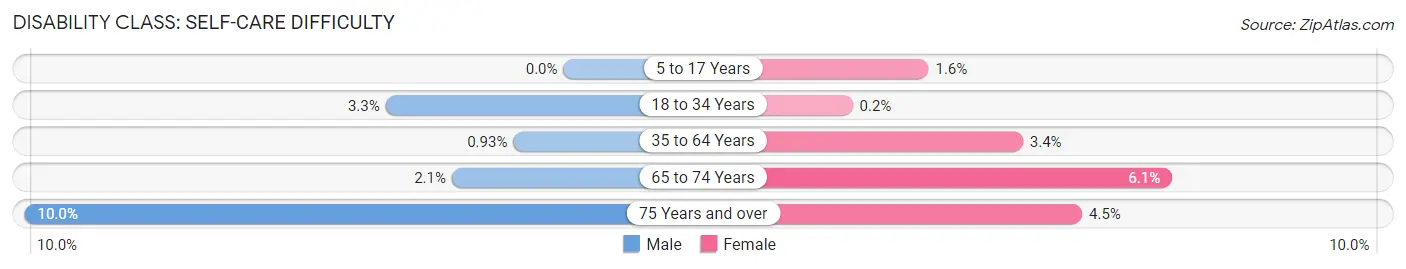
| Age Bracket | Male | Female |
| 5 to 17 Years | 0 (0.0%) | 15 (1.6%) |
| 18 to 34 Years | 189 (3.3%) | 13 (0.2%) |
| 35 to 64 Years | 23 (0.9%) | 79 (3.4%) |
| 65 to 74 Years | 8 (2.1%) | 39 (6.1%) |
| 75 Years and over | 19 (10.0%) | 19 (4.5%) |
Technology Access in Mount Pleasant
Computing Device Access in Mount Pleasant
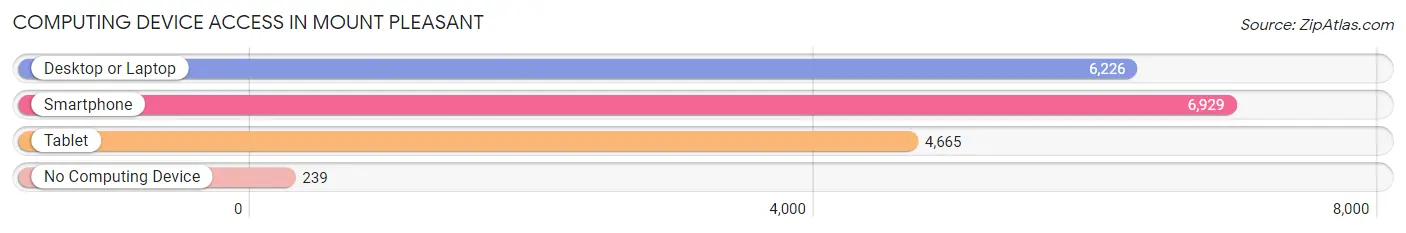
| Device Type | # Households | % Households |
| Desktop or Laptop | 6,226 | 81.2% |
| Smartphone | 6,929 | 90.4% |
| Tablet | 4,665 | 60.9% |
| No Computing Device | 239 | 3.1% |
| Total | 7,665 | 100.0% |
Internet Access in Mount Pleasant
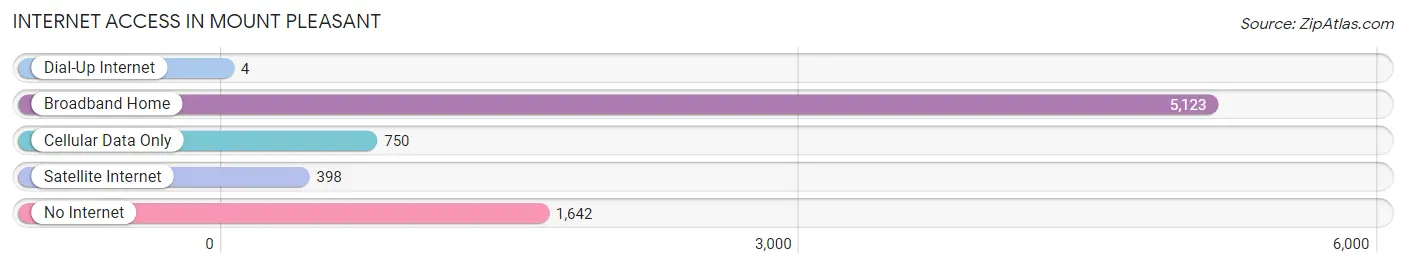
| Internet Type | # Households | % Households |
| Dial-Up Internet | 4 | 0.1% |
| Broadband Home | 5,123 | 66.8% |
| Cellular Data Only | 750 | 9.8% |
| Satellite Internet | 398 | 5.2% |
| No Internet | 1,642 | 21.4% |
| Total | 7,665 | 100.0% |
Mount Pleasant Summary
Introduction
Mount Pleasant is a city located in the U.S. state of Michigan. It is the county seat of Isabella County and is located in the central part of the state. The city is situated in the middle of the state, approximately halfway between the cities of Lansing and Saginaw. The city is home to Central Michigan University, which is the largest university in the state. The city has a population of approximately 26,000 people and is the largest city in Isabella County.
History
The area that is now Mount Pleasant was originally inhabited by the Anishinaabe people, who were part of the Ojibwe Nation. The first European settlers arrived in the area in the early 19th century. The first permanent settlement was established in 1854 and was named Mount Pleasant. The city was incorporated in 1871 and was named after the nearby Mount Pleasant Indian Mission.
The city grew rapidly in the late 19th century and early 20th century due to the lumber industry. The city was also home to several factories, including a furniture factory and a paper mill. The city was also home to a large number of immigrants, primarily from Germany and Poland.
In the mid-20th century, the city began to experience a decline in population due to the decline of the lumber industry and the closure of several factories. In the late 20th century, the city began to experience a resurgence due to the growth of Central Michigan University.
Geography
Mount Pleasant is located in the central part of the state of Michigan. The city is situated in the middle of the state, approximately halfway between the cities of Lansing and Saginaw. The city is located in Isabella County and is bordered by the Chippewa River to the north and the Saginaw River to the south. The city is located in a region of rolling hills and is surrounded by farmland.
The climate in Mount Pleasant is classified as humid continental, with warm summers and cold winters. The average temperature in the summer is around 75 degrees Fahrenheit and the average temperature in the winter is around 25 degrees Fahrenheit. The city receives an average of 33 inches of precipitation per year.
Economy
The economy of Mount Pleasant is largely driven by the education and healthcare sectors. Central Michigan University is the largest employer in the city, with over 8,000 employees. The city is also home to several healthcare facilities, including McLaren Central Michigan and MidMichigan Medical Center.
The city is also home to several manufacturing companies, including Dow Corning, which produces silicone products, and the Dow Chemical Company, which produces chemicals and plastics. The city is also home to several retail stores, including Walmart and Meijer.
Demographics
As of the 2010 census, the population of Mount Pleasant was 26,016. The racial makeup of the city was 87.3% White, 5.7% African American, 0.7% Native American, 2.2% Asian, 0.1% Pacific Islander, 1.3% from other races, and 2.9% from two or more races. Hispanic or Latino of any race were 4.3% of the population.
The median household income in the city was $37,945 and the median family income was $50,945. The per capita income in the city was $20,945. The poverty rate in the city was 17.3%.
Conclusion
Mount Pleasant is a city located in the U.S. state of Michigan. It is the county seat of Isabella County and is located in the central part of the state. The city is home to Central Michigan University, which is the largest university in the state. The city has a population of approximately 26,000 people and is the largest city in Isabella County. The economy of Mount Pleasant is largely driven by the education and healthcare sectors. The racial makeup of the city is 87.3% White, 5.7% African American, 0.7% Native American, 2.2% Asian, 0.1% Pacific Islander, 1.3% from other races, and 2.9% from two or more races. The median household income in the city was $37,945 and the median family income was $50,945. The per capita income in the city was $20,945. The poverty rate in the city was 17.3%.
Common Questions
What is Per Capita Income in Mount Pleasant?
Per Capita income in Mount Pleasant is $23,962.
What is the Median Family Income in Mount Pleasant?
Median Family Income in Mount Pleasant is $68,617.
What is the Median Household income in Mount Pleasant?
Median Household Income in Mount Pleasant is $41,512.
What is Income or Wage Gap in Mount Pleasant?
Income or Wage Gap in Mount Pleasant is 50.2%.
Women in Mount Pleasant earn 49.8 cents for every dollar earned by a man.
What is Family Income Deficit in Mount Pleasant?
Family Income Deficit in Mount Pleasant is $10,367.
Families that are below poverty line in Mount Pleasant earn $10,367 less on average than the poverty threshold level.
What is Inequality or Gini Index in Mount Pleasant?
Inequality or Gini Index in Mount Pleasant is 0.53.
What is the Total Population of Mount Pleasant?
Total Population of Mount Pleasant is 21,826.
What is the Total Male Population of Mount Pleasant?
Total Male Population of Mount Pleasant is 10,176.
What is the Total Female Population of Mount Pleasant?
Total Female Population of Mount Pleasant is 11,650.
What is the Ratio of Males per 100 Females in Mount Pleasant?
There are 87.35 Males per 100 Females in Mount Pleasant.
What is the Ratio of Females per 100 Males in Mount Pleasant?
There are 114.49 Females per 100 Males in Mount Pleasant.
What is the Median Population Age in Mount Pleasant?
Median Population Age in Mount Pleasant is 22.9 Years.
What is the Average Family Size in Mount Pleasant
Average Family Size in Mount Pleasant is 2.8 People.
What is the Average Household Size in Mount Pleasant
Average Household Size in Mount Pleasant is 2.1 People.
How Large is the Labor Force in Mount Pleasant?
There are 12,042 People in the Labor Forcein in Mount Pleasant.
What is the Percentage of People in the Labor Force in Mount Pleasant?
61.6% of People are in the Labor Force in Mount Pleasant.
What is the Unemployment Rate in Mount Pleasant?
Unemployment Rate in Mount Pleasant is 9.5%.