Zip Codes with the Highest Percentage of Population Employed in Accommodation & Food Services in Traverse City, MI
RELATED REPORTS & OPTIONS
Accommodation & Food Services
Traverse City
Compare Zip Codes
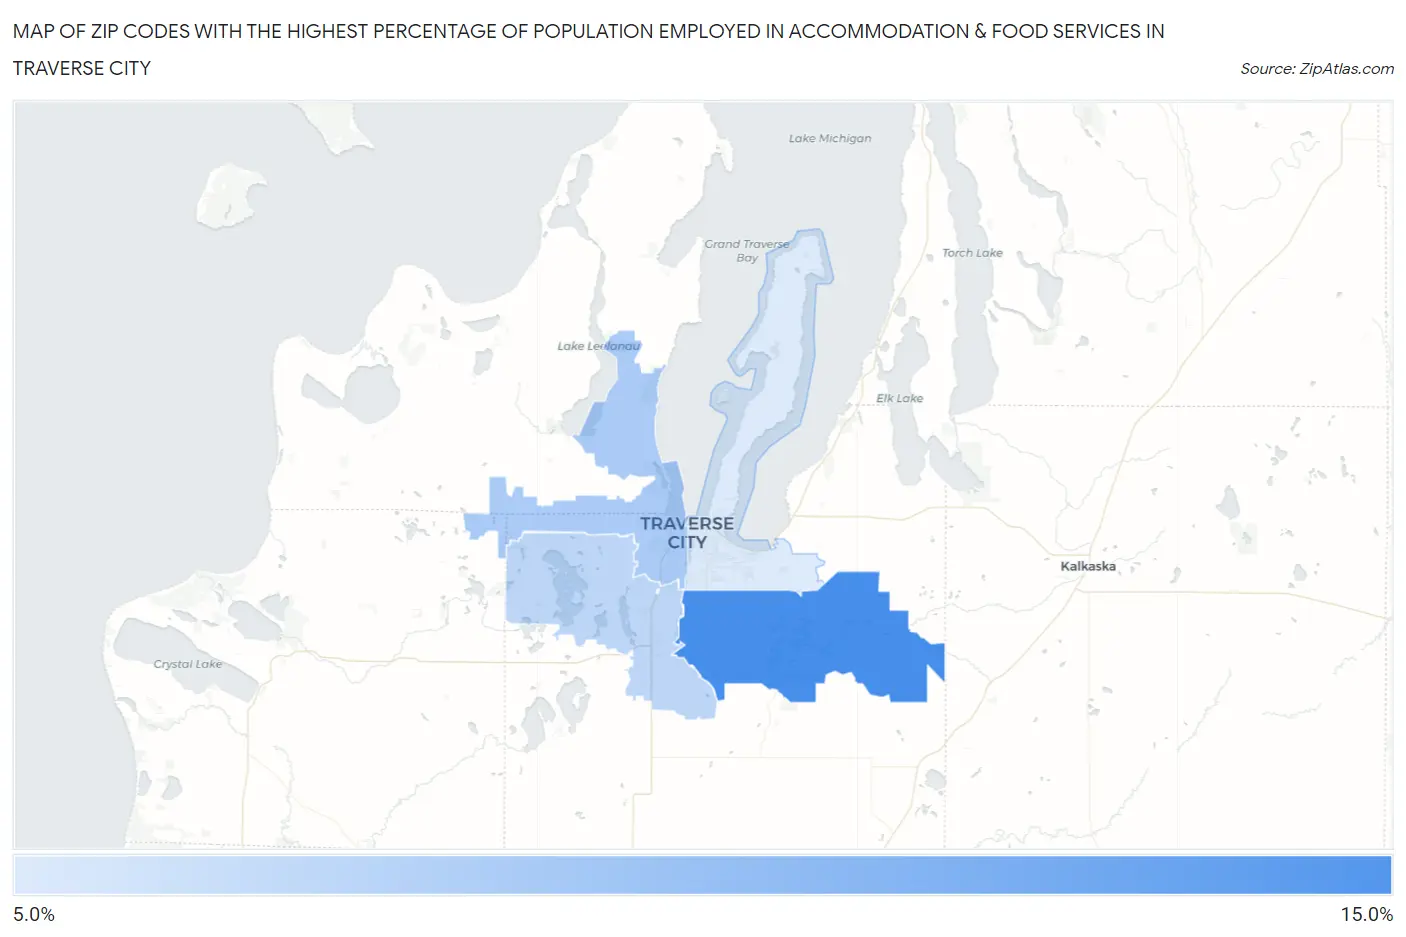
Map of Zip Codes with the Highest Percentage of Population Employed in Accommodation & Food Services in Traverse City
7.8%
10.9%
Zip Codes with the Highest Percentage of Population Employed in Accommodation & Food Services in Traverse City, MI
| Zip Code | % Employed | vs State | vs National | |
| 1. | 49696 | 10.9% | 7.1%(+3.84)#99 | 6.9%(+4.04)#3,618 |
| 2. | 49684 | 8.8% | 7.1%(+1.76)#225 | 6.9%(+1.96)#6,202 |
| 3. | 49685 | 8.4% | 7.1%(+1.34)#252 | 6.9%(+1.54)#6,954 |
| 4. | 49686 | 7.8% | 7.1%(+0.688)#298 | 6.9%(+0.890)#8,324 |
1
Common Questions
What are the Top 3 Zip Codes with the Highest Percentage of Population Employed in Accommodation & Food Services in Traverse City, MI?
Top 3 Zip Codes with the Highest Percentage of Population Employed in Accommodation & Food Services in Traverse City, MI are:
What zip code has the Highest Percentage of Population Employed in Accommodation & Food Services in Traverse City, MI?
49696 has the Highest Percentage of Population Employed in Accommodation & Food Services in Traverse City, MI with 10.9%.
What is the Percentage of Population Employed in Accommodation & Food Services in Traverse City, MI?
Percentage of Population Employed in Accommodation & Food Services in Traverse City is 7.7%.
What is the Percentage of Population Employed in Accommodation & Food Services in Michigan?
Percentage of Population Employed in Accommodation & Food Services in Michigan is 7.1%.
What is the Percentage of Population Employed in Accommodation & Food Services in the United States?
Percentage of Population Employed in Accommodation & Food Services in the United States is 6.9%.