Zip Codes with the Highest Percentage of Population Employed in Accommodation & Food Services in Howell, MI
RELATED REPORTS & OPTIONS
Accommodation & Food Services
Howell
Compare Zip Codes
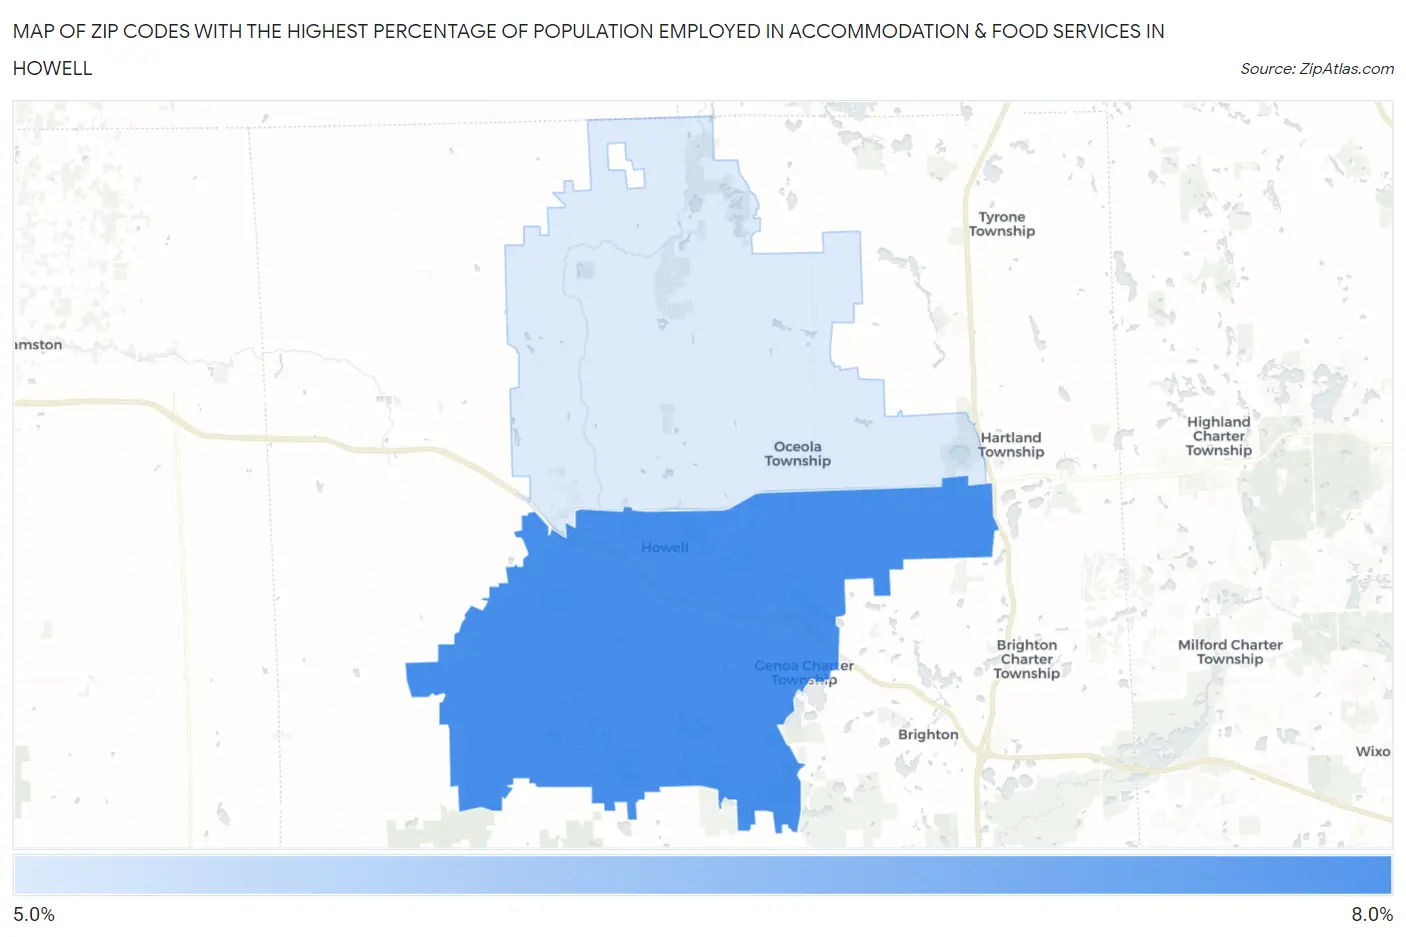
Map of Zip Codes with the Highest Percentage of Population Employed in Accommodation & Food Services in Howell
5.4%
8.0%
Zip Codes with the Highest Percentage of Population Employed in Accommodation & Food Services in Howell, MI
| Zip Code | % Employed | vs State | vs National | |
| 1. | 48843 | 8.0% | 7.1%(+0.907)#278 | 6.9%(+1.11)#7,835 |
| 2. | 48855 | 5.4% | 7.1%(-1.71)#613 | 6.9%(-1.50)#15,480 |
1
Common Questions
What are the Top Zip Codes with the Highest Percentage of Population Employed in Accommodation & Food Services in Howell, MI?
Top Zip Codes with the Highest Percentage of Population Employed in Accommodation & Food Services in Howell, MI are:
What zip code has the Highest Percentage of Population Employed in Accommodation & Food Services in Howell, MI?
48843 has the Highest Percentage of Population Employed in Accommodation & Food Services in Howell, MI with 8.0%.
What is the Percentage of Population Employed in Accommodation & Food Services in Howell, MI?
Percentage of Population Employed in Accommodation & Food Services in Howell is 13.4%.
What is the Percentage of Population Employed in Accommodation & Food Services in Michigan?
Percentage of Population Employed in Accommodation & Food Services in Michigan is 7.1%.
What is the Percentage of Population Employed in Accommodation & Food Services in the United States?
Percentage of Population Employed in Accommodation & Food Services in the United States is 6.9%.