Zip Codes with the Highest Percentage of Population Employed in Accommodation & Food Services in Clarkston, MI
RELATED REPORTS & OPTIONS
Accommodation & Food Services
Clarkston
Compare Zip Codes
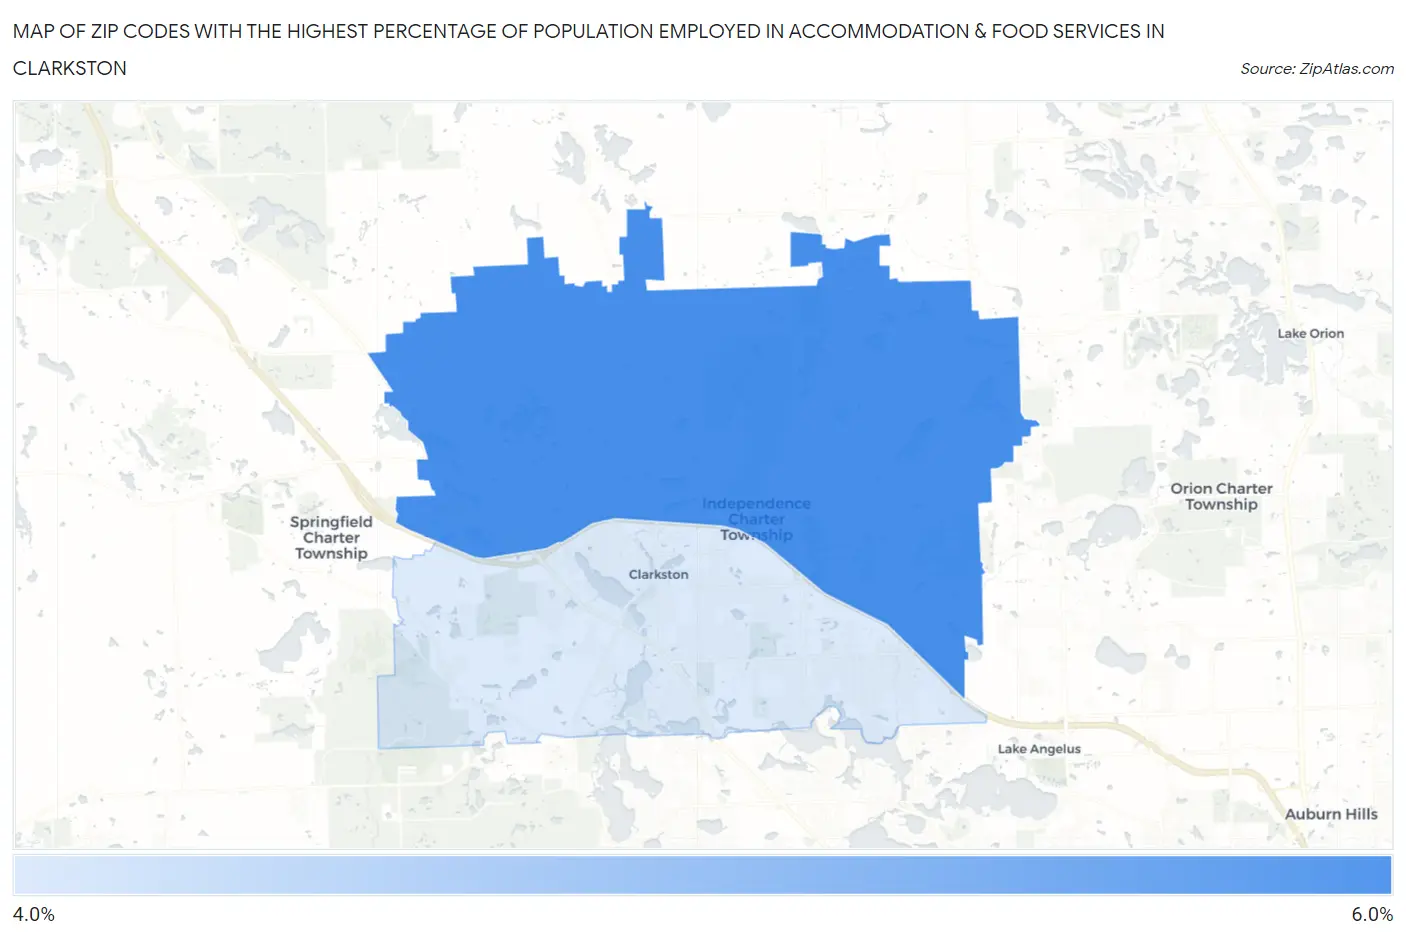
Map of Zip Codes with the Highest Percentage of Population Employed in Accommodation & Food Services in Clarkston
5.0%
5.6%
Zip Codes with the Highest Percentage of Population Employed in Accommodation & Food Services in Clarkston, MI
| Zip Code | % Employed | vs State | vs National | |
| 1. | 48348 | 5.6% | 7.1%(-1.47)#584 | 6.9%(-1.27)#14,658 |
| 2. | 48346 | 5.0% | 7.1%(-2.09)#669 | 6.9%(-1.89)#16,858 |
1
Common Questions
What are the Top Zip Codes with the Highest Percentage of Population Employed in Accommodation & Food Services in Clarkston, MI?
Top Zip Codes with the Highest Percentage of Population Employed in Accommodation & Food Services in Clarkston, MI are:
What zip code has the Highest Percentage of Population Employed in Accommodation & Food Services in Clarkston, MI?
48348 has the Highest Percentage of Population Employed in Accommodation & Food Services in Clarkston, MI with 5.6%.
What is the Percentage of Population Employed in Accommodation & Food Services in Michigan?
Percentage of Population Employed in Accommodation & Food Services in Michigan is 7.1%.
What is the Percentage of Population Employed in Accommodation & Food Services in the United States?
Percentage of Population Employed in Accommodation & Food Services in the United States is 6.9%.