Allendale, MI Map & Demographics
Allendale Map
Allendale Overview
$24,332
PER CAPITA INCOME
$92,635
AVG FAMILY INCOME
$64,356
AVG HOUSEHOLD INCOME
47.1%
WAGE / INCOME GAP [ % ]
52.9¢/ $1
WAGE / INCOME GAP [ $ ]
$10,847
FAMILY INCOME DEFICIT
0.42
INEQUALITY / GINI INDEX
25,206
TOTAL POPULATION
11,373
MALE POPULATION
13,833
FEMALE POPULATION
82.22
MALES / 100 FEMALES
121.63
FEMALES / 100 MALES
21.3
MEDIAN AGE
3.1
AVG FAMILY SIZE
2.9
AVG HOUSEHOLD SIZE
15,284
LABOR FORCE [ PEOPLE ]
68.3%
PERCENT IN LABOR FORCE
7.5%
UNEMPLOYMENT RATE
Allendale Zip Codes
Allendale Area Codes
Income in Allendale
Income Overview in Allendale
Per Capita Income in Allendale is $24,332, while median incomes of families and households are $92,635 and $64,356 respectively.
| Characteristic | Number | Measure |
| Per Capita Income | 25,206 | $24,332 |
| Median Family Income | 3,580 | $92,635 |
| Mean Family Income | 3,580 | $111,867 |
| Median Household Income | 7,297 | $64,356 |
| Mean Household Income | 7,297 | $80,813 |
| Income Deficit | 3,580 | $10,847 |
| Wage / Income Gap (%) | 25,206 | 47.12% |
| Wage / Income Gap ($) | 25,206 | 52.88¢ per $1 |
| Gini / Inequality Index | 25,206 | 0.42 |
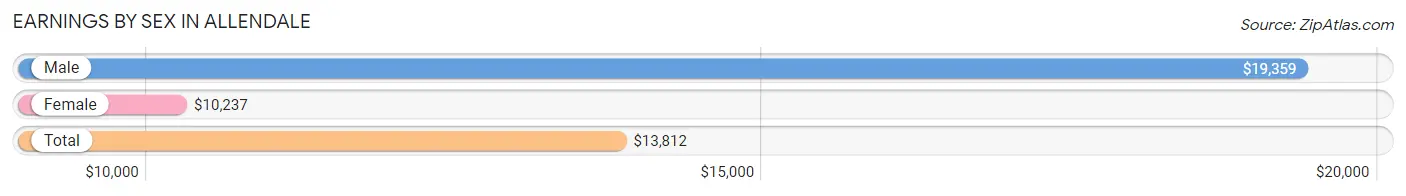
Earnings by Sex in Allendale
Average Earnings in Allendale are $13,812, $19,359 for men and $10,237 for women, a difference of 47.1%.
| Sex | Number | Average Earnings |
| Male | 8,250 (45.1%) | $19,359 |
| Female | 10,050 (54.9%) | $10,237 |
| Total | 18,300 (100.0%) | $13,812 |
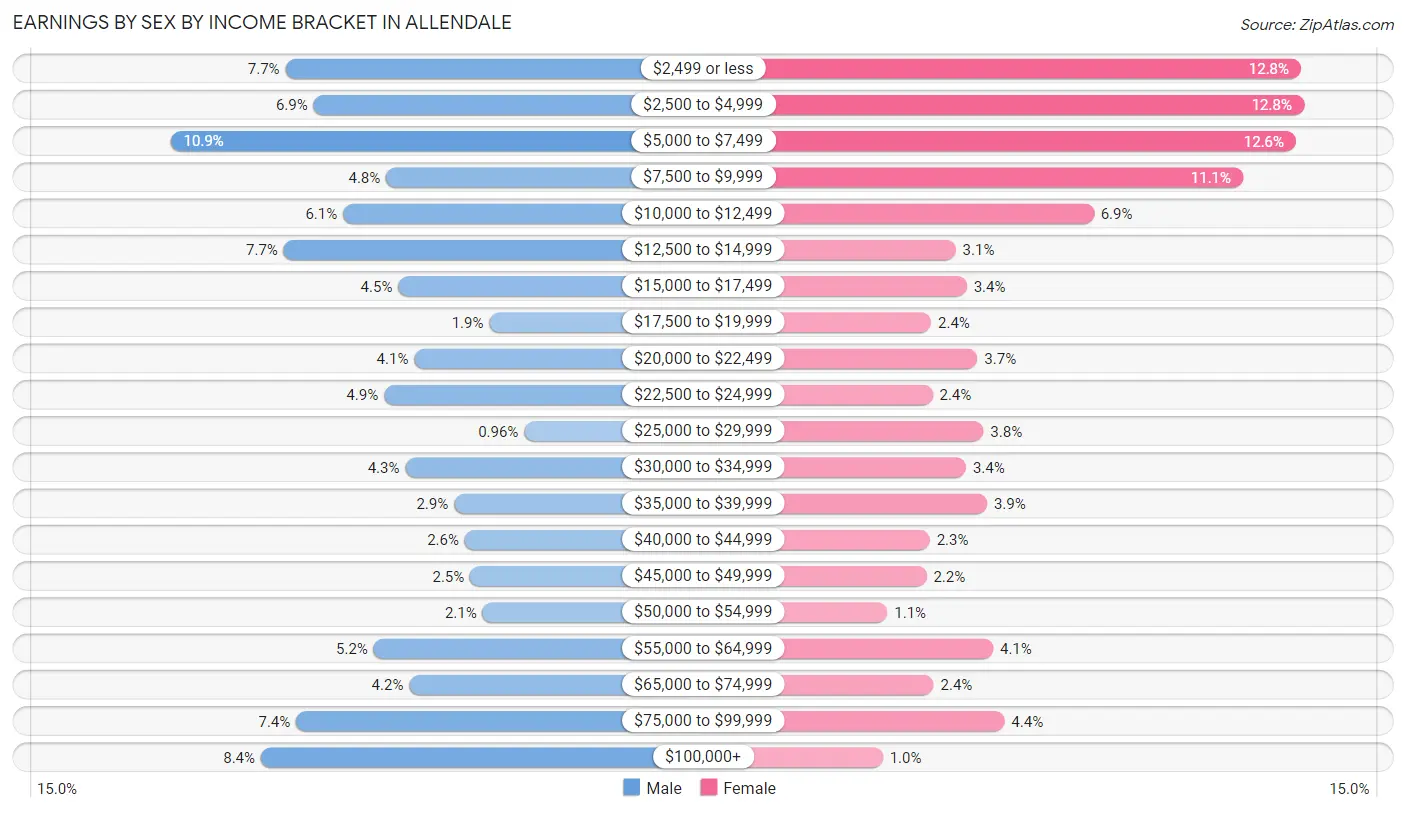
Earnings by Sex by Income Bracket in Allendale
The most common earnings brackets in Allendale are $5,000 to $7,499 for men (899 | 10.9%) and $2,500 to $4,999 for women (1,290 | 12.8%).
| Income | Male | Female |
| $2,499 or less | 633 (7.7%) | 1,282 (12.8%) |
| $2,500 to $4,999 | 568 (6.9%) | 1,290 (12.8%) |
| $5,000 to $7,499 | 899 (10.9%) | 1,268 (12.6%) |
| $7,500 to $9,999 | 399 (4.8%) | 1,119 (11.1%) |
| $10,000 to $12,499 | 499 (6.0%) | 697 (6.9%) |
| $12,500 to $14,999 | 637 (7.7%) | 308 (3.1%) |
| $15,000 to $17,499 | 371 (4.5%) | 339 (3.4%) |
| $17,500 to $19,999 | 160 (1.9%) | 238 (2.4%) |
| $20,000 to $22,499 | 334 (4.1%) | 369 (3.7%) |
| $22,500 to $24,999 | 404 (4.9%) | 242 (2.4%) |
| $25,000 to $29,999 | 79 (1.0%) | 386 (3.8%) |
| $30,000 to $34,999 | 355 (4.3%) | 337 (3.4%) |
| $35,000 to $39,999 | 242 (2.9%) | 396 (3.9%) |
| $40,000 to $44,999 | 217 (2.6%) | 234 (2.3%) |
| $45,000 to $49,999 | 205 (2.5%) | 225 (2.2%) |
| $50,000 to $54,999 | 176 (2.1%) | 115 (1.1%) |
| $55,000 to $64,999 | 428 (5.2%) | 413 (4.1%) |
| $65,000 to $74,999 | 346 (4.2%) | 245 (2.4%) |
| $75,000 to $99,999 | 608 (7.4%) | 445 (4.4%) |
| $100,000+ | 690 (8.4%) | 102 (1.0%) |
| Total | 8,250 (100.0%) | 10,050 (100.0%) |
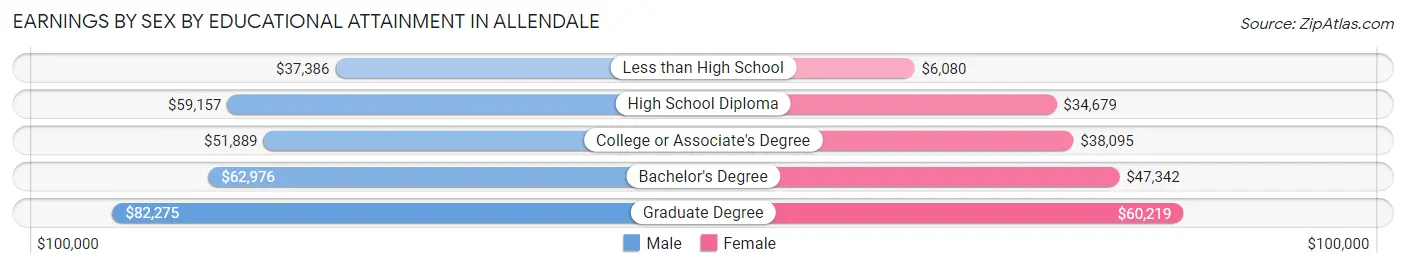
Earnings by Sex by Educational Attainment in Allendale
Average earnings in Allendale are $59,278 for men and $42,798 for women, a difference of 27.8%. Men with an educational attainment of graduate degree enjoy the highest average annual earnings of $82,275, while those with less than high school education earn the least with $37,386. Women with an educational attainment of graduate degree earn the most with the average annual earnings of $60,219, while those with less than high school education have the smallest earnings of $6,080.
| Educational Attainment | Male Income | Female Income |
| Less than High School | $37,386 | $6,080 |
| High School Diploma | $59,157 | $34,679 |
| College or Associate's Degree | $51,889 | $38,095 |
| Bachelor's Degree | $62,976 | $47,342 |
| Graduate Degree | $82,275 | $60,219 |
| Total | $59,278 | $42,798 |
Family Income in Allendale
Family Income Brackets in Allendale
According to the Allendale family income data, there are 838 families falling into the $100,000 to $149,999 income range, which is the most common income bracket and makes up 23.4% of all families. Conversely, the less than $10,000 income bracket is the least frequent group with only 32 families (0.9%) belonging to this category.
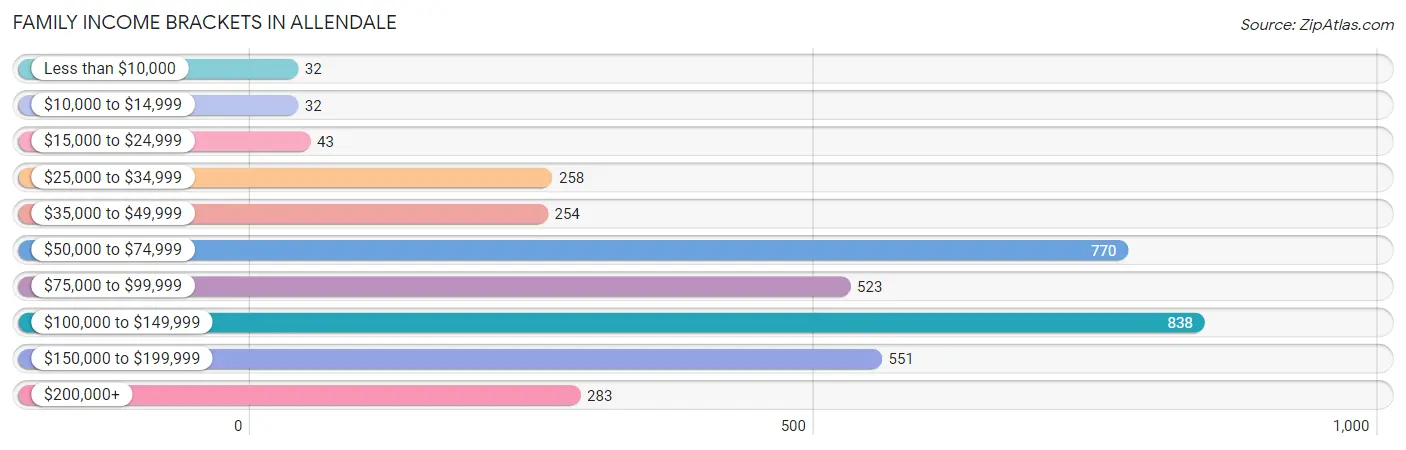
| Income Bracket | # Families | % Families |
| Less than $10,000 | 32 | 0.9% |
| $10,000 to $14,999 | 32 | 0.9% |
| $15,000 to $24,999 | 43 | 1.2% |
| $25,000 to $34,999 | 258 | 7.2% |
| $35,000 to $49,999 | 254 | 7.1% |
| $50,000 to $74,999 | 770 | 21.5% |
| $75,000 to $99,999 | 523 | 14.6% |
| $100,000 to $149,999 | 838 | 23.4% |
| $150,000 to $199,999 | 551 | 15.4% |
| $200,000+ | 283 | 7.9% |
Family Income by Famaliy Size in Allendale
5-person families (245 | 6.8%) account for the highest median family income in Allendale with $152,824 per family, while 2-person families (1,627 | 45.5%) have the highest median income of $37,938 per family member.
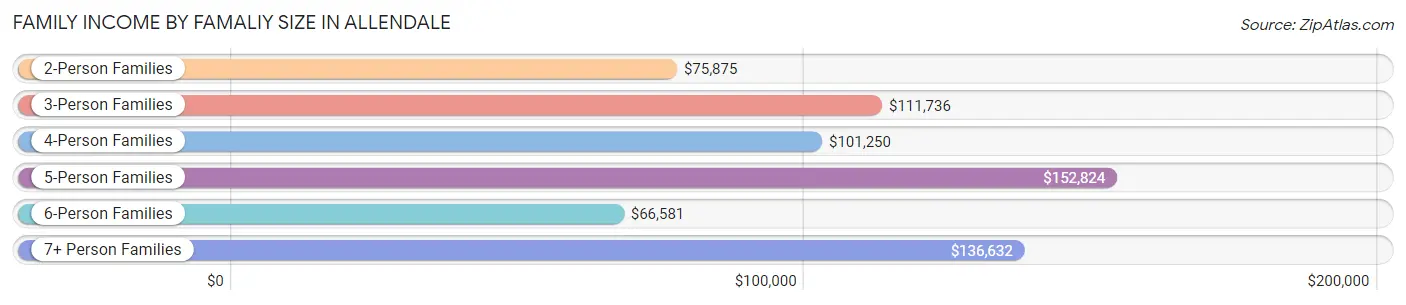
| Income Bracket | # Families | Median Income |
| 2-Person Families | 1,627 (45.5%) | $75,875 |
| 3-Person Families | 587 (16.4%) | $111,736 |
| 4-Person Families | 931 (26.0%) | $101,250 |
| 5-Person Families | 245 (6.8%) | $152,824 |
| 6-Person Families | 85 (2.4%) | $66,581 |
| 7+ Person Families | 105 (2.9%) | $136,632 |
| Total | 3,580 (100.0%) | $92,635 |
Family Income by Number of Earners in Allendale
The median family income in Allendale is $92,635, with families comprising 3+ earners (581) having the highest median family income of $136,551, while families with no earners (350) have the lowest median family income of $55,000, accounting for 16.2% and 9.8% of families, respectively.
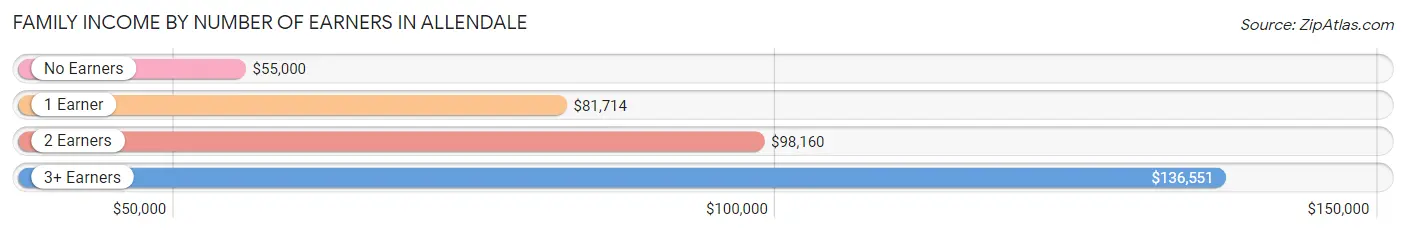
| Number of Earners | # Families | Median Income |
| No Earners | 350 (9.8%) | $55,000 |
| 1 Earner | 770 (21.5%) | $81,714 |
| 2 Earners | 1,879 (52.5%) | $98,160 |
| 3+ Earners | 581 (16.2%) | $136,551 |
| Total | 3,580 (100.0%) | $92,635 |
Household Income in Allendale
Household Income Brackets in Allendale
With 1,467 households falling in the category, the $50,000 to $74,999 income range is the most frequent in Allendale, accounting for 20.1% of all households. In contrast, only 292 households (4.0%) fall into the $200,000+ income bracket, making it the least populous group.
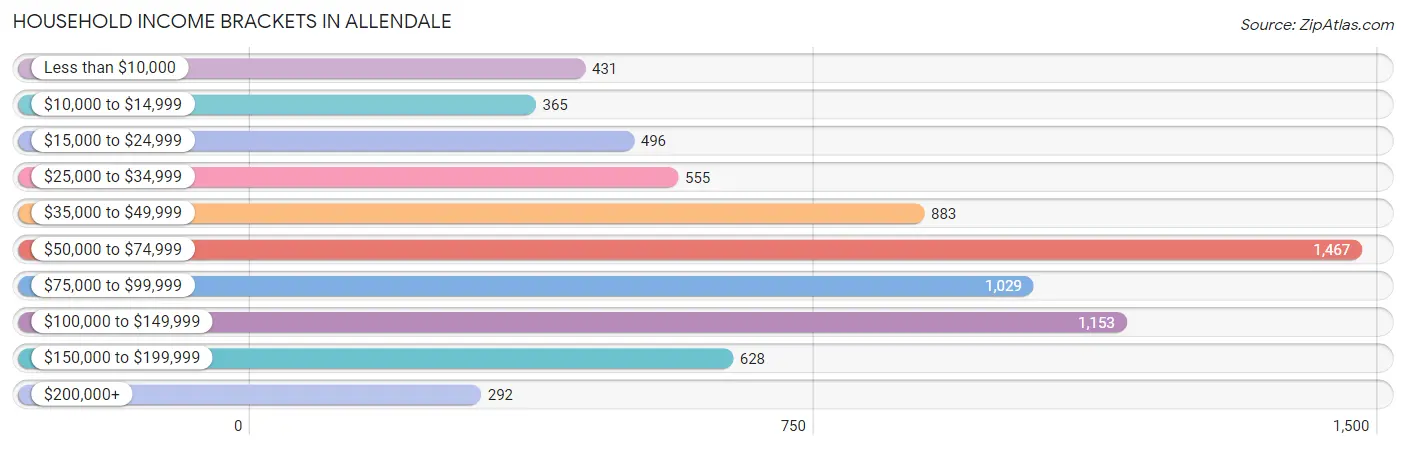
| Income Bracket | # Households | % Households |
| Less than $10,000 | 431 | 5.9% |
| $10,000 to $14,999 | 365 | 5.0% |
| $15,000 to $24,999 | 496 | 6.8% |
| $25,000 to $34,999 | 555 | 7.6% |
| $35,000 to $49,999 | 883 | 12.1% |
| $50,000 to $74,999 | 1,467 | 20.1% |
| $75,000 to $99,999 | 1,029 | 14.1% |
| $100,000 to $149,999 | 1,153 | 15.8% |
| $150,000 to $199,999 | 628 | 8.6% |
| $200,000+ | 292 | 4.0% |
Household Income by Householder Age in Allendale
The median household income in Allendale is $64,356, with the highest median household income of $107,075 found in the 45 to 64 years age bracket for the primary householder. A total of 1,750 households (24.0%) fall into this category. Meanwhile, the 15 to 24 years age bracket for the primary householder has the lowest median household income of $34,914, with 2,973 households (40.7%) in this group.
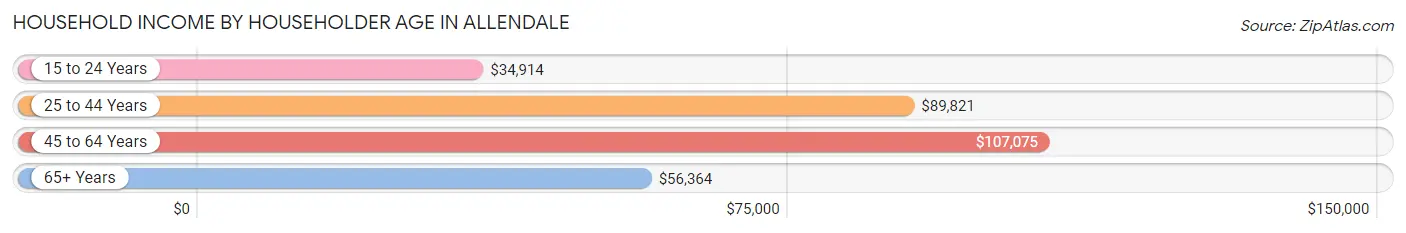
| Income Bracket | # Households | Median Income |
| 15 to 24 Years | 2,973 (40.7%) | $34,914 |
| 25 to 44 Years | 1,886 (25.9%) | $89,821 |
| 45 to 64 Years | 1,750 (24.0%) | $107,075 |
| 65+ Years | 688 (9.4%) | $56,364 |
| Total | 7,297 (100.0%) | $64,356 |
Poverty in Allendale
Income Below Poverty by Sex and Age in Allendale
With 25.6% poverty level for males and 36.1% for females among the residents of Allendale, 18 to 24 year old males and 18 to 24 year old females are the most vulnerable to poverty, with 2,218 males (53.0%) and 3,735 females (70.9%) in their respective age groups living below the poverty level.
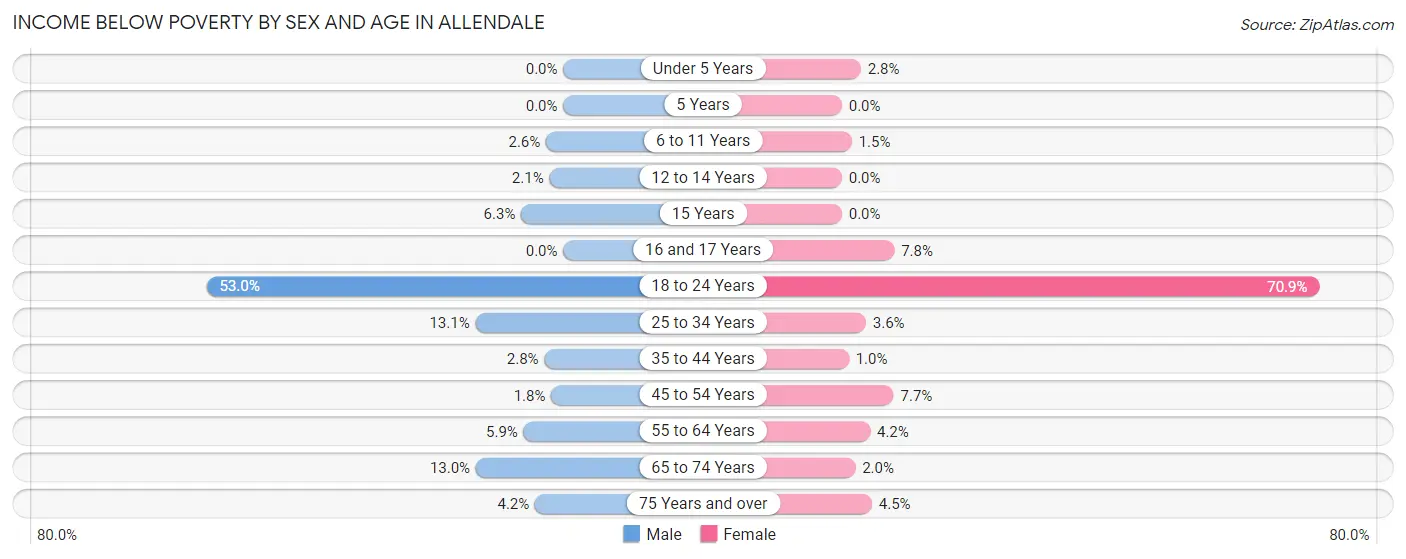
| Age Bracket | Male | Female |
| Under 5 Years | 0 (0.0%) | 15 (2.8%) |
| 5 Years | 0 (0.0%) | 0 (0.0%) |
| 6 to 11 Years | 13 (2.6%) | 6 (1.5%) |
| 12 to 14 Years | 6 (2.1%) | 0 (0.0%) |
| 15 Years | 11 (6.2%) | 0 (0.0%) |
| 16 and 17 Years | 0 (0.0%) | 19 (7.8%) |
| 18 to 24 Years | 2,218 (53.0%) | 3,735 (70.9%) |
| 25 to 34 Years | 155 (13.1%) | 38 (3.6%) |
| 35 to 44 Years | 21 (2.8%) | 8 (1.0%) |
| 45 to 54 Years | 11 (1.8%) | 53 (7.7%) |
| 55 to 64 Years | 46 (5.9%) | 37 (4.2%) |
| 65 to 74 Years | 47 (13.0%) | 9 (2.0%) |
| 75 Years and over | 8 (4.2%) | 9 (4.5%) |
| Total | 2,536 (25.6%) | 3,929 (36.1%) |
Income Above Poverty by Sex and Age in Allendale
According to the poverty statistics in Allendale, males aged under 5 years and females aged 5 years are the age groups that are most secure financially, with 100.0% of males and 100.0% of females in these age groups living above the poverty line.
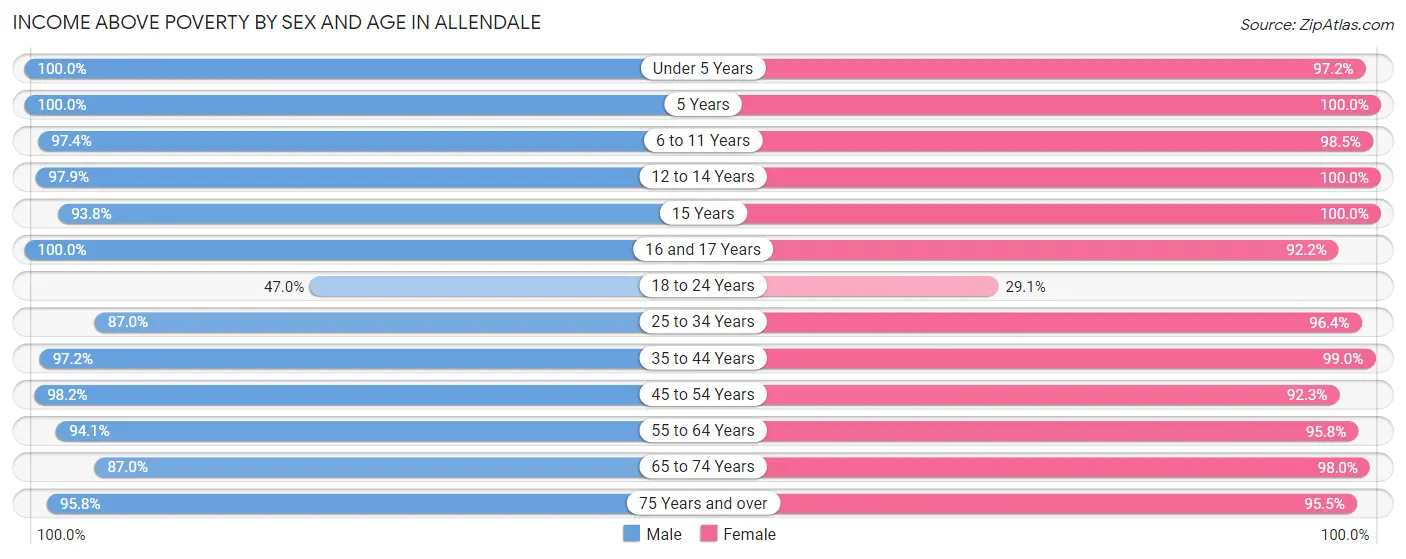
| Age Bracket | Male | Female |
| Under 5 Years | 412 (100.0%) | 516 (97.2%) |
| 5 Years | 48 (100.0%) | 51 (100.0%) |
| 6 to 11 Years | 494 (97.4%) | 402 (98.5%) |
| 12 to 14 Years | 285 (97.9%) | 279 (100.0%) |
| 15 Years | 165 (93.8%) | 42 (100.0%) |
| 16 and 17 Years | 386 (100.0%) | 225 (92.2%) |
| 18 to 24 Years | 1,968 (47.0%) | 1,533 (29.1%) |
| 25 to 34 Years | 1,033 (87.0%) | 1,027 (96.4%) |
| 35 to 44 Years | 727 (97.2%) | 766 (99.0%) |
| 45 to 54 Years | 605 (98.2%) | 636 (92.3%) |
| 55 to 64 Years | 735 (94.1%) | 847 (95.8%) |
| 65 to 74 Years | 315 (87.0%) | 444 (98.0%) |
| 75 Years and over | 183 (95.8%) | 193 (95.5%) |
| Total | 7,356 (74.4%) | 6,961 (63.9%) |
Income Below Poverty Among Married-Couple Families in Allendale
The poverty statistics for married-couple families in Allendale show that 2.5% or 67 of the total 2,662 families live below the poverty line. Families with no children have the highest poverty rate of 3.5%, comprising of 49 families. On the other hand, families with 3 or 4 children have the lowest poverty rate of 0.0%, which includes 0 families.
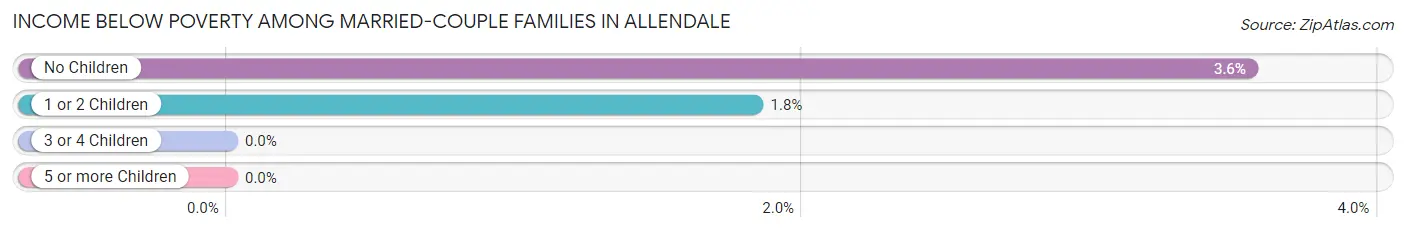
| Children | Above Poverty | Below Poverty |
| No Children | 1,333 (96.5%) | 49 (3.5%) |
| 1 or 2 Children | 964 (98.2%) | 18 (1.8%) |
| 3 or 4 Children | 269 (100.0%) | 0 (0.0%) |
| 5 or more Children | 29 (100.0%) | 0 (0.0%) |
| Total | 2,595 (97.5%) | 67 (2.5%) |
Income Below Poverty Among Single-Parent Households in Allendale
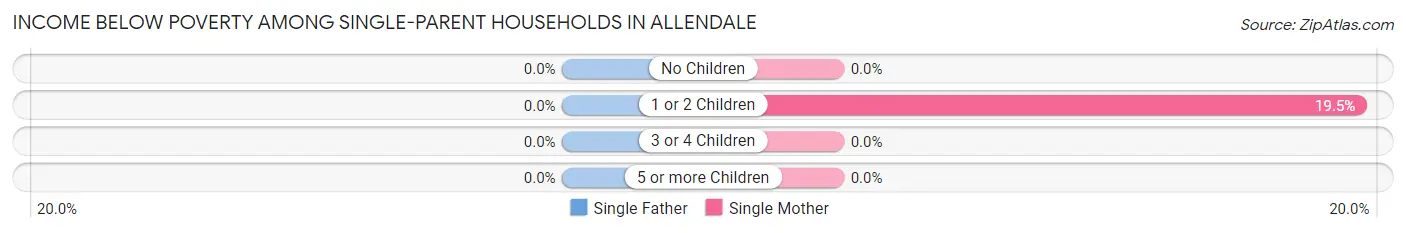
| Children | Single Father | Single Mother |
| No Children | 0 (0.0%) | 0 (0.0%) |
| 1 or 2 Children | 0 (0.0%) | 47 (19.5%) |
| 3 or 4 Children | 0 (0.0%) | 0 (0.0%) |
| 5 or more Children | 0 (0.0%) | 0 (0.0%) |
| Total | 0 (0.0%) | 47 (10.9%) |
Income Below Poverty Among Married-Couple vs Single-Parent Households in Allendale
The poverty data for Allendale shows that 67 of the married-couple family households (2.5%) and 47 of the single-parent households (5.1%) are living below the poverty level. Within the married-couple family households, those with no children have the highest poverty rate, with 49 households (3.5%) falling below the poverty line. Among the single-parent households, those with 1 or 2 children have the highest poverty rate, with 47 household (13.0%) living below poverty.
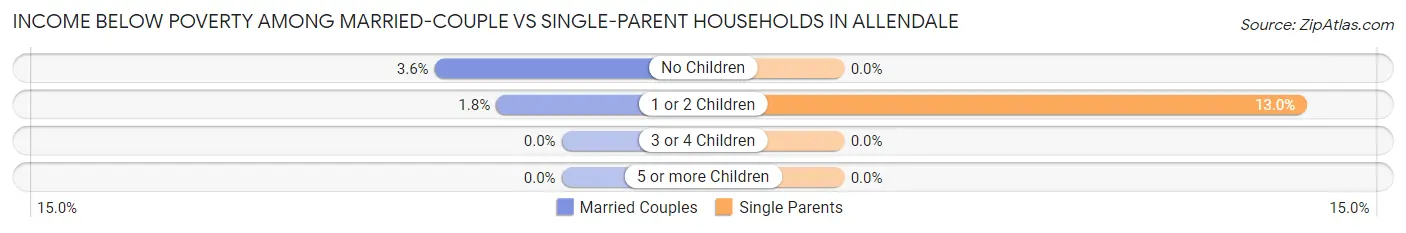
| Children | Married-Couple Families | Single-Parent Households |
| No Children | 49 (3.5%) | 0 (0.0%) |
| 1 or 2 Children | 18 (1.8%) | 47 (13.0%) |
| 3 or 4 Children | 0 (0.0%) | 0 (0.0%) |
| 5 or more Children | 0 (0.0%) | 0 (0.0%) |
| Total | 67 (2.5%) | 47 (5.1%) |
Race in Allendale
The most populous races in Allendale are White / Caucasian (22,688 | 90.0%), Hispanic or Latino (1,267 | 5.0%), and Two or more Races (1,004 | 4.0%).
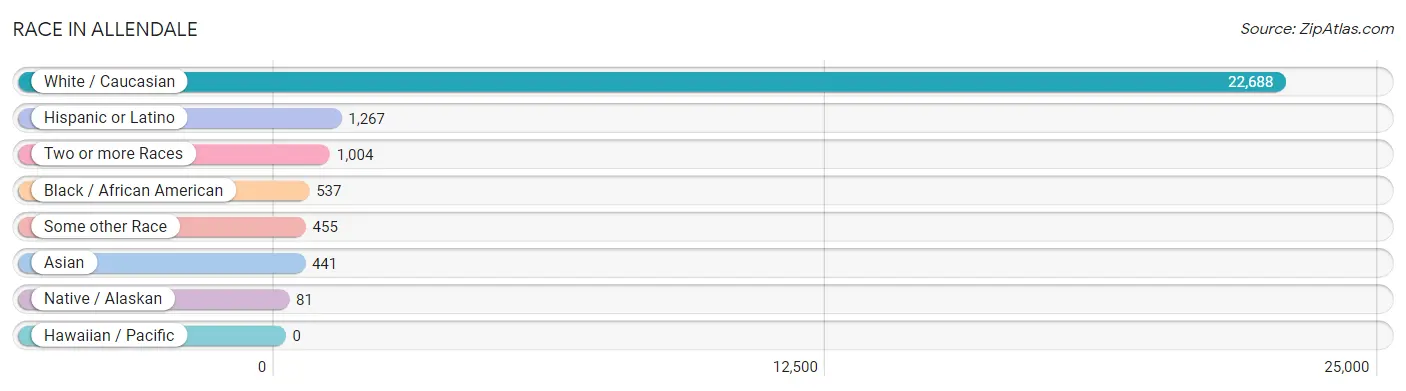
| Race | # Population | % Population |
| Asian | 441 | 1.8% |
| Black / African American | 537 | 2.1% |
| Hawaiian / Pacific | 0 | 0.0% |
| Hispanic or Latino | 1,267 | 5.0% |
| Native / Alaskan | 81 | 0.3% |
| White / Caucasian | 22,688 | 90.0% |
| Two or more Races | 1,004 | 4.0% |
| Some other Race | 455 | 1.8% |
| Total | 25,206 | 100.0% |
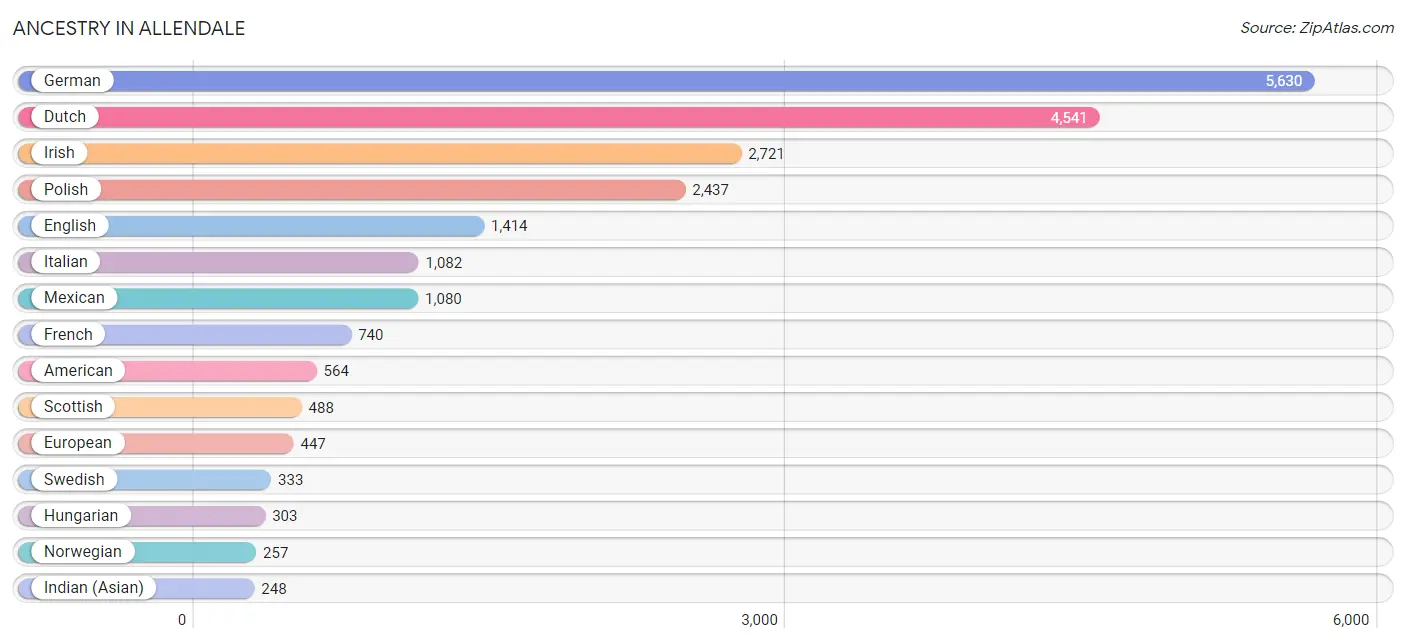
Ancestry in Allendale
The most populous ancestries reported in Allendale are German (5,630 | 22.3%), Dutch (4,541 | 18.0%), Irish (2,721 | 10.8%), Polish (2,437 | 9.7%), and English (1,414 | 5.6%), together accounting for 66.4% of all Allendale residents.
| Ancestry | # Population | % Population |
| African | 34 | 0.1% |
| Albanian | 8 | 0.0% |
| American | 564 | 2.2% |
| Arab | 61 | 0.2% |
| Assyrian / Chaldean / Syriac | 5 | 0.0% |
| Austrian | 47 | 0.2% |
| Belgian | 77 | 0.3% |
| Bhutanese | 60 | 0.2% |
| British | 114 | 0.4% |
| Bulgarian | 48 | 0.2% |
| Burmese | 80 | 0.3% |
| Canadian | 91 | 0.4% |
| Central American | 49 | 0.2% |
| Central American Indian | 13 | 0.1% |
| Chippewa | 76 | 0.3% |
| Creek | 11 | 0.0% |
| Croatian | 69 | 0.3% |
| Cuban | 4 | 0.0% |
| Czech | 134 | 0.5% |
| Czechoslovakian | 25 | 0.1% |
| Danish | 164 | 0.6% |
| Dominican | 20 | 0.1% |
| Dutch | 4,541 | 18.0% |
| Ecuadorian | 7 | 0.0% |
| English | 1,414 | 5.6% |
| Ethiopian | 6 | 0.0% |
| European | 447 | 1.8% |
| Finnish | 186 | 0.7% |
| French | 740 | 2.9% |
| French Canadian | 217 | 0.9% |
| German | 5,630 | 22.3% |
| Greek | 31 | 0.1% |
| Guatemalan | 44 | 0.2% |
| Hungarian | 303 | 1.2% |
| Indian (Asian) | 248 | 1.0% |
| Irish | 2,721 | 10.8% |
| Italian | 1,082 | 4.3% |
| Kenyan | 6 | 0.0% |
| Korean | 71 | 0.3% |
| Laotian | 19 | 0.1% |
| Latvian | 21 | 0.1% |
| Lebanese | 43 | 0.2% |
| Lithuanian | 81 | 0.3% |
| Malaysian | 6 | 0.0% |
| Maltese | 30 | 0.1% |
| Mexican | 1,080 | 4.3% |
| Mexican American Indian | 49 | 0.2% |
| Mongolian | 4 | 0.0% |
| Moroccan | 15 | 0.1% |
| Nigerian | 34 | 0.1% |
| Northern European | 86 | 0.3% |
| Norwegian | 257 | 1.0% |
| Ottawa | 6 | 0.0% |
| Pakistani | 162 | 0.6% |
| Polish | 2,437 | 9.7% |
| Potawatomi | 18 | 0.1% |
| Puerto Rican | 27 | 0.1% |
| Romanian | 26 | 0.1% |
| Russian | 120 | 0.5% |
| Scandinavian | 47 | 0.2% |
| Scotch-Irish | 222 | 0.9% |
| Scottish | 488 | 1.9% |
| Serbian | 3 | 0.0% |
| Slovak | 20 | 0.1% |
| South American | 30 | 0.1% |
| Spaniard | 8 | 0.0% |
| Spanish | 45 | 0.2% |
| Sri Lankan | 54 | 0.2% |
| Subsaharan African | 74 | 0.3% |
| Swedish | 333 | 1.3% |
| Swiss | 26 | 0.1% |
| Thai | 90 | 0.4% |
| Turkish | 74 | 0.3% |
| Ukrainian | 79 | 0.3% |
| Venezuelan | 23 | 0.1% |
| Welsh | 77 | 0.3% | View All 76 Rows |
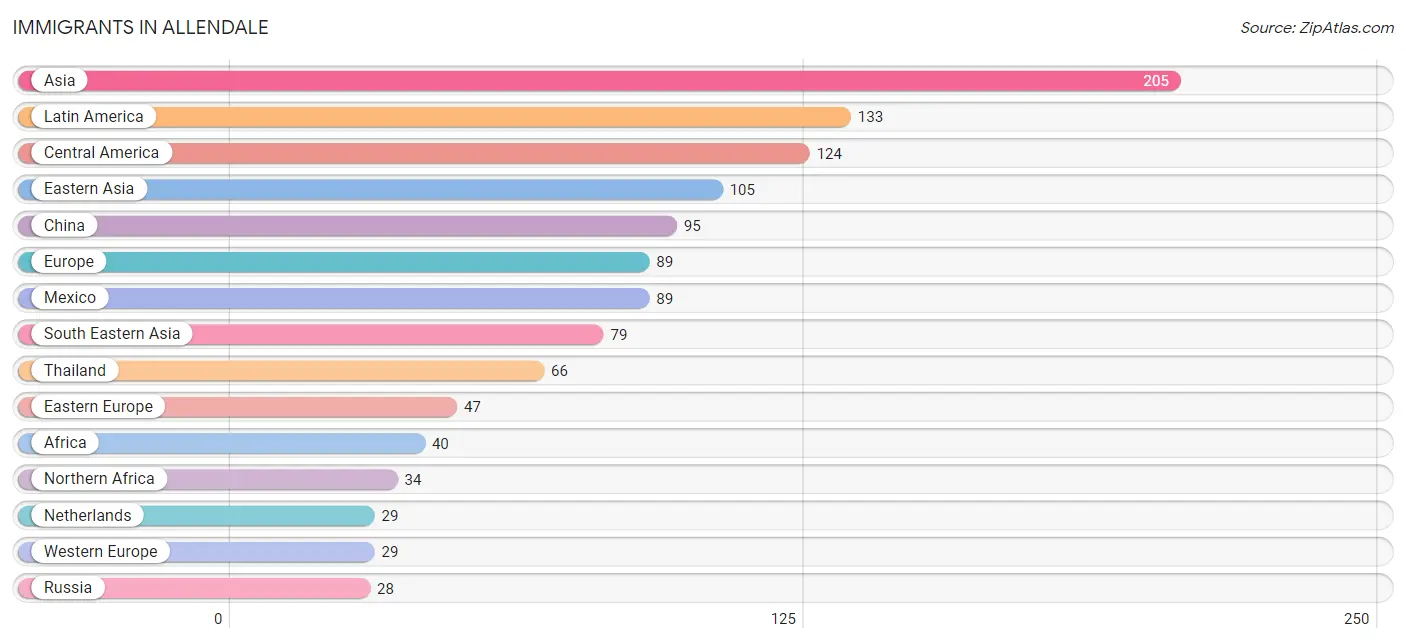
Immigrants in Allendale
The most numerous immigrant groups reported in Allendale came from Asia (205 | 0.8%), Latin America (133 | 0.5%), Central America (124 | 0.5%), Eastern Asia (105 | 0.4%), and China (95 | 0.4%), together accounting for 2.6% of all Allendale residents.
| Immigration Origin | # Population | % Population |
| Africa | 40 | 0.2% |
| Asia | 205 | 0.8% |
| Brazil | 4 | 0.0% |
| Canada | 15 | 0.1% |
| Central America | 124 | 0.5% |
| China | 95 | 0.4% |
| Eastern Africa | 6 | 0.0% |
| Eastern Asia | 105 | 0.4% |
| Eastern Europe | 47 | 0.2% |
| Ethiopia | 6 | 0.0% |
| Europe | 89 | 0.4% |
| Guatemala | 20 | 0.1% |
| Honduras | 10 | 0.0% |
| India | 16 | 0.1% |
| Iraq | 3 | 0.0% |
| Korea | 10 | 0.0% |
| Latin America | 133 | 0.5% |
| Mexico | 89 | 0.4% |
| Netherlands | 29 | 0.1% |
| Northern Africa | 34 | 0.1% |
| Northern Europe | 13 | 0.1% |
| Pakistan | 2 | 0.0% |
| Poland | 19 | 0.1% |
| Russia | 28 | 0.1% |
| Scotland | 4 | 0.0% |
| South America | 9 | 0.0% |
| South Central Asia | 18 | 0.1% |
| South Eastern Asia | 79 | 0.3% |
| Sweden | 1 | 0.0% |
| Thailand | 66 | 0.3% |
| Venezuela | 5 | 0.0% |
| Vietnam | 7 | 0.0% |
| Western Asia | 3 | 0.0% |
| Western Europe | 29 | 0.1% | View All 34 Rows |
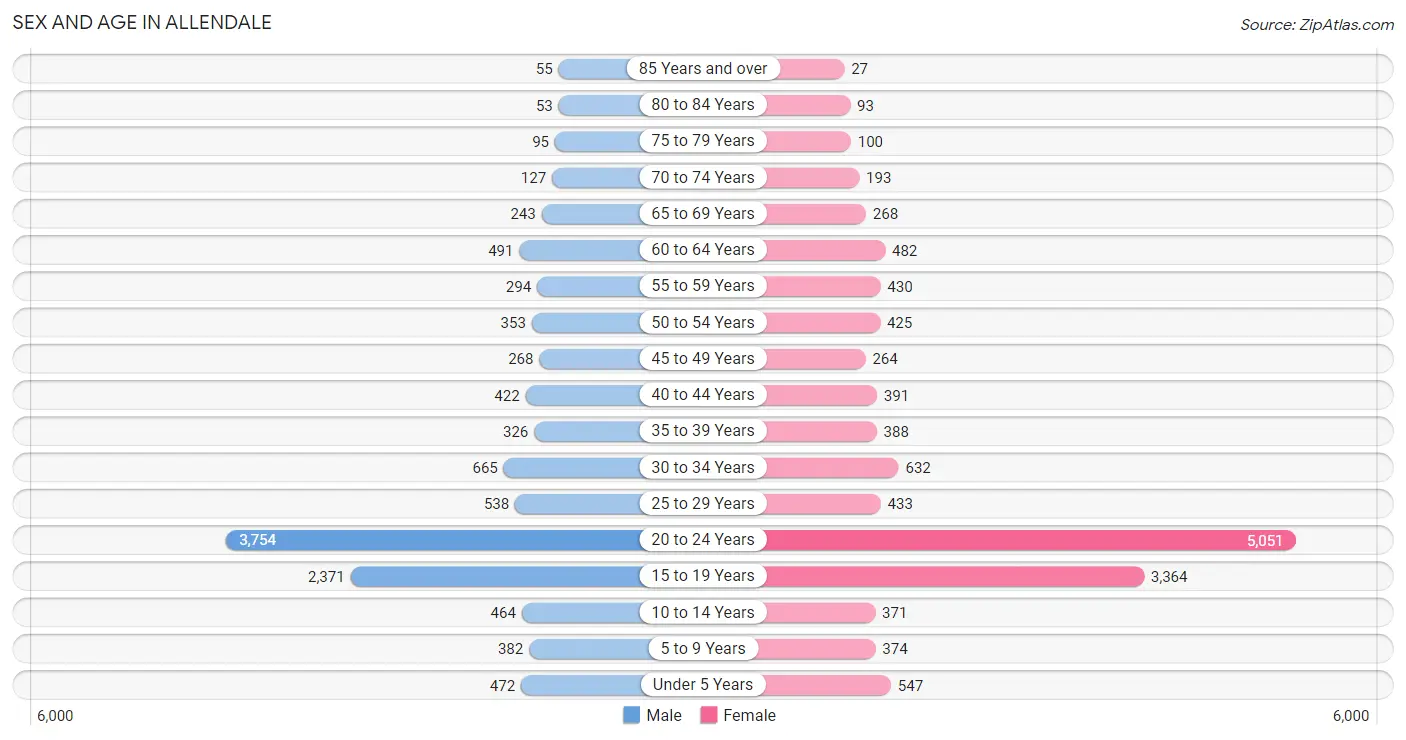
Sex and Age in Allendale
Sex and Age in Allendale
The most populous age groups in Allendale are 20 to 24 Years (3,754 | 33.0%) for men and 20 to 24 Years (5,051 | 36.5%) for women.
| Age Bracket | Male | Female |
| Under 5 Years | 472 (4.2%) | 547 (4.0%) |
| 5 to 9 Years | 382 (3.4%) | 374 (2.7%) |
| 10 to 14 Years | 464 (4.1%) | 371 (2.7%) |
| 15 to 19 Years | 2,371 (20.8%) | 3,364 (24.3%) |
| 20 to 24 Years | 3,754 (33.0%) | 5,051 (36.5%) |
| 25 to 29 Years | 538 (4.7%) | 433 (3.1%) |
| 30 to 34 Years | 665 (5.9%) | 632 (4.6%) |
| 35 to 39 Years | 326 (2.9%) | 388 (2.8%) |
| 40 to 44 Years | 422 (3.7%) | 391 (2.8%) |
| 45 to 49 Years | 268 (2.4%) | 264 (1.9%) |
| 50 to 54 Years | 353 (3.1%) | 425 (3.1%) |
| 55 to 59 Years | 294 (2.6%) | 430 (3.1%) |
| 60 to 64 Years | 491 (4.3%) | 482 (3.5%) |
| 65 to 69 Years | 243 (2.1%) | 268 (1.9%) |
| 70 to 74 Years | 127 (1.1%) | 193 (1.4%) |
| 75 to 79 Years | 95 (0.8%) | 100 (0.7%) |
| 80 to 84 Years | 53 (0.5%) | 93 (0.7%) |
| 85 Years and over | 55 (0.5%) | 27 (0.2%) |
| Total | 11,373 (100.0%) | 13,833 (100.0%) |
Families and Households in Allendale
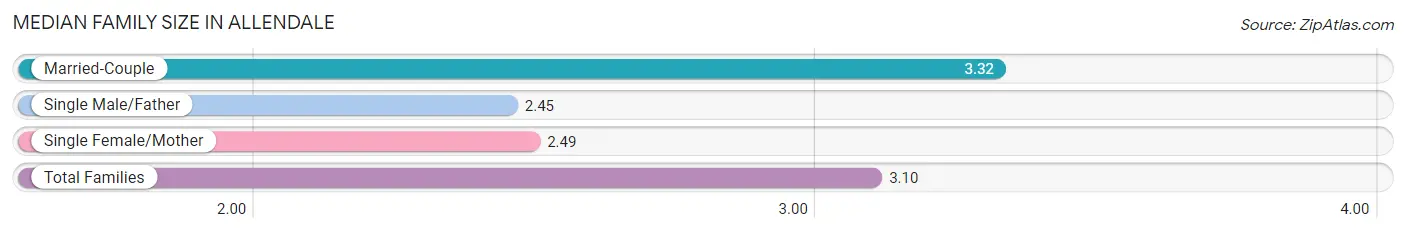
Median Family Size in Allendale
The median family size in Allendale is 3.10 persons per family, with married-couple families (2,662 | 74.4%) accounting for the largest median family size of 3.32 persons per family. On the other hand, single male/father families (487 | 13.6%) represent the smallest median family size with 2.45 persons per family.
| Family Type | # Families | Family Size |
| Married-Couple | 2,662 (74.4%) | 3.32 |
| Single Male/Father | 487 (13.6%) | 2.45 |
| Single Female/Mother | 431 (12.0%) | 2.49 |
| Total Families | 3,580 (100.0%) | 3.10 |
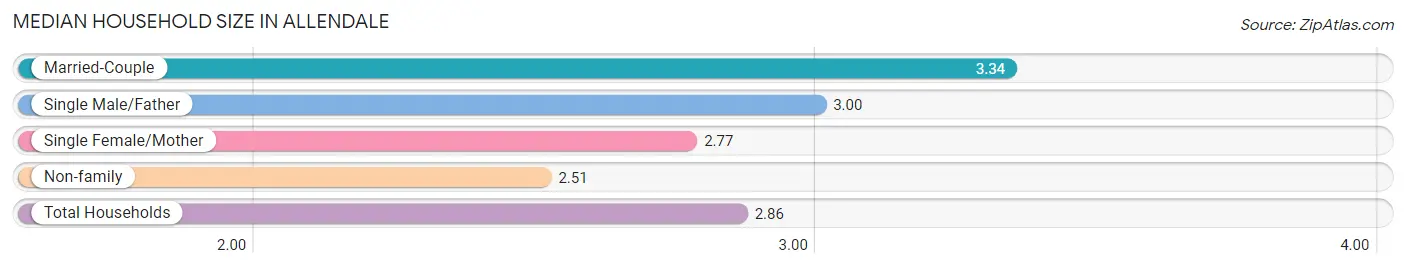
Median Household Size in Allendale
The median household size in Allendale is 2.86 persons per household, with married-couple households (2,662 | 36.5%) accounting for the largest median household size of 3.34 persons per household. non-family households (3,717 | 50.9%) represent the smallest median household size with 2.51 persons per household.
| Household Type | # Households | Household Size |
| Married-Couple | 2,662 (36.5%) | 3.34 |
| Single Male/Father | 487 (6.7%) | 3.00 |
| Single Female/Mother | 431 (5.9%) | 2.77 |
| Non-family | 3,717 (50.9%) | 2.51 |
| Total Households | 7,297 (100.0%) | 2.86 |
Household Size by Marriage Status in Allendale
Out of a total of 7,297 households in Allendale, 3,580 (49.1%) are family households, while 3,717 (50.9%) are nonfamily households. The most numerous type of family households are 2-person households, comprising 1,288, and the most common type of nonfamily households are 4-person households, comprising 1,383.
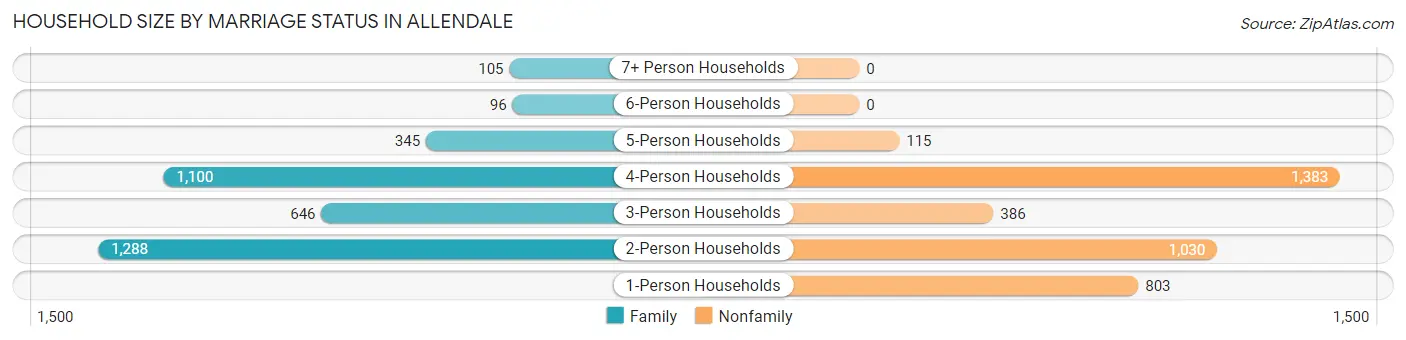
| Household Size | Family Households | Nonfamily Households |
| 1-Person Households | - | 803 (11.0%) |
| 2-Person Households | 1,288 (17.6%) | 1,030 (14.1%) |
| 3-Person Households | 646 (8.8%) | 386 (5.3%) |
| 4-Person Households | 1,100 (15.1%) | 1,383 (19.0%) |
| 5-Person Households | 345 (4.7%) | 115 (1.6%) |
| 6-Person Households | 96 (1.3%) | 0 (0.0%) |
| 7+ Person Households | 105 (1.4%) | 0 (0.0%) |
| Total | 3,580 (49.1%) | 3,717 (50.9%) |
Female Fertility in Allendale
Fertility by Age in Allendale
Average fertility rate in Allendale is 19.0 births per 1,000 women. Women in the age bracket of 20 to 34 years have the highest fertility rate with 33.0 births per 1,000 women. Women in the age bracket of 20 to 34 years acount for 100.0% of all women with births.
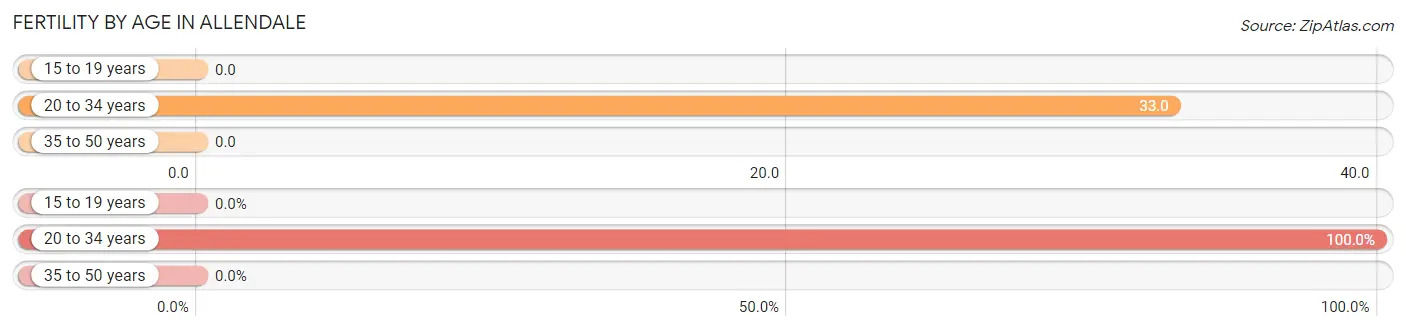
| Age Bracket | Women with Births | Births / 1,000 Women |
| 15 to 19 years | 0 (0.0%) | 0.0 |
| 20 to 34 years | 202 (100.0%) | 33.0 |
| 35 to 50 years | 0 (0.0%) | 0.0 |
| Total | 202 (100.0%) | 19.0 |
Fertility by Age by Marriage Status in Allendale
79.7% of women with births (202) in Allendale are married. The highest percentage of unmarried women with births falls into 20 to 34 years age bracket with 20.3% of them unmarried at the time of birth, while the lowest percentage of unmarried women with births belong to 20 to 34 years age bracket with 20.3% of them unmarried.
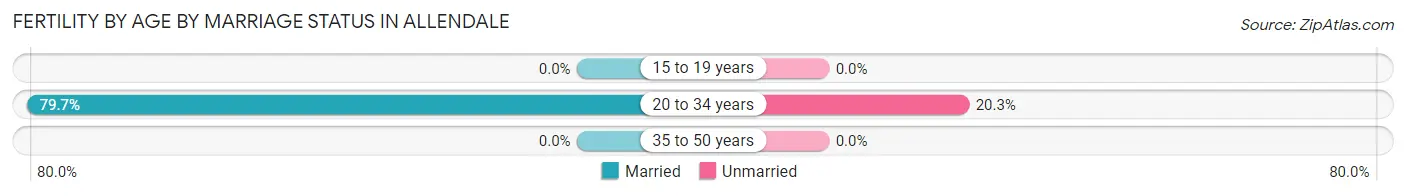
| Age Bracket | Married | Unmarried |
| 15 to 19 years | 0 (0.0%) | 0 (0.0%) |
| 20 to 34 years | 161 (79.7%) | 41 (20.3%) |
| 35 to 50 years | 0 (0.0%) | 0 (0.0%) |
| Total | 161 (79.7%) | 41 (20.3%) |
Fertility by Education in Allendale
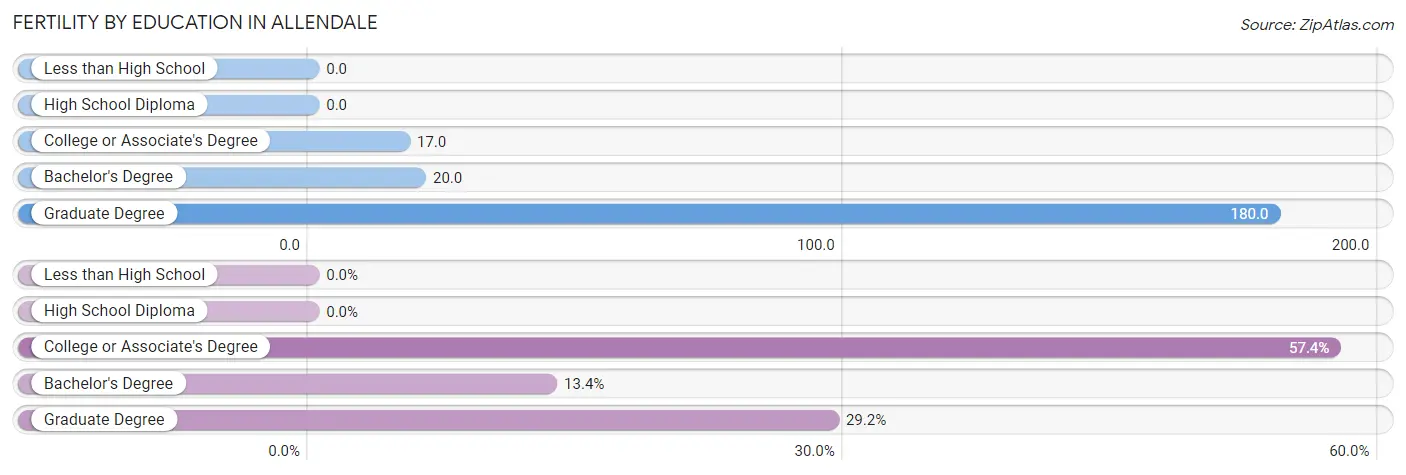
| Educational Attainment | Women with Births | Births / 1,000 Women |
| Less than High School | 0 (0.0%) | 0.0 |
| High School Diploma | 0 (0.0%) | 0.0 |
| College or Associate's Degree | 116 (57.4%) | 17.0 |
| Bachelor's Degree | 27 (13.4%) | 20.0 |
| Graduate Degree | 59 (29.2%) | 180.0 |
| Total | 202 (100.0%) | 19.0 |
Fertility by Education by Marriage Status in Allendale
20.3% of women with births in Allendale are unmarried. Women with the educational attainment of bachelor's degree are most likely to be married with 100.0% of them married at childbirth, while women with the educational attainment of graduate degree are least likely to be married with 28.8% of them unmarried at childbirth.
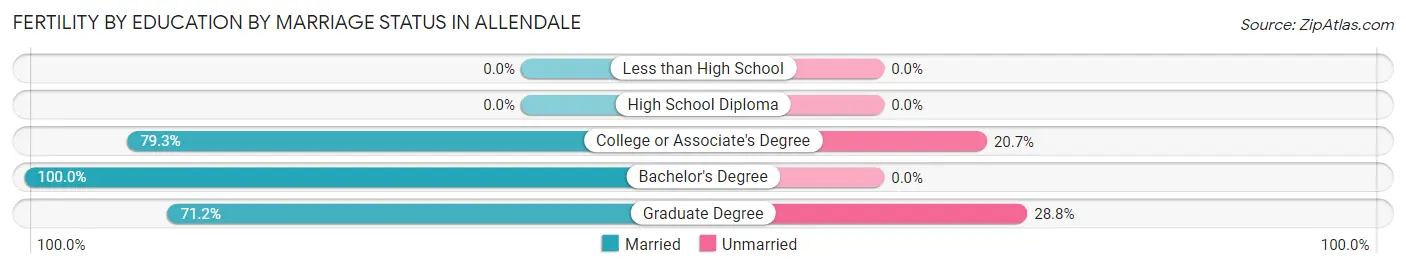
| Educational Attainment | Married | Unmarried |
| Less than High School | 0 (0.0%) | 0 (0.0%) |
| High School Diploma | 0 (0.0%) | 0 (0.0%) |
| College or Associate's Degree | 92 (79.3%) | 24 (20.7%) |
| Bachelor's Degree | 27 (100.0%) | 0 (0.0%) |
| Graduate Degree | 42 (71.2%) | 17 (28.8%) |
| Total | 161 (79.7%) | 41 (20.3%) |
Employment Characteristics in Allendale
Employment by Class of Employer in Allendale
Among the 13,678 employed individuals in Allendale, private company employees (9,912 | 72.5%), not-for-profit organizations (1,716 | 12.6%), and state government employees (649 | 4.7%) make up the most common classes of employment.
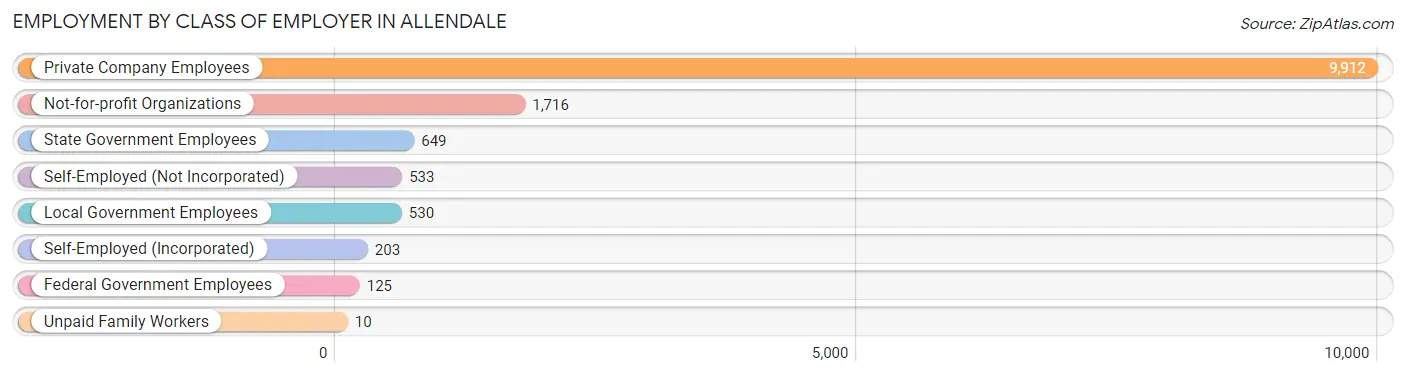
| Employer Class | # Employees | % Employees |
| Private Company Employees | 9,912 | 72.5% |
| Self-Employed (Incorporated) | 203 | 1.5% |
| Self-Employed (Not Incorporated) | 533 | 3.9% |
| Not-for-profit Organizations | 1,716 | 12.6% |
| Local Government Employees | 530 | 3.9% |
| State Government Employees | 649 | 4.7% |
| Federal Government Employees | 125 | 0.9% |
| Unpaid Family Workers | 10 | 0.1% |
| Total | 13,678 | 100.0% |
Employment Status by Age in Allendale
According to the labor force statistics for Allendale, out of the total population over 16 years of age (22,378), 68.3% or 15,284 individuals are in the labor force, with 7.5% or 1,146 of them unemployed. The age group with the highest labor force participation rate is 45 to 54 years, with 93.8% or 1,229 individuals in the labor force. Within the labor force, the 16 to 19 years age range has the highest percentage of unemployed individuals, with 22.3% or 620 of them being unemployed.
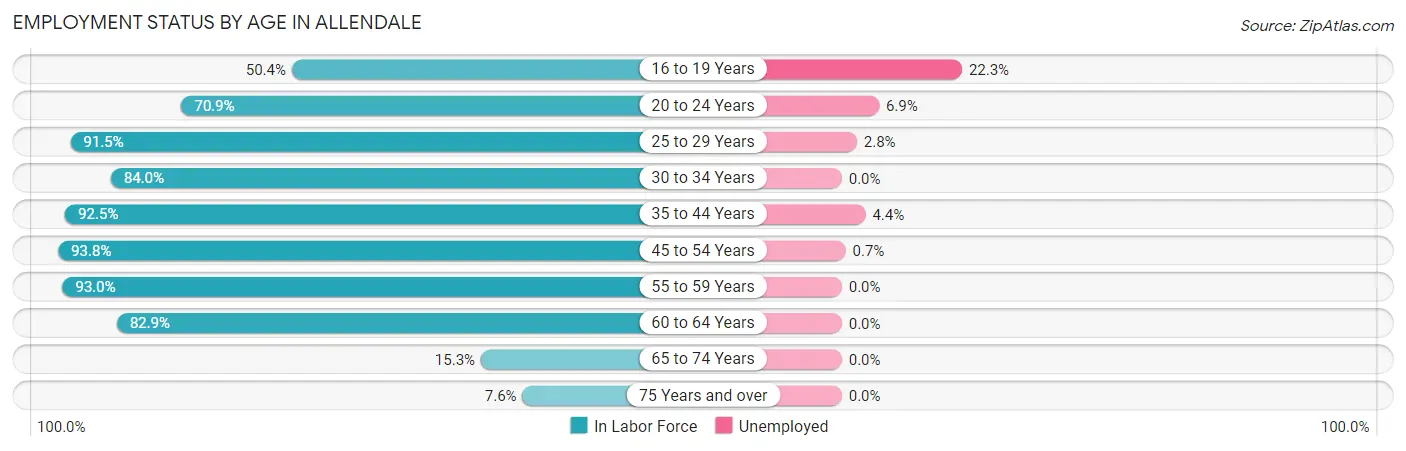
| Age Bracket | In Labor Force | Unemployed |
| 16 to 19 Years | 2,781 (50.4%) | 620 (22.3%) |
| 20 to 24 Years | 6,243 (70.9%) | 431 (6.9%) |
| 25 to 29 Years | 888 (91.5%) | 25 (2.8%) |
| 30 to 34 Years | 1,089 (84.0%) | 0 (0.0%) |
| 35 to 44 Years | 1,412 (92.5%) | 62 (4.4%) |
| 45 to 54 Years | 1,229 (93.8%) | 9 (0.7%) |
| 55 to 59 Years | 673 (93.0%) | 0 (0.0%) |
| 60 to 64 Years | 807 (82.9%) | 0 (0.0%) |
| 65 to 74 Years | 127 (15.3%) | 0 (0.0%) |
| 75 Years and over | 32 (7.6%) | 0 (0.0%) |
| Total | 15,284 (68.3%) | 1,146 (7.5%) |
Employment Status by Educational Attainment in Allendale
According to labor force statistics for Allendale, 89.7% of individuals (6,101) out of the total population between 25 and 64 years of age (6,802) are in the labor force, with 1.6% or 98 of them being unemployed. The group with the highest labor force participation rate are those with the educational attainment of bachelor's degree or higher, with 92.6% or 2,632 individuals in the labor force. Within the labor force, individuals with college / associate degree education have the highest percentage of unemployment, with 3.1% or 71 of them being unemployed.
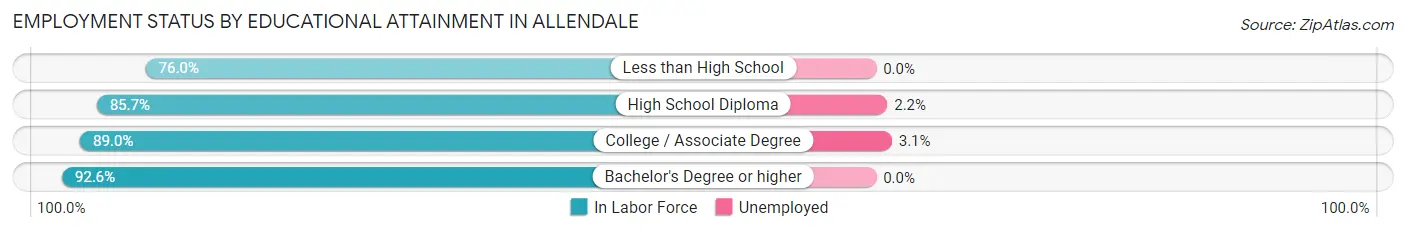
| Educational Attainment | In Labor Force | Unemployed |
| Less than High School | 98 (76.0%) | 0 (0.0%) |
| High School Diploma | 1,068 (85.7%) | 27 (2.2%) |
| College / Associate Degree | 2,301 (89.0%) | 80 (3.1%) |
| Bachelor's Degree or higher | 2,632 (92.6%) | 0 (0.0%) |
| Total | 6,101 (89.7%) | 109 (1.6%) |
Employment Occupations by Sex in Allendale
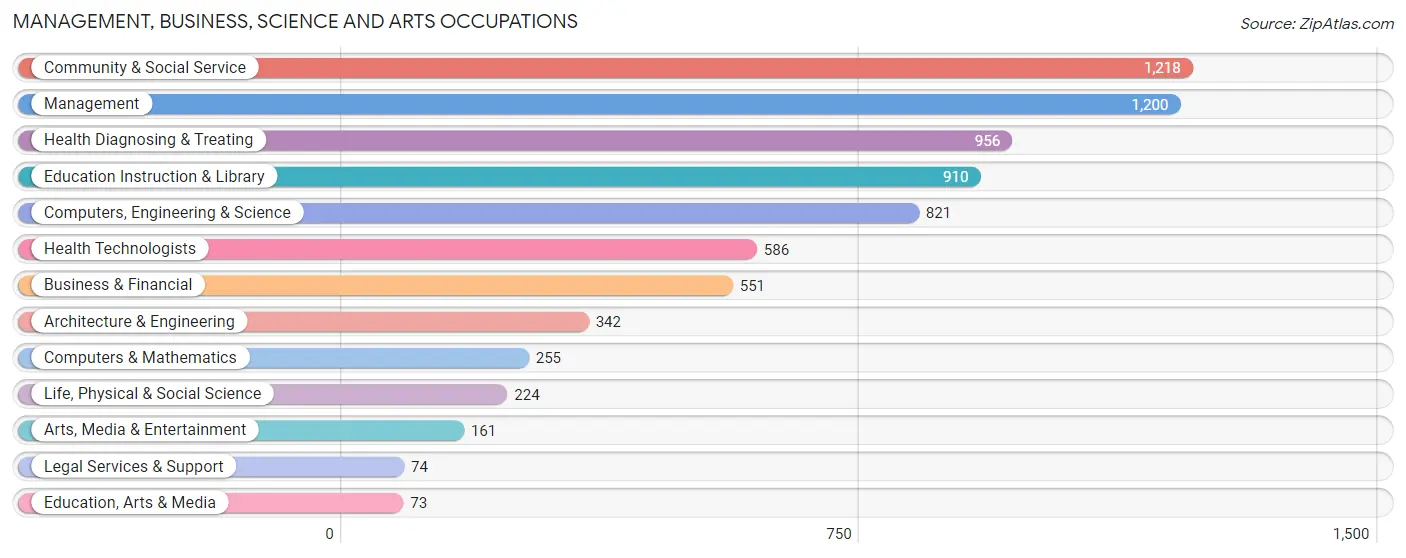
Management, Business, Science and Arts Occupations
The most common Management, Business, Science and Arts occupations in Allendale are Community & Social Service (1,218 | 8.6%), Management (1,200 | 8.5%), Health Diagnosing & Treating (956 | 6.8%), Education Instruction & Library (910 | 6.4%), and Computers, Engineering & Science (821 | 5.8%).
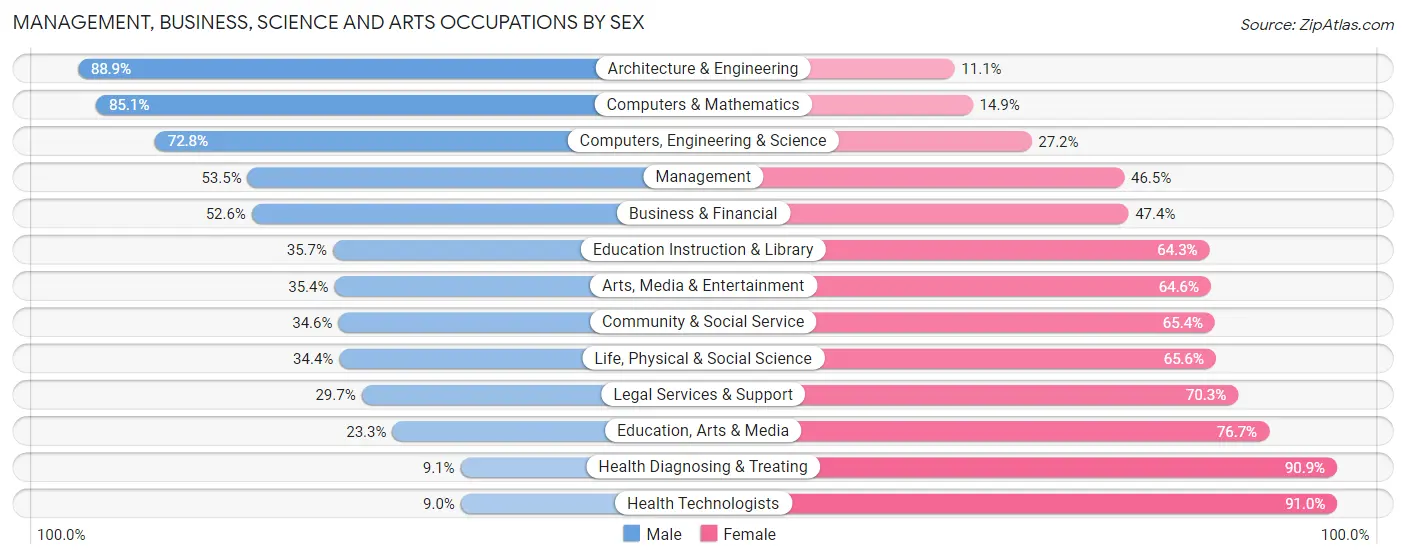
Management, Business, Science and Arts Occupations by Sex
Within the Management, Business, Science and Arts occupations in Allendale, the most male-oriented occupations are Architecture & Engineering (88.9%), Computers & Mathematics (85.1%), and Computers, Engineering & Science (72.8%), while the most female-oriented occupations are Health Technologists (91.0%), Health Diagnosing & Treating (90.9%), and Education, Arts & Media (76.7%).
| Occupation | Male | Female |
| Management | 642 (53.5%) | 558 (46.5%) |
| Business & Financial | 290 (52.6%) | 261 (47.4%) |
| Computers, Engineering & Science | 598 (72.8%) | 223 (27.2%) |
| Computers & Mathematics | 217 (85.1%) | 38 (14.9%) |
| Architecture & Engineering | 304 (88.9%) | 38 (11.1%) |
| Life, Physical & Social Science | 77 (34.4%) | 147 (65.6%) |
| Community & Social Service | 421 (34.6%) | 797 (65.4%) |
| Education, Arts & Media | 17 (23.3%) | 56 (76.7%) |
| Legal Services & Support | 22 (29.7%) | 52 (70.3%) |
| Education Instruction & Library | 325 (35.7%) | 585 (64.3%) |
| Arts, Media & Entertainment | 57 (35.4%) | 104 (64.6%) |
| Health Diagnosing & Treating | 87 (9.1%) | 869 (90.9%) |
| Health Technologists | 53 (9.0%) | 533 (91.0%) |
| Total (Category) | 2,038 (42.9%) | 2,708 (57.1%) |
| Total (Overall) | 6,243 (44.2%) | 7,895 (55.8%) |
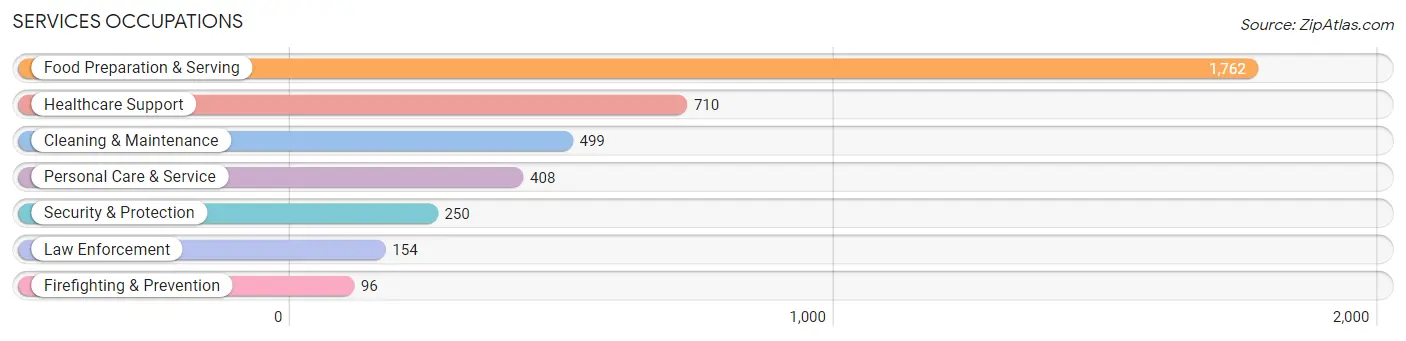
Services Occupations
The most common Services occupations in Allendale are Food Preparation & Serving (1,762 | 12.5%), Healthcare Support (710 | 5.0%), Cleaning & Maintenance (499 | 3.5%), Personal Care & Service (408 | 2.9%), and Security & Protection (250 | 1.8%).
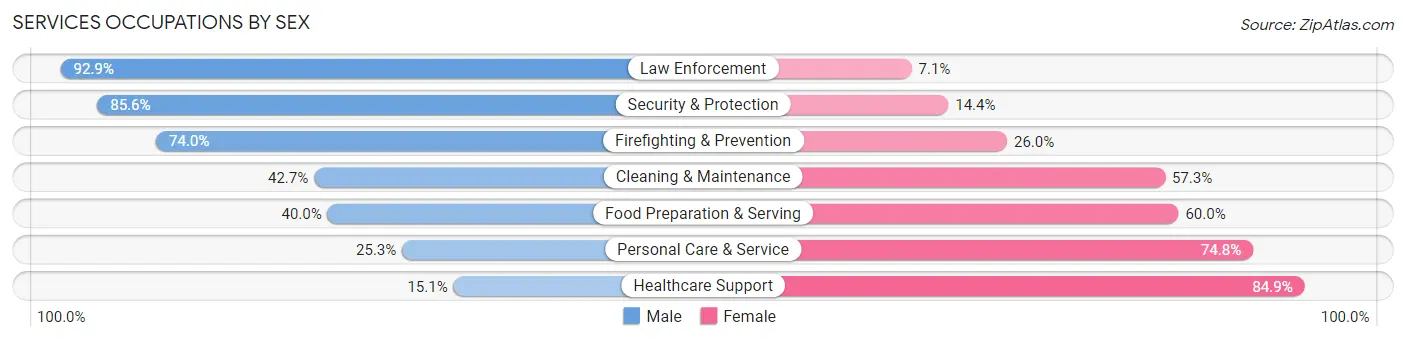
Services Occupations by Sex
Within the Services occupations in Allendale, the most male-oriented occupations are Law Enforcement (92.9%), Security & Protection (85.6%), and Firefighting & Prevention (74.0%), while the most female-oriented occupations are Healthcare Support (84.9%), Personal Care & Service (74.8%), and Food Preparation & Serving (60.0%).
| Occupation | Male | Female |
| Healthcare Support | 107 (15.1%) | 603 (84.9%) |
| Security & Protection | 214 (85.6%) | 36 (14.4%) |
| Firefighting & Prevention | 71 (74.0%) | 25 (26.0%) |
| Law Enforcement | 143 (92.9%) | 11 (7.1%) |
| Food Preparation & Serving | 705 (40.0%) | 1,057 (60.0%) |
| Cleaning & Maintenance | 213 (42.7%) | 286 (57.3%) |
| Personal Care & Service | 103 (25.3%) | 305 (74.8%) |
| Total (Category) | 1,342 (37.0%) | 2,287 (63.0%) |
| Total (Overall) | 6,243 (44.2%) | 7,895 (55.8%) |
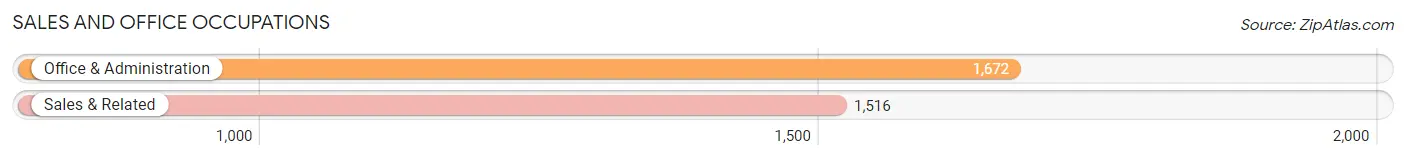
Sales and Office Occupations
The most common Sales and Office occupations in Allendale are Office & Administration (1,672 | 11.8%), and Sales & Related (1,516 | 10.7%).
Sales and Office Occupations by Sex
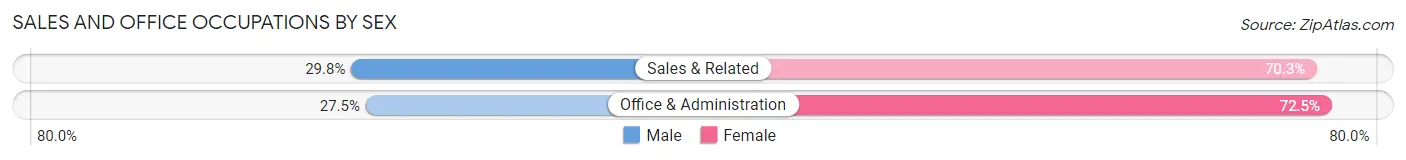
| Occupation | Male | Female |
| Sales & Related | 451 (29.7%) | 1,065 (70.3%) |
| Office & Administration | 460 (27.5%) | 1,212 (72.5%) |
| Total (Category) | 911 (28.6%) | 2,277 (71.4%) |
| Total (Overall) | 6,243 (44.2%) | 7,895 (55.8%) |
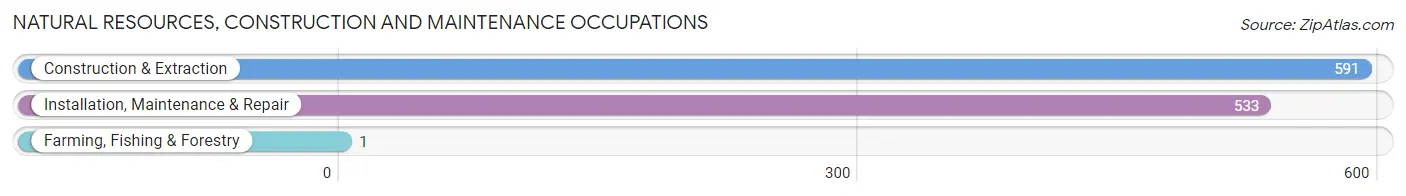
Natural Resources, Construction and Maintenance Occupations
The most common Natural Resources, Construction and Maintenance occupations in Allendale are Construction & Extraction (591 | 4.2%), Installation, Maintenance & Repair (533 | 3.8%), and Farming, Fishing & Forestry (1 | 0.0%).
Natural Resources, Construction and Maintenance Occupations by Sex
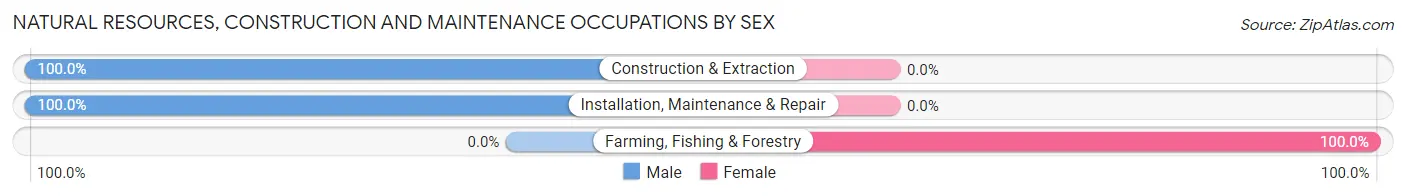
| Occupation | Male | Female |
| Farming, Fishing & Forestry | 0 (0.0%) | 1 (100.0%) |
| Construction & Extraction | 591 (100.0%) | 0 (0.0%) |
| Installation, Maintenance & Repair | 533 (100.0%) | 0 (0.0%) |
| Total (Category) | 1,124 (99.9%) | 1 (0.1%) |
| Total (Overall) | 6,243 (44.2%) | 7,895 (55.8%) |
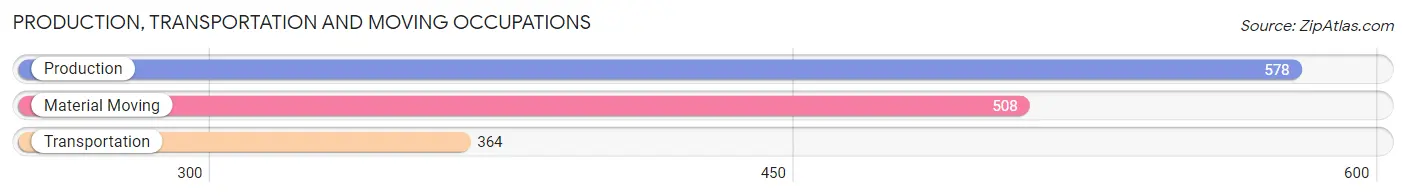
Production, Transportation and Moving Occupations
The most common Production, Transportation and Moving occupations in Allendale are Production (578 | 4.1%), Material Moving (508 | 3.6%), and Transportation (364 | 2.6%).
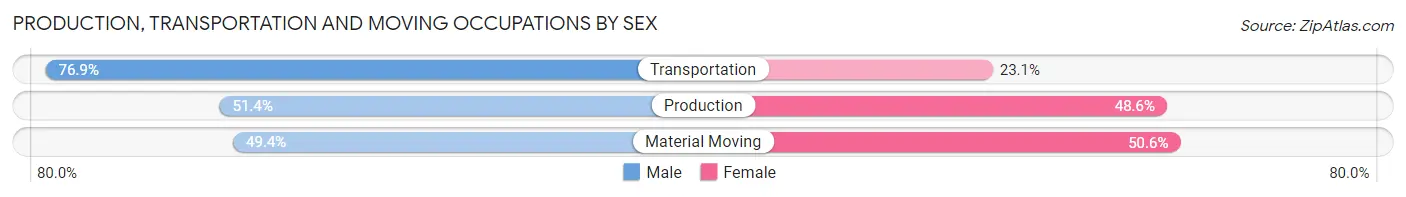
Production, Transportation and Moving Occupations by Sex
| Occupation | Male | Female |
| Production | 297 (51.4%) | 281 (48.6%) |
| Transportation | 280 (76.9%) | 84 (23.1%) |
| Material Moving | 251 (49.4%) | 257 (50.6%) |
| Total (Category) | 828 (57.1%) | 622 (42.9%) |
| Total (Overall) | 6,243 (44.2%) | 7,895 (55.8%) |
Employment Industries by Sex in Allendale
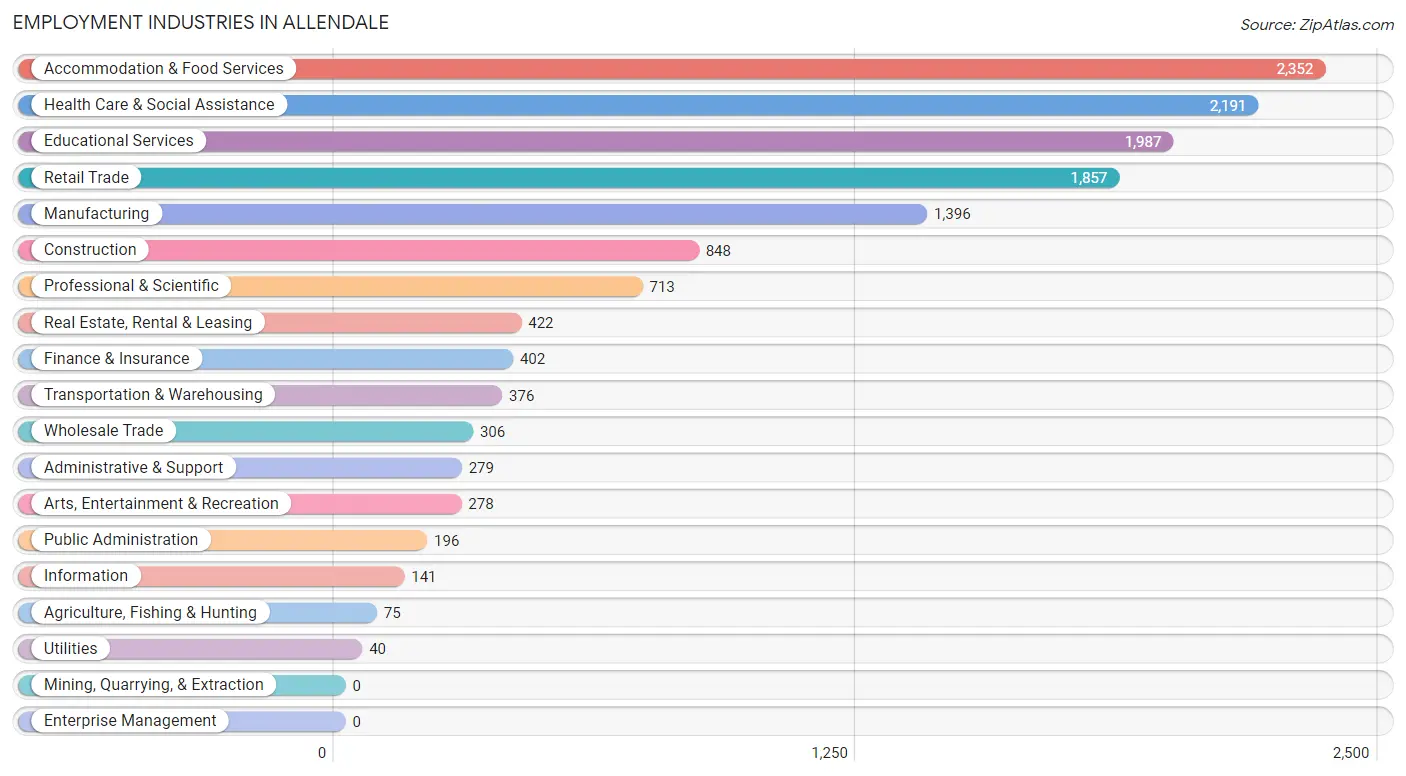
Employment Industries in Allendale
The major employment industries in Allendale include Accommodation & Food Services (2,352 | 16.6%), Health Care & Social Assistance (2,191 | 15.5%), Educational Services (1,987 | 14.1%), Retail Trade (1,857 | 13.1%), and Manufacturing (1,396 | 9.9%).
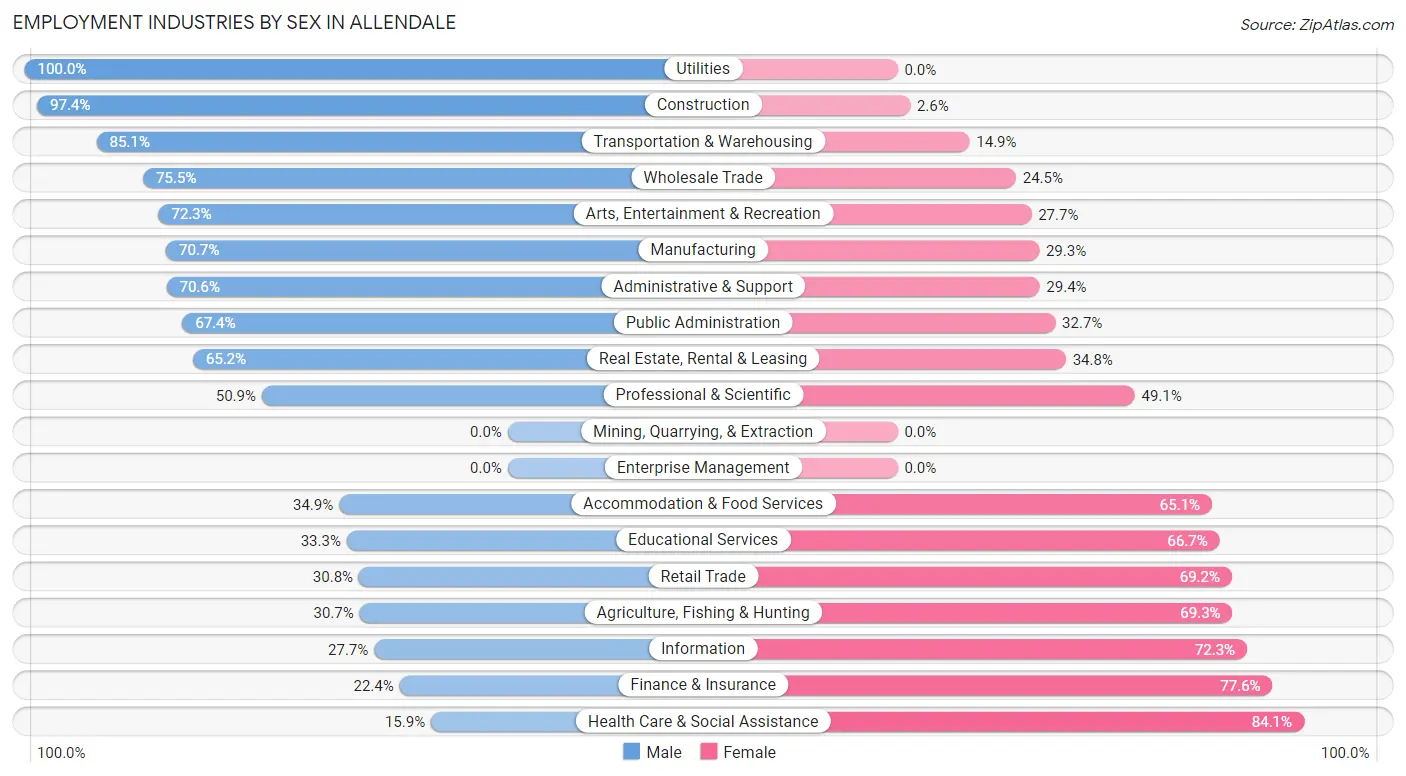
Employment Industries by Sex in Allendale
The Allendale industries that see more men than women are Utilities (100.0%), Construction (97.4%), and Transportation & Warehousing (85.1%), whereas the industries that tend to have a higher number of women are Health Care & Social Assistance (84.1%), Finance & Insurance (77.6%), and Information (72.3%).
| Industry | Male | Female |
| Agriculture, Fishing & Hunting | 23 (30.7%) | 52 (69.3%) |
| Mining, Quarrying, & Extraction | 0 (0.0%) | 0 (0.0%) |
| Construction | 826 (97.4%) | 22 (2.6%) |
| Manufacturing | 987 (70.7%) | 409 (29.3%) |
| Wholesale Trade | 231 (75.5%) | 75 (24.5%) |
| Retail Trade | 572 (30.8%) | 1,285 (69.2%) |
| Transportation & Warehousing | 320 (85.1%) | 56 (14.9%) |
| Utilities | 40 (100.0%) | 0 (0.0%) |
| Information | 39 (27.7%) | 102 (72.3%) |
| Finance & Insurance | 90 (22.4%) | 312 (77.6%) |
| Real Estate, Rental & Leasing | 275 (65.2%) | 147 (34.8%) |
| Professional & Scientific | 363 (50.9%) | 350 (49.1%) |
| Enterprise Management | 0 (0.0%) | 0 (0.0%) |
| Administrative & Support | 197 (70.6%) | 82 (29.4%) |
| Educational Services | 662 (33.3%) | 1,325 (66.7%) |
| Health Care & Social Assistance | 348 (15.9%) | 1,843 (84.1%) |
| Arts, Entertainment & Recreation | 201 (72.3%) | 77 (27.7%) |
| Accommodation & Food Services | 821 (34.9%) | 1,531 (65.1%) |
| Public Administration | 132 (67.3%) | 64 (32.7%) |
| Total | 6,243 (44.2%) | 7,895 (55.8%) |
Education in Allendale
School Enrollment in Allendale
The most common levels of schooling among the 14,757 students in Allendale are college / undergraduate (11,685 | 79.2%), high school (1,094 | 7.4%), and elementary school (662 | 4.5%).
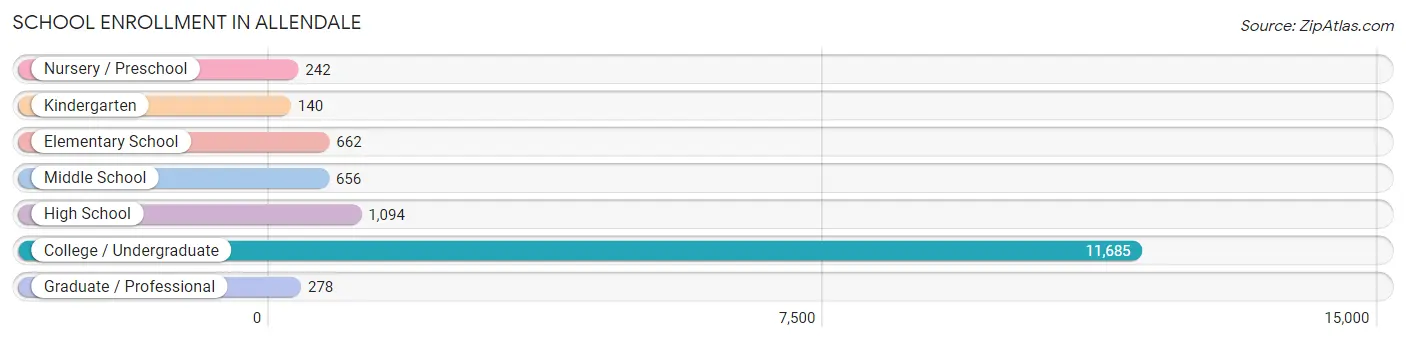
| School Level | # Students | % Students |
| Nursery / Preschool | 242 | 1.6% |
| Kindergarten | 140 | 0.9% |
| Elementary School | 662 | 4.5% |
| Middle School | 656 | 4.4% |
| High School | 1,094 | 7.4% |
| College / Undergraduate | 11,685 | 79.2% |
| Graduate / Professional | 278 | 1.9% |
| Total | 14,757 | 100.0% |
School Enrollment by Age by Funding Source in Allendale
Out of a total of 14,757 students who are enrolled in schools in Allendale, 1,845 (12.5%) attend a private institution, while the remaining 12,912 (87.5%) are enrolled in public schools. The age group of 3 to 4 year olds has the highest likelihood of being enrolled in private schools, with 95 (52.8% in the age bracket) enrolled. Conversely, the age group of 35 years and over has the lowest likelihood of being enrolled in a private school, with 126 (100.0% in the age bracket) attending a public institution.
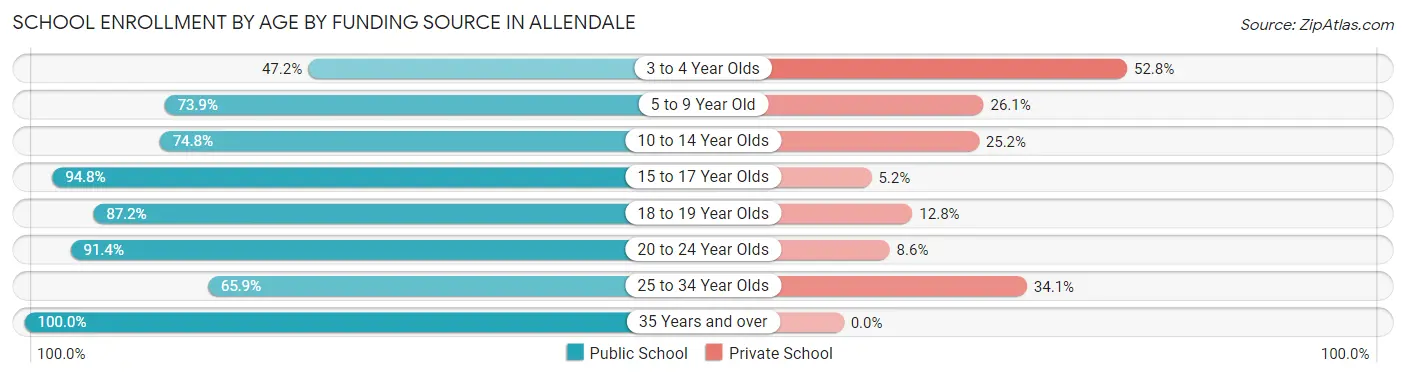
| Age Bracket | Public School | Private School |
| 3 to 4 Year Olds | 85 (47.2%) | 95 (52.8%) |
| 5 to 9 Year Old | 559 (73.9%) | 197 (26.1%) |
| 10 to 14 Year Olds | 609 (74.8%) | 205 (25.2%) |
| 15 to 17 Year Olds | 825 (94.8%) | 45 (5.2%) |
| 18 to 19 Year Olds | 3,999 (87.2%) | 587 (12.8%) |
| 20 to 24 Year Olds | 6,483 (91.4%) | 608 (8.6%) |
| 25 to 34 Year Olds | 220 (65.9%) | 114 (34.1%) |
| 35 Years and over | 126 (100.0%) | 0 (0.0%) |
| Total | 12,912 (87.5%) | 1,845 (12.5%) |
Educational Attainment by Field of Study in Allendale
Education (575 | 16.9%), science & technology (561 | 16.5%), business (525 | 15.4%), engineering (306 | 9.0%), and arts & humanities (268 | 7.9%) are the most common fields of study among 3,398 individuals in Allendale who have obtained a bachelor's degree or higher.
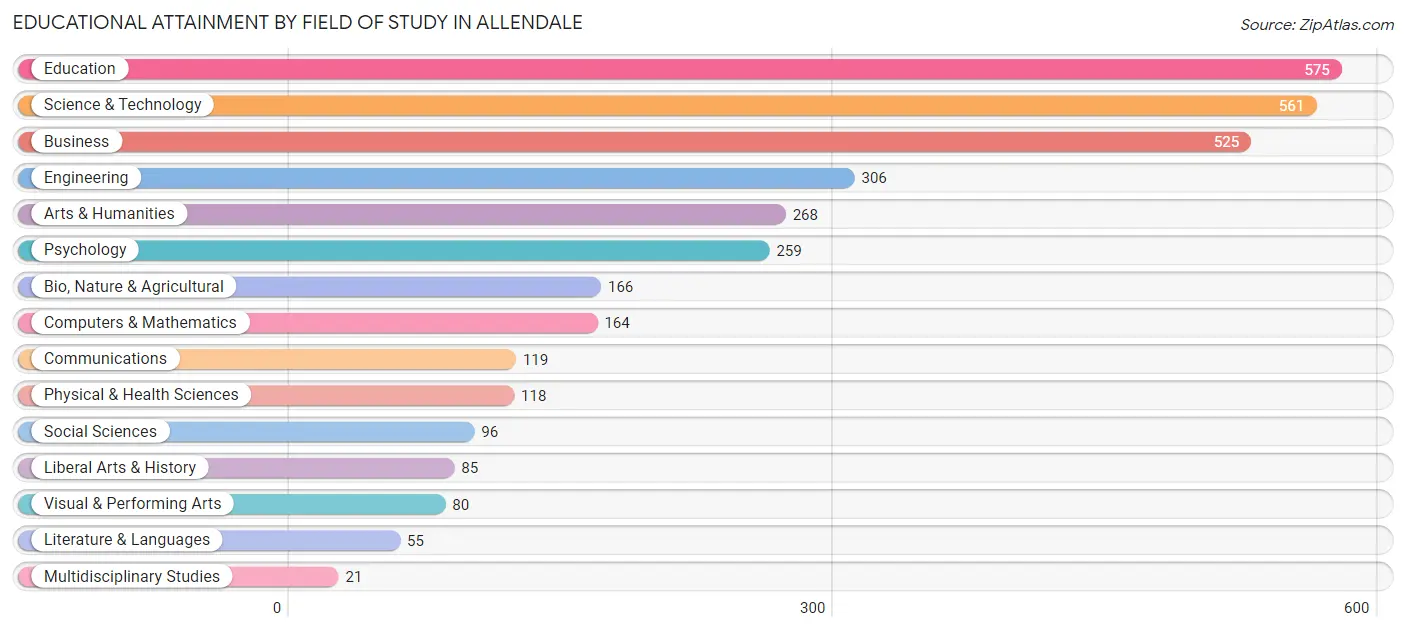
| Field of Study | # Graduates | % Graduates |
| Computers & Mathematics | 164 | 4.8% |
| Bio, Nature & Agricultural | 166 | 4.9% |
| Physical & Health Sciences | 118 | 3.5% |
| Psychology | 259 | 7.6% |
| Social Sciences | 96 | 2.8% |
| Engineering | 306 | 9.0% |
| Multidisciplinary Studies | 21 | 0.6% |
| Science & Technology | 561 | 16.5% |
| Business | 525 | 15.4% |
| Education | 575 | 16.9% |
| Literature & Languages | 55 | 1.6% |
| Liberal Arts & History | 85 | 2.5% |
| Visual & Performing Arts | 80 | 2.4% |
| Communications | 119 | 3.5% |
| Arts & Humanities | 268 | 7.9% |
| Total | 3,398 | 100.0% |
Transportation & Commute in Allendale
Vehicle Availability by Sex in Allendale
The most prevalent vehicle ownership categories in Allendale are males with 2 vehicles (2,020, accounting for 35.3%) and females with 2 vehicles (1,940, making up 31.8%).
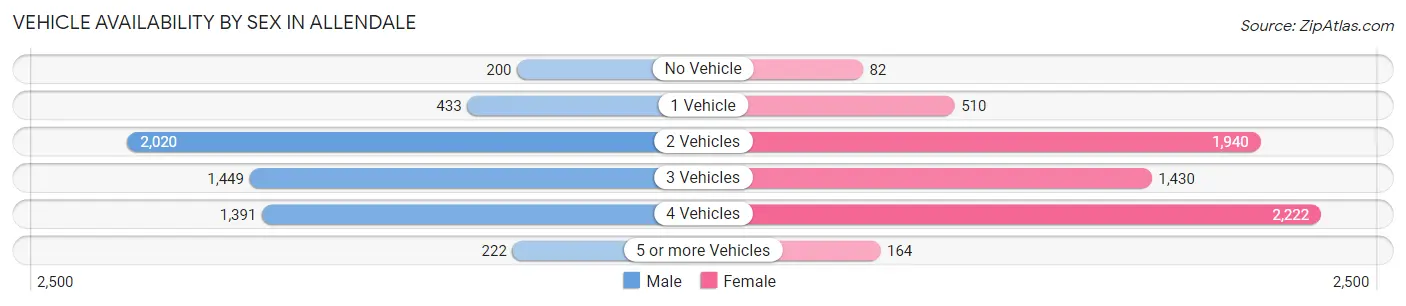
| Vehicles Available | Male | Female |
| No Vehicle | 200 (3.5%) | 82 (1.3%) |
| 1 Vehicle | 433 (7.6%) | 510 (8.0%) |
| 2 Vehicles | 2,020 (35.3%) | 1,940 (30.6%) |
| 3 Vehicles | 1,449 (25.4%) | 1,430 (22.5%) |
| 4 Vehicles | 1,391 (24.3%) | 2,222 (35.0%) |
| 5 or more Vehicles | 222 (3.9%) | 164 (2.6%) |
| Total | 5,715 (100.0%) | 6,348 (100.0%) |
Commute Time in Allendale
The most frequently occuring commute durations in Allendale are 30 to 34 minutes (2,090 commuters, 16.4%), 25 to 29 minutes (1,967 commuters, 15.5%), and 20 to 24 minutes (1,661 commuters, 13.1%).
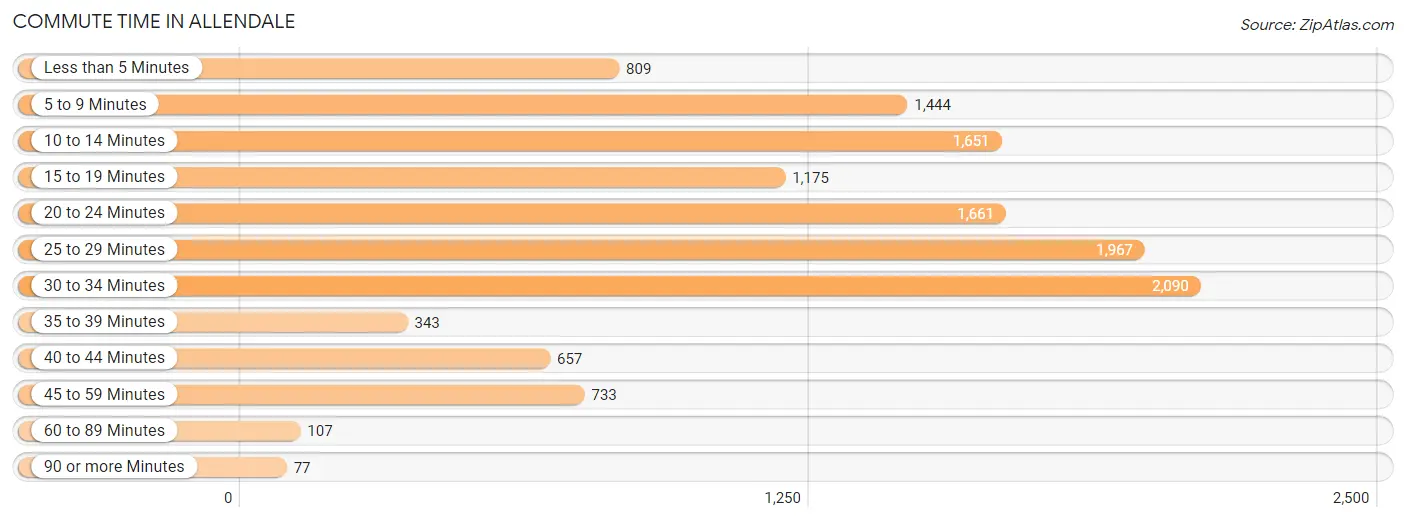
| Commute Time | # Commuters | % Commuters |
| Less than 5 Minutes | 809 | 6.4% |
| 5 to 9 Minutes | 1,444 | 11.4% |
| 10 to 14 Minutes | 1,651 | 13.0% |
| 15 to 19 Minutes | 1,175 | 9.2% |
| 20 to 24 Minutes | 1,661 | 13.1% |
| 25 to 29 Minutes | 1,967 | 15.5% |
| 30 to 34 Minutes | 2,090 | 16.4% |
| 35 to 39 Minutes | 343 | 2.7% |
| 40 to 44 Minutes | 657 | 5.2% |
| 45 to 59 Minutes | 733 | 5.8% |
| 60 to 89 Minutes | 107 | 0.8% |
| 90 or more Minutes | 77 | 0.6% |
Commute Time by Sex in Allendale
The most common commute times in Allendale are 30 to 34 minutes (1,034 commuters, 18.4%) for males and 10 to 14 minutes (1,118 commuters, 15.8%) for females.
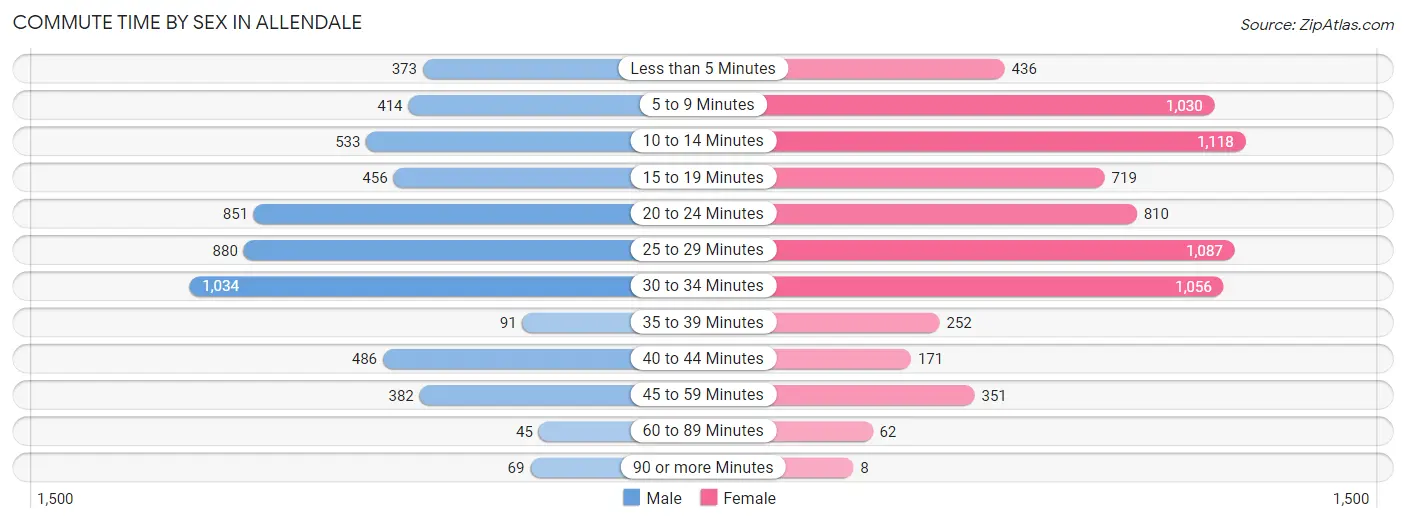
| Commute Time | Male | Female |
| Less than 5 Minutes | 373 (6.6%) | 436 (6.1%) |
| 5 to 9 Minutes | 414 (7.4%) | 1,030 (14.5%) |
| 10 to 14 Minutes | 533 (9.5%) | 1,118 (15.8%) |
| 15 to 19 Minutes | 456 (8.1%) | 719 (10.1%) |
| 20 to 24 Minutes | 851 (15.2%) | 810 (11.4%) |
| 25 to 29 Minutes | 880 (15.7%) | 1,087 (15.3%) |
| 30 to 34 Minutes | 1,034 (18.4%) | 1,056 (14.9%) |
| 35 to 39 Minutes | 91 (1.6%) | 252 (3.5%) |
| 40 to 44 Minutes | 486 (8.7%) | 171 (2.4%) |
| 45 to 59 Minutes | 382 (6.8%) | 351 (4.9%) |
| 60 to 89 Minutes | 45 (0.8%) | 62 (0.9%) |
| 90 or more Minutes | 69 (1.2%) | 8 (0.1%) |
Time of Departure to Work by Sex in Allendale
The most frequent times of departure to work in Allendale are 7:00 AM to 7:29 AM (811, 14.4%) for males and 4:00 PM to 11:59 PM (1,337, 18.8%) for females.
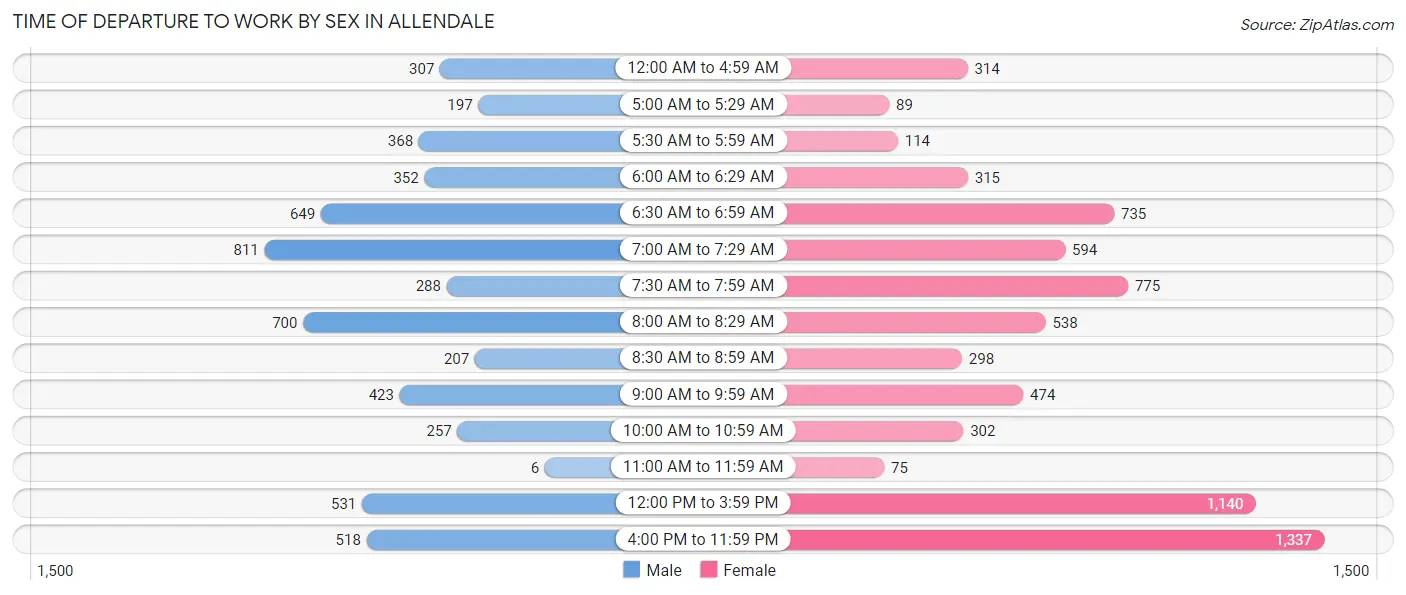
| Time of Departure | Male | Female |
| 12:00 AM to 4:59 AM | 307 (5.5%) | 314 (4.4%) |
| 5:00 AM to 5:29 AM | 197 (3.5%) | 89 (1.3%) |
| 5:30 AM to 5:59 AM | 368 (6.6%) | 114 (1.6%) |
| 6:00 AM to 6:29 AM | 352 (6.3%) | 315 (4.4%) |
| 6:30 AM to 6:59 AM | 649 (11.6%) | 735 (10.3%) |
| 7:00 AM to 7:29 AM | 811 (14.4%) | 594 (8.4%) |
| 7:30 AM to 7:59 AM | 288 (5.1%) | 775 (10.9%) |
| 8:00 AM to 8:29 AM | 700 (12.5%) | 538 (7.6%) |
| 8:30 AM to 8:59 AM | 207 (3.7%) | 298 (4.2%) |
| 9:00 AM to 9:59 AM | 423 (7.5%) | 474 (6.7%) |
| 10:00 AM to 10:59 AM | 257 (4.6%) | 302 (4.3%) |
| 11:00 AM to 11:59 AM | 6 (0.1%) | 75 (1.1%) |
| 12:00 PM to 3:59 PM | 531 (9.5%) | 1,140 (16.1%) |
| 4:00 PM to 11:59 PM | 518 (9.2%) | 1,337 (18.8%) |
| Total | 5,614 (100.0%) | 7,100 (100.0%) |
Housing Occupancy in Allendale
Occupancy by Ownership in Allendale
Of the total 7,297 dwellings in Allendale, owner-occupied units account for 3,571 (48.9%), while renter-occupied units make up 3,726 (51.1%).
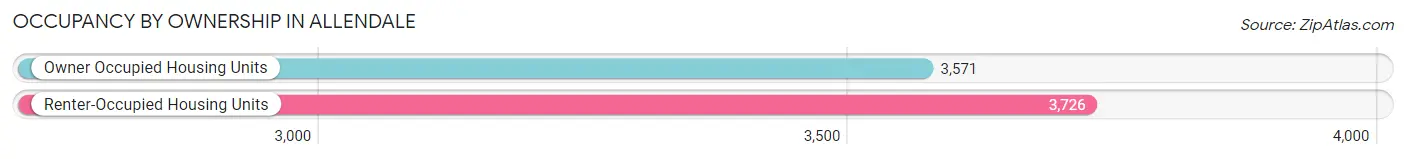
| Occupancy | # Housing Units | % Housing Units |
| Owner Occupied Housing Units | 3,571 | 48.9% |
| Renter-Occupied Housing Units | 3,726 | 51.1% |
| Total Occupied Housing Units | 7,297 | 100.0% |
Occupancy by Household Size in Allendale
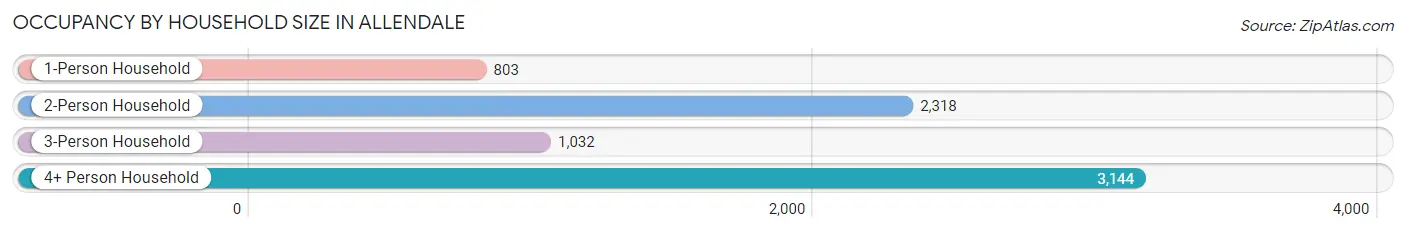
| Household Size | # Housing Units | % Housing Units |
| 1-Person Household | 803 | 11.0% |
| 2-Person Household | 2,318 | 31.8% |
| 3-Person Household | 1,032 | 14.1% |
| 4+ Person Household | 3,144 | 43.1% |
| Total Housing Units | 7,297 | 100.0% |
Occupancy by Ownership by Household Size in Allendale
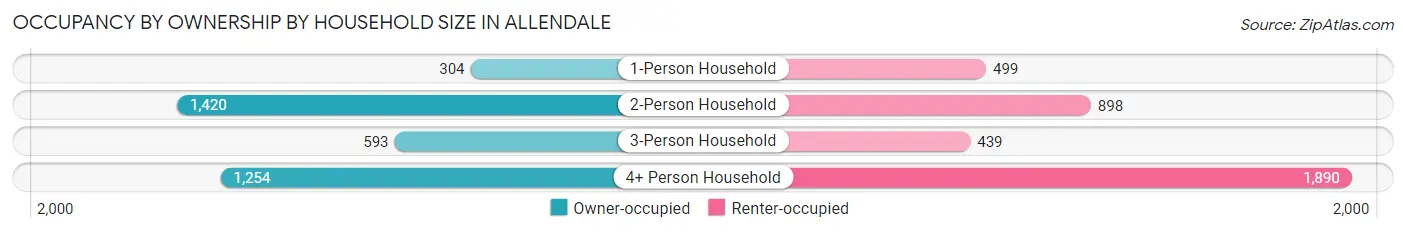
| Household Size | Owner-occupied | Renter-occupied |
| 1-Person Household | 304 (37.9%) | 499 (62.1%) |
| 2-Person Household | 1,420 (61.3%) | 898 (38.7%) |
| 3-Person Household | 593 (57.5%) | 439 (42.5%) |
| 4+ Person Household | 1,254 (39.9%) | 1,890 (60.1%) |
| Total Housing Units | 3,571 (48.9%) | 3,726 (51.1%) |
Occupancy by Educational Attainment in Allendale
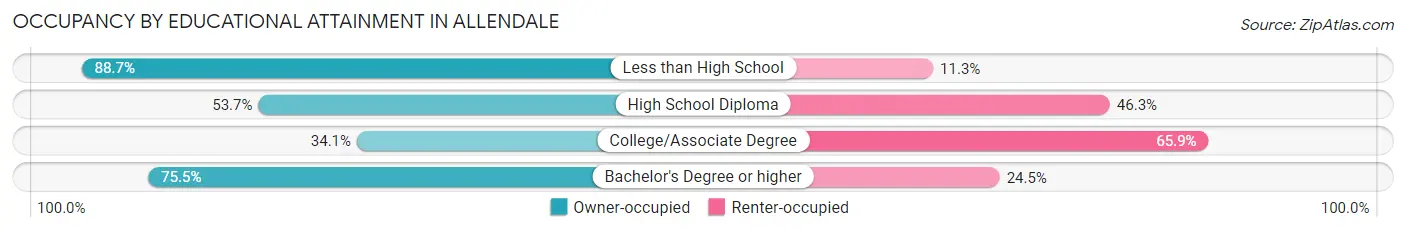
| Household Size | Owner-occupied | Renter-occupied |
| Less than High School | 102 (88.7%) | 13 (11.3%) |
| High School Diploma | 550 (53.7%) | 475 (46.3%) |
| College/Associate Degree | 1,427 (34.1%) | 2,754 (65.9%) |
| Bachelor's Degree or higher | 1,492 (75.5%) | 484 (24.5%) |
Occupancy by Age of Householder in Allendale
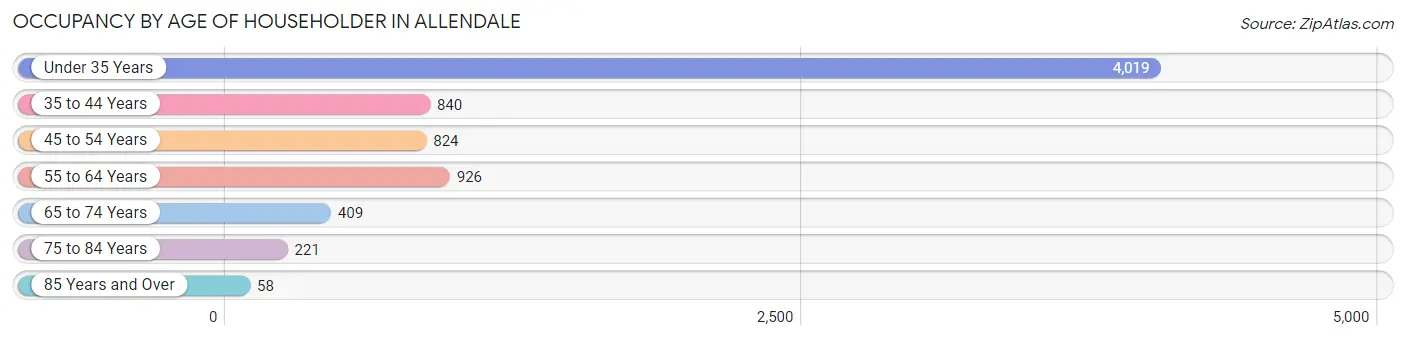
| Age Bracket | # Households | % Households |
| Under 35 Years | 4,019 | 55.1% |
| 35 to 44 Years | 840 | 11.5% |
| 45 to 54 Years | 824 | 11.3% |
| 55 to 64 Years | 926 | 12.7% |
| 65 to 74 Years | 409 | 5.6% |
| 75 to 84 Years | 221 | 3.0% |
| 85 Years and Over | 58 | 0.8% |
| Total | 7,297 | 100.0% |
Housing Finances in Allendale
Median Income by Occupancy in Allendale
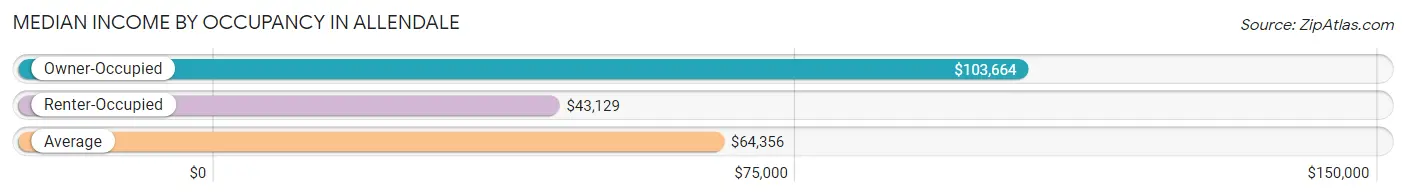
| Occupancy Type | # Households | Median Income |
| Owner-Occupied | 3,571 (48.9%) | $103,664 |
| Renter-Occupied | 3,726 (51.1%) | $43,129 |
| Average | 7,297 (100.0%) | $64,356 |
Occupancy by Householder Income Bracket in Allendale
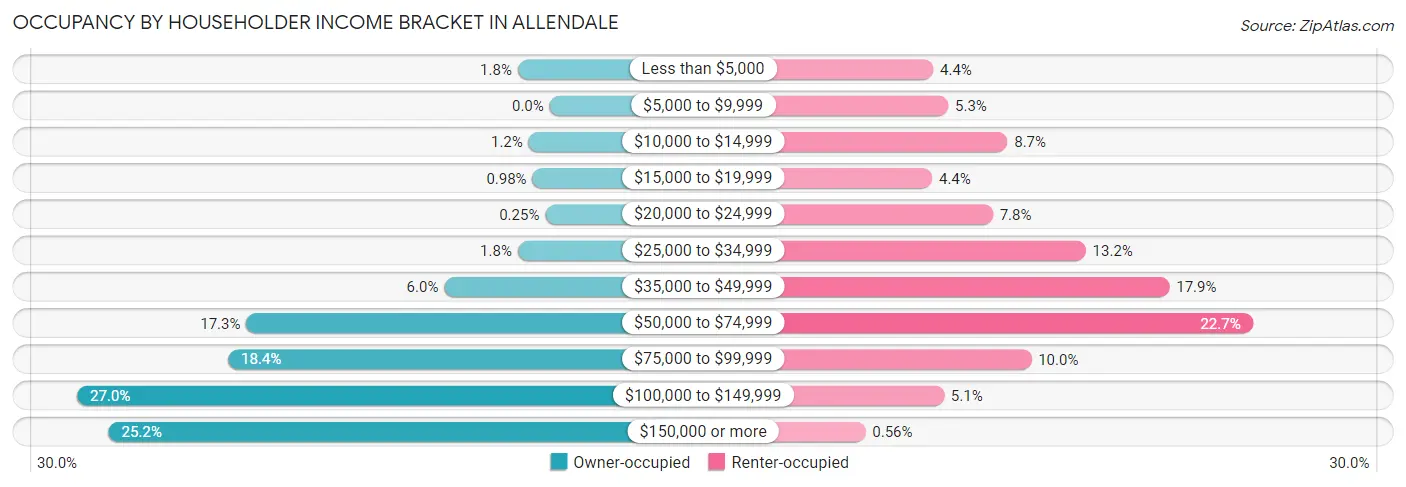
| Income Bracket | Owner-occupied | Renter-occupied |
| Less than $5,000 | 65 (1.8%) | 165 (4.4%) |
| $5,000 to $9,999 | 0 (0.0%) | 197 (5.3%) |
| $10,000 to $14,999 | 43 (1.2%) | 323 (8.7%) |
| $15,000 to $19,999 | 35 (1.0%) | 163 (4.4%) |
| $20,000 to $24,999 | 9 (0.3%) | 292 (7.8%) |
| $25,000 to $34,999 | 65 (1.8%) | 490 (13.2%) |
| $35,000 to $49,999 | 215 (6.0%) | 668 (17.9%) |
| $50,000 to $74,999 | 619 (17.3%) | 845 (22.7%) |
| $75,000 to $99,999 | 656 (18.4%) | 374 (10.0%) |
| $100,000 to $149,999 | 964 (27.0%) | 188 (5.1%) |
| $150,000 or more | 900 (25.2%) | 21 (0.6%) |
| Total | 3,571 (100.0%) | 3,726 (100.0%) |
Monthly Housing Cost Tiers in Allendale
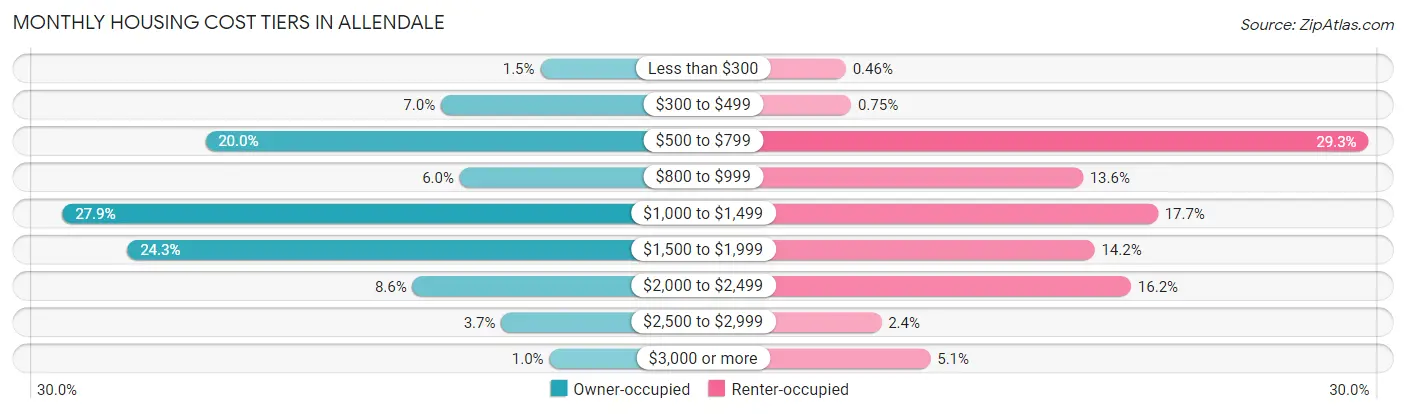
| Monthly Cost | Owner-occupied | Renter-occupied |
| Less than $300 | 54 (1.5%) | 17 (0.5%) |
| $300 to $499 | 250 (7.0%) | 28 (0.7%) |
| $500 to $799 | 715 (20.0%) | 1,093 (29.3%) |
| $800 to $999 | 213 (6.0%) | 505 (13.6%) |
| $1,000 to $1,499 | 997 (27.9%) | 659 (17.7%) |
| $1,500 to $1,999 | 869 (24.3%) | 529 (14.2%) |
| $2,000 to $2,499 | 306 (8.6%) | 604 (16.2%) |
| $2,500 to $2,999 | 131 (3.7%) | 90 (2.4%) |
| $3,000 or more | 36 (1.0%) | 191 (5.1%) |
| Total | 3,571 (100.0%) | 3,726 (100.0%) |
Physical Housing Characteristics in Allendale
Housing Structures in Allendale
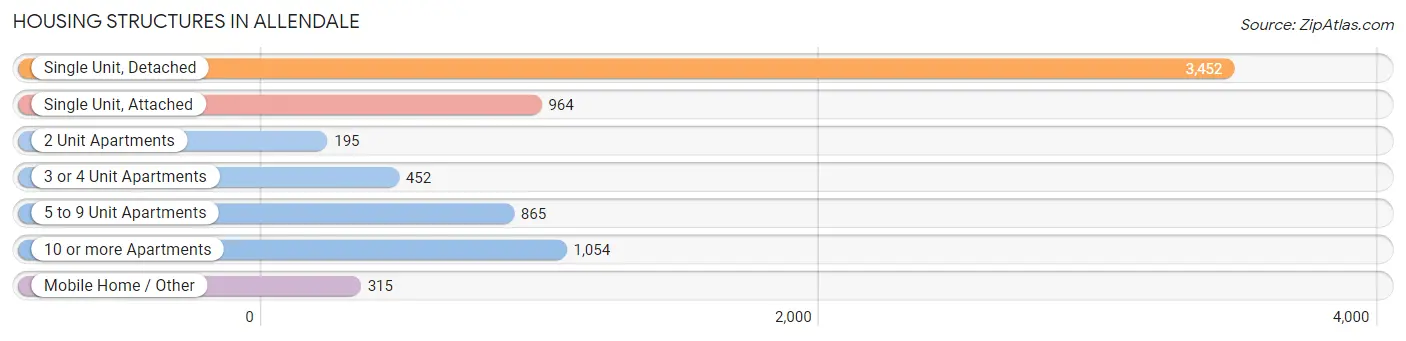
| Structure Type | # Housing Units | % Housing Units |
| Single Unit, Detached | 3,452 | 47.3% |
| Single Unit, Attached | 964 | 13.2% |
| 2 Unit Apartments | 195 | 2.7% |
| 3 or 4 Unit Apartments | 452 | 6.2% |
| 5 to 9 Unit Apartments | 865 | 11.8% |
| 10 or more Apartments | 1,054 | 14.4% |
| Mobile Home / Other | 315 | 4.3% |
| Total | 7,297 | 100.0% |
Housing Structures by Occupancy in Allendale
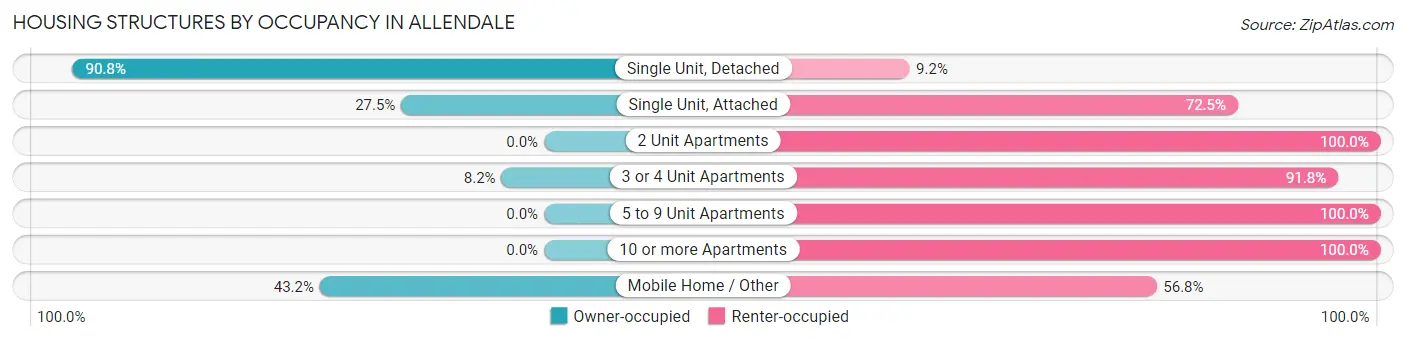
| Structure Type | Owner-occupied | Renter-occupied |
| Single Unit, Detached | 3,133 (90.8%) | 319 (9.2%) |
| Single Unit, Attached | 265 (27.5%) | 699 (72.5%) |
| 2 Unit Apartments | 0 (0.0%) | 195 (100.0%) |
| 3 or 4 Unit Apartments | 37 (8.2%) | 415 (91.8%) |
| 5 to 9 Unit Apartments | 0 (0.0%) | 865 (100.0%) |
| 10 or more Apartments | 0 (0.0%) | 1,054 (100.0%) |
| Mobile Home / Other | 136 (43.2%) | 179 (56.8%) |
| Total | 3,571 (48.9%) | 3,726 (51.1%) |
Housing Structures by Number of Rooms in Allendale
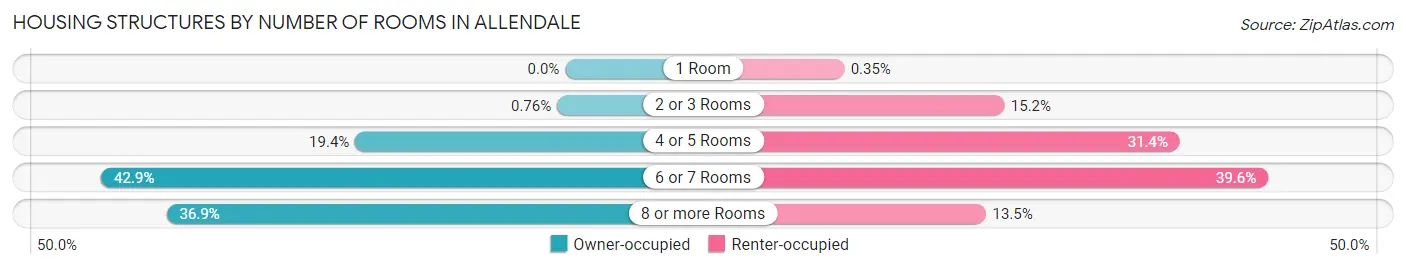
| Number of Rooms | Owner-occupied | Renter-occupied |
| 1 Room | 0 (0.0%) | 13 (0.4%) |
| 2 or 3 Rooms | 27 (0.8%) | 565 (15.2%) |
| 4 or 5 Rooms | 694 (19.4%) | 1,171 (31.4%) |
| 6 or 7 Rooms | 1,533 (42.9%) | 1,475 (39.6%) |
| 8 or more Rooms | 1,317 (36.9%) | 502 (13.5%) |
| Total | 3,571 (100.0%) | 3,726 (100.0%) |
Housing Structure by Heating Type in Allendale
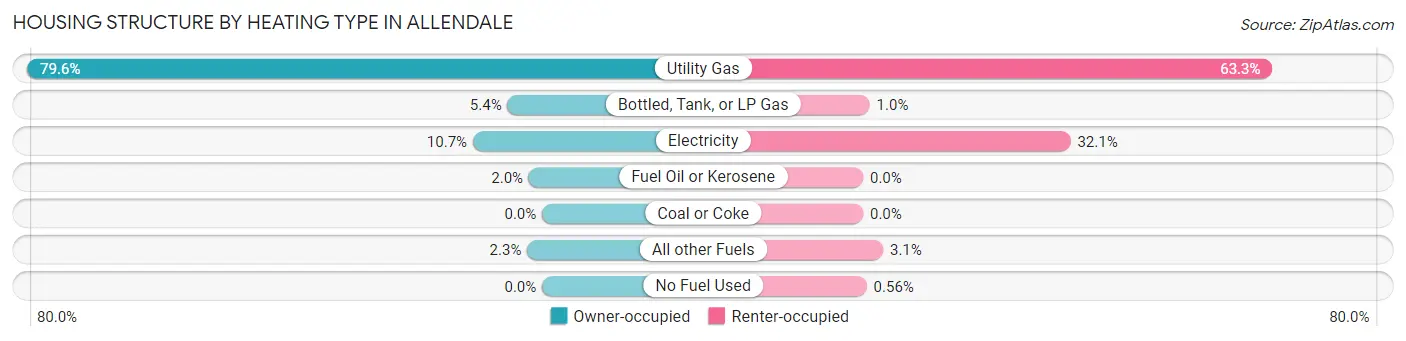
| Heating Type | Owner-occupied | Renter-occupied |
| Utility Gas | 2,843 (79.6%) | 2,357 (63.3%) |
| Bottled, Tank, or LP Gas | 191 (5.3%) | 38 (1.0%) |
| Electricity | 382 (10.7%) | 1,195 (32.1%) |
| Fuel Oil or Kerosene | 73 (2.0%) | 0 (0.0%) |
| Coal or Coke | 0 (0.0%) | 0 (0.0%) |
| All other Fuels | 82 (2.3%) | 115 (3.1%) |
| No Fuel Used | 0 (0.0%) | 21 (0.6%) |
| Total | 3,571 (100.0%) | 3,726 (100.0%) |
Household Vehicle Usage in Allendale
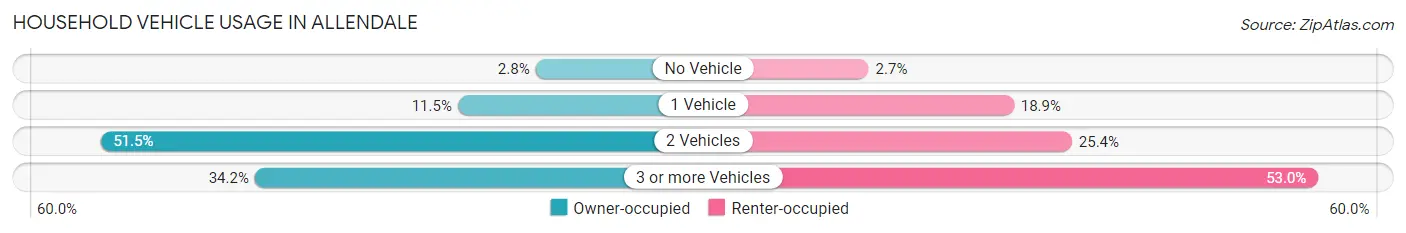
| Vehicles per Household | Owner-occupied | Renter-occupied |
| No Vehicle | 99 (2.8%) | 99 (2.7%) |
| 1 Vehicle | 410 (11.5%) | 705 (18.9%) |
| 2 Vehicles | 1,840 (51.5%) | 947 (25.4%) |
| 3 or more Vehicles | 1,222 (34.2%) | 1,975 (53.0%) |
| Total | 3,571 (100.0%) | 3,726 (100.0%) |
Real Estate & Mortgages in Allendale
Real Estate and Mortgage Overview in Allendale
| Characteristic | Without Mortgage | With Mortgage |
| Housing Units | 1,069 | 2,502 |
| Median Property Value | $257,500 | $273,200 |
| Median Household Income | $89,063 | $778 |
| Monthly Housing Costs | $551 | $36 |
| Real Estate Taxes | $2,656 | $121 |
Property Value by Mortgage Status in Allendale
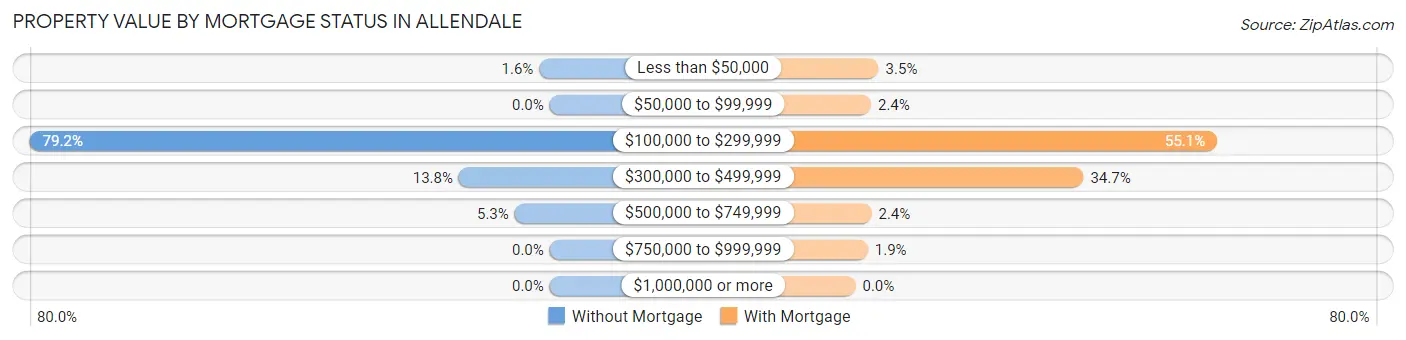
| Property Value | Without Mortgage | With Mortgage |
| Less than $50,000 | 17 (1.6%) | 88 (3.5%) |
| $50,000 to $99,999 | 0 (0.0%) | 59 (2.4%) |
| $100,000 to $299,999 | 847 (79.2%) | 1,378 (55.1%) |
| $300,000 to $499,999 | 148 (13.8%) | 869 (34.7%) |
| $500,000 to $749,999 | 57 (5.3%) | 61 (2.4%) |
| $750,000 to $999,999 | 0 (0.0%) | 47 (1.9%) |
| $1,000,000 or more | 0 (0.0%) | 0 (0.0%) |
| Total | 1,069 (100.0%) | 2,502 (100.0%) |
Household Income by Mortgage Status in Allendale
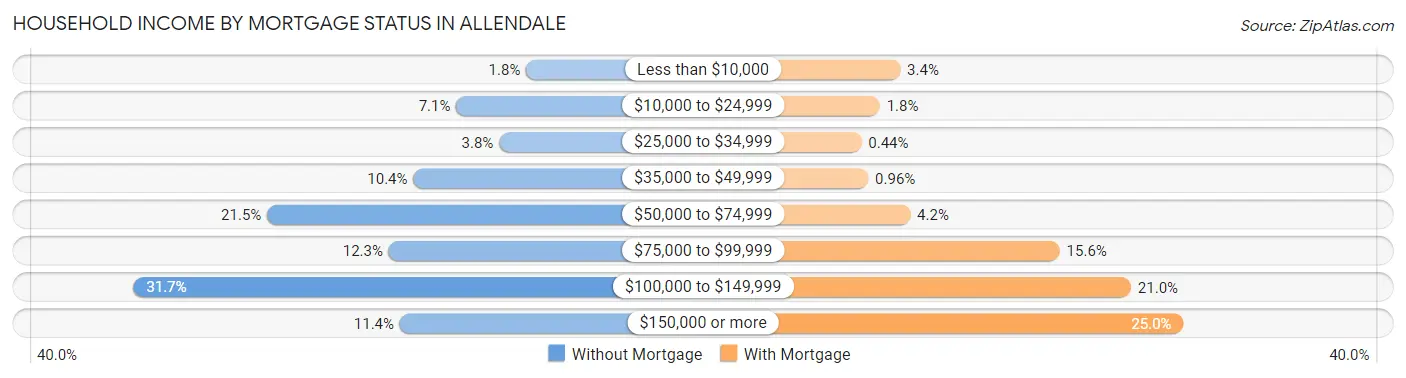
| Household Income | Without Mortgage | With Mortgage |
| Less than $10,000 | 19 (1.8%) | 85 (3.4%) |
| $10,000 to $24,999 | 76 (7.1%) | 46 (1.8%) |
| $25,000 to $34,999 | 41 (3.8%) | 11 (0.4%) |
| $35,000 to $49,999 | 111 (10.4%) | 24 (1.0%) |
| $50,000 to $74,999 | 230 (21.5%) | 104 (4.2%) |
| $75,000 to $99,999 | 131 (12.2%) | 389 (15.5%) |
| $100,000 to $149,999 | 339 (31.7%) | 525 (21.0%) |
| $150,000 or more | 122 (11.4%) | 625 (25.0%) |
| Total | 1,069 (100.0%) | 2,502 (100.0%) |
Property Value to Household Income Ratio in Allendale
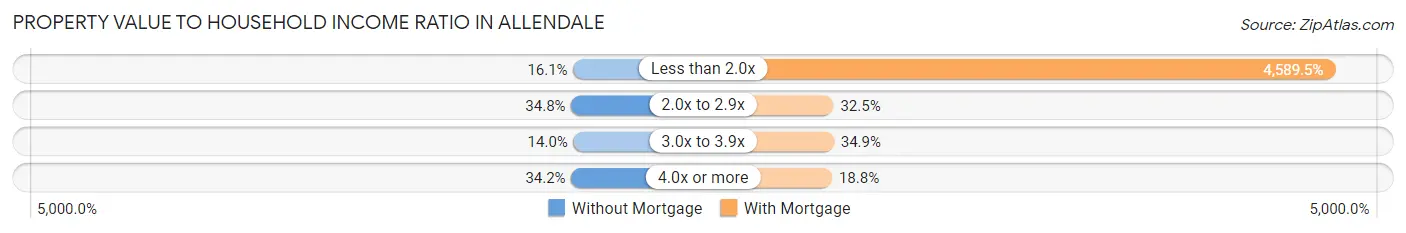
| Value-to-Income Ratio | Without Mortgage | With Mortgage |
| Less than 2.0x | 172 (16.1%) | 114,830 (4,589.5%) |
| 2.0x to 2.9x | 372 (34.8%) | 814 (32.5%) |
| 3.0x to 3.9x | 150 (14.0%) | 873 (34.9%) |
| 4.0x or more | 366 (34.2%) | 470 (18.8%) |
| Total | 1,069 (100.0%) | 2,502 (100.0%) |
Real Estate Taxes by Mortgage Status in Allendale
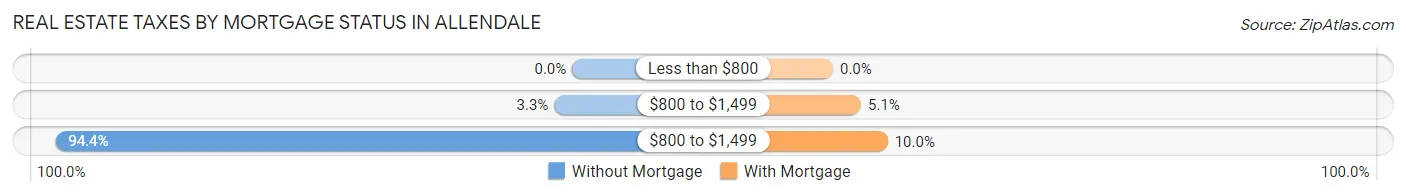
| Property Taxes | Without Mortgage | With Mortgage |
| Less than $800 | 0 (0.0%) | 0 (0.0%) |
| $800 to $1,499 | 35 (3.3%) | 128 (5.1%) |
| $800 to $1,499 | 1,009 (94.4%) | 250 (10.0%) |
| Total | 1,069 (100.0%) | 2,502 (100.0%) |
Health & Disability in Allendale
Health Insurance Coverage by Age in Allendale
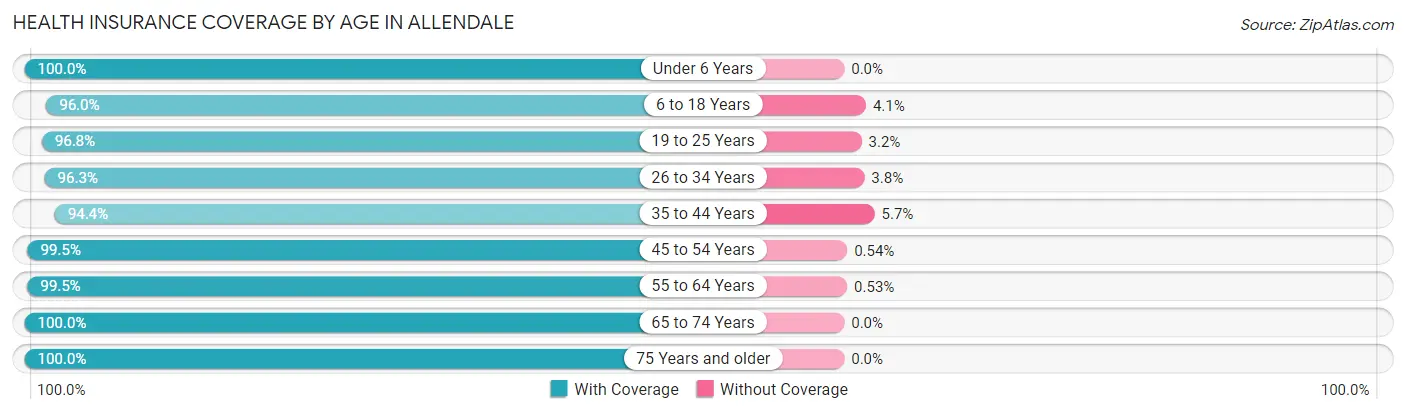
| Age Bracket | With Coverage | Without Coverage |
| Under 6 Years | 1,118 (100.0%) | 0 (0.0%) |
| 6 to 18 Years | 4,122 (96.0%) | 174 (4.1%) |
| 19 to 25 Years | 11,669 (96.8%) | 388 (3.2%) |
| 26 to 34 Years | 1,874 (96.3%) | 73 (3.7%) |
| 35 to 44 Years | 1,436 (94.4%) | 86 (5.7%) |
| 45 to 54 Years | 1,298 (99.5%) | 7 (0.5%) |
| 55 to 64 Years | 1,684 (99.5%) | 9 (0.5%) |
| 65 to 74 Years | 815 (100.0%) | 0 (0.0%) |
| 75 Years and older | 393 (100.0%) | 0 (0.0%) |
| Total | 24,409 (97.1%) | 737 (2.9%) |
Health Insurance Coverage by Citizenship Status in Allendale
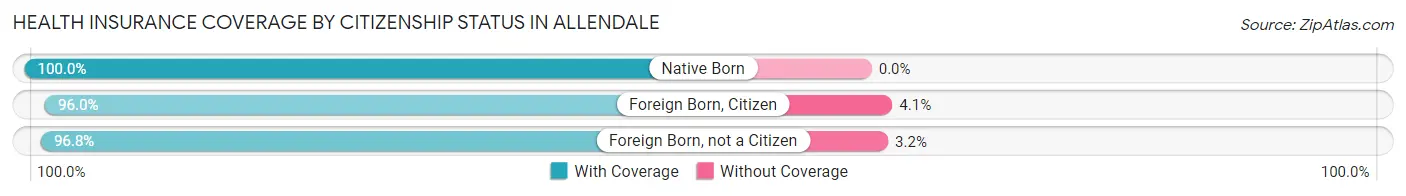
| Citizenship Status | With Coverage | Without Coverage |
| Native Born | 1,118 (100.0%) | 0 (0.0%) |
| Foreign Born, Citizen | 4,122 (96.0%) | 174 (4.1%) |
| Foreign Born, not a Citizen | 11,669 (96.8%) | 388 (3.2%) |
Health Insurance Coverage by Household Income in Allendale
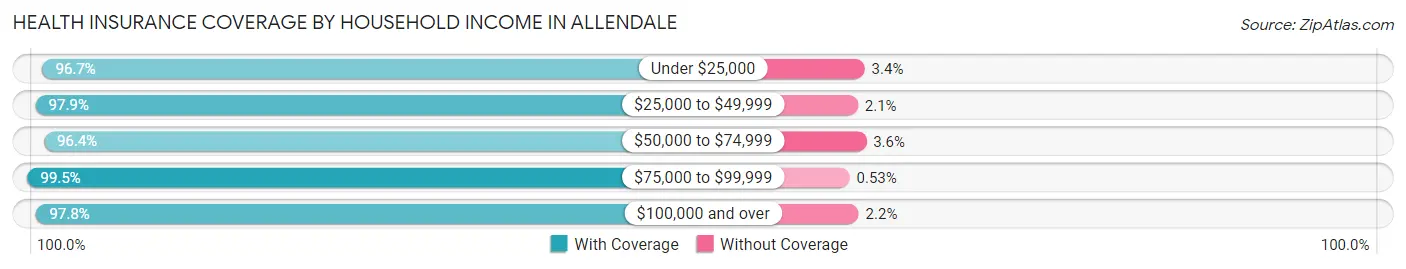
| Household Income | With Coverage | Without Coverage |
| Under $25,000 | 2,824 (96.7%) | 98 (3.4%) |
| $25,000 to $49,999 | 4,062 (97.9%) | 86 (2.1%) |
| $50,000 to $74,999 | 3,958 (96.4%) | 149 (3.6%) |
| $75,000 to $99,999 | 2,826 (99.5%) | 15 (0.5%) |
| $100,000 and over | 6,690 (97.8%) | 152 (2.2%) |
Public vs Private Health Insurance Coverage by Age in Allendale
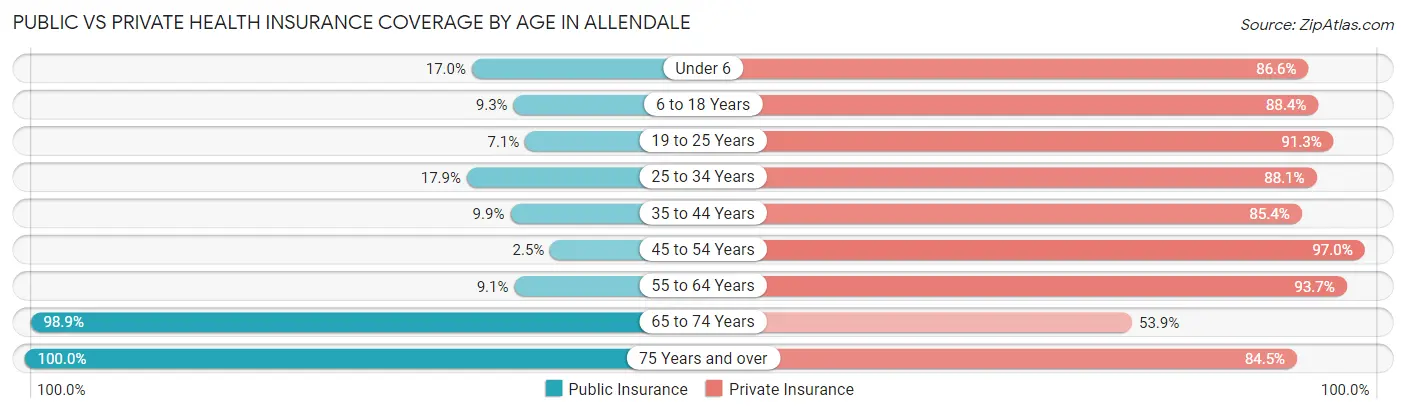
| Age Bracket | Public Insurance | Private Insurance |
| Under 6 | 190 (17.0%) | 968 (86.6%) |
| 6 to 18 Years | 398 (9.3%) | 3,798 (88.4%) |
| 19 to 25 Years | 856 (7.1%) | 11,006 (91.3%) |
| 25 to 34 Years | 349 (17.9%) | 1,715 (88.1%) |
| 35 to 44 Years | 150 (9.9%) | 1,299 (85.4%) |
| 45 to 54 Years | 32 (2.5%) | 1,266 (97.0%) |
| 55 to 64 Years | 154 (9.1%) | 1,586 (93.7%) |
| 65 to 74 Years | 806 (98.9%) | 439 (53.9%) |
| 75 Years and over | 393 (100.0%) | 332 (84.5%) |
| Total | 3,328 (13.2%) | 22,409 (89.1%) |
Disability Status by Sex by Age in Allendale
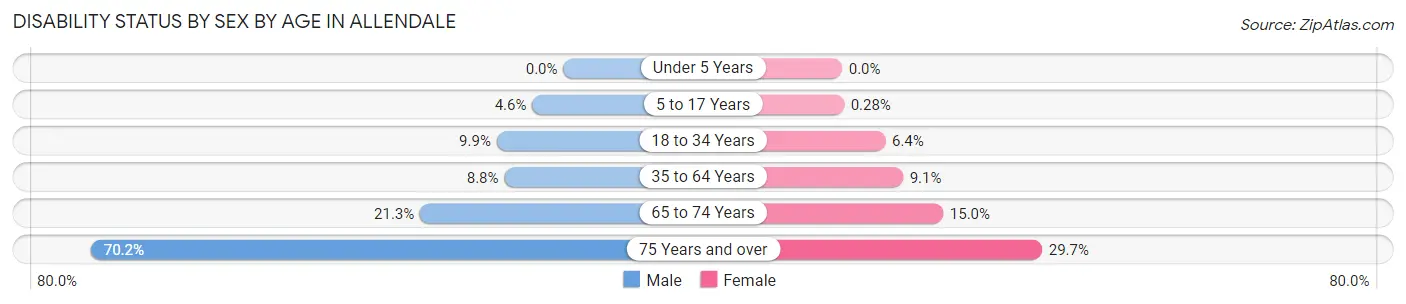
| Age Bracket | Male | Female |
| Under 5 Years | 0 (0.0%) | 0 (0.0%) |
| 5 to 17 Years | 65 (4.6%) | 3 (0.3%) |
| 18 to 34 Years | 669 (9.9%) | 588 (6.4%) |
| 35 to 64 Years | 188 (8.8%) | 215 (9.0%) |
| 65 to 74 Years | 77 (21.3%) | 68 (15.0%) |
| 75 Years and over | 134 (70.2%) | 60 (29.7%) |
Disability Class by Sex by Age in Allendale
Disability Class: Hearing Difficulty
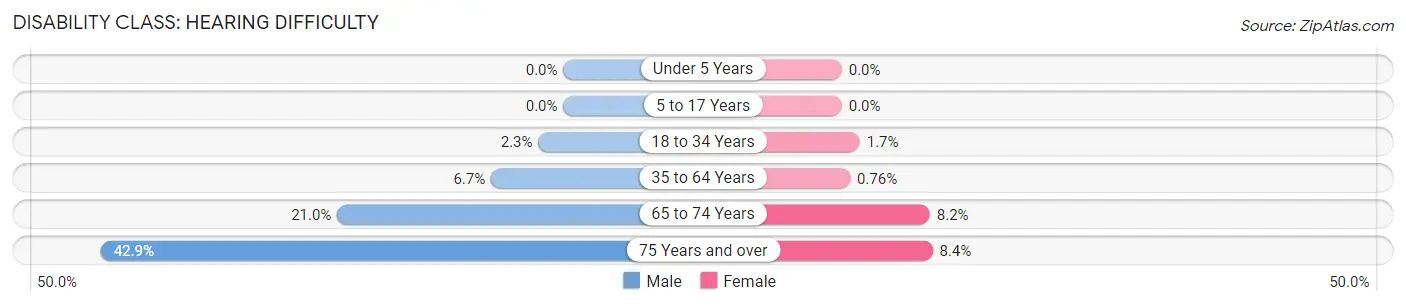
| Age Bracket | Male | Female |
| Under 5 Years | 0 (0.0%) | 0 (0.0%) |
| 5 to 17 Years | 0 (0.0%) | 0 (0.0%) |
| 18 to 34 Years | 157 (2.3%) | 153 (1.7%) |
| 35 to 64 Years | 144 (6.7%) | 18 (0.8%) |
| 65 to 74 Years | 76 (21.0%) | 37 (8.2%) |
| 75 Years and over | 82 (42.9%) | 17 (8.4%) |
Disability Class: Vision Difficulty
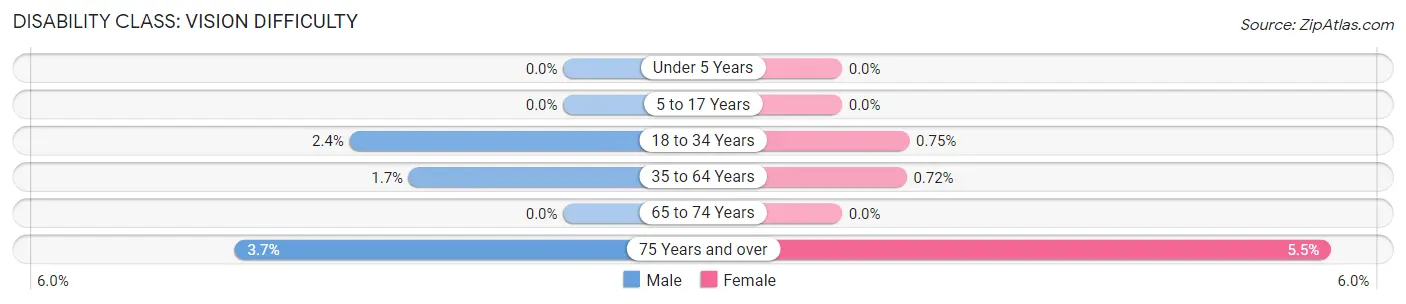
| Age Bracket | Male | Female |
| Under 5 Years | 0 (0.0%) | 0 (0.0%) |
| 5 to 17 Years | 0 (0.0%) | 0 (0.0%) |
| 18 to 34 Years | 161 (2.4%) | 69 (0.7%) |
| 35 to 64 Years | 37 (1.7%) | 17 (0.7%) |
| 65 to 74 Years | 0 (0.0%) | 0 (0.0%) |
| 75 Years and over | 7 (3.7%) | 11 (5.4%) |
Disability Class: Cognitive Difficulty
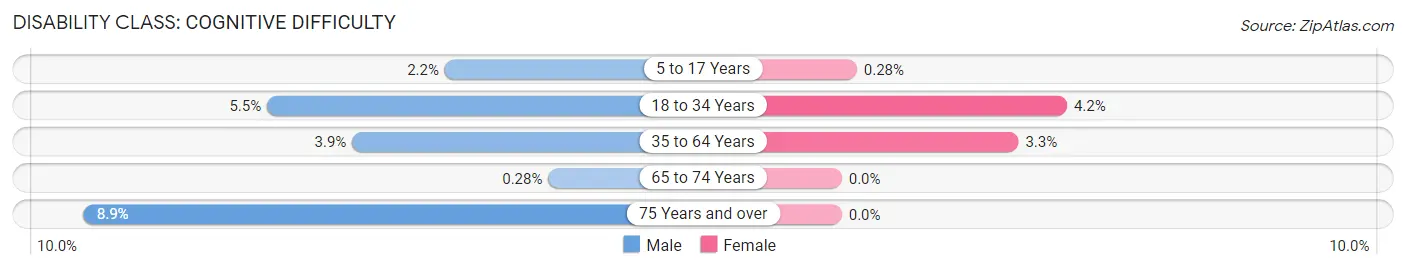
| Age Bracket | Male | Female |
| 5 to 17 Years | 31 (2.2%) | 3 (0.3%) |
| 18 to 34 Years | 372 (5.5%) | 383 (4.2%) |
| 35 to 64 Years | 84 (3.9%) | 78 (3.3%) |
| 65 to 74 Years | 1 (0.3%) | 0 (0.0%) |
| 75 Years and over | 17 (8.9%) | 0 (0.0%) |
Disability Class: Ambulatory Difficulty
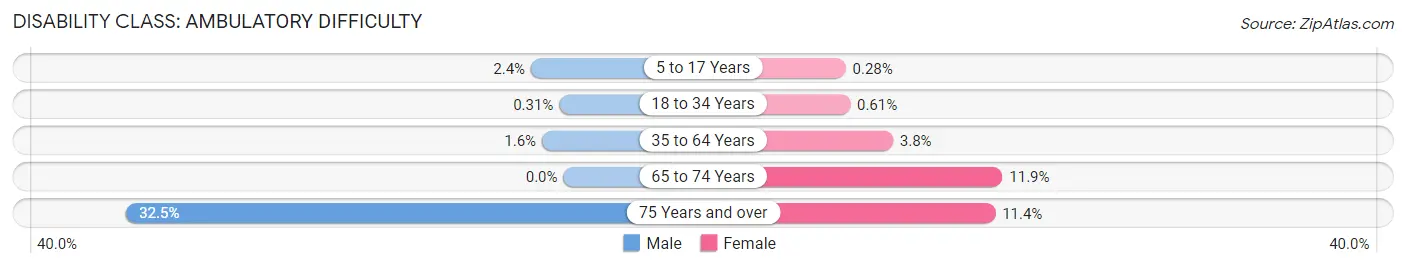
| Age Bracket | Male | Female |
| 5 to 17 Years | 34 (2.4%) | 3 (0.3%) |
| 18 to 34 Years | 21 (0.3%) | 56 (0.6%) |
| 35 to 64 Years | 34 (1.6%) | 90 (3.8%) |
| 65 to 74 Years | 0 (0.0%) | 54 (11.9%) |
| 75 Years and over | 62 (32.5%) | 23 (11.4%) |
Disability Class: Self-Care Difficulty
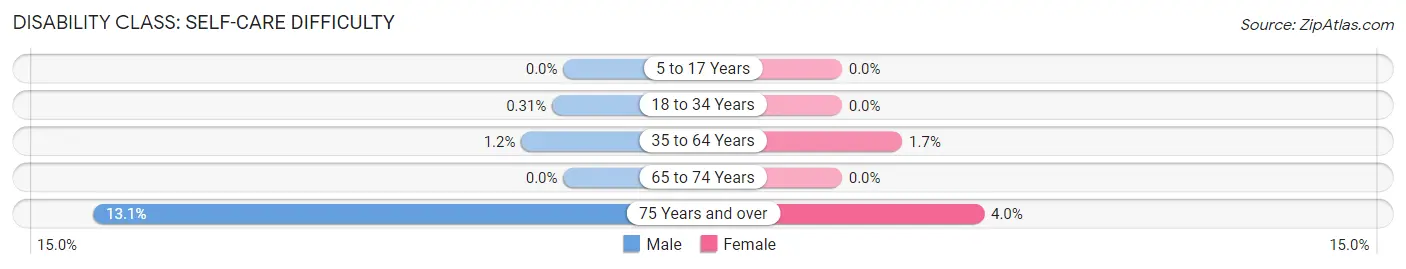
| Age Bracket | Male | Female |
| 5 to 17 Years | 0 (0.0%) | 0 (0.0%) |
| 18 to 34 Years | 21 (0.3%) | 0 (0.0%) |
| 35 to 64 Years | 25 (1.2%) | 40 (1.7%) |
| 65 to 74 Years | 0 (0.0%) | 0 (0.0%) |
| 75 Years and over | 25 (13.1%) | 8 (4.0%) |
Technology Access in Allendale
Computing Device Access in Allendale
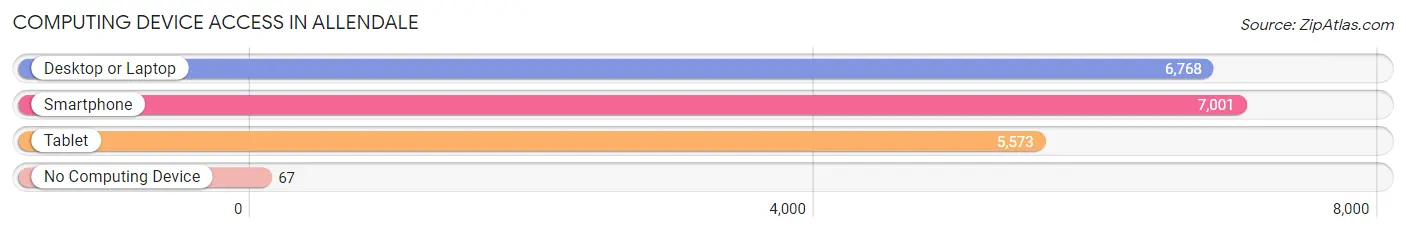
| Device Type | # Households | % Households |
| Desktop or Laptop | 6,768 | 92.7% |
| Smartphone | 7,001 | 95.9% |
| Tablet | 5,573 | 76.4% |
| No Computing Device | 67 | 0.9% |
| Total | 7,297 | 100.0% |
Internet Access in Allendale
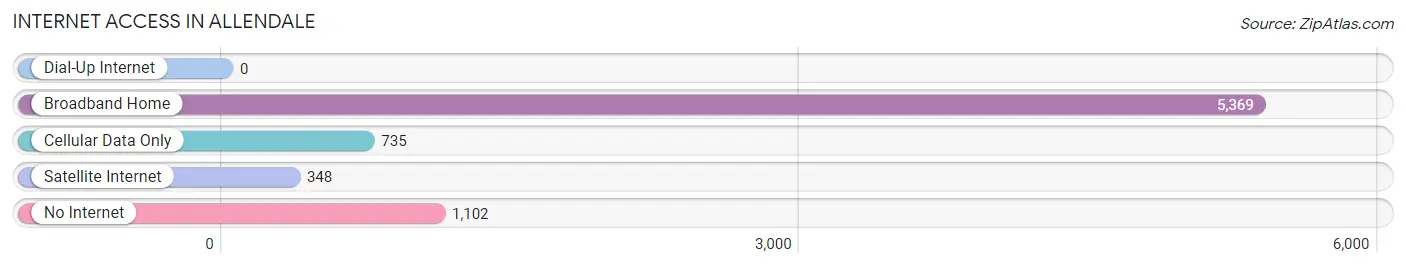
| Internet Type | # Households | % Households |
| Dial-Up Internet | 0 | 0.0% |
| Broadband Home | 5,369 | 73.6% |
| Cellular Data Only | 735 | 10.1% |
| Satellite Internet | 348 | 4.8% |
| No Internet | 1,102 | 15.1% |
| Total | 7,297 | 100.0% |
Allendale Summary
Allendale, Michigan is a small town located in Ottawa County, Michigan. It is situated on the Grand River, approximately 20 miles west of Grand Rapids. The town has a population of approximately 5,000 people and is home to Grand Valley State University.
History
Allendale was first settled in 1845 by a group of Dutch immigrants. The town was originally called “Vanderberg” after the first settler, John Vanderberg. The name was changed to Allendale in 1851 when the post office was established. The town was incorporated in 1867.
In the late 19th century, Allendale was a thriving agricultural community. The town was known for its dairy farms and its production of butter and cheese. The town also had a number of sawmills and gristmills.
In the early 20th century, Allendale began to experience a period of growth and development. The Grand Rapids and Indiana Railroad was built through the town in 1902, connecting it to Grand Rapids. This allowed for the development of a number of businesses, including a canning factory, a brickyard, and a furniture factory.
In the 1950s, Allendale began to experience a period of decline. Many of the businesses that had been established in the early 20th century closed down. The town was also affected by the decline of the agricultural industry.
In the late 1960s, Allendale began to experience a period of revitalization. Grand Valley State University was established in the town in 1960. This brought a new influx of students and faculty to the town, which helped to revitalize the local economy.
Geography
Allendale is located in Ottawa County, Michigan. It is situated on the Grand River, approximately 20 miles west of Grand Rapids. The town is located in a rural area, surrounded by farmland and woodlands.
The town has a total area of 4.2 square miles, all of which is land. The town has a humid continental climate, with cold winters and hot summers.
Economy
Allendale’s economy is largely based on education and tourism. Grand Valley State University is the largest employer in the town, providing jobs for faculty, staff, and students. The university also attracts a large number of visitors to the town, which helps to support the local economy.
The town also has a number of small businesses, including restaurants, retail stores, and service providers. The town is also home to a number of farms, which produce a variety of crops and livestock.
Demographics
As of the 2010 census, Allendale had a population of 5,000 people. The racial makeup of the town was 94.3% White, 1.7% African American, 0.7% Native American, 1.2% Asian, 0.2% Pacific Islander, and 1.9% from other races. Hispanic or Latino of any race were 3.2% of the population.
The median household income in Allendale was $50,000, and the median family income was $60,000. The per capita income was $25,000. About 8.3% of families and 11.2% of the population were below the poverty line.
Common Questions
What is Per Capita Income in Allendale?
Per Capita income in Allendale is $24,332.
What is the Median Family Income in Allendale?
Median Family Income in Allendale is $92,635.
What is the Median Household income in Allendale?
Median Household Income in Allendale is $64,356.
What is Income or Wage Gap in Allendale?
Income or Wage Gap in Allendale is 47.1%.
Women in Allendale earn 52.9 cents for every dollar earned by a man.
What is Family Income Deficit in Allendale?
Family Income Deficit in Allendale is $10,847.
Families that are below poverty line in Allendale earn $10,847 less on average than the poverty threshold level.
What is Inequality or Gini Index in Allendale?
Inequality or Gini Index in Allendale is 0.42.
What is the Total Population of Allendale?
Total Population of Allendale is 25,206.
What is the Total Male Population of Allendale?
Total Male Population of Allendale is 11,373.
What is the Total Female Population of Allendale?
Total Female Population of Allendale is 13,833.
What is the Ratio of Males per 100 Females in Allendale?
There are 82.22 Males per 100 Females in Allendale.
What is the Ratio of Females per 100 Males in Allendale?
There are 121.63 Females per 100 Males in Allendale.
What is the Median Population Age in Allendale?
Median Population Age in Allendale is 21.3 Years.
What is the Average Family Size in Allendale
Average Family Size in Allendale is 3.1 People.
What is the Average Household Size in Allendale
Average Household Size in Allendale is 2.9 People.
How Large is the Labor Force in Allendale?
There are 15,284 People in the Labor Forcein in Allendale.
What is the Percentage of People in the Labor Force in Allendale?
68.3% of People are in the Labor Force in Allendale.
What is the Unemployment Rate in Allendale?
Unemployment Rate in Allendale is 7.5%.