Zip Codes with the Highest Percentage of Population Employed in Accommodation & Food Services in Bloomfield Hills, MI
RELATED REPORTS & OPTIONS
Accommodation & Food Services
Bloomfield Hills
Compare Zip Codes
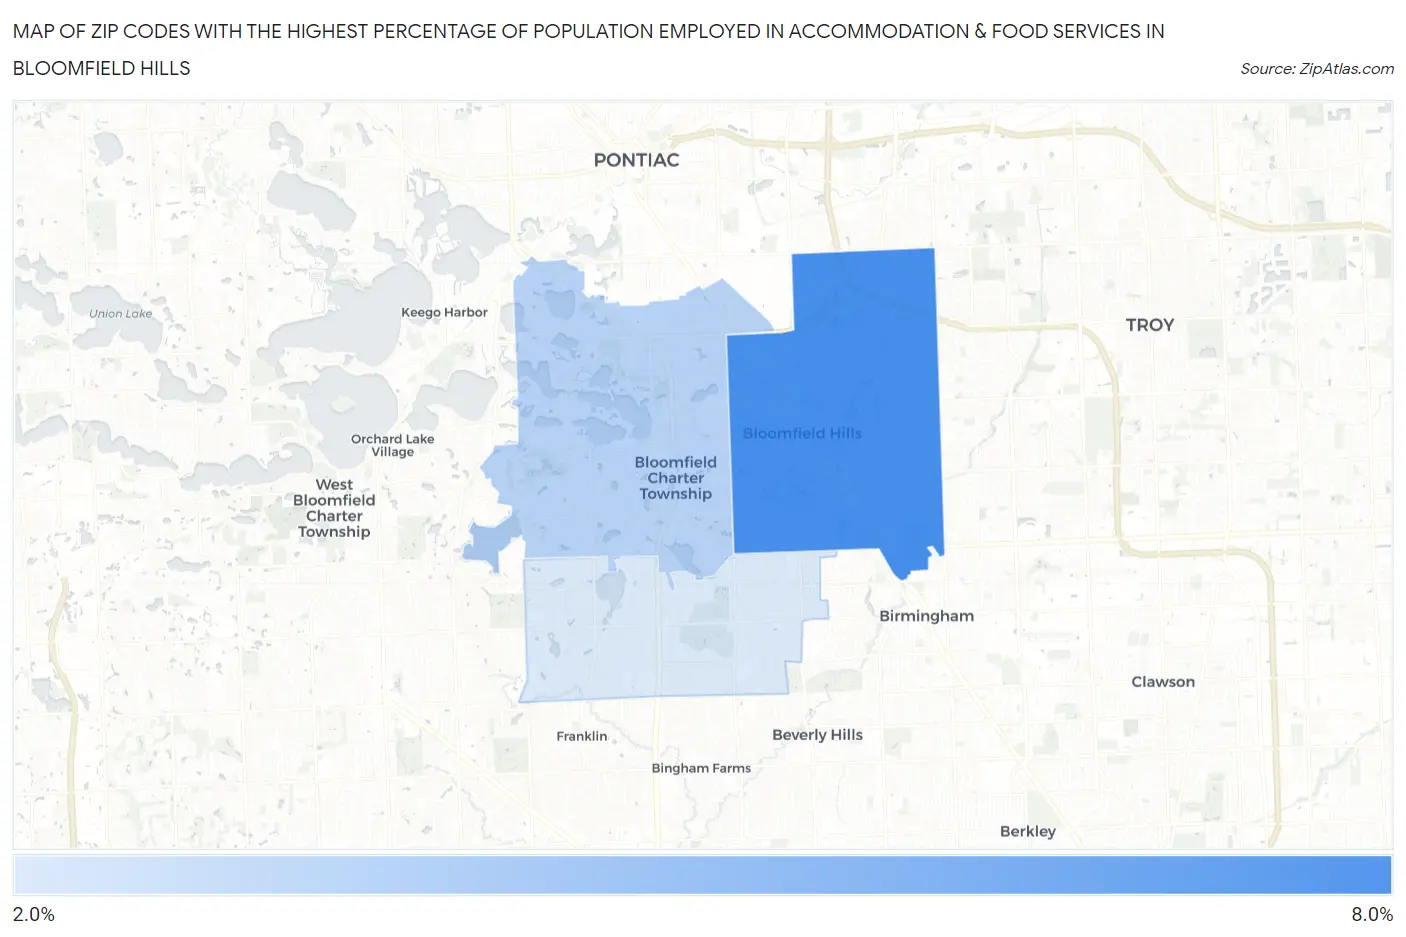
Map of Zip Codes with the Highest Percentage of Population Employed in Accommodation & Food Services in Bloomfield Hills
2.4%
6.6%
Zip Codes with the Highest Percentage of Population Employed in Accommodation & Food Services in Bloomfield Hills, MI
| Zip Code | % Employed | vs State | vs National | |
| 1. | 48304 | 6.6% | 7.1%(-0.510)#445 | 6.9%(-0.308)#11,604 |
| 2. | 48302 | 3.4% | 7.1%(-3.68)#822 | 6.9%(-3.48)#22,081 |
| 3. | 48301 | 2.4% | 7.1%(-4.70)#884 | 6.9%(-4.50)#24,750 |
1
Common Questions
What are the Top Zip Codes with the Highest Percentage of Population Employed in Accommodation & Food Services in Bloomfield Hills, MI?
Top Zip Codes with the Highest Percentage of Population Employed in Accommodation & Food Services in Bloomfield Hills, MI are:
What zip code has the Highest Percentage of Population Employed in Accommodation & Food Services in Bloomfield Hills, MI?
48304 has the Highest Percentage of Population Employed in Accommodation & Food Services in Bloomfield Hills, MI with 6.6%.
What is the Percentage of Population Employed in Accommodation & Food Services in Bloomfield Hills, MI?
Percentage of Population Employed in Accommodation & Food Services in Bloomfield Hills is 5.2%.
What is the Percentage of Population Employed in Accommodation & Food Services in Michigan?
Percentage of Population Employed in Accommodation & Food Services in Michigan is 7.1%.
What is the Percentage of Population Employed in Accommodation & Food Services in the United States?
Percentage of Population Employed in Accommodation & Food Services in the United States is 6.9%.