Dollar Bay, MI Map & Demographics
Dollar Bay Map
Dollar Bay Overview
$33,277
PER CAPITA INCOME
$71,964
AVG FAMILY INCOME
$60,294
AVG HOUSEHOLD INCOME
47.5%
WAGE / INCOME GAP [ % ]
52.5¢/ $1
WAGE / INCOME GAP [ $ ]
0.54
INEQUALITY / GINI INDEX
1,184
TOTAL POPULATION
636
MALE POPULATION
548
FEMALE POPULATION
116.06
MALES / 100 FEMALES
86.16
FEMALES / 100 MALES
31.2
MEDIAN AGE
3.5
AVG FAMILY SIZE
2.8
AVG HOUSEHOLD SIZE
563
LABOR FORCE [ PEOPLE ]
66.2%
PERCENT IN LABOR FORCE
2.7%
UNEMPLOYMENT RATE
Dollar Bay Zip Codes
Dollar Bay Area Codes
Income in Dollar Bay
Income Overview in Dollar Bay
Per Capita Income in Dollar Bay is $33,277, while median incomes of families and households are $71,964 and $60,294 respectively.
| Characteristic | Number | Measure |
| Per Capita Income | 1,184 | $33,277 |
| Median Family Income | 285 | $71,964 |
| Mean Family Income | 285 | $118,354 |
| Median Household Income | 418 | $60,294 |
| Mean Household Income | 418 | $93,708 |
| Income Deficit | 285 | $0 |
| Wage / Income Gap (%) | 1,184 | 47.50% |
| Wage / Income Gap ($) | 1,184 | 52.50¢ per $1 |
| Gini / Inequality Index | 1,184 | 0.54 |
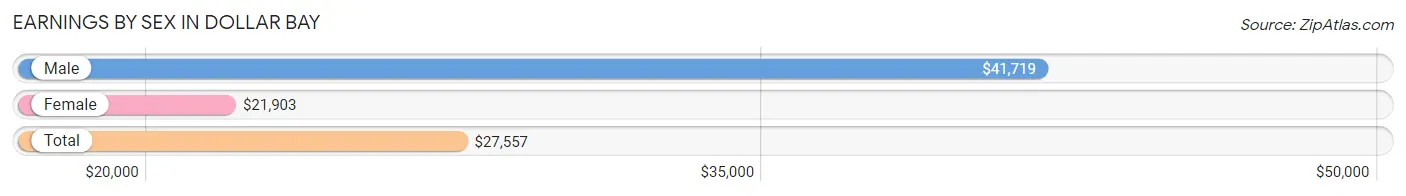
Earnings by Sex in Dollar Bay
Average Earnings in Dollar Bay are $27,557, $41,719 for men and $21,903 for women, a difference of 47.5%.
| Sex | Number | Average Earnings |
| Male | 334 (55.9%) | $41,719 |
| Female | 263 (44.1%) | $21,903 |
| Total | 597 (100.0%) | $27,557 |
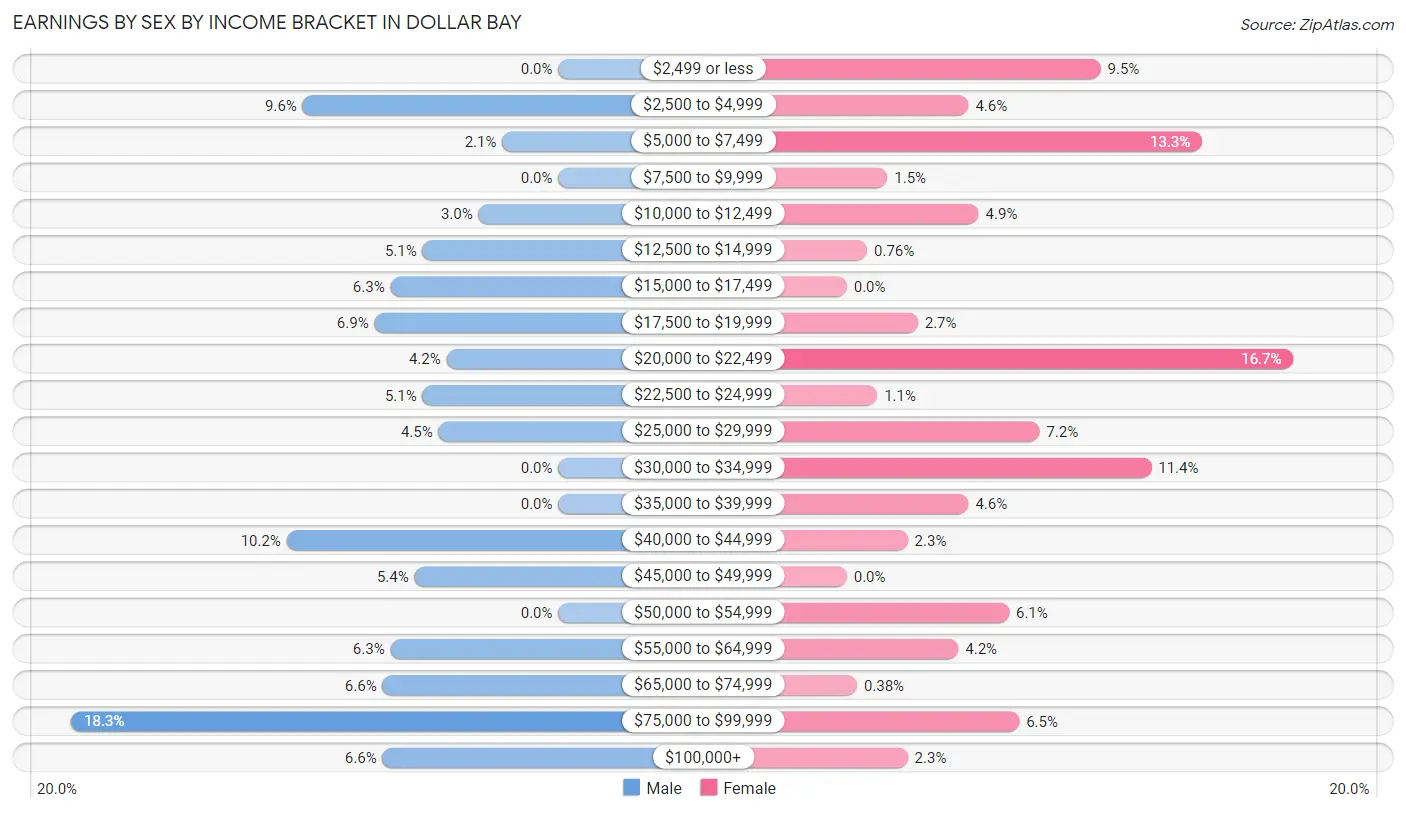
Earnings by Sex by Income Bracket in Dollar Bay
The most common earnings brackets in Dollar Bay are $75,000 to $99,999 for men (61 | 18.3%) and $20,000 to $22,499 for women (44 | 16.7%).
| Income | Male | Female |
| $2,499 or less | 0 (0.0%) | 25 (9.5%) |
| $2,500 to $4,999 | 32 (9.6%) | 12 (4.6%) |
| $5,000 to $7,499 | 7 (2.1%) | 35 (13.3%) |
| $7,500 to $9,999 | 0 (0.0%) | 4 (1.5%) |
| $10,000 to $12,499 | 10 (3.0%) | 13 (4.9%) |
| $12,500 to $14,999 | 17 (5.1%) | 2 (0.8%) |
| $15,000 to $17,499 | 21 (6.3%) | 0 (0.0%) |
| $17,500 to $19,999 | 23 (6.9%) | 7 (2.7%) |
| $20,000 to $22,499 | 14 (4.2%) | 44 (16.7%) |
| $22,500 to $24,999 | 17 (5.1%) | 3 (1.1%) |
| $25,000 to $29,999 | 15 (4.5%) | 19 (7.2%) |
| $30,000 to $34,999 | 0 (0.0%) | 30 (11.4%) |
| $35,000 to $39,999 | 0 (0.0%) | 12 (4.6%) |
| $40,000 to $44,999 | 34 (10.2%) | 6 (2.3%) |
| $45,000 to $49,999 | 18 (5.4%) | 0 (0.0%) |
| $50,000 to $54,999 | 0 (0.0%) | 16 (6.1%) |
| $55,000 to $64,999 | 21 (6.3%) | 11 (4.2%) |
| $65,000 to $74,999 | 22 (6.6%) | 1 (0.4%) |
| $75,000 to $99,999 | 61 (18.3%) | 17 (6.5%) |
| $100,000+ | 22 (6.6%) | 6 (2.3%) |
| Total | 334 (100.0%) | 263 (100.0%) |
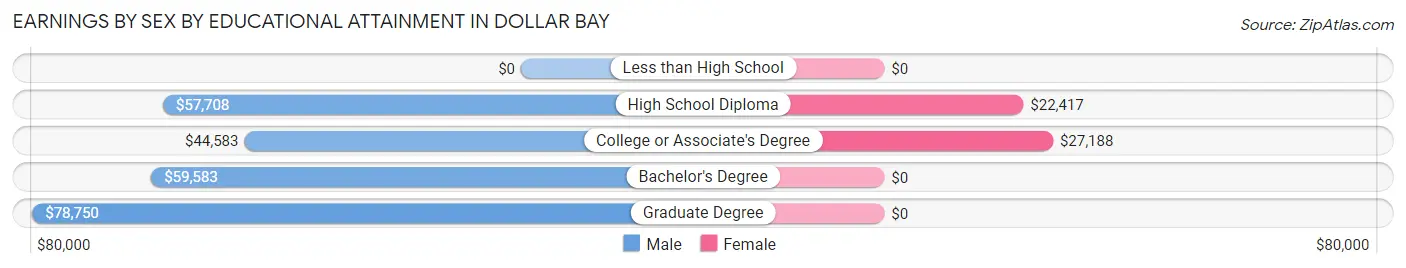
Earnings by Sex by Educational Attainment in Dollar Bay
Average earnings in Dollar Bay are $52,500 for men and $26,458 for women, a difference of 49.6%. Men with an educational attainment of graduate degree enjoy the highest average annual earnings of $78,750, while those with college or associate's degree education earn the least with $44,583. Women with an educational attainment of college or associate's degree earn the most with the average annual earnings of $27,188, while those with high school diploma education have the smallest earnings of $22,417.
| Educational Attainment | Male Income | Female Income |
| Less than High School | - | - |
| High School Diploma | $57,708 | $22,417 |
| College or Associate's Degree | $44,583 | $27,188 |
| Bachelor's Degree | $59,583 | $0 |
| Graduate Degree | $78,750 | $0 |
| Total | $52,500 | $26,458 |
Family Income in Dollar Bay
Family Income Brackets in Dollar Bay
According to the Dollar Bay family income data, there are 68 families falling into the $50,000 to $74,999 income range, which is the most common income bracket and makes up 23.9% of all families.
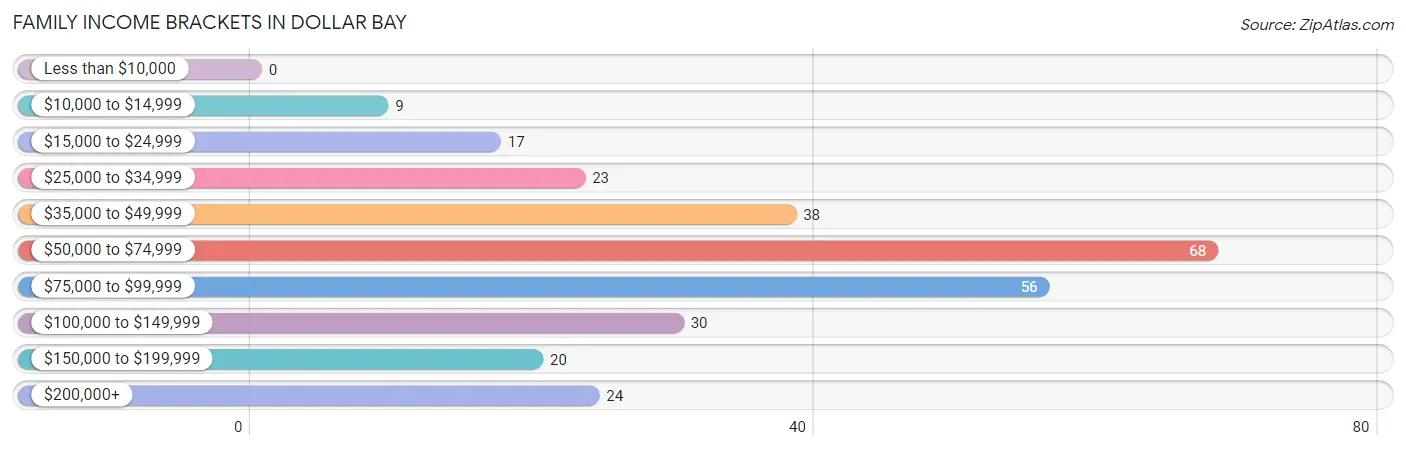
| Income Bracket | # Families | % Families |
| Less than $10,000 | 0 | 0.0% |
| $10,000 to $14,999 | 9 | 3.2% |
| $15,000 to $24,999 | 17 | 6.0% |
| $25,000 to $34,999 | 23 | 8.1% |
| $35,000 to $49,999 | 38 | 13.3% |
| $50,000 to $74,999 | 68 | 23.9% |
| $75,000 to $99,999 | 56 | 19.6% |
| $100,000 to $149,999 | 30 | 10.5% |
| $150,000 to $199,999 | 20 | 7.0% |
| $200,000+ | 24 | 8.4% |
Family Income by Famaliy Size in Dollar Bay
4-person families (49 | 17.2%) account for the highest median family income in Dollar Bay with $165,469 per family, while 4-person families (49 | 17.2%) have the highest median income of $41,367 per family member.
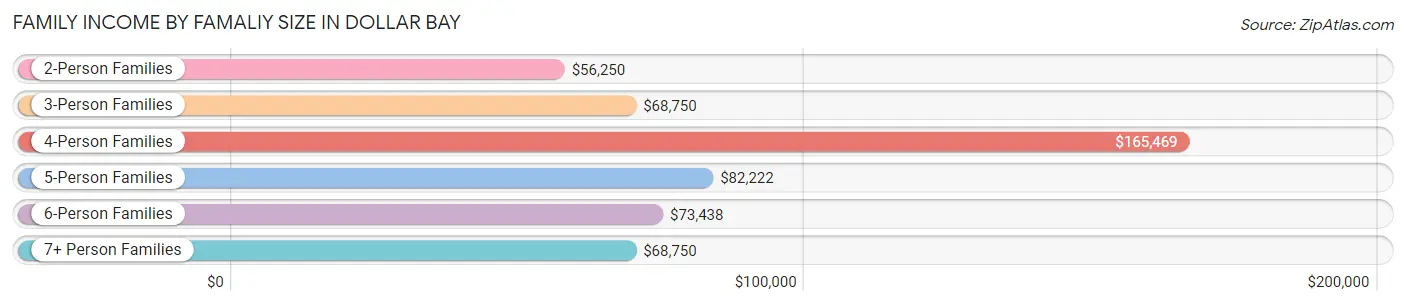
| Income Bracket | # Families | Median Income |
| 2-Person Families | 130 (45.6%) | $56,250 |
| 3-Person Families | 32 (11.2%) | $68,750 |
| 4-Person Families | 49 (17.2%) | $165,469 |
| 5-Person Families | 36 (12.6%) | $82,222 |
| 6-Person Families | 18 (6.3%) | $73,438 |
| 7+ Person Families | 20 (7.0%) | $68,750 |
| Total | 285 (100.0%) | $71,964 |
Family Income by Number of Earners in Dollar Bay
The median family income in Dollar Bay is $71,964, with families comprising 3+ earners (44) having the highest median family income of $91,912, while families with no earners (51) have the lowest median family income of $35,250, accounting for 15.4% and 17.9% of families, respectively.
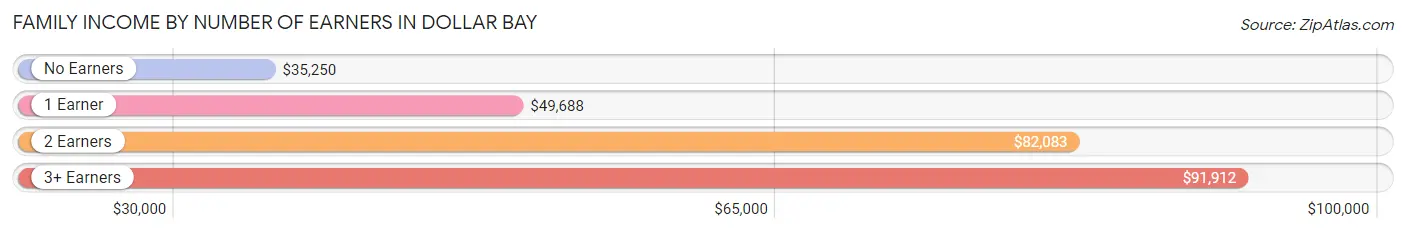
| Number of Earners | # Families | Median Income |
| No Earners | 51 (17.9%) | $35,250 |
| 1 Earner | 55 (19.3%) | $49,688 |
| 2 Earners | 135 (47.4%) | $82,083 |
| 3+ Earners | 44 (15.4%) | $91,912 |
| Total | 285 (100.0%) | $71,964 |
Household Income in Dollar Bay
Household Income Brackets in Dollar Bay
With 91 households falling in the category, the $50,000 to $74,999 income range is the most frequent in Dollar Bay, accounting for 21.8% of all households. In contrast, only 7 households (1.7%) fall into the less than $10,000 income bracket, making it the least populous group.
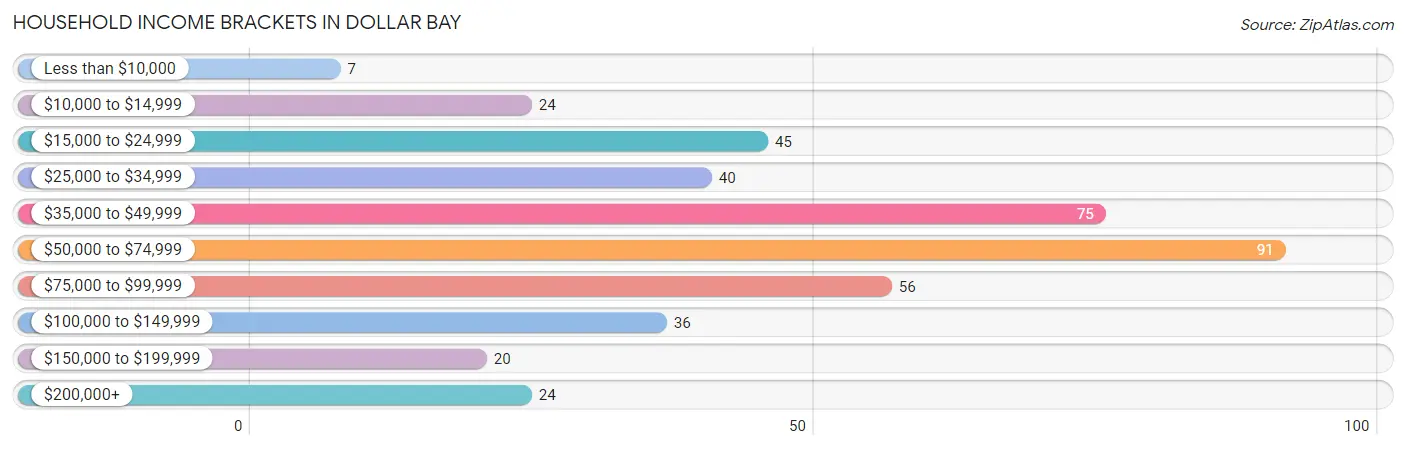
| Income Bracket | # Households | % Households |
| Less than $10,000 | 7 | 1.7% |
| $10,000 to $14,999 | 24 | 5.7% |
| $15,000 to $24,999 | 45 | 10.8% |
| $25,000 to $34,999 | 40 | 9.6% |
| $35,000 to $49,999 | 75 | 17.9% |
| $50,000 to $74,999 | 91 | 21.8% |
| $75,000 to $99,999 | 56 | 13.4% |
| $100,000 to $149,999 | 36 | 8.6% |
| $150,000 to $199,999 | 20 | 4.8% |
| $200,000+ | 24 | 5.7% |
Household Income by Householder Age in Dollar Bay
The median household income in Dollar Bay is $60,294, with the highest median household income of $91,538 found in the 45 to 64 years age bracket for the primary householder. A total of 156 households (37.3%) fall into this category. Meanwhile, the 65+ years age bracket for the primary householder has the lowest median household income of $37,250, with 117 households (28.0%) in this group.
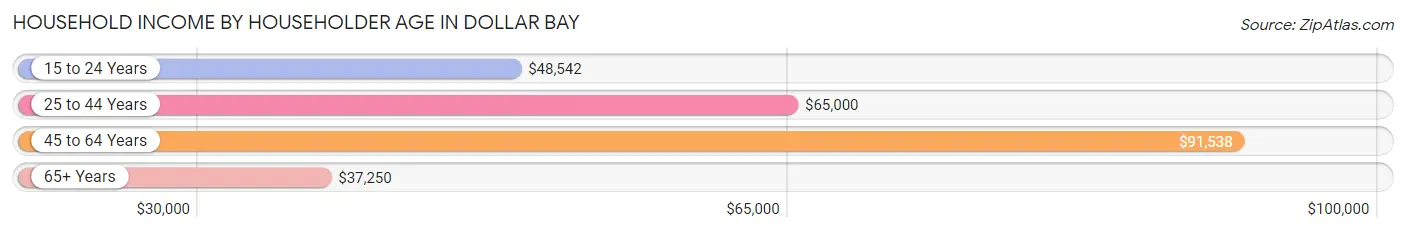
| Income Bracket | # Households | Median Income |
| 15 to 24 Years | 17 (4.1%) | $48,542 |
| 25 to 44 Years | 128 (30.6%) | $65,000 |
| 45 to 64 Years | 156 (37.3%) | $91,538 |
| 65+ Years | 117 (28.0%) | $37,250 |
| Total | 418 (100.0%) | $60,294 |
Poverty in Dollar Bay
Income Below Poverty by Sex and Age in Dollar Bay
With 12.7% poverty level for males and 12.4% for females among the residents of Dollar Bay, 25 to 34 year old males and 5 year old females are the most vulnerable to poverty, with 30 males (46.9%) and 4 females (100.0%) in their respective age groups living below the poverty level.
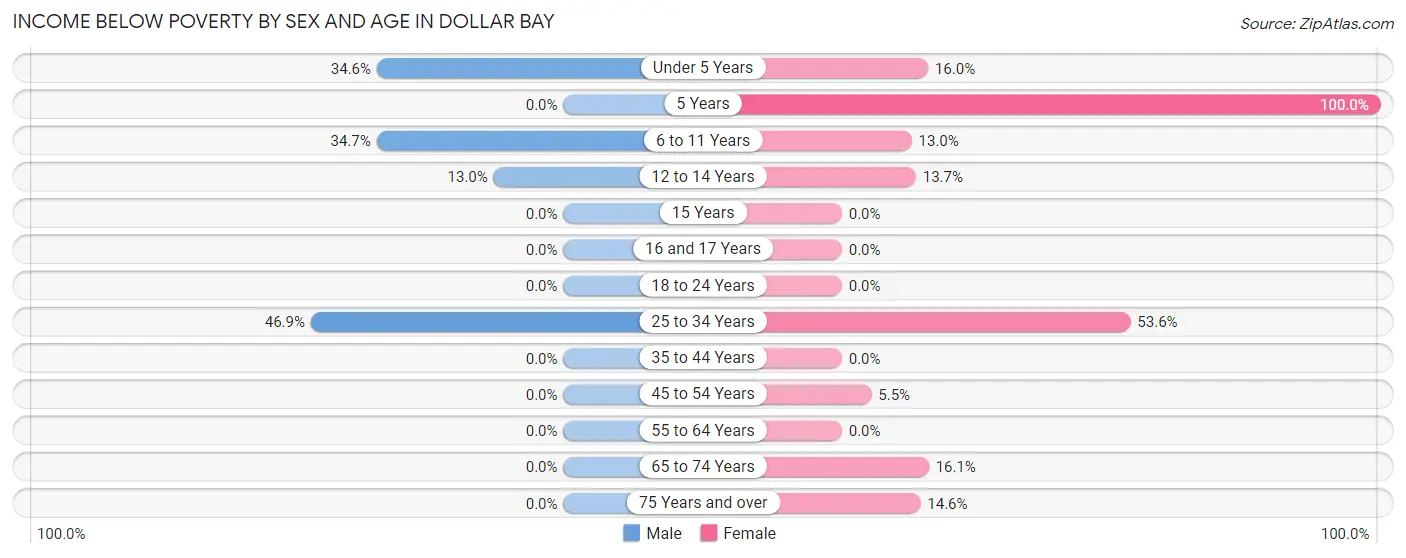
| Age Bracket | Male | Female |
| Under 5 Years | 18 (34.6%) | 4 (16.0%) |
| 5 Years | 0 (0.0%) | 4 (100.0%) |
| 6 to 11 Years | 26 (34.7%) | 7 (13.0%) |
| 12 to 14 Years | 7 (13.0%) | 7 (13.7%) |
| 15 Years | 0 (0.0%) | 0 (0.0%) |
| 16 and 17 Years | 0 (0.0%) | 0 (0.0%) |
| 18 to 24 Years | 0 (0.0%) | 0 (0.0%) |
| 25 to 34 Years | 30 (46.9%) | 30 (53.6%) |
| 35 to 44 Years | 0 (0.0%) | 0 (0.0%) |
| 45 to 54 Years | 0 (0.0%) | 4 (5.5%) |
| 55 to 64 Years | 0 (0.0%) | 0 (0.0%) |
| 65 to 74 Years | 0 (0.0%) | 5 (16.1%) |
| 75 Years and over | 0 (0.0%) | 7 (14.6%) |
| Total | 81 (12.7%) | 68 (12.4%) |
Income Above Poverty by Sex and Age in Dollar Bay
According to the poverty statistics in Dollar Bay, males aged 5 years and females aged 15 years are the age groups that are most secure financially, with 100.0% of males and 100.0% of females in these age groups living above the poverty line.
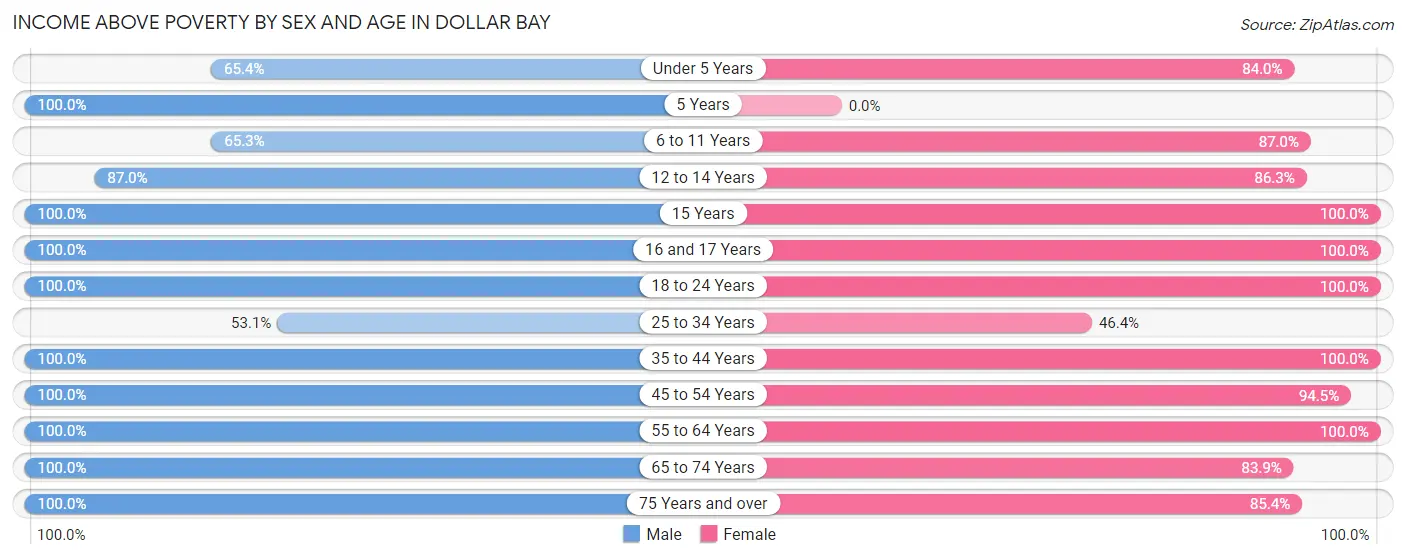
| Age Bracket | Male | Female |
| Under 5 Years | 34 (65.4%) | 21 (84.0%) |
| 5 Years | 6 (100.0%) | 0 (0.0%) |
| 6 to 11 Years | 49 (65.3%) | 47 (87.0%) |
| 12 to 14 Years | 47 (87.0%) | 44 (86.3%) |
| 15 Years | 7 (100.0%) | 6 (100.0%) |
| 16 and 17 Years | 5 (100.0%) | 14 (100.0%) |
| 18 to 24 Years | 93 (100.0%) | 73 (100.0%) |
| 25 to 34 Years | 34 (53.1%) | 26 (46.4%) |
| 35 to 44 Years | 73 (100.0%) | 69 (100.0%) |
| 45 to 54 Years | 47 (100.0%) | 69 (94.5%) |
| 55 to 64 Years | 79 (100.0%) | 44 (100.0%) |
| 65 to 74 Years | 51 (100.0%) | 26 (83.9%) |
| 75 Years and over | 30 (100.0%) | 41 (85.4%) |
| Total | 555 (87.3%) | 480 (87.6%) |
Income Below Poverty Among Married-Couple Families in Dollar Bay
The poverty statistics for married-couple families in Dollar Bay show that 8.8% or 21 of the total 238 families live below the poverty line. Families with 5 or more children have the highest poverty rate of 47.1%, comprising of 8 families. On the other hand, families with 1 or 2 children have the lowest poverty rate of 0.0%, which includes 0 families.
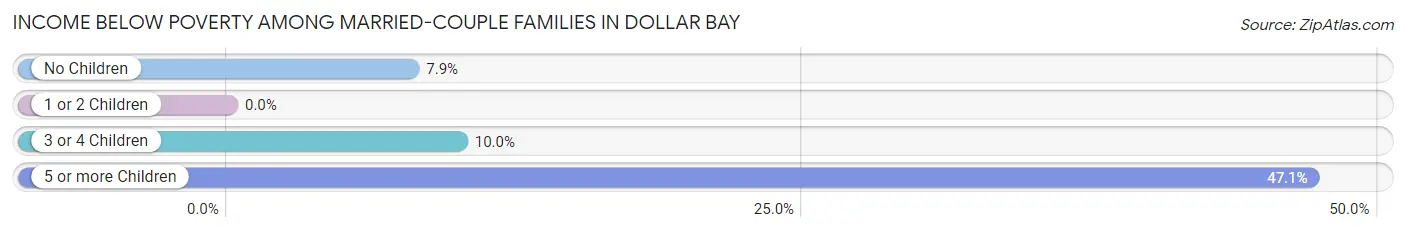
| Children | Above Poverty | Below Poverty |
| No Children | 105 (92.1%) | 9 (7.9%) |
| 1 or 2 Children | 67 (100.0%) | 0 (0.0%) |
| 3 or 4 Children | 36 (90.0%) | 4 (10.0%) |
| 5 or more Children | 9 (52.9%) | 8 (47.1%) |
| Total | 217 (91.2%) | 21 (8.8%) |
Income Below Poverty Among Single-Parent Households in Dollar Bay
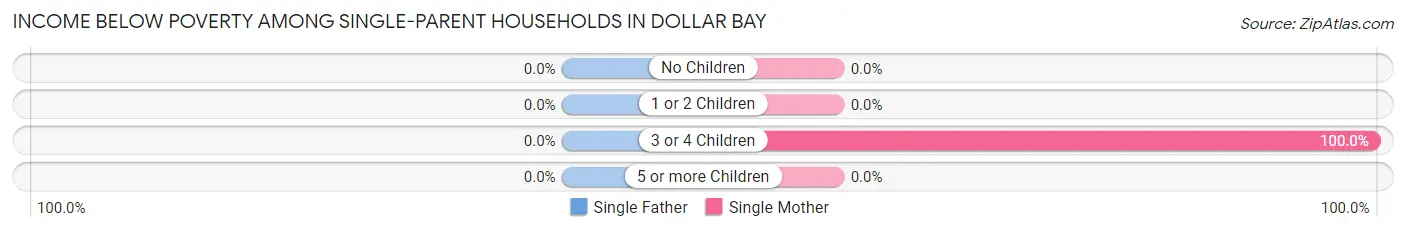
| Children | Single Father | Single Mother |
| No Children | 0 (0.0%) | 0 (0.0%) |
| 1 or 2 Children | 0 (0.0%) | 0 (0.0%) |
| 3 or 4 Children | 0 (0.0%) | 9 (100.0%) |
| 5 or more Children | 0 (0.0%) | 0 (0.0%) |
| Total | 0 (0.0%) | 9 (37.5%) |
Income Below Poverty Among Married-Couple vs Single-Parent Households in Dollar Bay
The poverty data for Dollar Bay shows that 21 of the married-couple family households (8.8%) and 9 of the single-parent households (19.2%) are living below the poverty level. Within the married-couple family households, those with 5 or more children have the highest poverty rate, with 8 households (47.1%) falling below the poverty line. Among the single-parent households, those with 3 or 4 children have the highest poverty rate, with 9 household (100.0%) living below poverty.
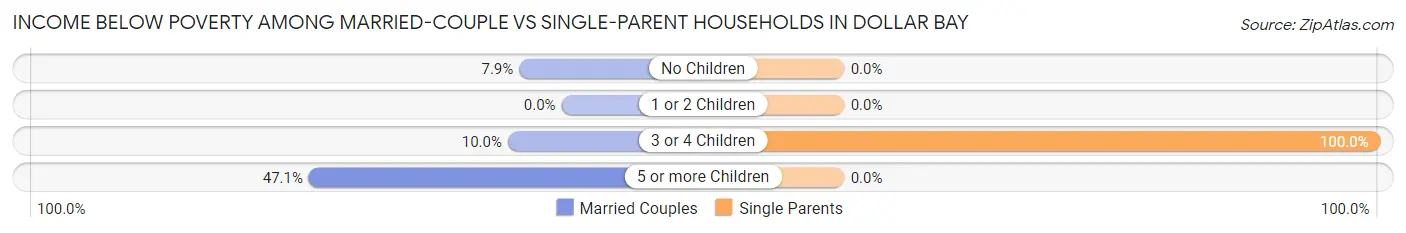
| Children | Married-Couple Families | Single-Parent Households |
| No Children | 9 (7.9%) | 0 (0.0%) |
| 1 or 2 Children | 0 (0.0%) | 0 (0.0%) |
| 3 or 4 Children | 4 (10.0%) | 9 (100.0%) |
| 5 or more Children | 8 (47.1%) | 0 (0.0%) |
| Total | 21 (8.8%) | 9 (19.2%) |
Race in Dollar Bay
The most populous races in Dollar Bay are White / Caucasian (1,144 | 96.6%), Two or more Races (28 | 2.4%), and Black / African American (8 | 0.7%).
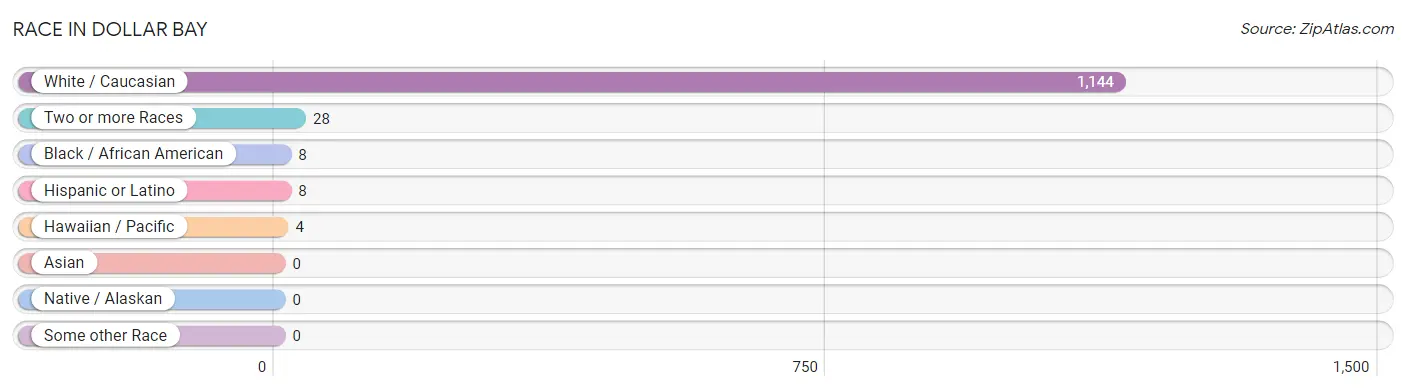
| Race | # Population | % Population |
| Asian | 0 | 0.0% |
| Black / African American | 8 | 0.7% |
| Hawaiian / Pacific | 4 | 0.3% |
| Hispanic or Latino | 8 | 0.7% |
| Native / Alaskan | 0 | 0.0% |
| White / Caucasian | 1,144 | 96.6% |
| Two or more Races | 28 | 2.4% |
| Some other Race | 0 | 0.0% |
| Total | 1,184 | 100.0% |
Ancestry in Dollar Bay
The most populous ancestries reported in Dollar Bay are Finnish (627 | 53.0%), German (165 | 13.9%), French (113 | 9.5%), Swedish (107 | 9.0%), and Irish (84 | 7.1%), together accounting for 92.6% of all Dollar Bay residents.
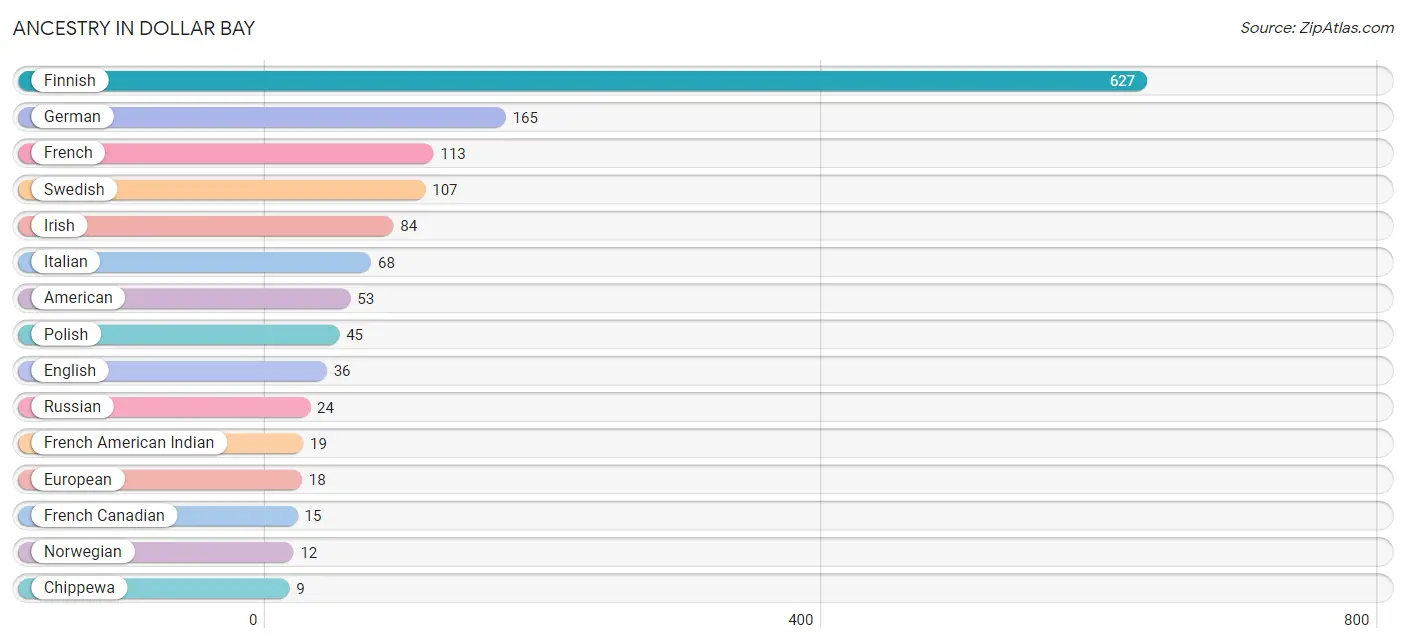
| Ancestry | # Population | % Population |
| American | 53 | 4.5% |
| Chippewa | 9 | 0.8% |
| Croatian | 9 | 0.8% |
| Cuban | 8 | 0.7% |
| Czech | 4 | 0.3% |
| Dutch | 8 | 0.7% |
| English | 36 | 3.0% |
| Ethiopian | 2 | 0.2% |
| European | 18 | 1.5% |
| Finnish | 627 | 53.0% |
| French | 113 | 9.5% |
| French American Indian | 19 | 1.6% |
| French Canadian | 15 | 1.3% |
| German | 165 | 13.9% |
| Irish | 84 | 7.1% |
| Italian | 68 | 5.7% |
| Norwegian | 12 | 1.0% |
| Polish | 45 | 3.8% |
| Russian | 24 | 2.0% |
| Samoan | 4 | 0.3% |
| Scotch-Irish | 3 | 0.3% |
| Scottish | 8 | 0.7% |
| Subsaharan African | 2 | 0.2% |
| Swedish | 107 | 9.0% |
| Yugoslavian | 5 | 0.4% | View All 25 Rows |
Immigrants in Dollar Bay
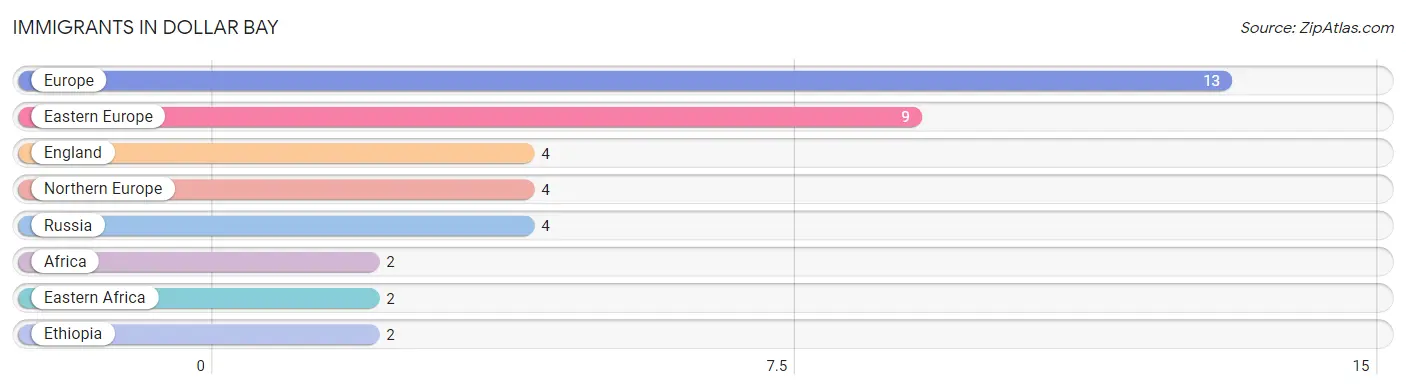
The most numerous immigrant groups reported in Dollar Bay came from Europe (13 | 1.1%), Eastern Europe (9 | 0.8%), England (4 | 0.3%), Northern Europe (4 | 0.3%), and Russia (4 | 0.3%), together accounting for 2.9% of all Dollar Bay residents.
| Immigration Origin | # Population | % Population |
| Africa | 2 | 0.2% |
| Eastern Africa | 2 | 0.2% |
| Eastern Europe | 9 | 0.8% |
| England | 4 | 0.3% |
| Ethiopia | 2 | 0.2% |
| Europe | 13 | 1.1% |
| Northern Europe | 4 | 0.3% |
| Russia | 4 | 0.3% | View All 8 Rows |
Sex and Age in Dollar Bay
Sex and Age in Dollar Bay
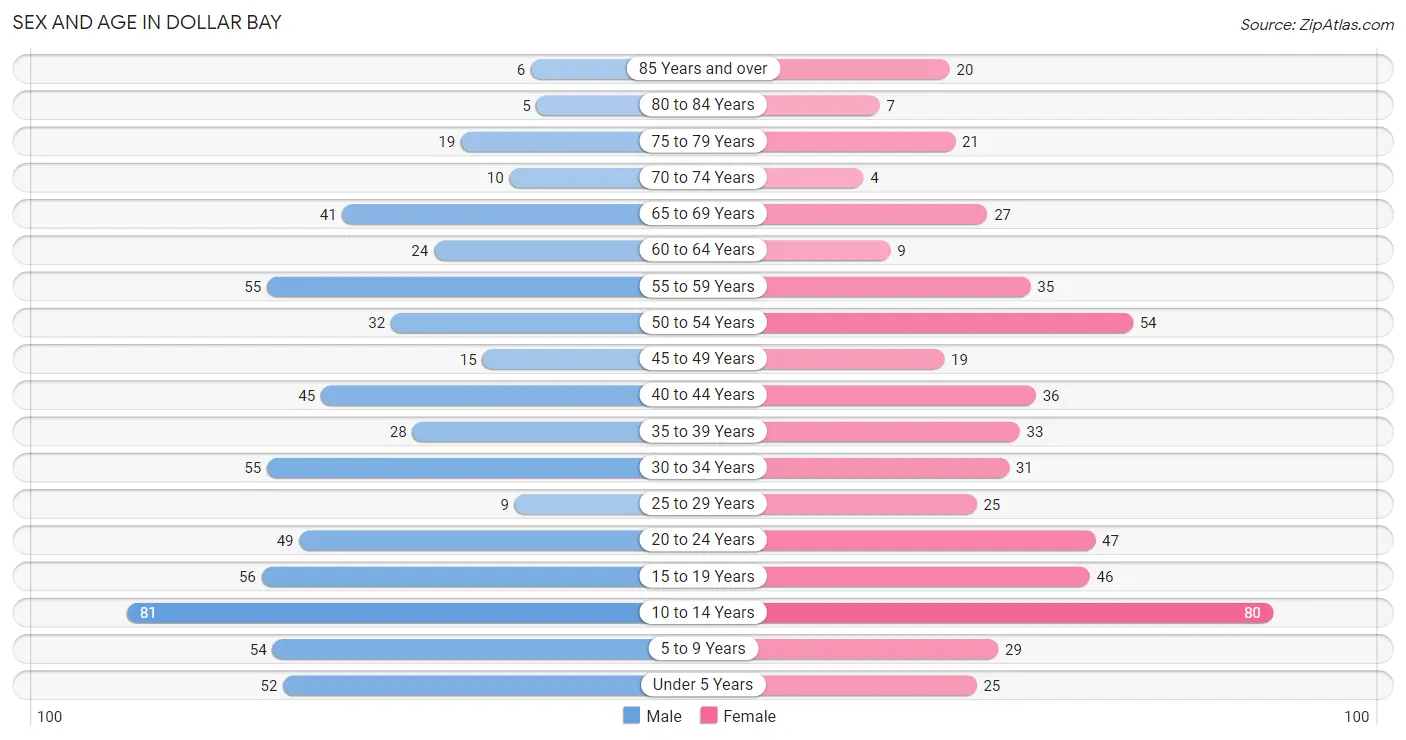
The most populous age groups in Dollar Bay are 10 to 14 Years (81 | 12.7%) for men and 10 to 14 Years (80 | 14.6%) for women.
| Age Bracket | Male | Female |
| Under 5 Years | 52 (8.2%) | 25 (4.6%) |
| 5 to 9 Years | 54 (8.5%) | 29 (5.3%) |
| 10 to 14 Years | 81 (12.7%) | 80 (14.6%) |
| 15 to 19 Years | 56 (8.8%) | 46 (8.4%) |
| 20 to 24 Years | 49 (7.7%) | 47 (8.6%) |
| 25 to 29 Years | 9 (1.4%) | 25 (4.6%) |
| 30 to 34 Years | 55 (8.6%) | 31 (5.7%) |
| 35 to 39 Years | 28 (4.4%) | 33 (6.0%) |
| 40 to 44 Years | 45 (7.1%) | 36 (6.6%) |
| 45 to 49 Years | 15 (2.4%) | 19 (3.5%) |
| 50 to 54 Years | 32 (5.0%) | 54 (9.9%) |
| 55 to 59 Years | 55 (8.6%) | 35 (6.4%) |
| 60 to 64 Years | 24 (3.8%) | 9 (1.6%) |
| 65 to 69 Years | 41 (6.5%) | 27 (4.9%) |
| 70 to 74 Years | 10 (1.6%) | 4 (0.7%) |
| 75 to 79 Years | 19 (3.0%) | 21 (3.8%) |
| 80 to 84 Years | 5 (0.8%) | 7 (1.3%) |
| 85 Years and over | 6 (0.9%) | 20 (3.6%) |
| Total | 636 (100.0%) | 548 (100.0%) |
Families and Households in Dollar Bay
Median Family Size in Dollar Bay
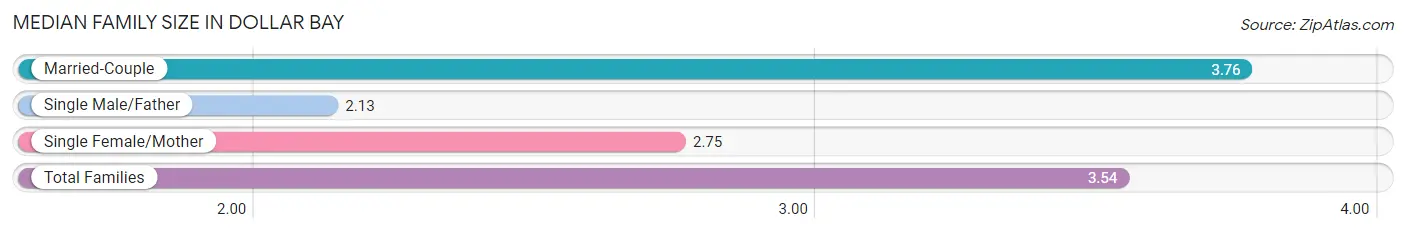
The median family size in Dollar Bay is 3.54 persons per family, with married-couple families (238 | 83.5%) accounting for the largest median family size of 3.76 persons per family. On the other hand, single male/father families (23 | 8.1%) represent the smallest median family size with 2.13 persons per family.
| Family Type | # Families | Family Size |
| Married-Couple | 238 (83.5%) | 3.76 |
| Single Male/Father | 23 (8.1%) | 2.13 |
| Single Female/Mother | 24 (8.4%) | 2.75 |
| Total Families | 285 (100.0%) | 3.54 |
Median Household Size in Dollar Bay
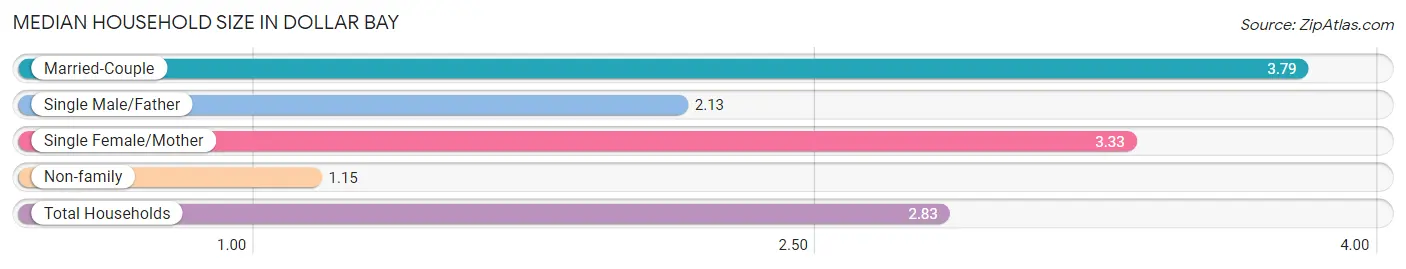
The median household size in Dollar Bay is 2.83 persons per household, with married-couple households (238 | 56.9%) accounting for the largest median household size of 3.79 persons per household. non-family households (133 | 31.8%) represent the smallest median household size with 1.15 persons per household.
| Household Type | # Households | Household Size |
| Married-Couple | 238 (56.9%) | 3.79 |
| Single Male/Father | 23 (5.5%) | 2.13 |
| Single Female/Mother | 24 (5.7%) | 3.33 |
| Non-family | 133 (31.8%) | 1.15 |
| Total Households | 418 (100.0%) | 2.83 |
Household Size by Marriage Status in Dollar Bay
Out of a total of 418 households in Dollar Bay, 285 (68.2%) are family households, while 133 (31.8%) are nonfamily households. The most numerous type of family households are 2-person households, comprising 124, and the most common type of nonfamily households are 1-person households, comprising 115.
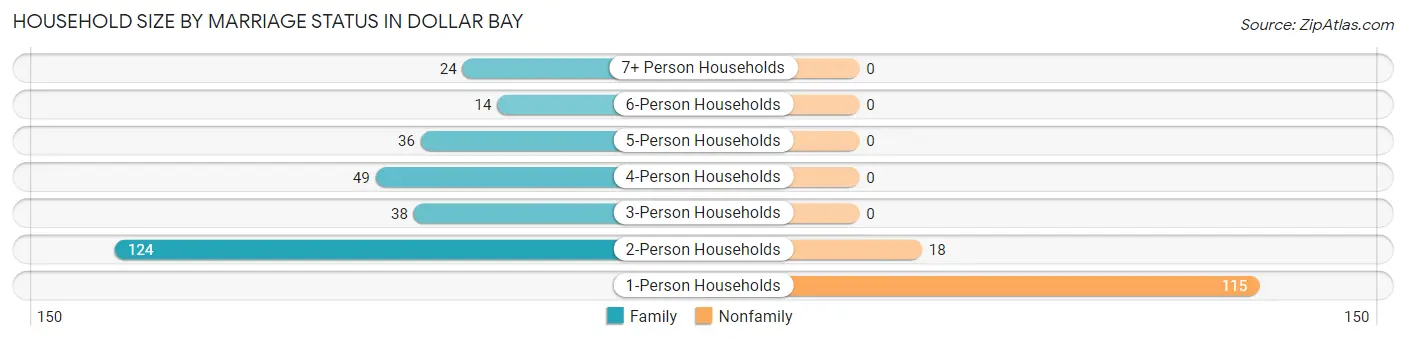
| Household Size | Family Households | Nonfamily Households |
| 1-Person Households | - | 115 (27.5%) |
| 2-Person Households | 124 (29.7%) | 18 (4.3%) |
| 3-Person Households | 38 (9.1%) | 0 (0.0%) |
| 4-Person Households | 49 (11.7%) | 0 (0.0%) |
| 5-Person Households | 36 (8.6%) | 0 (0.0%) |
| 6-Person Households | 14 (3.4%) | 0 (0.0%) |
| 7+ Person Households | 24 (5.7%) | 0 (0.0%) |
| Total | 285 (68.2%) | 133 (31.8%) |
Female Fertility in Dollar Bay
Fertility by Age in Dollar Bay
Average fertility rate in Dollar Bay is 55.0 births per 1,000 women. Women in the age bracket of 20 to 34 years have the highest fertility rate with 87.0 births per 1,000 women. Women in the age bracket of 20 to 34 years acount for 64.3% of all women with births.
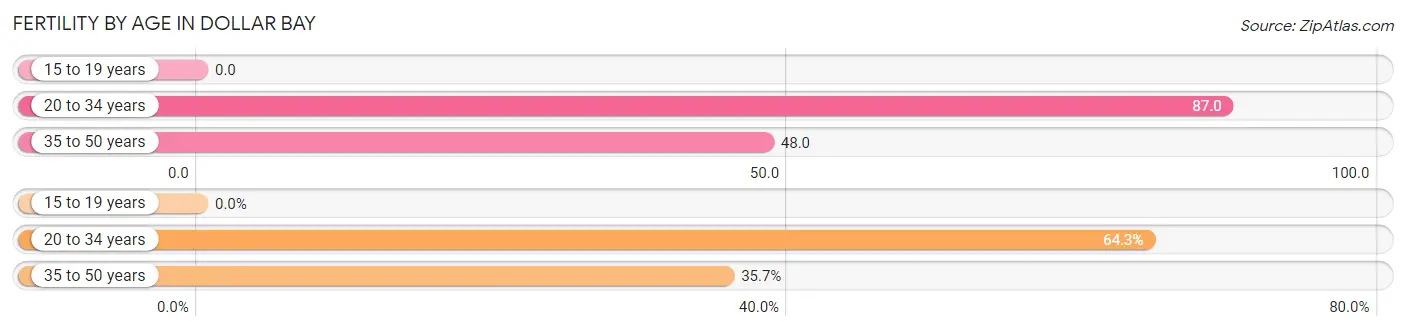
| Age Bracket | Women with Births | Births / 1,000 Women |
| 15 to 19 years | 0 (0.0%) | 0.0 |
| 20 to 34 years | 9 (64.3%) | 87.0 |
| 35 to 50 years | 5 (35.7%) | 48.0 |
| Total | 14 (100.0%) | 55.0 |
Fertility by Age by Marriage Status in Dollar Bay
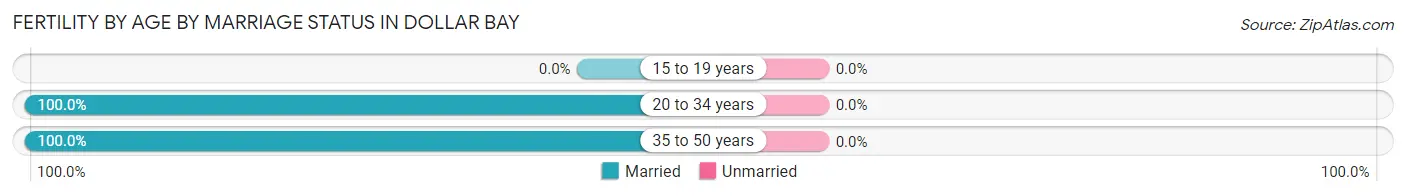
| Age Bracket | Married | Unmarried |
| 15 to 19 years | 0 (0.0%) | 0 (0.0%) |
| 20 to 34 years | 9 (100.0%) | 0 (0.0%) |
| 35 to 50 years | 5 (100.0%) | 0 (0.0%) |
| Total | 14 (100.0%) | 0 (0.0%) |
Fertility by Education in Dollar Bay
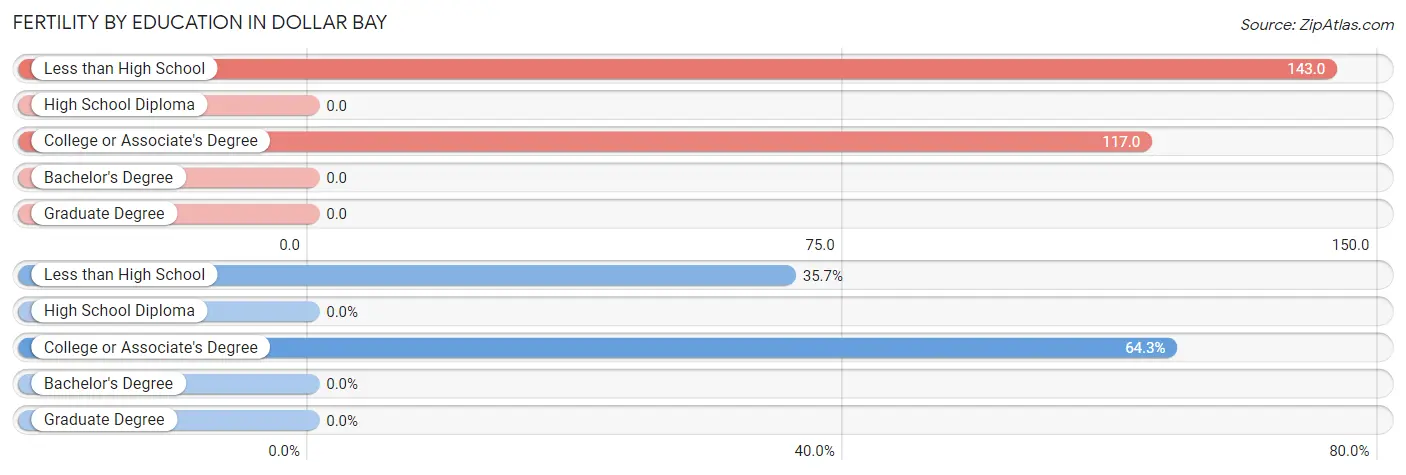
| Educational Attainment | Women with Births | Births / 1,000 Women |
| Less than High School | 5 (35.7%) | 143.0 |
| High School Diploma | 0 (0.0%) | 0.0 |
| College or Associate's Degree | 9 (64.3%) | 117.0 |
| Bachelor's Degree | 0 (0.0%) | 0.0 |
| Graduate Degree | 0 (0.0%) | 0.0 |
| Total | 14 (100.0%) | 55.0 |
Fertility by Education by Marriage Status in Dollar Bay
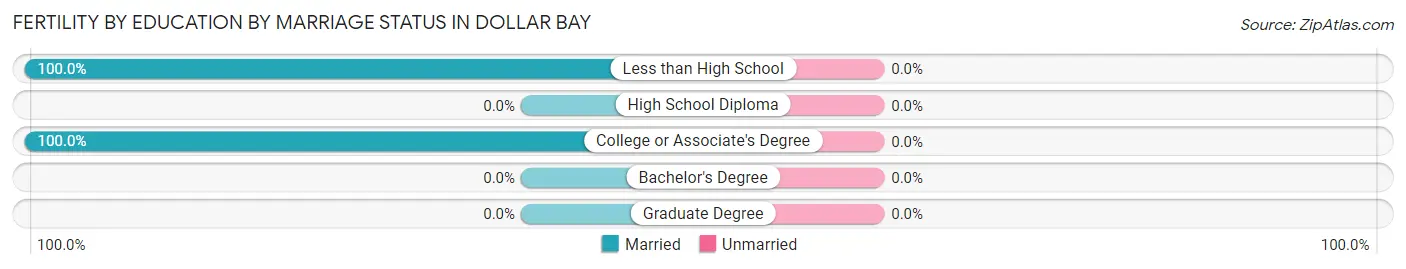
| Educational Attainment | Married | Unmarried |
| Less than High School | 5 (100.0%) | 0 (0.0%) |
| High School Diploma | 0 (0.0%) | 0 (0.0%) |
| College or Associate's Degree | 9 (100.0%) | 0 (0.0%) |
| Bachelor's Degree | 0 (0.0%) | 0 (0.0%) |
| Graduate Degree | 0 (0.0%) | 0 (0.0%) |
| Total | 14 (100.0%) | 0 (0.0%) |
Employment Characteristics in Dollar Bay
Employment by Class of Employer in Dollar Bay
Among the 532 employed individuals in Dollar Bay, private company employees (338 | 63.5%), not-for-profit organizations (61 | 11.5%), and state government employees (43 | 8.1%) make up the most common classes of employment.
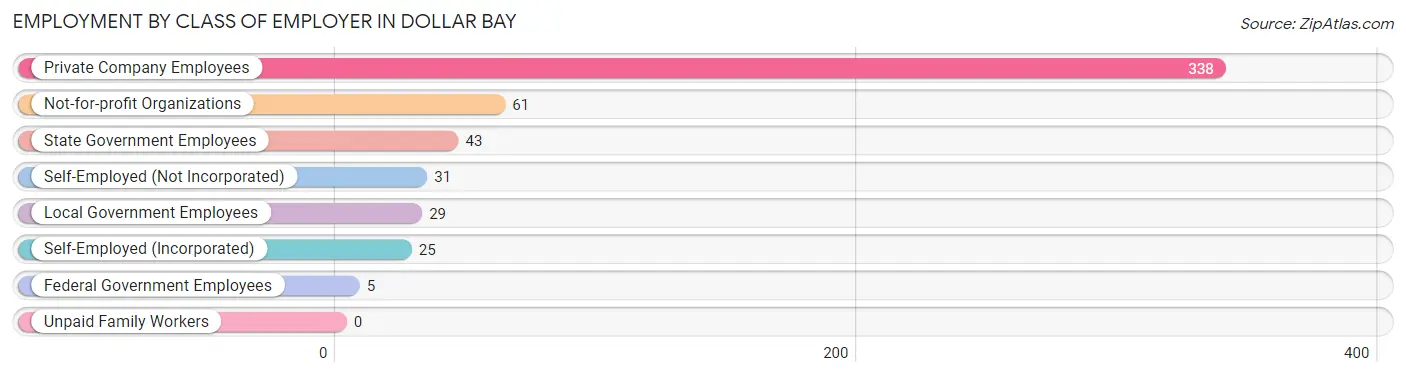
| Employer Class | # Employees | % Employees |
| Private Company Employees | 338 | 63.5% |
| Self-Employed (Incorporated) | 25 | 4.7% |
| Self-Employed (Not Incorporated) | 31 | 5.8% |
| Not-for-profit Organizations | 61 | 11.5% |
| Local Government Employees | 29 | 5.4% |
| State Government Employees | 43 | 8.1% |
| Federal Government Employees | 5 | 0.9% |
| Unpaid Family Workers | 0 | 0.0% |
| Total | 532 | 100.0% |
Employment Status by Age in Dollar Bay
According to the labor force statistics for Dollar Bay, out of the total population over 16 years of age (850), 66.2% or 563 individuals are in the labor force, with 2.7% or 15 of them unemployed. The age group with the highest labor force participation rate is 25 to 29 years, with 100.0% or 34 individuals in the labor force. Within the labor force, the 55 to 59 years age range has the highest percentage of unemployed individuals, with 14.5% or 10 of them being unemployed.
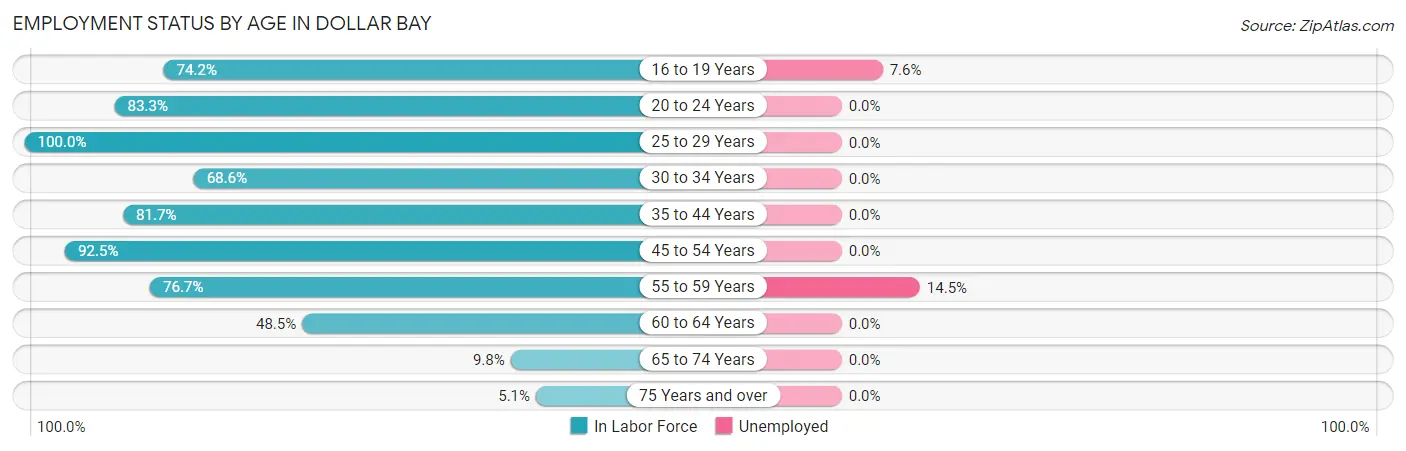
| Age Bracket | In Labor Force | Unemployed |
| 16 to 19 Years | 66 (74.2%) | 5 (7.6%) |
| 20 to 24 Years | 80 (83.3%) | 0 (0.0%) |
| 25 to 29 Years | 34 (100.0%) | 0 (0.0%) |
| 30 to 34 Years | 59 (68.6%) | 0 (0.0%) |
| 35 to 44 Years | 116 (81.7%) | 0 (0.0%) |
| 45 to 54 Years | 111 (92.5%) | 0 (0.0%) |
| 55 to 59 Years | 69 (76.7%) | 10 (14.5%) |
| 60 to 64 Years | 16 (48.5%) | 0 (0.0%) |
| 65 to 74 Years | 8 (9.8%) | 0 (0.0%) |
| 75 Years and over | 4 (5.1%) | 0 (0.0%) |
| Total | 563 (66.2%) | 15 (2.7%) |
Employment Status by Educational Attainment in Dollar Bay
According to labor force statistics for Dollar Bay, 80.2% of individuals (405) out of the total population between 25 and 64 years of age (505) are in the labor force, with 2.5% or 10 of them being unemployed. The group with the highest labor force participation rate are those with the educational attainment of less than high school, with 100.0% or 15 individuals in the labor force. Within the labor force, individuals with high school diploma education have the highest percentage of unemployment, with 3.4% or 5 of them being unemployed.
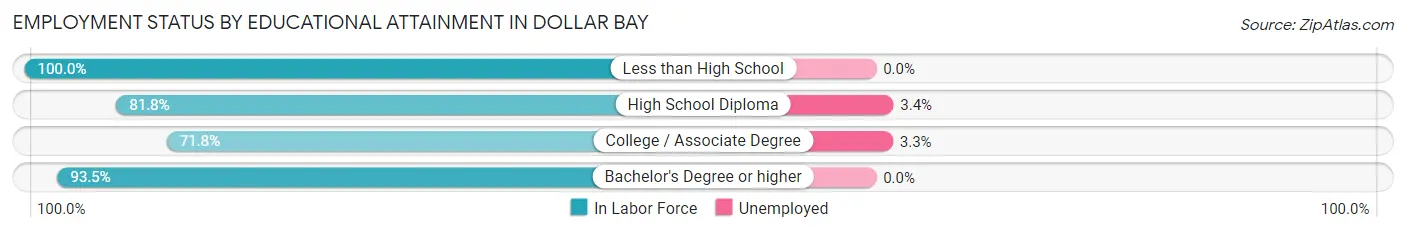
| Educational Attainment | In Labor Force | Unemployed |
| Less than High School | 15 (100.0%) | 0 (0.0%) |
| High School Diploma | 148 (81.8%) | 6 (3.4%) |
| College / Associate Degree | 155 (71.8%) | 7 (3.3%) |
| Bachelor's Degree or higher | 87 (93.5%) | 0 (0.0%) |
| Total | 405 (80.2%) | 13 (2.5%) |
Employment Occupations by Sex in Dollar Bay
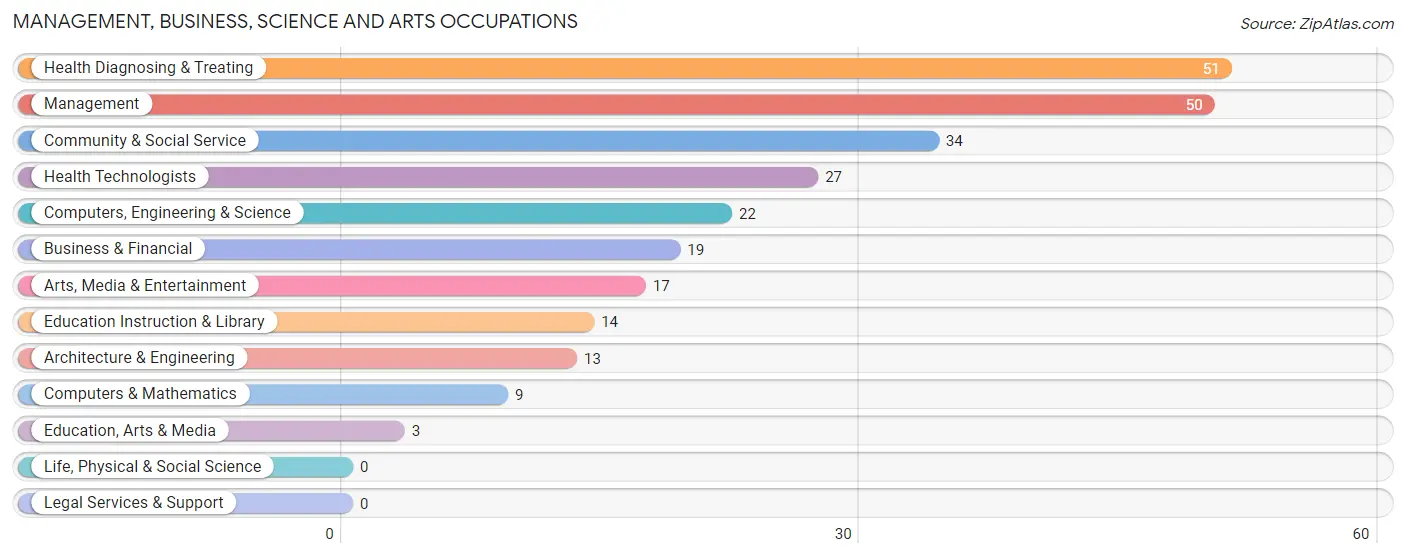
Management, Business, Science and Arts Occupations
The most common Management, Business, Science and Arts occupations in Dollar Bay are Health Diagnosing & Treating (51 | 9.4%), Management (50 | 9.2%), Community & Social Service (34 | 6.3%), Health Technologists (27 | 5.0%), and Computers, Engineering & Science (22 | 4.1%).
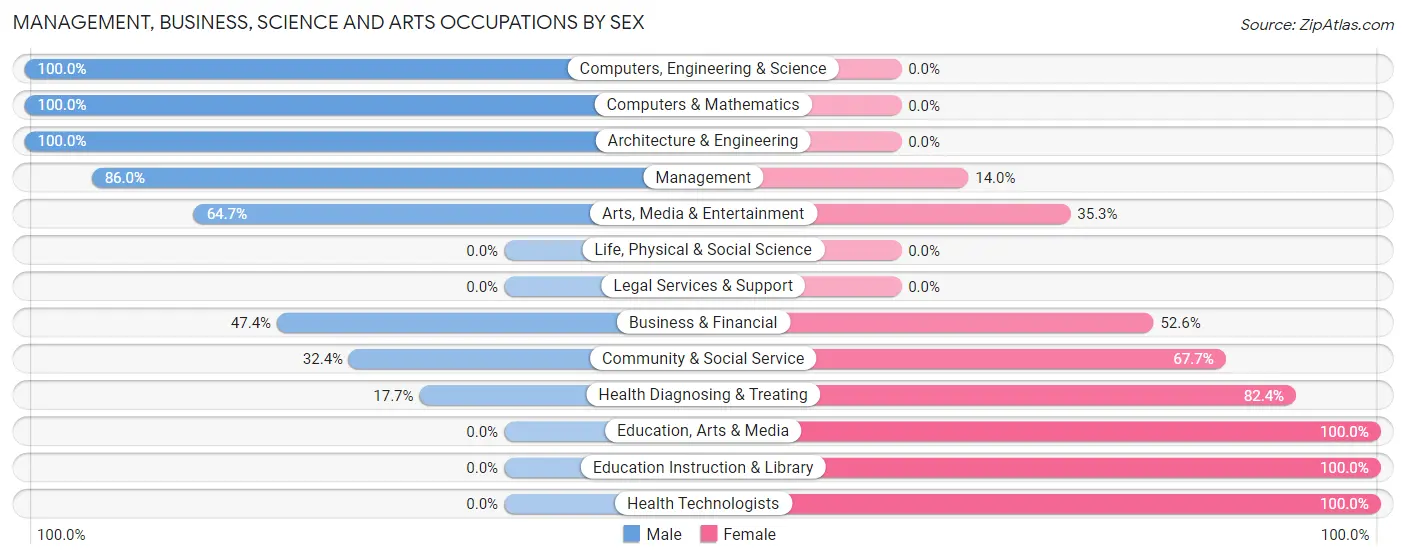
Management, Business, Science and Arts Occupations by Sex
Within the Management, Business, Science and Arts occupations in Dollar Bay, the most male-oriented occupations are Computers, Engineering & Science (100.0%), Computers & Mathematics (100.0%), and Architecture & Engineering (100.0%), while the most female-oriented occupations are Education, Arts & Media (100.0%), Education Instruction & Library (100.0%), and Health Technologists (100.0%).
| Occupation | Male | Female |
| Management | 43 (86.0%) | 7 (14.0%) |
| Business & Financial | 9 (47.4%) | 10 (52.6%) |
| Computers, Engineering & Science | 22 (100.0%) | 0 (0.0%) |
| Computers & Mathematics | 9 (100.0%) | 0 (0.0%) |
| Architecture & Engineering | 13 (100.0%) | 0 (0.0%) |
| Life, Physical & Social Science | 0 (0.0%) | 0 (0.0%) |
| Community & Social Service | 11 (32.4%) | 23 (67.6%) |
| Education, Arts & Media | 0 (0.0%) | 3 (100.0%) |
| Legal Services & Support | 0 (0.0%) | 0 (0.0%) |
| Education Instruction & Library | 0 (0.0%) | 14 (100.0%) |
| Arts, Media & Entertainment | 11 (64.7%) | 6 (35.3%) |
| Health Diagnosing & Treating | 9 (17.6%) | 42 (82.4%) |
| Health Technologists | 0 (0.0%) | 27 (100.0%) |
| Total (Category) | 94 (53.4%) | 82 (46.6%) |
| Total (Overall) | 319 (58.8%) | 224 (41.2%) |
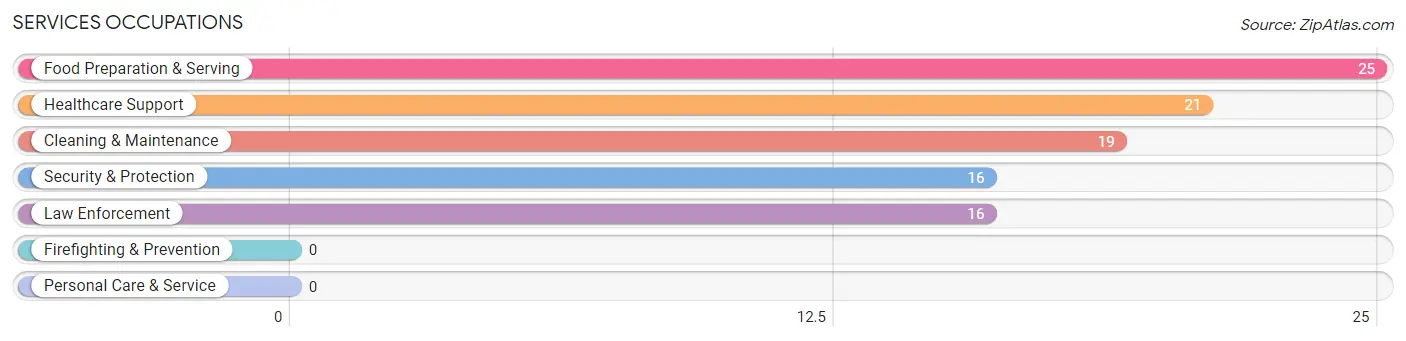
Services Occupations
The most common Services occupations in Dollar Bay are Food Preparation & Serving (25 | 4.6%), Healthcare Support (21 | 3.9%), Cleaning & Maintenance (19 | 3.5%), Security & Protection (16 | 2.9%), and Law Enforcement (16 | 2.9%).
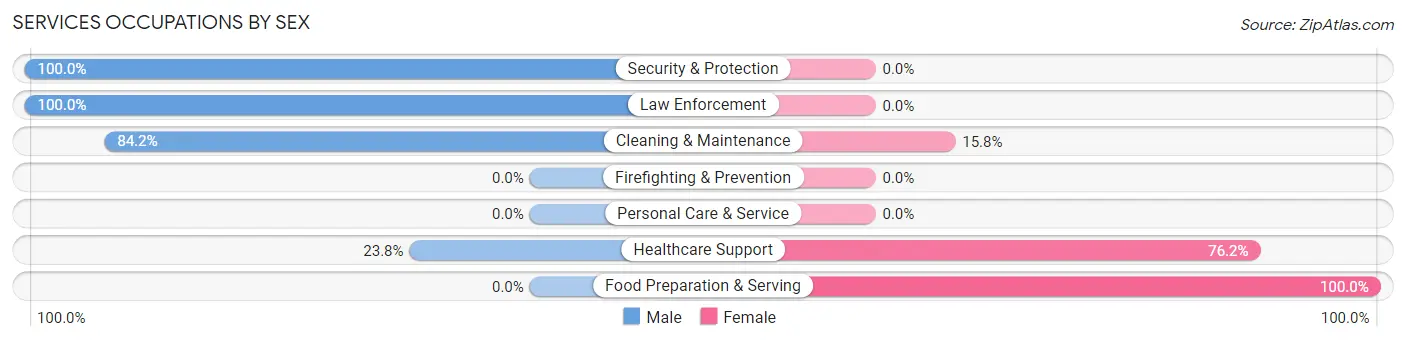
Services Occupations by Sex
Within the Services occupations in Dollar Bay, the most male-oriented occupations are Security & Protection (100.0%), Law Enforcement (100.0%), and Cleaning & Maintenance (84.2%), while the most female-oriented occupations are Food Preparation & Serving (100.0%), Healthcare Support (76.2%), and Cleaning & Maintenance (15.8%).
| Occupation | Male | Female |
| Healthcare Support | 5 (23.8%) | 16 (76.2%) |
| Security & Protection | 16 (100.0%) | 0 (0.0%) |
| Firefighting & Prevention | 0 (0.0%) | 0 (0.0%) |
| Law Enforcement | 16 (100.0%) | 0 (0.0%) |
| Food Preparation & Serving | 0 (0.0%) | 25 (100.0%) |
| Cleaning & Maintenance | 16 (84.2%) | 3 (15.8%) |
| Personal Care & Service | 0 (0.0%) | 0 (0.0%) |
| Total (Category) | 37 (45.7%) | 44 (54.3%) |
| Total (Overall) | 319 (58.8%) | 224 (41.2%) |
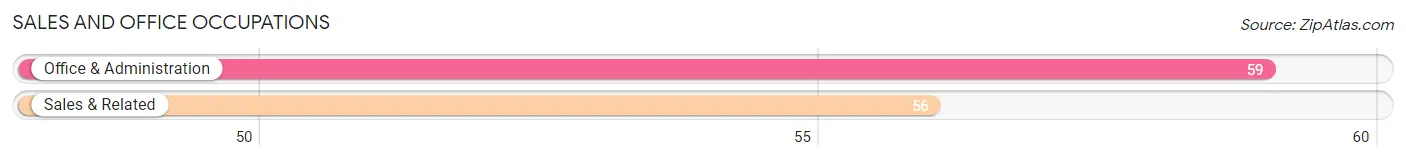
Sales and Office Occupations
The most common Sales and Office occupations in Dollar Bay are Office & Administration (59 | 10.9%), and Sales & Related (56 | 10.3%).
Sales and Office Occupations by Sex
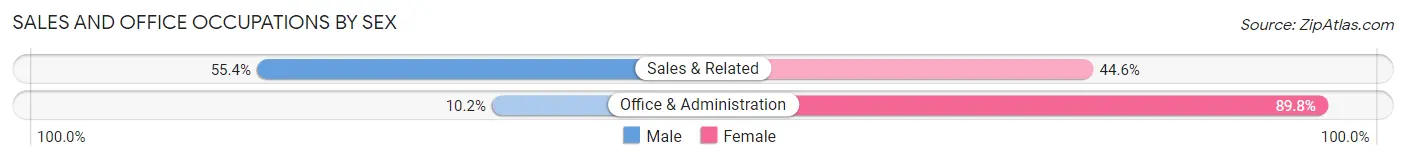
| Occupation | Male | Female |
| Sales & Related | 31 (55.4%) | 25 (44.6%) |
| Office & Administration | 6 (10.2%) | 53 (89.8%) |
| Total (Category) | 37 (32.2%) | 78 (67.8%) |
| Total (Overall) | 319 (58.8%) | 224 (41.2%) |
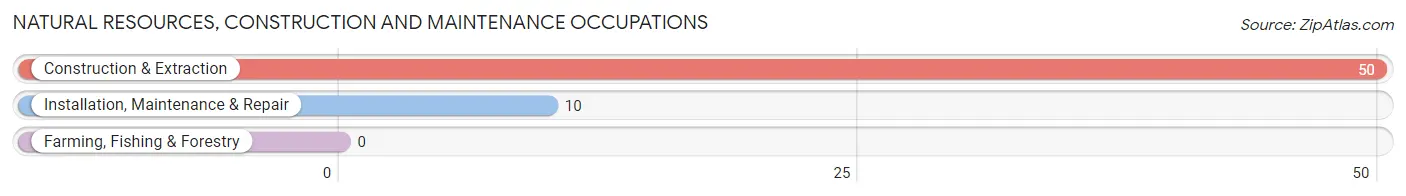
Natural Resources, Construction and Maintenance Occupations
The most common Natural Resources, Construction and Maintenance occupations in Dollar Bay are Construction & Extraction (50 | 9.2%), and Installation, Maintenance & Repair (10 | 1.8%).
Natural Resources, Construction and Maintenance Occupations by Sex
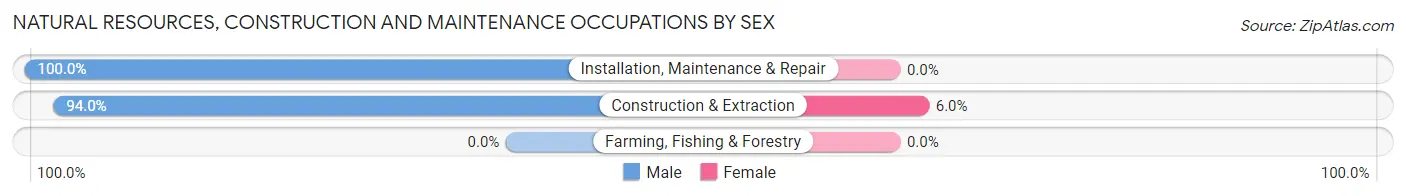
| Occupation | Male | Female |
| Farming, Fishing & Forestry | 0 (0.0%) | 0 (0.0%) |
| Construction & Extraction | 47 (94.0%) | 3 (6.0%) |
| Installation, Maintenance & Repair | 10 (100.0%) | 0 (0.0%) |
| Total (Category) | 57 (95.0%) | 3 (5.0%) |
| Total (Overall) | 319 (58.8%) | 224 (41.2%) |
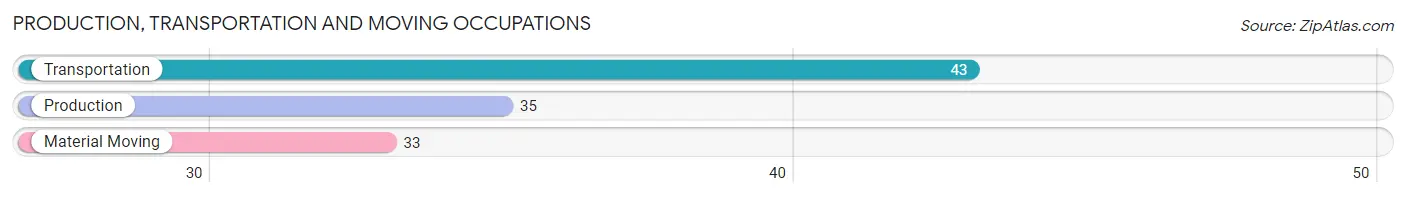
Production, Transportation and Moving Occupations
The most common Production, Transportation and Moving occupations in Dollar Bay are Transportation (43 | 7.9%), Production (35 | 6.5%), and Material Moving (33 | 6.1%).
Production, Transportation and Moving Occupations by Sex
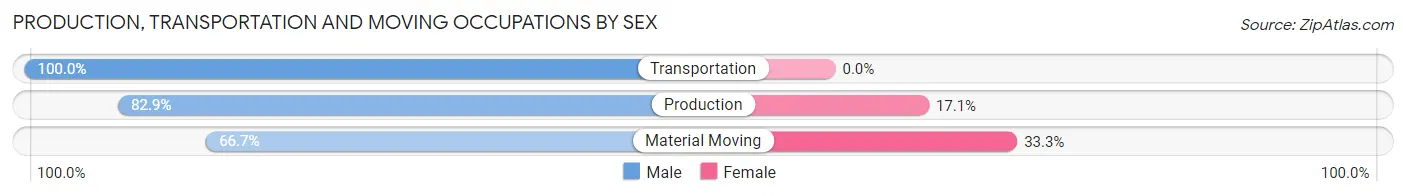
| Occupation | Male | Female |
| Production | 29 (82.9%) | 6 (17.1%) |
| Transportation | 43 (100.0%) | 0 (0.0%) |
| Material Moving | 22 (66.7%) | 11 (33.3%) |
| Total (Category) | 94 (84.7%) | 17 (15.3%) |
| Total (Overall) | 319 (58.8%) | 224 (41.2%) |
Employment Industries by Sex in Dollar Bay
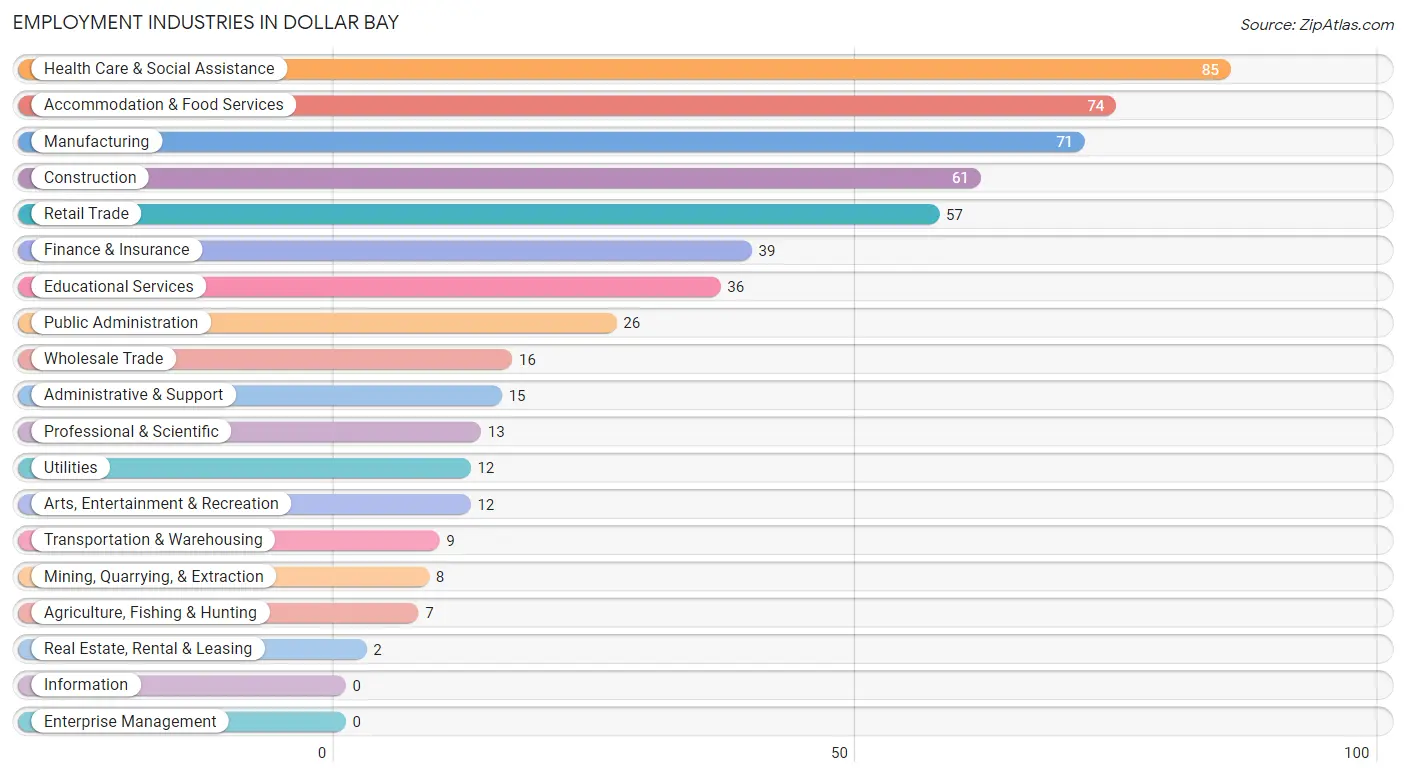
Employment Industries in Dollar Bay
The major employment industries in Dollar Bay include Health Care & Social Assistance (85 | 15.7%), Accommodation & Food Services (74 | 13.6%), Manufacturing (71 | 13.1%), Construction (61 | 11.2%), and Retail Trade (57 | 10.5%).
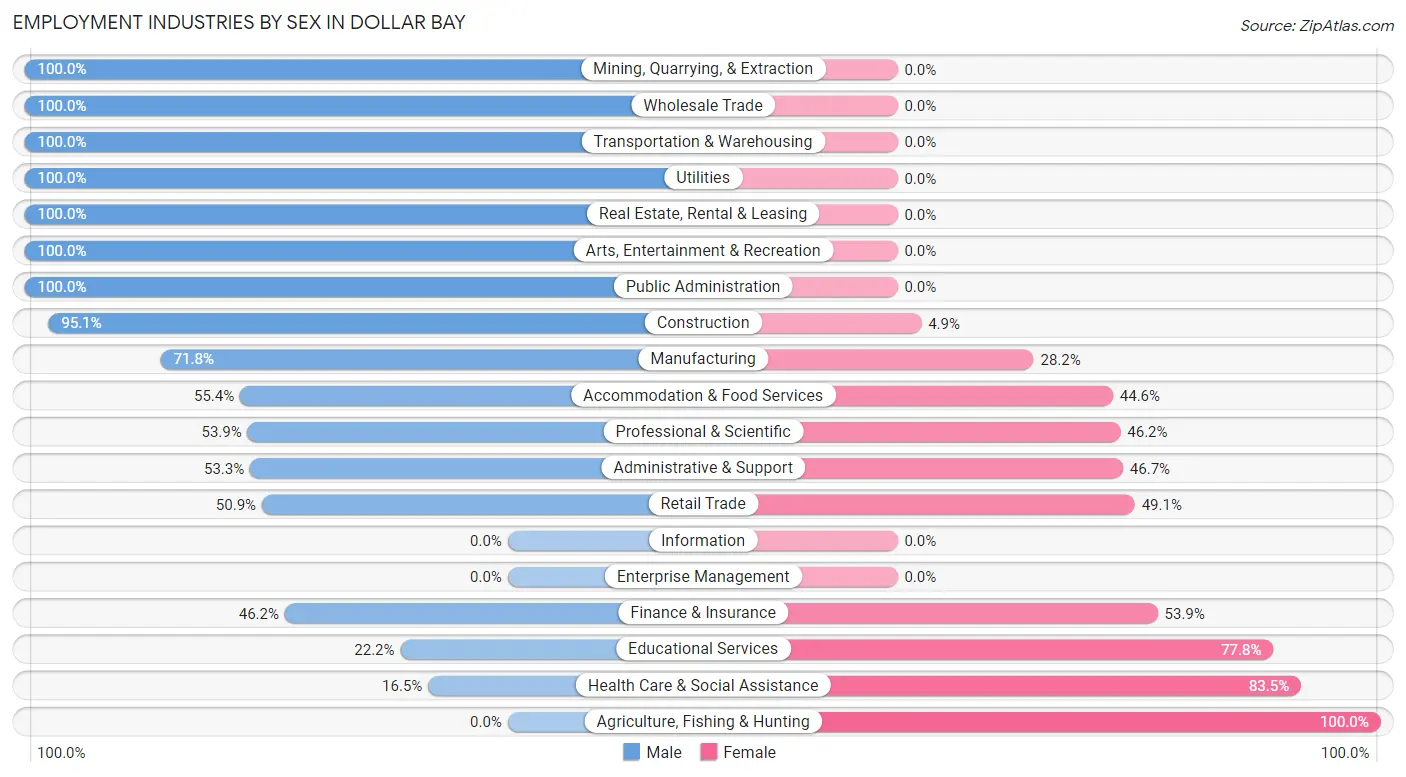
Employment Industries by Sex in Dollar Bay
The Dollar Bay industries that see more men than women are Mining, Quarrying, & Extraction (100.0%), Wholesale Trade (100.0%), and Transportation & Warehousing (100.0%), whereas the industries that tend to have a higher number of women are Agriculture, Fishing & Hunting (100.0%), Health Care & Social Assistance (83.5%), and Educational Services (77.8%).
| Industry | Male | Female |
| Agriculture, Fishing & Hunting | 0 (0.0%) | 7 (100.0%) |
| Mining, Quarrying, & Extraction | 8 (100.0%) | 0 (0.0%) |
| Construction | 58 (95.1%) | 3 (4.9%) |
| Manufacturing | 51 (71.8%) | 20 (28.2%) |
| Wholesale Trade | 16 (100.0%) | 0 (0.0%) |
| Retail Trade | 29 (50.9%) | 28 (49.1%) |
| Transportation & Warehousing | 9 (100.0%) | 0 (0.0%) |
| Utilities | 12 (100.0%) | 0 (0.0%) |
| Information | 0 (0.0%) | 0 (0.0%) |
| Finance & Insurance | 18 (46.2%) | 21 (53.8%) |
| Real Estate, Rental & Leasing | 2 (100.0%) | 0 (0.0%) |
| Professional & Scientific | 7 (53.8%) | 6 (46.2%) |
| Enterprise Management | 0 (0.0%) | 0 (0.0%) |
| Administrative & Support | 8 (53.3%) | 7 (46.7%) |
| Educational Services | 8 (22.2%) | 28 (77.8%) |
| Health Care & Social Assistance | 14 (16.5%) | 71 (83.5%) |
| Arts, Entertainment & Recreation | 12 (100.0%) | 0 (0.0%) |
| Accommodation & Food Services | 41 (55.4%) | 33 (44.6%) |
| Public Administration | 26 (100.0%) | 0 (0.0%) |
| Total | 319 (58.8%) | 224 (41.2%) |
Education in Dollar Bay
School Enrollment in Dollar Bay
The most common levels of schooling among the 392 students in Dollar Bay are middle school (104 | 26.5%), elementary school (98 | 25.0%), and college / undergraduate (96 | 24.5%).
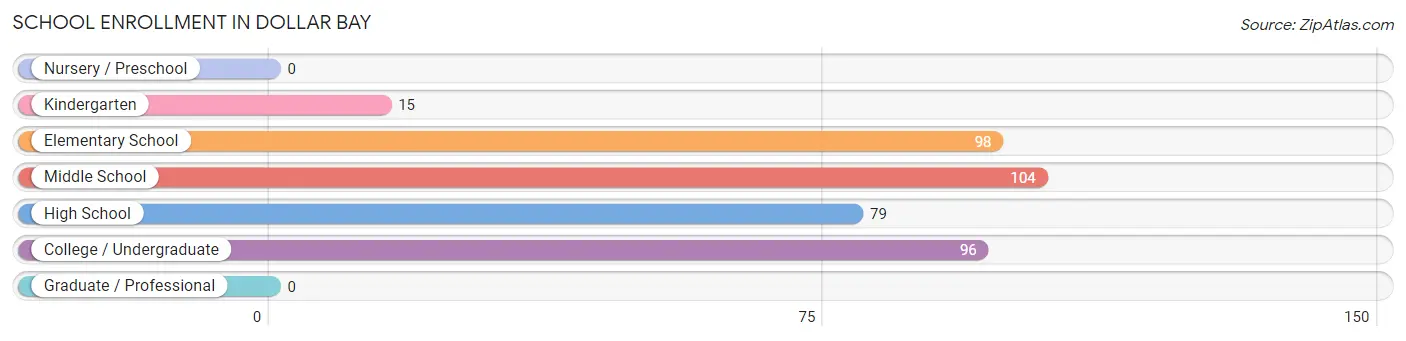
| School Level | # Students | % Students |
| Nursery / Preschool | 0 | 0.0% |
| Kindergarten | 15 | 3.8% |
| Elementary School | 98 | 25.0% |
| Middle School | 104 | 26.5% |
| High School | 79 | 20.2% |
| College / Undergraduate | 96 | 24.5% |
| Graduate / Professional | 0 | 0.0% |
| Total | 392 | 100.0% |
School Enrollment by Age by Funding Source in Dollar Bay
Out of a total of 392 students who are enrolled in schools in Dollar Bay, 36 (9.2%) attend a private institution, while the remaining 356 (90.8%) are enrolled in public schools. The age group of 20 to 24 year olds has the highest likelihood of being enrolled in private schools, with 5 (16.1% in the age bracket) enrolled. Conversely, the age group of 18 to 19 year olds has the lowest likelihood of being enrolled in a private school, with 53 (100.0% in the age bracket) attending a public institution.
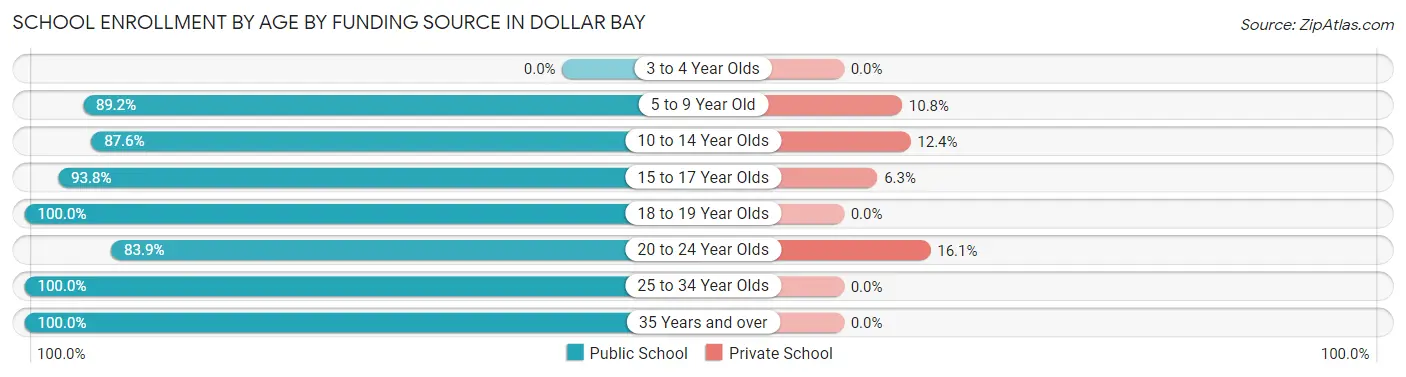
| Age Bracket | Public School | Private School |
| 3 to 4 Year Olds | 0 (0.0%) | 0 (0.0%) |
| 5 to 9 Year Old | 74 (89.2%) | 9 (10.8%) |
| 10 to 14 Year Olds | 141 (87.6%) | 20 (12.4%) |
| 15 to 17 Year Olds | 30 (93.8%) | 2 (6.2%) |
| 18 to 19 Year Olds | 53 (100.0%) | 0 (0.0%) |
| 20 to 24 Year Olds | 26 (83.9%) | 5 (16.1%) |
| 25 to 34 Year Olds | 23 (100.0%) | 0 (0.0%) |
| 35 Years and over | 9 (100.0%) | 0 (0.0%) |
| Total | 356 (90.8%) | 36 (9.2%) |
Educational Attainment by Field of Study in Dollar Bay
Business (47 | 40.2%), science & technology (14 | 12.0%), engineering (11 | 9.4%), liberal arts & history (8 | 6.8%), and bio, nature & agricultural (6 | 5.1%) are the most common fields of study among 117 individuals in Dollar Bay who have obtained a bachelor's degree or higher.
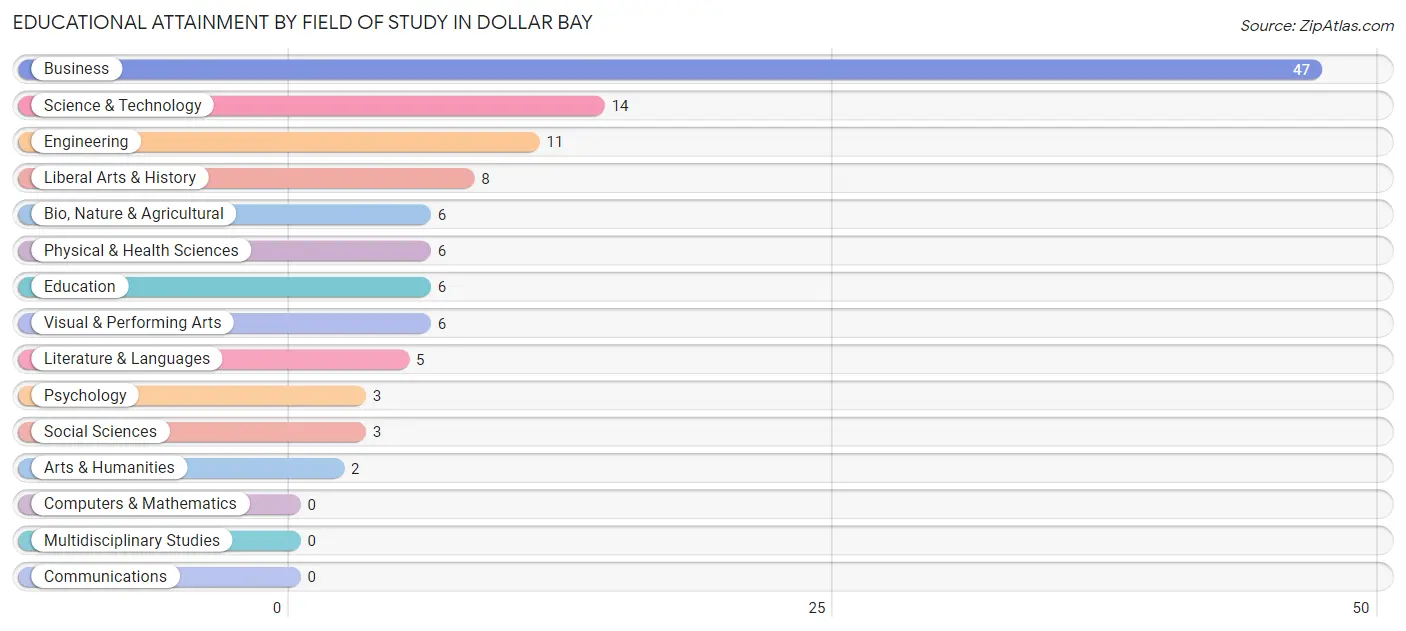
| Field of Study | # Graduates | % Graduates |
| Computers & Mathematics | 0 | 0.0% |
| Bio, Nature & Agricultural | 6 | 5.1% |
| Physical & Health Sciences | 6 | 5.1% |
| Psychology | 3 | 2.6% |
| Social Sciences | 3 | 2.6% |
| Engineering | 11 | 9.4% |
| Multidisciplinary Studies | 0 | 0.0% |
| Science & Technology | 14 | 12.0% |
| Business | 47 | 40.2% |
| Education | 6 | 5.1% |
| Literature & Languages | 5 | 4.3% |
| Liberal Arts & History | 8 | 6.8% |
| Visual & Performing Arts | 6 | 5.1% |
| Communications | 0 | 0.0% |
| Arts & Humanities | 2 | 1.7% |
| Total | 117 | 100.0% |
Transportation & Commute in Dollar Bay
Vehicle Availability by Sex in Dollar Bay
The most prevalent vehicle ownership categories in Dollar Bay are males with 2 vehicles (142, accounting for 44.7%) and females with 2 vehicles (96, making up 66.4%).
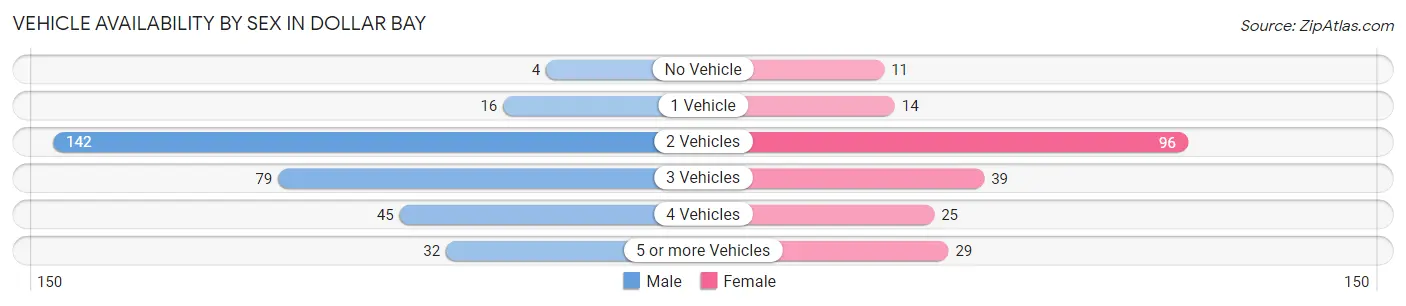
| Vehicles Available | Male | Female |
| No Vehicle | 4 (1.3%) | 11 (5.1%) |
| 1 Vehicle | 16 (5.0%) | 14 (6.5%) |
| 2 Vehicles | 142 (44.7%) | 96 (44.9%) |
| 3 Vehicles | 79 (24.8%) | 39 (18.2%) |
| 4 Vehicles | 45 (14.1%) | 25 (11.7%) |
| 5 or more Vehicles | 32 (10.1%) | 29 (13.6%) |
| Total | 318 (100.0%) | 214 (100.0%) |
Commute Time in Dollar Bay
The most frequently occuring commute durations in Dollar Bay are 15 to 19 minutes (169 commuters, 33.4%), 10 to 14 minutes (118 commuters, 23.3%), and 5 to 9 minutes (102 commuters, 20.2%).
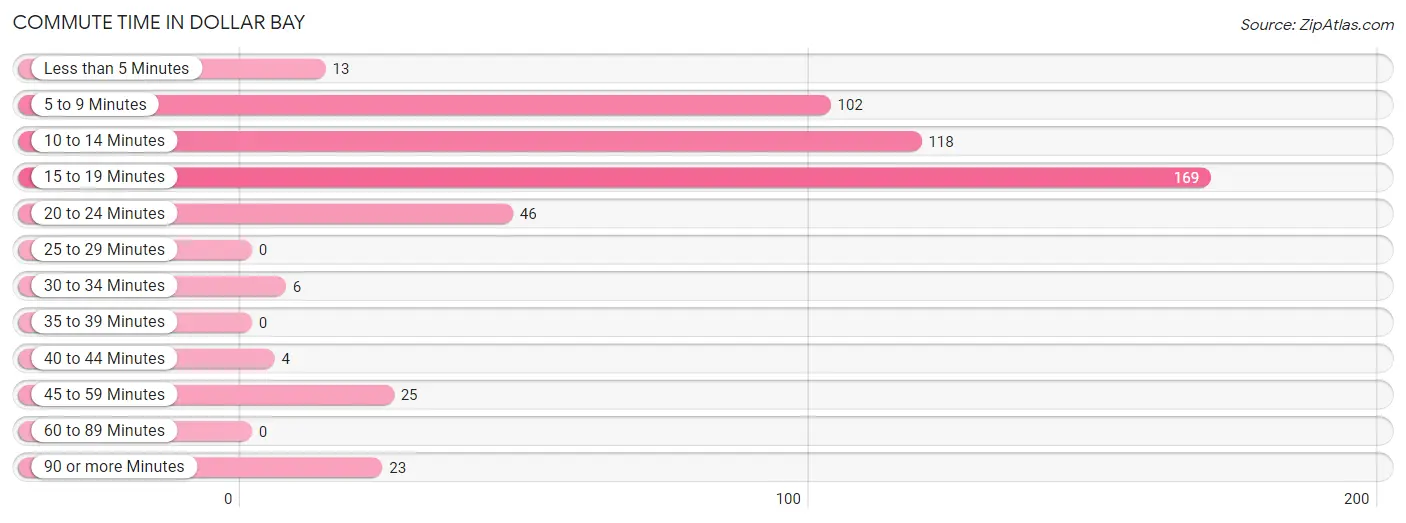
| Commute Time | # Commuters | % Commuters |
| Less than 5 Minutes | 13 | 2.6% |
| 5 to 9 Minutes | 102 | 20.2% |
| 10 to 14 Minutes | 118 | 23.3% |
| 15 to 19 Minutes | 169 | 33.4% |
| 20 to 24 Minutes | 46 | 9.1% |
| 25 to 29 Minutes | 0 | 0.0% |
| 30 to 34 Minutes | 6 | 1.2% |
| 35 to 39 Minutes | 0 | 0.0% |
| 40 to 44 Minutes | 4 | 0.8% |
| 45 to 59 Minutes | 25 | 4.9% |
| 60 to 89 Minutes | 0 | 0.0% |
| 90 or more Minutes | 23 | 4.5% |
Commute Time by Sex in Dollar Bay
The most common commute times in Dollar Bay are 15 to 19 minutes (114 commuters, 38.3%) for males and 10 to 14 minutes (76 commuters, 36.5%) for females.
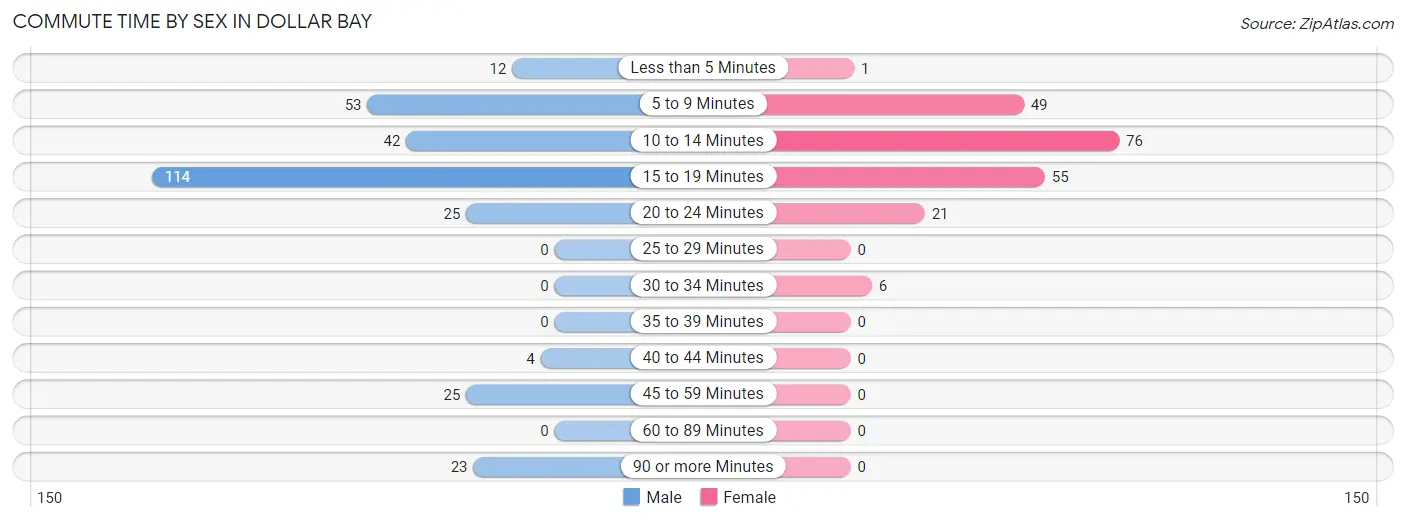
| Commute Time | Male | Female |
| Less than 5 Minutes | 12 (4.0%) | 1 (0.5%) |
| 5 to 9 Minutes | 53 (17.8%) | 49 (23.6%) |
| 10 to 14 Minutes | 42 (14.1%) | 76 (36.5%) |
| 15 to 19 Minutes | 114 (38.3%) | 55 (26.4%) |
| 20 to 24 Minutes | 25 (8.4%) | 21 (10.1%) |
| 25 to 29 Minutes | 0 (0.0%) | 0 (0.0%) |
| 30 to 34 Minutes | 0 (0.0%) | 6 (2.9%) |
| 35 to 39 Minutes | 0 (0.0%) | 0 (0.0%) |
| 40 to 44 Minutes | 4 (1.3%) | 0 (0.0%) |
| 45 to 59 Minutes | 25 (8.4%) | 0 (0.0%) |
| 60 to 89 Minutes | 0 (0.0%) | 0 (0.0%) |
| 90 or more Minutes | 23 (7.7%) | 0 (0.0%) |
Time of Departure to Work by Sex in Dollar Bay
The most frequent times of departure to work in Dollar Bay are 7:30 AM to 7:59 AM (81, 27.2%) for males and 7:30 AM to 7:59 AM (53, 25.5%) for females.
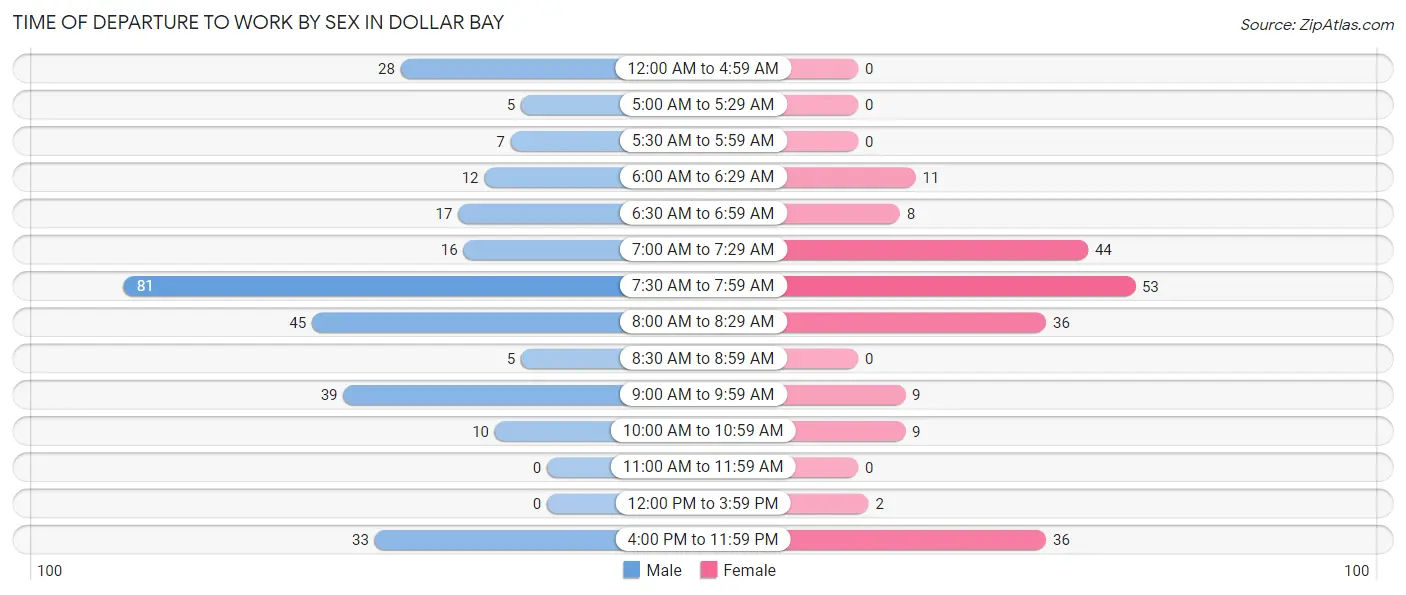
| Time of Departure | Male | Female |
| 12:00 AM to 4:59 AM | 28 (9.4%) | 0 (0.0%) |
| 5:00 AM to 5:29 AM | 5 (1.7%) | 0 (0.0%) |
| 5:30 AM to 5:59 AM | 7 (2.4%) | 0 (0.0%) |
| 6:00 AM to 6:29 AM | 12 (4.0%) | 11 (5.3%) |
| 6:30 AM to 6:59 AM | 17 (5.7%) | 8 (3.8%) |
| 7:00 AM to 7:29 AM | 16 (5.4%) | 44 (21.1%) |
| 7:30 AM to 7:59 AM | 81 (27.2%) | 53 (25.5%) |
| 8:00 AM to 8:29 AM | 45 (15.1%) | 36 (17.3%) |
| 8:30 AM to 8:59 AM | 5 (1.7%) | 0 (0.0%) |
| 9:00 AM to 9:59 AM | 39 (13.1%) | 9 (4.3%) |
| 10:00 AM to 10:59 AM | 10 (3.4%) | 9 (4.3%) |
| 11:00 AM to 11:59 AM | 0 (0.0%) | 0 (0.0%) |
| 12:00 PM to 3:59 PM | 0 (0.0%) | 2 (1.0%) |
| 4:00 PM to 11:59 PM | 33 (11.1%) | 36 (17.3%) |
| Total | 298 (100.0%) | 208 (100.0%) |
Housing Occupancy in Dollar Bay
Occupancy by Ownership in Dollar Bay
Of the total 418 dwellings in Dollar Bay, owner-occupied units account for 356 (85.2%), while renter-occupied units make up 62 (14.8%).
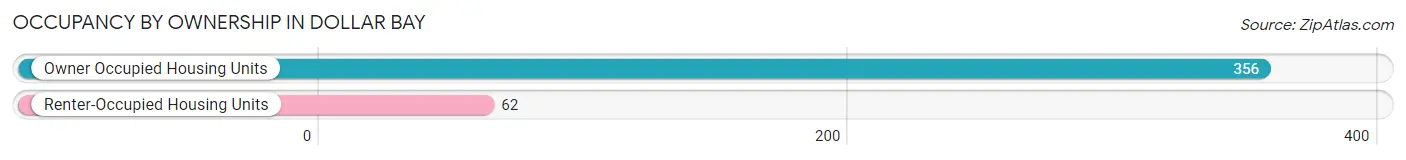
| Occupancy | # Housing Units | % Housing Units |
| Owner Occupied Housing Units | 356 | 85.2% |
| Renter-Occupied Housing Units | 62 | 14.8% |
| Total Occupied Housing Units | 418 | 100.0% |
Occupancy by Household Size in Dollar Bay
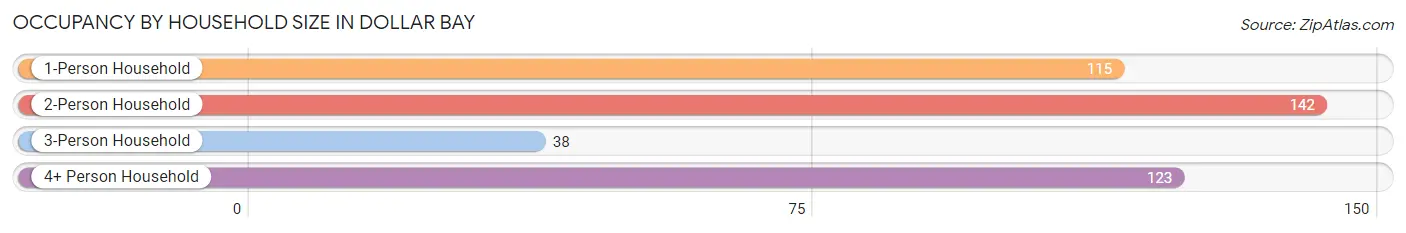
| Household Size | # Housing Units | % Housing Units |
| 1-Person Household | 115 | 27.5% |
| 2-Person Household | 142 | 34.0% |
| 3-Person Household | 38 | 9.1% |
| 4+ Person Household | 123 | 29.4% |
| Total Housing Units | 418 | 100.0% |
Occupancy by Ownership by Household Size in Dollar Bay
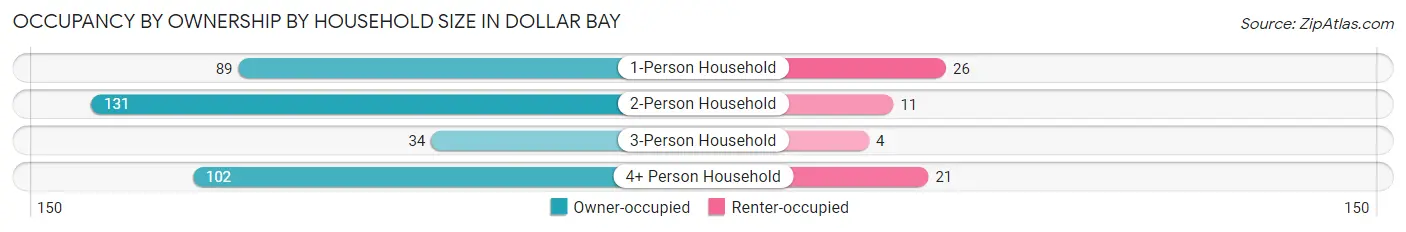
| Household Size | Owner-occupied | Renter-occupied |
| 1-Person Household | 89 (77.4%) | 26 (22.6%) |
| 2-Person Household | 131 (92.2%) | 11 (7.7%) |
| 3-Person Household | 34 (89.5%) | 4 (10.5%) |
| 4+ Person Household | 102 (82.9%) | 21 (17.1%) |
| Total Housing Units | 356 (85.2%) | 62 (14.8%) |
Occupancy by Educational Attainment in Dollar Bay
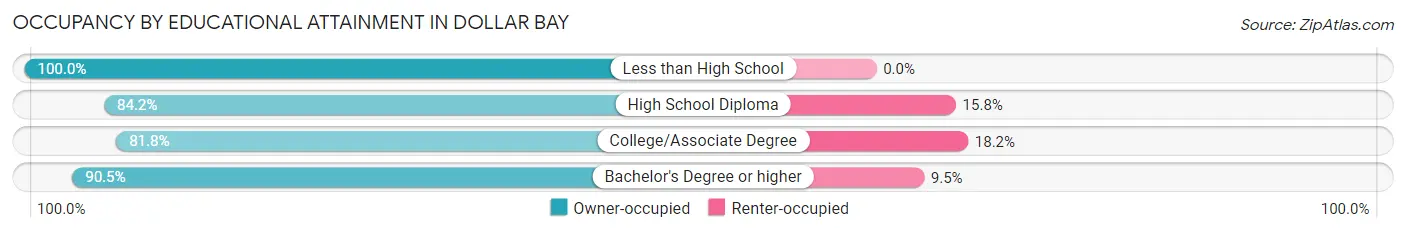
| Household Size | Owner-occupied | Renter-occupied |
| Less than High School | 17 (100.0%) | 0 (0.0%) |
| High School Diploma | 155 (84.2%) | 29 (15.8%) |
| College/Associate Degree | 117 (81.8%) | 26 (18.2%) |
| Bachelor's Degree or higher | 67 (90.5%) | 7 (9.5%) |
Occupancy by Age of Householder in Dollar Bay
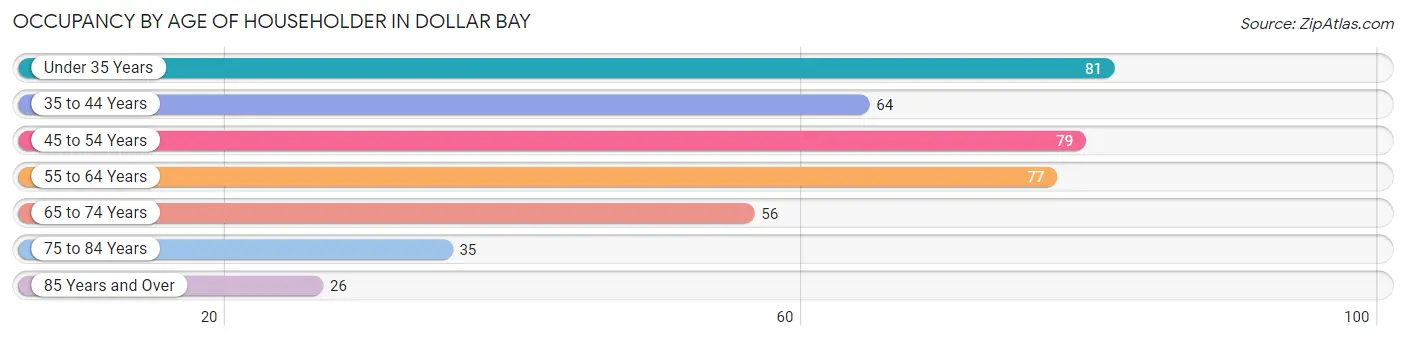
| Age Bracket | # Households | % Households |
| Under 35 Years | 81 | 19.4% |
| 35 to 44 Years | 64 | 15.3% |
| 45 to 54 Years | 79 | 18.9% |
| 55 to 64 Years | 77 | 18.4% |
| 65 to 74 Years | 56 | 13.4% |
| 75 to 84 Years | 35 | 8.4% |
| 85 Years and Over | 26 | 6.2% |
| Total | 418 | 100.0% |
Housing Finances in Dollar Bay
Median Income by Occupancy in Dollar Bay
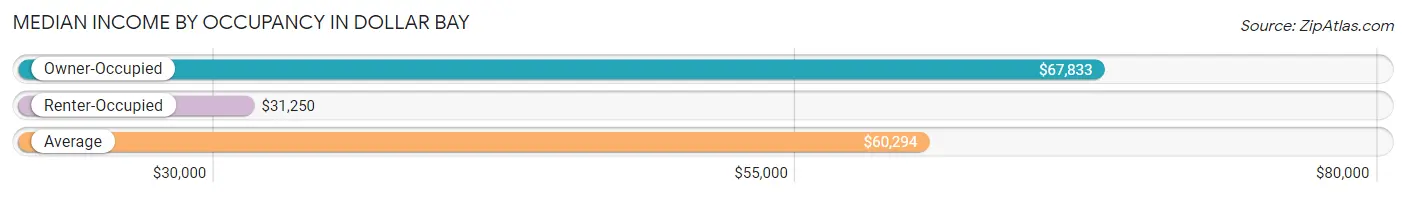
| Occupancy Type | # Households | Median Income |
| Owner-Occupied | 356 (85.2%) | $67,833 |
| Renter-Occupied | 62 (14.8%) | $31,250 |
| Average | 418 (100.0%) | $60,294 |
Occupancy by Householder Income Bracket in Dollar Bay
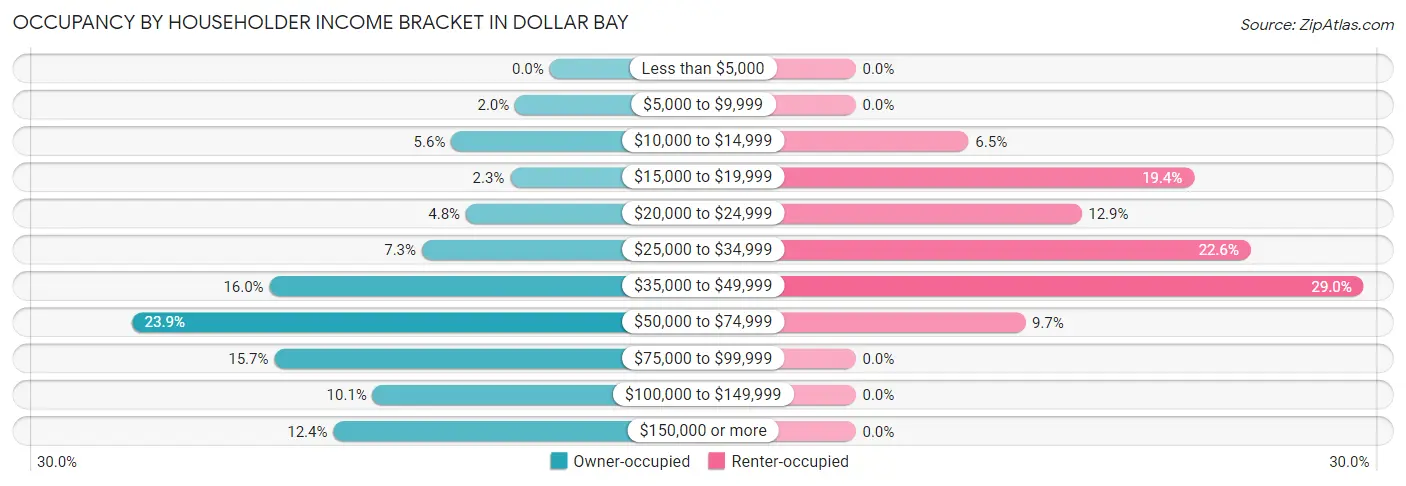
| Income Bracket | Owner-occupied | Renter-occupied |
| Less than $5,000 | 0 (0.0%) | 0 (0.0%) |
| $5,000 to $9,999 | 7 (2.0%) | 0 (0.0%) |
| $10,000 to $14,999 | 20 (5.6%) | 4 (6.5%) |
| $15,000 to $19,999 | 8 (2.2%) | 12 (19.4%) |
| $20,000 to $24,999 | 17 (4.8%) | 8 (12.9%) |
| $25,000 to $34,999 | 26 (7.3%) | 14 (22.6%) |
| $35,000 to $49,999 | 57 (16.0%) | 18 (29.0%) |
| $50,000 to $74,999 | 85 (23.9%) | 6 (9.7%) |
| $75,000 to $99,999 | 56 (15.7%) | 0 (0.0%) |
| $100,000 to $149,999 | 36 (10.1%) | 0 (0.0%) |
| $150,000 or more | 44 (12.4%) | 0 (0.0%) |
| Total | 356 (100.0%) | 62 (100.0%) |
Monthly Housing Cost Tiers in Dollar Bay
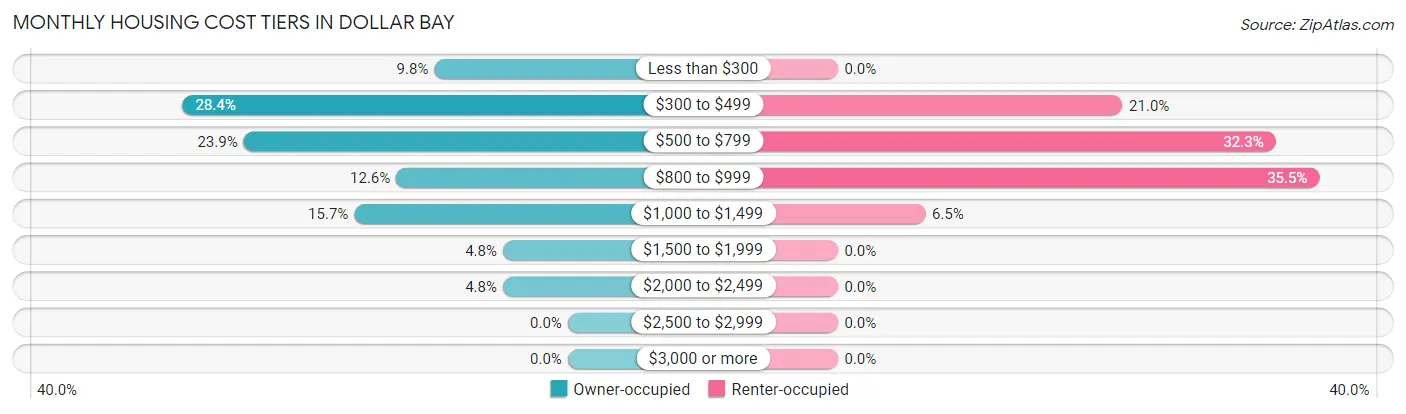
| Monthly Cost | Owner-occupied | Renter-occupied |
| Less than $300 | 35 (9.8%) | 0 (0.0%) |
| $300 to $499 | 101 (28.4%) | 13 (21.0%) |
| $500 to $799 | 85 (23.9%) | 20 (32.3%) |
| $800 to $999 | 45 (12.6%) | 22 (35.5%) |
| $1,000 to $1,499 | 56 (15.7%) | 4 (6.5%) |
| $1,500 to $1,999 | 17 (4.8%) | 0 (0.0%) |
| $2,000 to $2,499 | 17 (4.8%) | 0 (0.0%) |
| $2,500 to $2,999 | 0 (0.0%) | 0 (0.0%) |
| $3,000 or more | 0 (0.0%) | 0 (0.0%) |
| Total | 356 (100.0%) | 62 (100.0%) |
Physical Housing Characteristics in Dollar Bay
Housing Structures in Dollar Bay
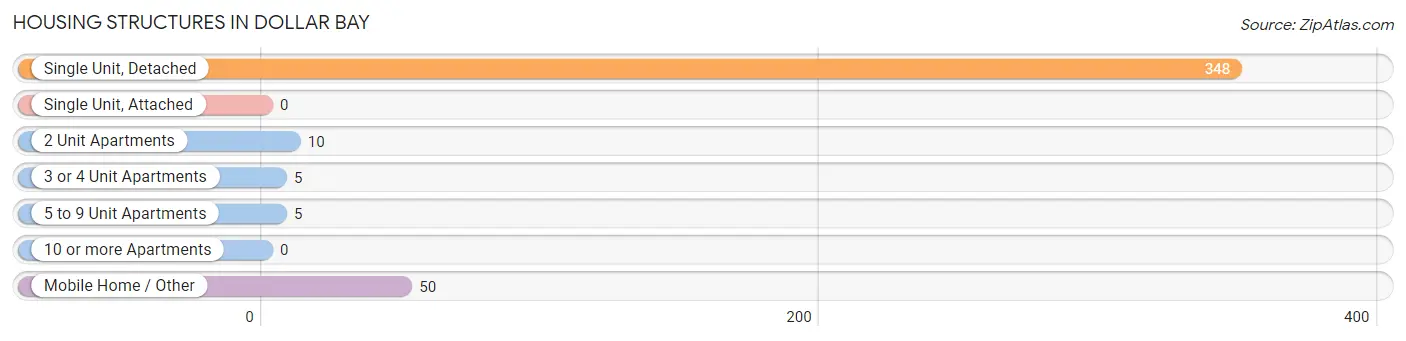
| Structure Type | # Housing Units | % Housing Units |
| Single Unit, Detached | 348 | 83.3% |
| Single Unit, Attached | 0 | 0.0% |
| 2 Unit Apartments | 10 | 2.4% |
| 3 or 4 Unit Apartments | 5 | 1.2% |
| 5 to 9 Unit Apartments | 5 | 1.2% |
| 10 or more Apartments | 0 | 0.0% |
| Mobile Home / Other | 50 | 12.0% |
| Total | 418 | 100.0% |
Housing Structures by Occupancy in Dollar Bay
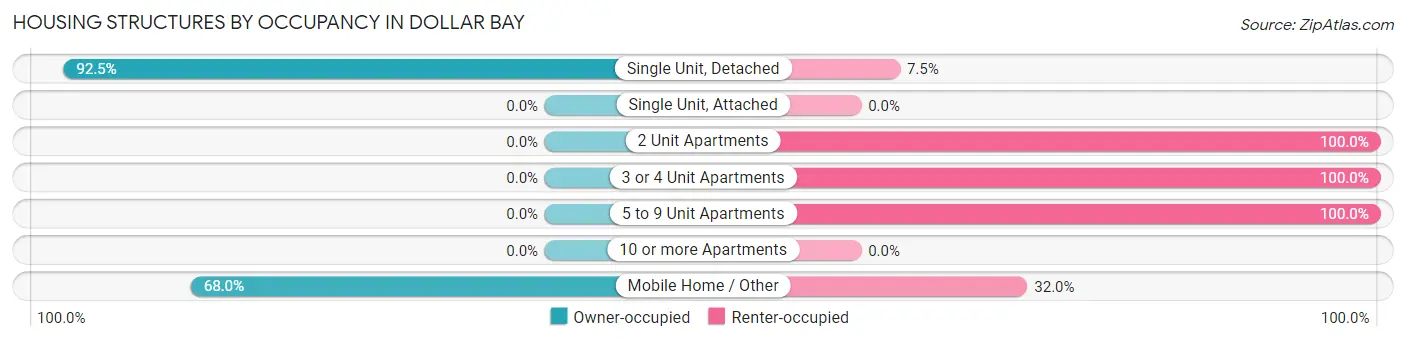
| Structure Type | Owner-occupied | Renter-occupied |
| Single Unit, Detached | 322 (92.5%) | 26 (7.5%) |
| Single Unit, Attached | 0 (0.0%) | 0 (0.0%) |
| 2 Unit Apartments | 0 (0.0%) | 10 (100.0%) |
| 3 or 4 Unit Apartments | 0 (0.0%) | 5 (100.0%) |
| 5 to 9 Unit Apartments | 0 (0.0%) | 5 (100.0%) |
| 10 or more Apartments | 0 (0.0%) | 0 (0.0%) |
| Mobile Home / Other | 34 (68.0%) | 16 (32.0%) |
| Total | 356 (85.2%) | 62 (14.8%) |
Housing Structures by Number of Rooms in Dollar Bay
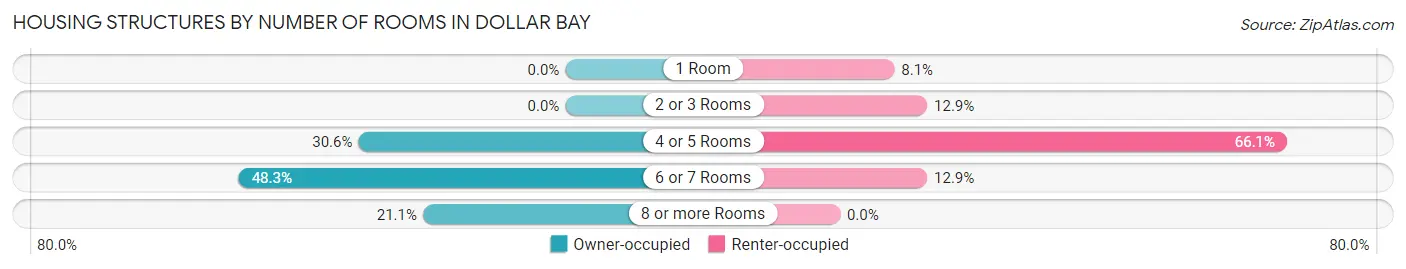
| Number of Rooms | Owner-occupied | Renter-occupied |
| 1 Room | 0 (0.0%) | 5 (8.1%) |
| 2 or 3 Rooms | 0 (0.0%) | 8 (12.9%) |
| 4 or 5 Rooms | 109 (30.6%) | 41 (66.1%) |
| 6 or 7 Rooms | 172 (48.3%) | 8 (12.9%) |
| 8 or more Rooms | 75 (21.1%) | 0 (0.0%) |
| Total | 356 (100.0%) | 62 (100.0%) |
Housing Structure by Heating Type in Dollar Bay
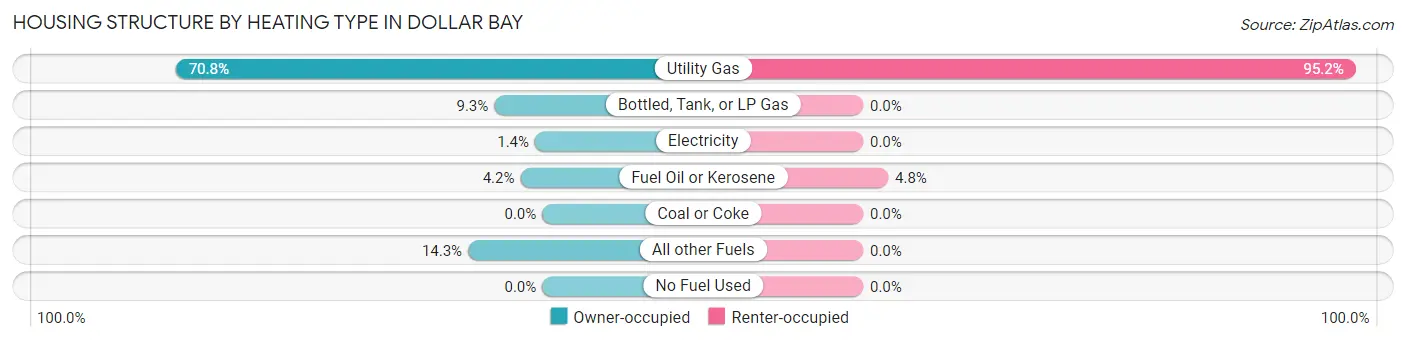
| Heating Type | Owner-occupied | Renter-occupied |
| Utility Gas | 252 (70.8%) | 59 (95.2%) |
| Bottled, Tank, or LP Gas | 33 (9.3%) | 0 (0.0%) |
| Electricity | 5 (1.4%) | 0 (0.0%) |
| Fuel Oil or Kerosene | 15 (4.2%) | 3 (4.8%) |
| Coal or Coke | 0 (0.0%) | 0 (0.0%) |
| All other Fuels | 51 (14.3%) | 0 (0.0%) |
| No Fuel Used | 0 (0.0%) | 0 (0.0%) |
| Total | 356 (100.0%) | 62 (100.0%) |
Household Vehicle Usage in Dollar Bay
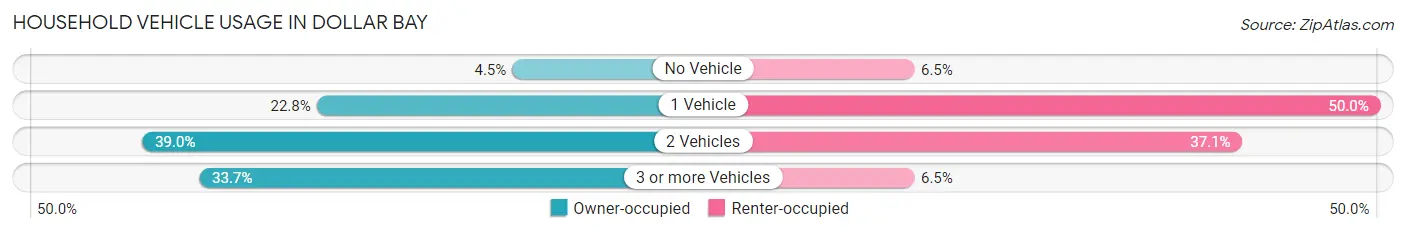
| Vehicles per Household | Owner-occupied | Renter-occupied |
| No Vehicle | 16 (4.5%) | 4 (6.5%) |
| 1 Vehicle | 81 (22.8%) | 31 (50.0%) |
| 2 Vehicles | 139 (39.0%) | 23 (37.1%) |
| 3 or more Vehicles | 120 (33.7%) | 4 (6.5%) |
| Total | 356 (100.0%) | 62 (100.0%) |
Real Estate & Mortgages in Dollar Bay
Real Estate and Mortgage Overview in Dollar Bay
| Characteristic | Without Mortgage | With Mortgage |
| Housing Units | 211 | 145 |
| Median Property Value | $144,900 | $189,800 |
| Median Household Income | $60,809 | $24 |
| Monthly Housing Costs | $410 | $0 |
| Real Estate Taxes | $1,352 | $4 |
Property Value by Mortgage Status in Dollar Bay
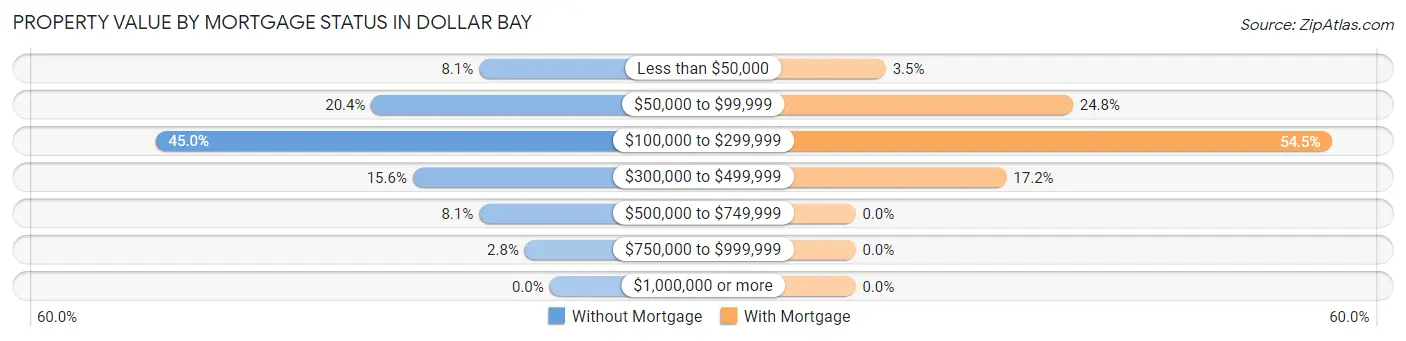
| Property Value | Without Mortgage | With Mortgage |
| Less than $50,000 | 17 (8.1%) | 5 (3.5%) |
| $50,000 to $99,999 | 43 (20.4%) | 36 (24.8%) |
| $100,000 to $299,999 | 95 (45.0%) | 79 (54.5%) |
| $300,000 to $499,999 | 33 (15.6%) | 25 (17.2%) |
| $500,000 to $749,999 | 17 (8.1%) | 0 (0.0%) |
| $750,000 to $999,999 | 6 (2.8%) | 0 (0.0%) |
| $1,000,000 or more | 0 (0.0%) | 0 (0.0%) |
| Total | 211 (100.0%) | 145 (100.0%) |
Household Income by Mortgage Status in Dollar Bay
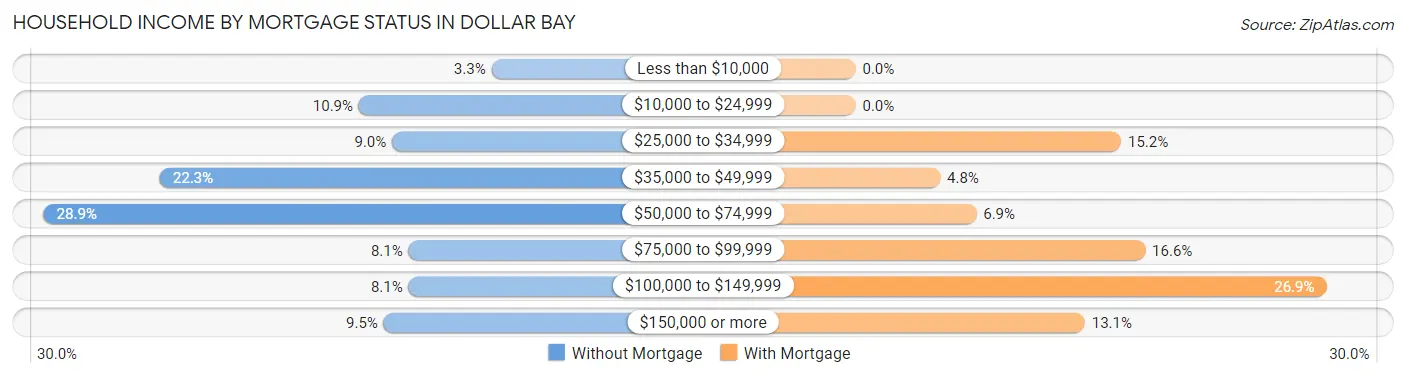
| Household Income | Without Mortgage | With Mortgage |
| Less than $10,000 | 7 (3.3%) | 0 (0.0%) |
| $10,000 to $24,999 | 23 (10.9%) | 0 (0.0%) |
| $25,000 to $34,999 | 19 (9.0%) | 22 (15.2%) |
| $35,000 to $49,999 | 47 (22.3%) | 7 (4.8%) |
| $50,000 to $74,999 | 61 (28.9%) | 10 (6.9%) |
| $75,000 to $99,999 | 17 (8.1%) | 24 (16.6%) |
| $100,000 to $149,999 | 17 (8.1%) | 39 (26.9%) |
| $150,000 or more | 20 (9.5%) | 19 (13.1%) |
| Total | 211 (100.0%) | 145 (100.0%) |
Property Value to Household Income Ratio in Dollar Bay
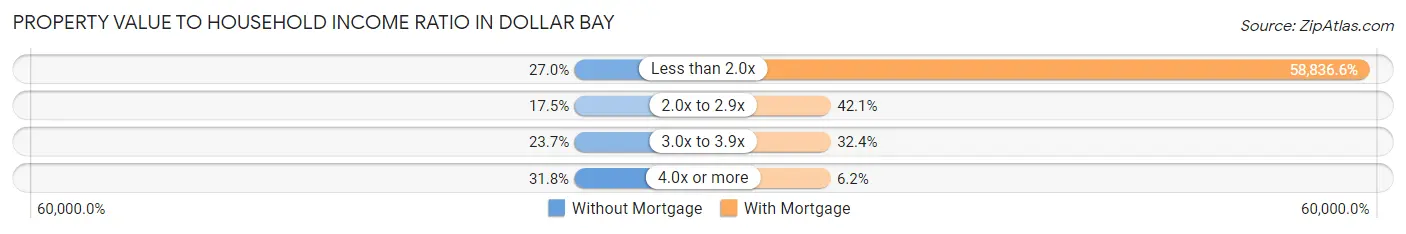
| Value-to-Income Ratio | Without Mortgage | With Mortgage |
| Less than 2.0x | 57 (27.0%) | 85,313 (58,836.5%) |
| 2.0x to 2.9x | 37 (17.5%) | 61 (42.1%) |
| 3.0x to 3.9x | 50 (23.7%) | 47 (32.4%) |
| 4.0x or more | 67 (31.8%) | 9 (6.2%) |
| Total | 211 (100.0%) | 145 (100.0%) |
Real Estate Taxes by Mortgage Status in Dollar Bay
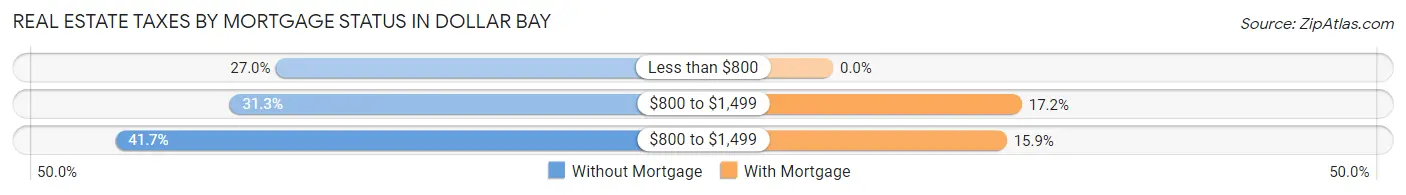
| Property Taxes | Without Mortgage | With Mortgage |
| Less than $800 | 57 (27.0%) | 0 (0.0%) |
| $800 to $1,499 | 66 (31.3%) | 25 (17.2%) |
| $800 to $1,499 | 88 (41.7%) | 23 (15.9%) |
| Total | 211 (100.0%) | 145 (100.0%) |
Health & Disability in Dollar Bay
Health Insurance Coverage by Age in Dollar Bay
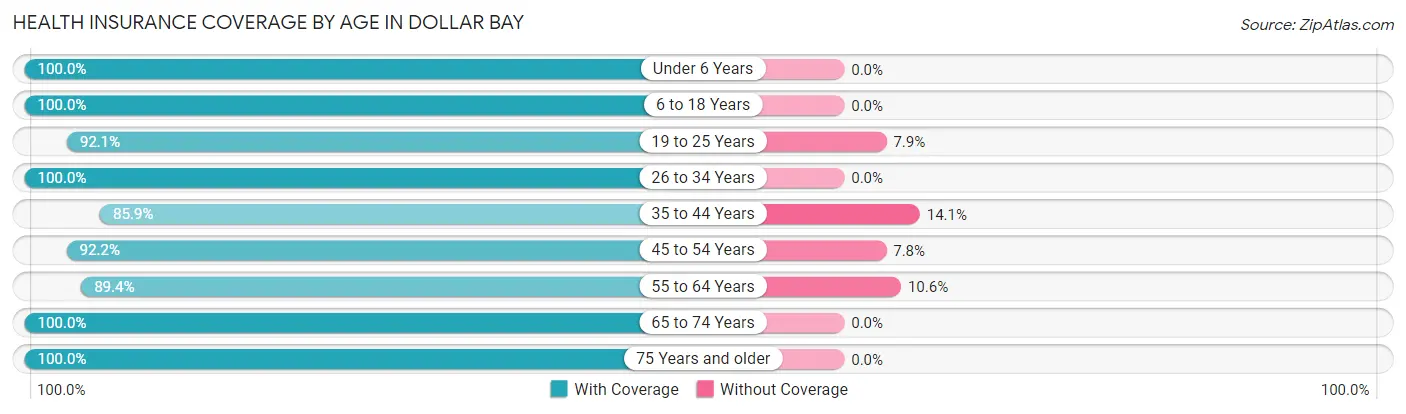
| Age Bracket | With Coverage | Without Coverage |
| Under 6 Years | 87 (100.0%) | 0 (0.0%) |
| 6 to 18 Years | 305 (100.0%) | 0 (0.0%) |
| 19 to 25 Years | 117 (92.1%) | 10 (7.9%) |
| 26 to 34 Years | 120 (100.0%) | 0 (0.0%) |
| 35 to 44 Years | 122 (85.9%) | 20 (14.1%) |
| 45 to 54 Years | 106 (92.2%) | 9 (7.8%) |
| 55 to 64 Years | 110 (89.4%) | 13 (10.6%) |
| 65 to 74 Years | 82 (100.0%) | 0 (0.0%) |
| 75 Years and older | 78 (100.0%) | 0 (0.0%) |
| Total | 1,127 (95.6%) | 52 (4.4%) |
Health Insurance Coverage by Citizenship Status in Dollar Bay
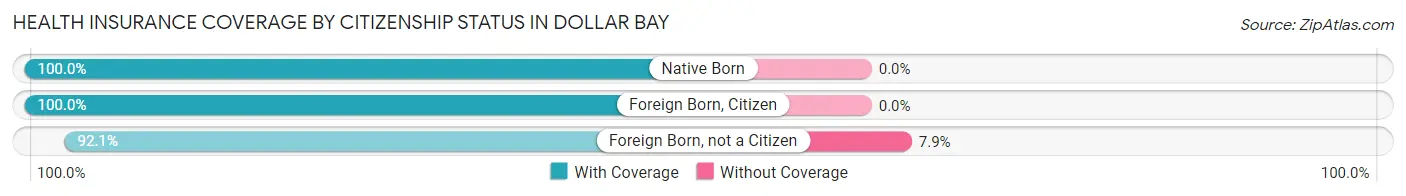
| Citizenship Status | With Coverage | Without Coverage |
| Native Born | 87 (100.0%) | 0 (0.0%) |
| Foreign Born, Citizen | 305 (100.0%) | 0 (0.0%) |
| Foreign Born, not a Citizen | 117 (92.1%) | 10 (7.9%) |
Health Insurance Coverage by Household Income in Dollar Bay
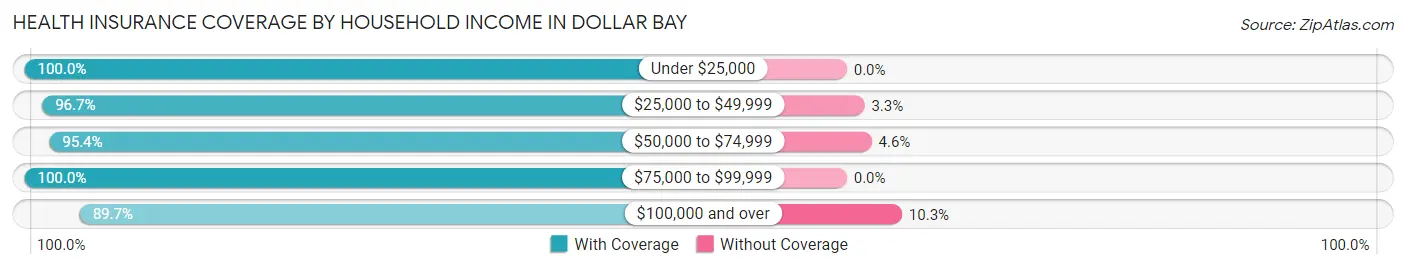
| Household Income | With Coverage | Without Coverage |
| Under $25,000 | 115 (100.0%) | 0 (0.0%) |
| $25,000 to $49,999 | 234 (96.7%) | 8 (3.3%) |
| $50,000 to $74,999 | 329 (95.4%) | 16 (4.6%) |
| $75,000 to $99,999 | 206 (100.0%) | 0 (0.0%) |
| $100,000 and over | 243 (89.7%) | 28 (10.3%) |
Public vs Private Health Insurance Coverage by Age in Dollar Bay
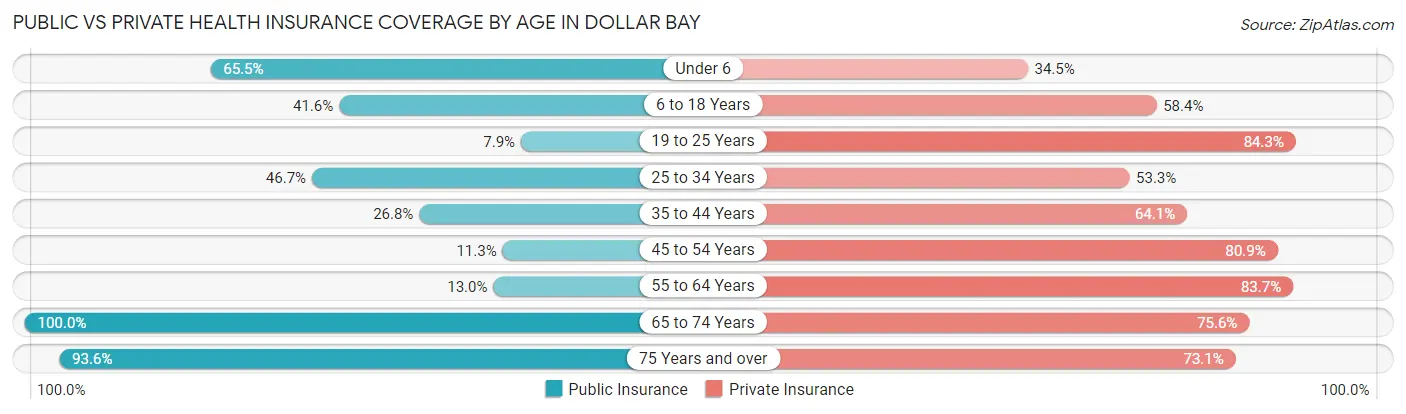
| Age Bracket | Public Insurance | Private Insurance |
| Under 6 | 57 (65.5%) | 30 (34.5%) |
| 6 to 18 Years | 127 (41.6%) | 178 (58.4%) |
| 19 to 25 Years | 10 (7.9%) | 107 (84.3%) |
| 25 to 34 Years | 56 (46.7%) | 64 (53.3%) |
| 35 to 44 Years | 38 (26.8%) | 91 (64.1%) |
| 45 to 54 Years | 13 (11.3%) | 93 (80.9%) |
| 55 to 64 Years | 16 (13.0%) | 103 (83.7%) |
| 65 to 74 Years | 82 (100.0%) | 62 (75.6%) |
| 75 Years and over | 73 (93.6%) | 57 (73.1%) |
| Total | 472 (40.0%) | 785 (66.6%) |
Disability Status by Sex by Age in Dollar Bay
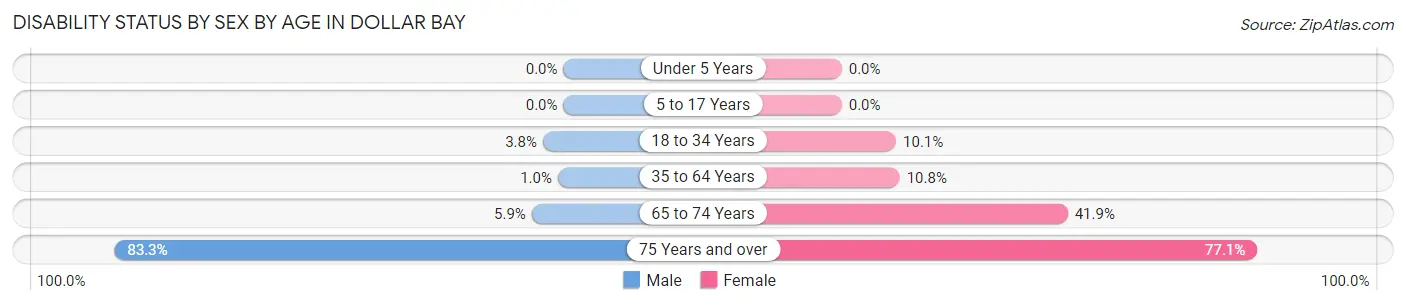
| Age Bracket | Male | Female |
| Under 5 Years | 0 (0.0%) | 0 (0.0%) |
| 5 to 17 Years | 0 (0.0%) | 0 (0.0%) |
| 18 to 34 Years | 6 (3.8%) | 13 (10.1%) |
| 35 to 64 Years | 2 (1.0%) | 20 (10.7%) |
| 65 to 74 Years | 3 (5.9%) | 13 (41.9%) |
| 75 Years and over | 25 (83.3%) | 37 (77.1%) |
Disability Class by Sex by Age in Dollar Bay
Disability Class: Hearing Difficulty
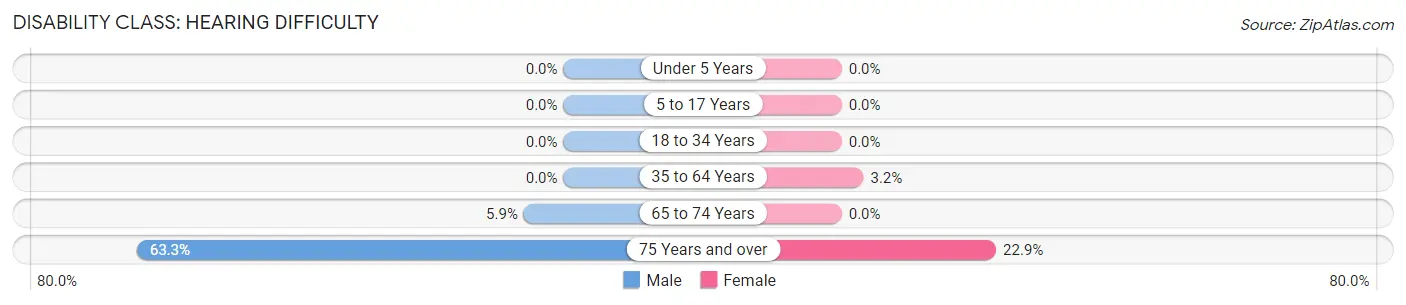
| Age Bracket | Male | Female |
| Under 5 Years | 0 (0.0%) | 0 (0.0%) |
| 5 to 17 Years | 0 (0.0%) | 0 (0.0%) |
| 18 to 34 Years | 0 (0.0%) | 0 (0.0%) |
| 35 to 64 Years | 0 (0.0%) | 6 (3.2%) |
| 65 to 74 Years | 3 (5.9%) | 0 (0.0%) |
| 75 Years and over | 19 (63.3%) | 11 (22.9%) |
Disability Class: Vision Difficulty
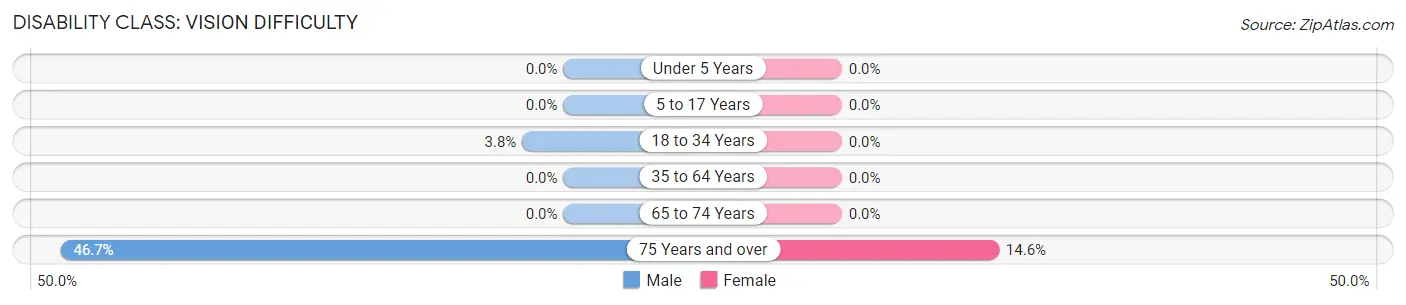
| Age Bracket | Male | Female |
| Under 5 Years | 0 (0.0%) | 0 (0.0%) |
| 5 to 17 Years | 0 (0.0%) | 0 (0.0%) |
| 18 to 34 Years | 6 (3.8%) | 0 (0.0%) |
| 35 to 64 Years | 0 (0.0%) | 0 (0.0%) |
| 65 to 74 Years | 0 (0.0%) | 0 (0.0%) |
| 75 Years and over | 14 (46.7%) | 7 (14.6%) |
Disability Class: Cognitive Difficulty
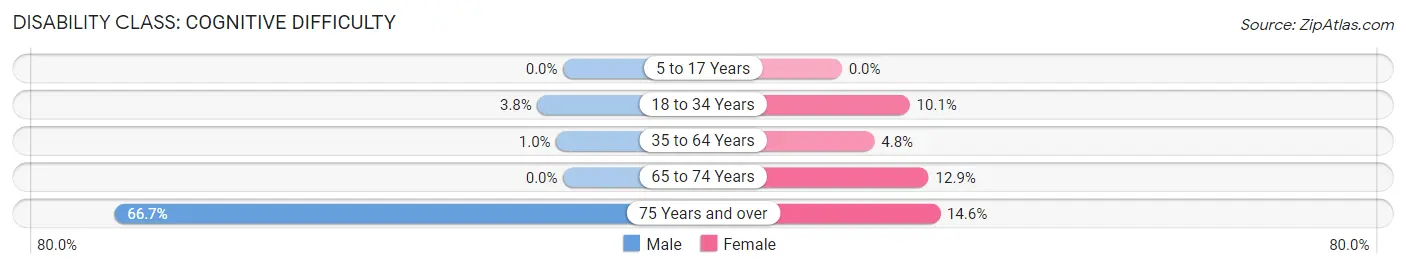
| Age Bracket | Male | Female |
| 5 to 17 Years | 0 (0.0%) | 0 (0.0%) |
| 18 to 34 Years | 6 (3.8%) | 13 (10.1%) |
| 35 to 64 Years | 2 (1.0%) | 9 (4.8%) |
| 65 to 74 Years | 0 (0.0%) | 4 (12.9%) |
| 75 Years and over | 20 (66.7%) | 7 (14.6%) |
Disability Class: Ambulatory Difficulty
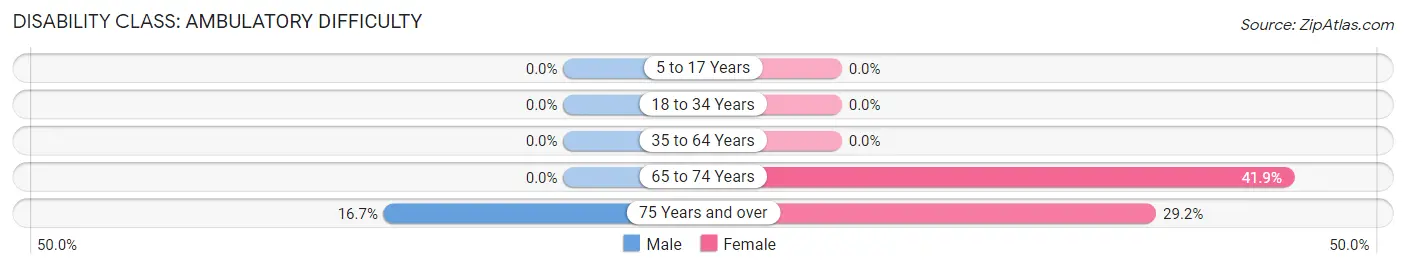
| Age Bracket | Male | Female |
| 5 to 17 Years | 0 (0.0%) | 0 (0.0%) |
| 18 to 34 Years | 0 (0.0%) | 0 (0.0%) |
| 35 to 64 Years | 0 (0.0%) | 0 (0.0%) |
| 65 to 74 Years | 0 (0.0%) | 13 (41.9%) |
| 75 Years and over | 5 (16.7%) | 14 (29.2%) |
Disability Class: Self-Care Difficulty
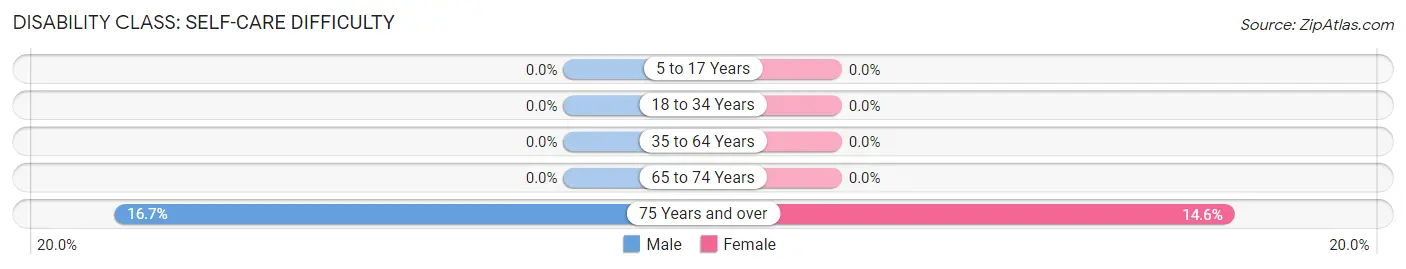
| Age Bracket | Male | Female |
| 5 to 17 Years | 0 (0.0%) | 0 (0.0%) |
| 18 to 34 Years | 0 (0.0%) | 0 (0.0%) |
| 35 to 64 Years | 0 (0.0%) | 0 (0.0%) |
| 65 to 74 Years | 0 (0.0%) | 0 (0.0%) |
| 75 Years and over | 5 (16.7%) | 7 (14.6%) |
Technology Access in Dollar Bay
Computing Device Access in Dollar Bay
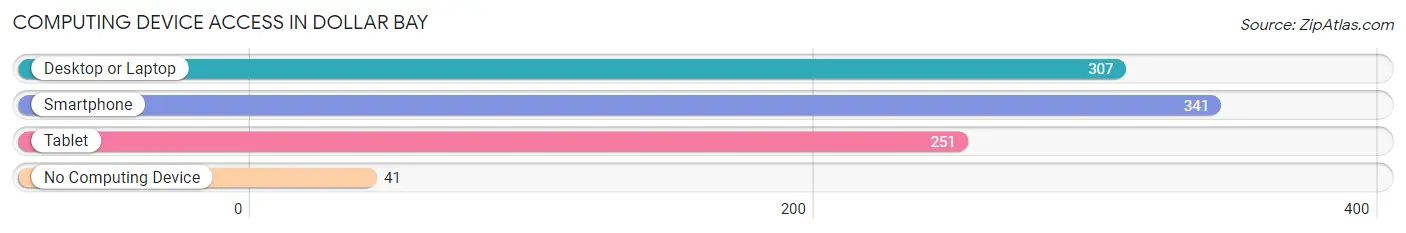
| Device Type | # Households | % Households |
| Desktop or Laptop | 307 | 73.4% |
| Smartphone | 341 | 81.6% |
| Tablet | 251 | 60.1% |
| No Computing Device | 41 | 9.8% |
| Total | 418 | 100.0% |
Internet Access in Dollar Bay
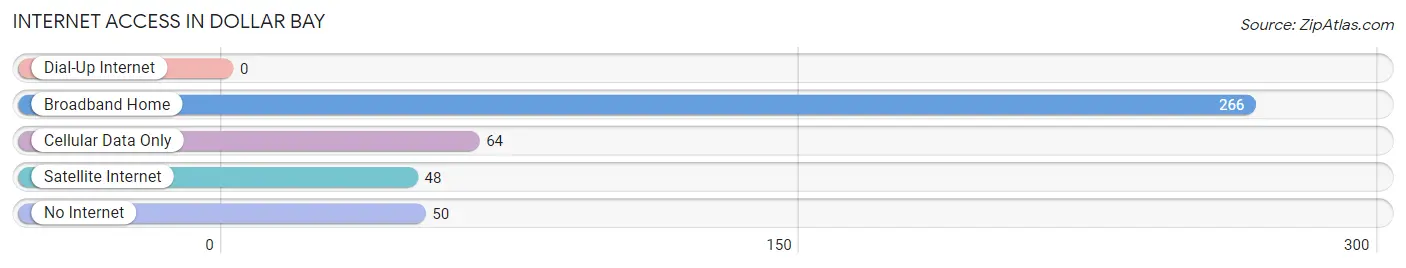
| Internet Type | # Households | % Households |
| Dial-Up Internet | 0 | 0.0% |
| Broadband Home | 266 | 63.6% |
| Cellular Data Only | 64 | 15.3% |
| Satellite Internet | 48 | 11.5% |
| No Internet | 50 | 12.0% |
| Total | 418 | 100.0% |
Dollar Bay Summary
Dollar Bay is a small town located in Houghton County, Michigan. It is situated on the south shore of Portage Lake, which is part of the Keweenaw Waterway. The town is located about 10 miles east of Houghton, the county seat. The population of Dollar Bay was 1,093 at the 2010 census.
History
The area that is now Dollar Bay was first settled in the late 1800s by Finnish immigrants. The town was originally known as “Kuparisaari”, which means “copper island” in Finnish. The name was changed to Dollar Bay in the early 1900s when the local copper mine began producing coins.
The copper mine was the main source of employment for the town until it closed in the 1950s. After the mine closed, the town’s economy shifted to tourism and recreation. The town is now a popular destination for fishing, boating, and camping.
Geography
Dollar Bay is located in the Upper Peninsula of Michigan, on the south shore of Portage Lake. The town is situated on a peninsula that juts out into the lake. The lake is part of the Keweenaw Waterway, which connects Lake Superior to Lake Michigan.
The town is surrounded by forests and lakes, and is home to several parks and nature preserves. The nearby Porcupine Mountains State Park is a popular destination for hiking, camping, and skiing.
Economy
The economy of Dollar Bay is largely based on tourism and recreation. The town is a popular destination for fishing, boating, and camping. There are several marinas and boat launches in the area, as well as several resorts and lodges.
The town is also home to several small businesses, including restaurants, shops, and galleries. The local economy is also supported by the nearby copper mine, which is still in operation.
Demographics
As of the 2010 census, the population of Dollar Bay was 1,093. The racial makeup of the town was 97.2% White, 0.7% Native American, 0.3% Asian, 0.2% from other races, and 1.6% from two or more races.
The median household income in Dollar Bay was $37,500, and the median family income was $45,000. The per capita income was $19,000. About 11.2% of the population was below the poverty line.
Conclusion
Dollar Bay is a small town located in Houghton County, Michigan. It is situated on the south shore of Portage Lake, which is part of the Keweenaw Waterway. The town was originally settled by Finnish immigrants in the late 1800s, and was named after the local copper mine. The economy of Dollar Bay is largely based on tourism and recreation, and the town is a popular destination for fishing, boating, and camping. The population of Dollar Bay was 1,093 at the 2010 census, and the median household income was $37,500.
Common Questions
What is Per Capita Income in Dollar Bay?
Per Capita income in Dollar Bay is $33,277.
What is the Median Family Income in Dollar Bay?
Median Family Income in Dollar Bay is $71,964.
What is the Median Household income in Dollar Bay?
Median Household Income in Dollar Bay is $60,294.
What is Income or Wage Gap in Dollar Bay?
Income or Wage Gap in Dollar Bay is 47.5%.
Women in Dollar Bay earn 52.5 cents for every dollar earned by a man.
What is Inequality or Gini Index in Dollar Bay?
Inequality or Gini Index in Dollar Bay is 0.54.
What is the Total Population of Dollar Bay?
Total Population of Dollar Bay is 1,184.
What is the Total Male Population of Dollar Bay?
Total Male Population of Dollar Bay is 636.
What is the Total Female Population of Dollar Bay?
Total Female Population of Dollar Bay is 548.
What is the Ratio of Males per 100 Females in Dollar Bay?
There are 116.06 Males per 100 Females in Dollar Bay.
What is the Ratio of Females per 100 Males in Dollar Bay?
There are 86.16 Females per 100 Males in Dollar Bay.
What is the Median Population Age in Dollar Bay?
Median Population Age in Dollar Bay is 31.2 Years.
What is the Average Family Size in Dollar Bay
Average Family Size in Dollar Bay is 3.5 People.
What is the Average Household Size in Dollar Bay
Average Household Size in Dollar Bay is 2.8 People.
How Large is the Labor Force in Dollar Bay?
There are 563 People in the Labor Forcein in Dollar Bay.
What is the Percentage of People in the Labor Force in Dollar Bay?
66.2% of People are in the Labor Force in Dollar Bay.
What is the Unemployment Rate in Dollar Bay?
Unemployment Rate in Dollar Bay is 2.7%.