Vassar, MI Map & Demographics
Vassar Map
Vassar Overview
$27,364
PER CAPITA INCOME
$70,625
AVG FAMILY INCOME
$55,833
AVG HOUSEHOLD INCOME
9.7%
WAGE / INCOME GAP [ % ]
90.3¢/ $1
WAGE / INCOME GAP [ $ ]
0.36
INEQUALITY / GINI INDEX
2,718
TOTAL POPULATION
1,517
MALE POPULATION
1,201
FEMALE POPULATION
126.31
MALES / 100 FEMALES
79.17
FEMALES / 100 MALES
37.0
MEDIAN AGE
2.9
AVG FAMILY SIZE
2.3
AVG HOUSEHOLD SIZE
1,345
LABOR FORCE [ PEOPLE ]
60.9%
PERCENT IN LABOR FORCE
12.1%
UNEMPLOYMENT RATE
Vassar Zip Codes
Vassar Area Codes
Income in Vassar
Income Overview in Vassar
Per Capita Income in Vassar is $27,364, while median incomes of families and households are $70,625 and $55,833 respectively.
| Characteristic | Number | Measure |
| Per Capita Income | 2,718 | $27,364 |
| Median Family Income | 643 | $70,625 |
| Mean Family Income | 643 | $78,302 |
| Median Household Income | 1,106 | $55,833 |
| Mean Household Income | 1,106 | $67,325 |
| Income Deficit | 643 | $0 |
| Wage / Income Gap (%) | 2,718 | 9.74% |
| Wage / Income Gap ($) | 2,718 | 90.26¢ per $1 |
| Gini / Inequality Index | 2,718 | 0.36 |
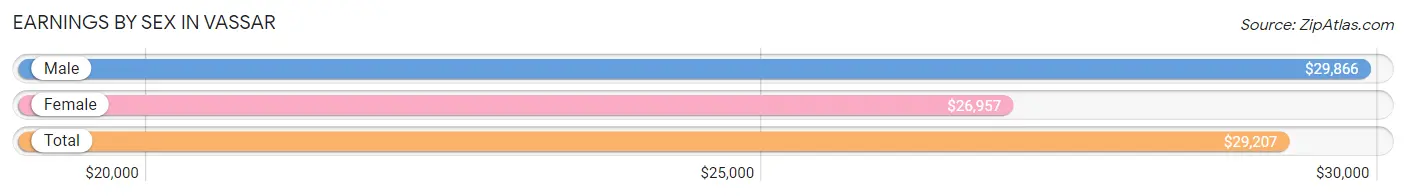
Earnings by Sex in Vassar
Average Earnings in Vassar are $29,207, $29,866 for men and $26,957 for women, a difference of 9.7%.
| Sex | Number | Average Earnings |
| Male | 834 (57.9%) | $29,866 |
| Female | 606 (42.1%) | $26,957 |
| Total | 1,440 (100.0%) | $29,207 |
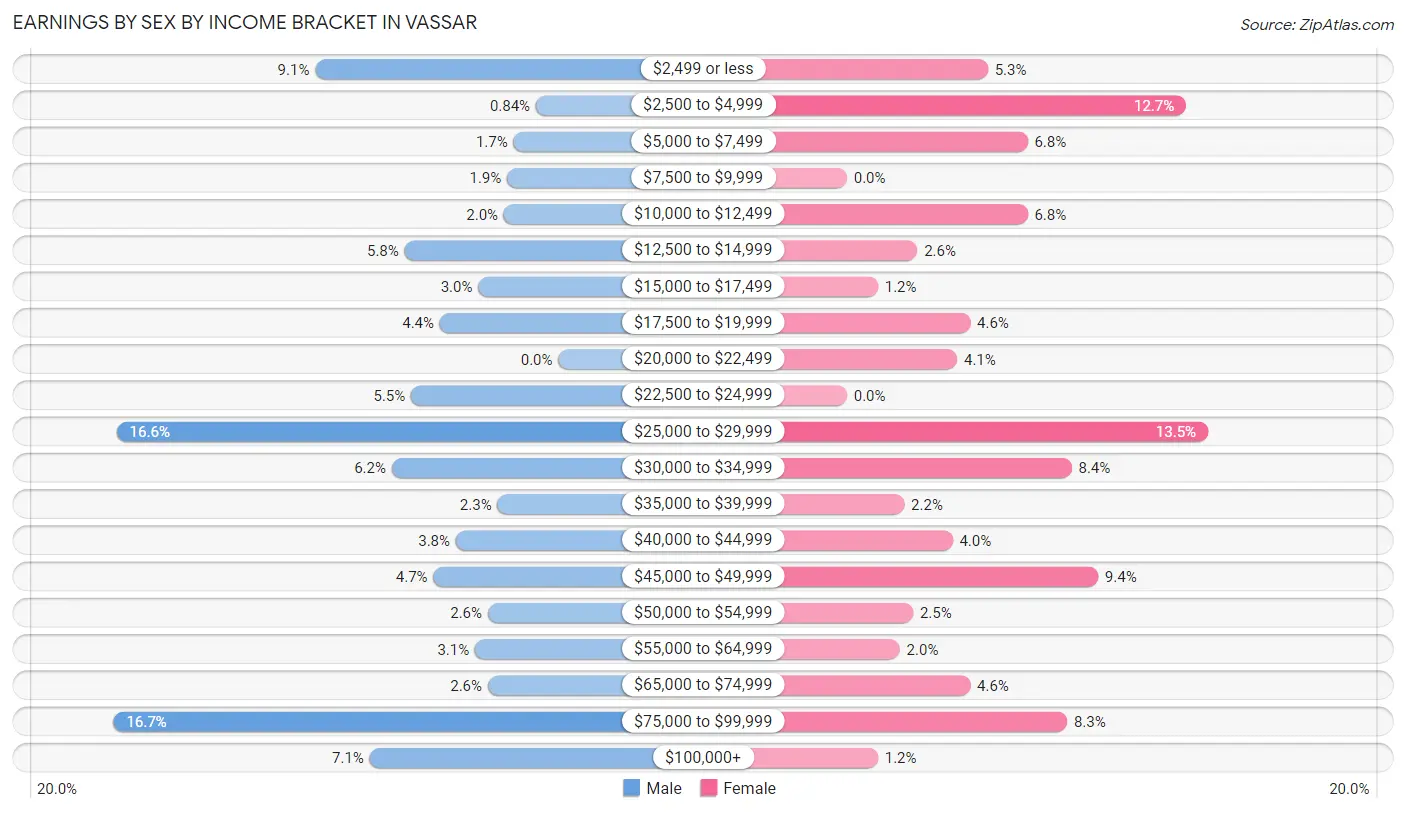
Earnings by Sex by Income Bracket in Vassar
The most common earnings brackets in Vassar are $75,000 to $99,999 for men (139 | 16.7%) and $25,000 to $29,999 for women (82 | 13.5%).
| Income | Male | Female |
| $2,499 or less | 76 (9.1%) | 32 (5.3%) |
| $2,500 to $4,999 | 7 (0.8%) | 77 (12.7%) |
| $5,000 to $7,499 | 14 (1.7%) | 41 (6.8%) |
| $7,500 to $9,999 | 16 (1.9%) | 0 (0.0%) |
| $10,000 to $12,499 | 17 (2.0%) | 41 (6.8%) |
| $12,500 to $14,999 | 48 (5.8%) | 16 (2.6%) |
| $15,000 to $17,499 | 25 (3.0%) | 7 (1.2%) |
| $17,500 to $19,999 | 37 (4.4%) | 28 (4.6%) |
| $20,000 to $22,499 | 0 (0.0%) | 25 (4.1%) |
| $22,500 to $24,999 | 46 (5.5%) | 0 (0.0%) |
| $25,000 to $29,999 | 138 (16.6%) | 82 (13.5%) |
| $30,000 to $34,999 | 52 (6.2%) | 51 (8.4%) |
| $35,000 to $39,999 | 19 (2.3%) | 13 (2.1%) |
| $40,000 to $44,999 | 32 (3.8%) | 24 (4.0%) |
| $45,000 to $49,999 | 39 (4.7%) | 57 (9.4%) |
| $50,000 to $54,999 | 22 (2.6%) | 15 (2.5%) |
| $55,000 to $64,999 | 26 (3.1%) | 12 (2.0%) |
| $65,000 to $74,999 | 22 (2.6%) | 28 (4.6%) |
| $75,000 to $99,999 | 139 (16.7%) | 50 (8.3%) |
| $100,000+ | 59 (7.1%) | 7 (1.2%) |
| Total | 834 (100.0%) | 606 (100.0%) |
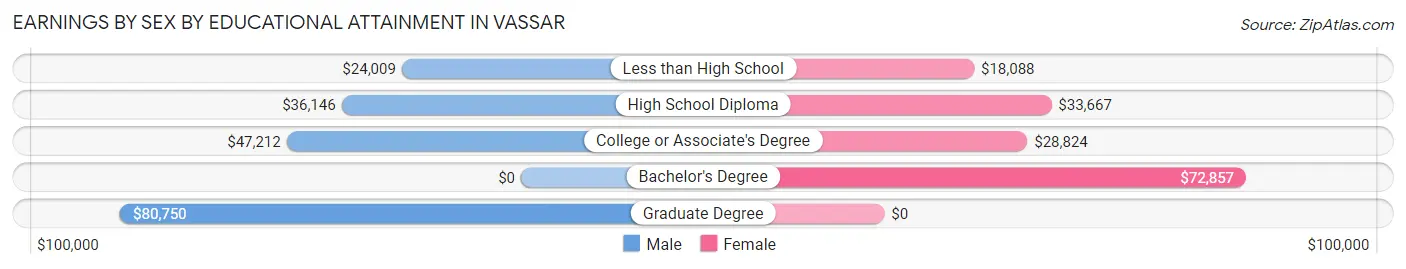
Earnings by Sex by Educational Attainment in Vassar
Average earnings in Vassar are $43,750 for men and $32,132 for women, a difference of 26.6%. Men with an educational attainment of graduate degree enjoy the highest average annual earnings of $80,750, while those with less than high school education earn the least with $24,009. Women with an educational attainment of bachelor's degree earn the most with the average annual earnings of $72,857, while those with less than high school education have the smallest earnings of $18,088.
| Educational Attainment | Male Income | Female Income |
| Less than High School | $24,009 | $18,088 |
| High School Diploma | $36,146 | $33,667 |
| College or Associate's Degree | $47,212 | $28,824 |
| Bachelor's Degree | - | - |
| Graduate Degree | $80,750 | $0 |
| Total | $43,750 | $32,132 |
Family Income in Vassar
Family Income Brackets in Vassar
According to the Vassar family income data, there are 179 families falling into the $100,000 to $149,999 income range, which is the most common income bracket and makes up 27.8% of all families.
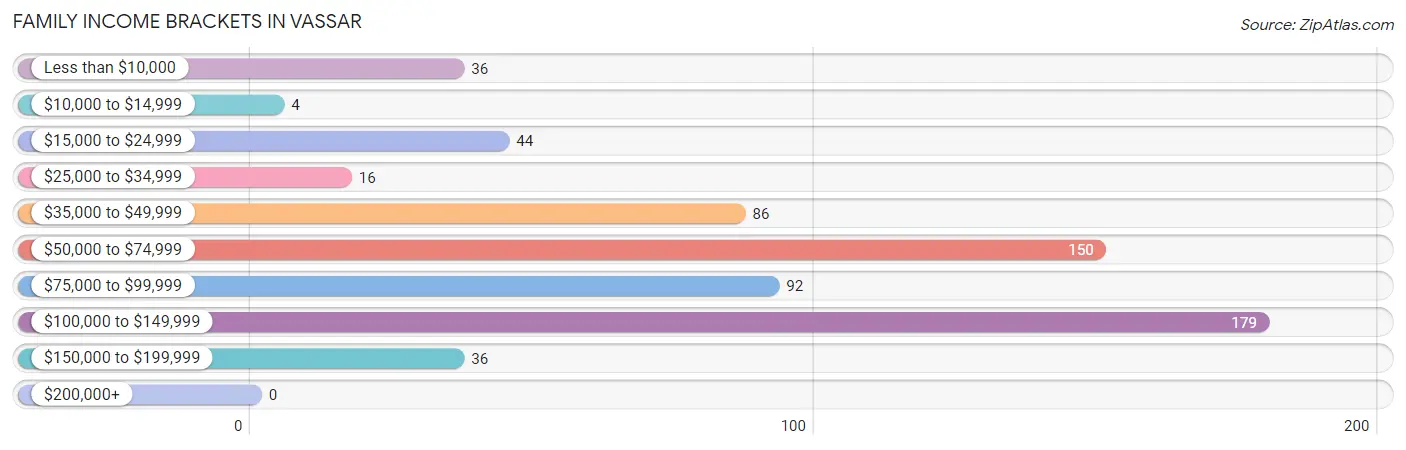
| Income Bracket | # Families | % Families |
| Less than $10,000 | 36 | 5.6% |
| $10,000 to $14,999 | 4 | 0.6% |
| $15,000 to $24,999 | 44 | 6.8% |
| $25,000 to $34,999 | 16 | 2.5% |
| $35,000 to $49,999 | 86 | 13.4% |
| $50,000 to $74,999 | 150 | 23.3% |
| $75,000 to $99,999 | 92 | 14.3% |
| $100,000 to $149,999 | 179 | 27.8% |
| $150,000 to $199,999 | 36 | 5.6% |
| $200,000+ | 0 | 0.0% |
Family Income by Famaliy Size in Vassar
5-person families (20 | 3.1%) account for the highest median family income in Vassar with $108,571 per family, while 3-person families (288 | 44.8%) have the highest median income of $34,444 per family member.
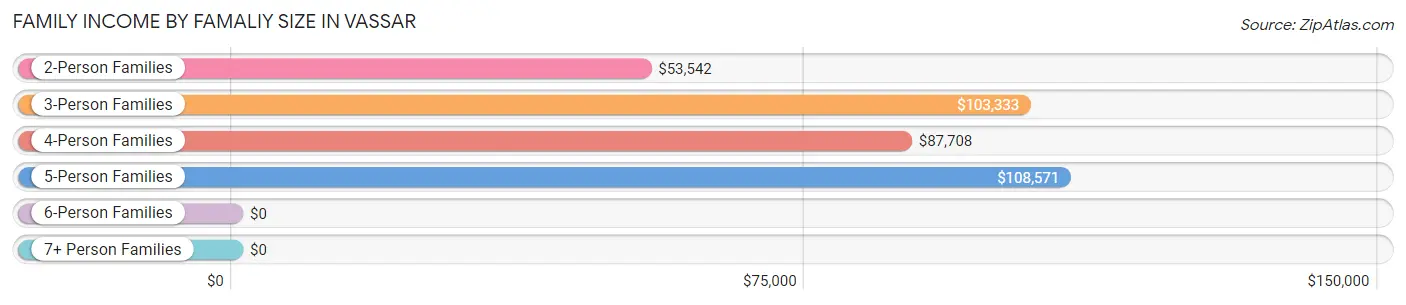
| Income Bracket | # Families | Median Income |
| 2-Person Families | 232 (36.1%) | $53,542 |
| 3-Person Families | 288 (44.8%) | $103,333 |
| 4-Person Families | 57 (8.9%) | $87,708 |
| 5-Person Families | 20 (3.1%) | $108,571 |
| 6-Person Families | 10 (1.6%) | $0 |
| 7+ Person Families | 36 (5.6%) | $0 |
| Total | 643 (100.0%) | $70,625 |
Family Income by Number of Earners in Vassar
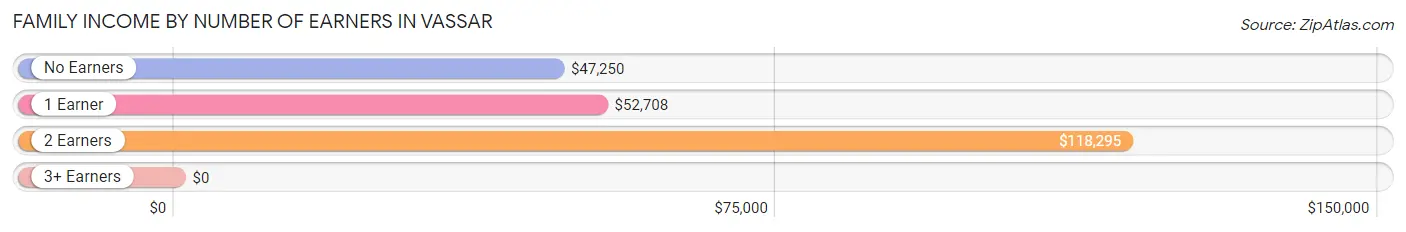
| Number of Earners | # Families | Median Income |
| No Earners | 57 (8.9%) | $47,250 |
| 1 Earner | 244 (38.0%) | $52,708 |
| 2 Earners | 239 (37.2%) | $118,295 |
| 3+ Earners | 103 (16.0%) | $0 |
| Total | 643 (100.0%) | $70,625 |
Household Income in Vassar
Household Income Brackets in Vassar
With 241 households falling in the category, the $50,000 to $74,999 income range is the most frequent in Vassar, accounting for 21.8% of all households.
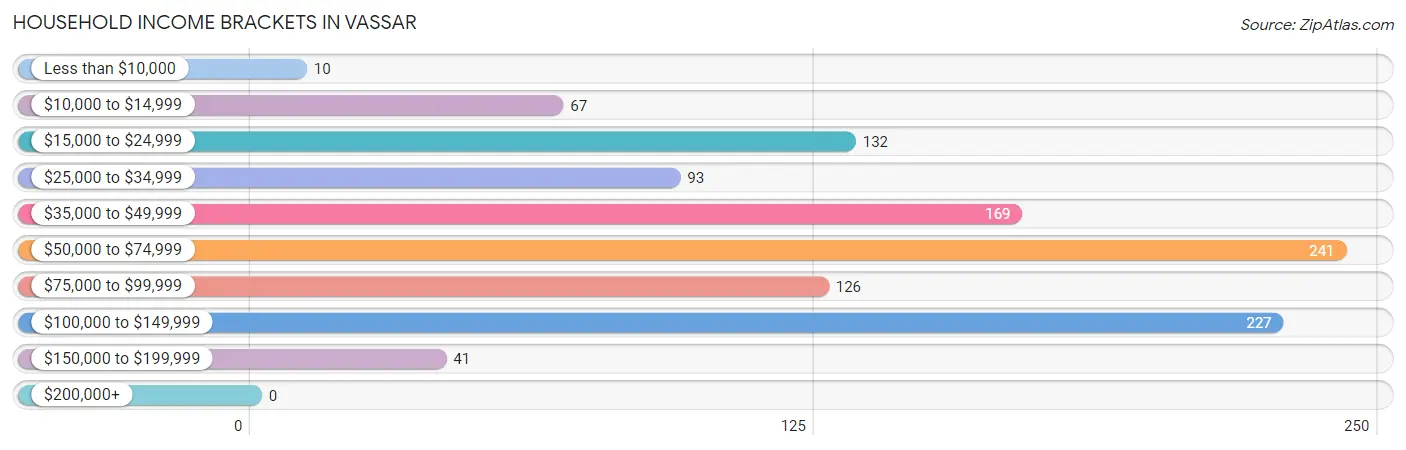
| Income Bracket | # Households | % Households |
| Less than $10,000 | 10 | 0.9% |
| $10,000 to $14,999 | 67 | 6.1% |
| $15,000 to $24,999 | 132 | 11.9% |
| $25,000 to $34,999 | 93 | 8.4% |
| $35,000 to $49,999 | 169 | 15.3% |
| $50,000 to $74,999 | 241 | 21.8% |
| $75,000 to $99,999 | 126 | 11.4% |
| $100,000 to $149,999 | 227 | 20.5% |
| $150,000 to $199,999 | 41 | 3.7% |
| $200,000+ | 0 | 0.0% |
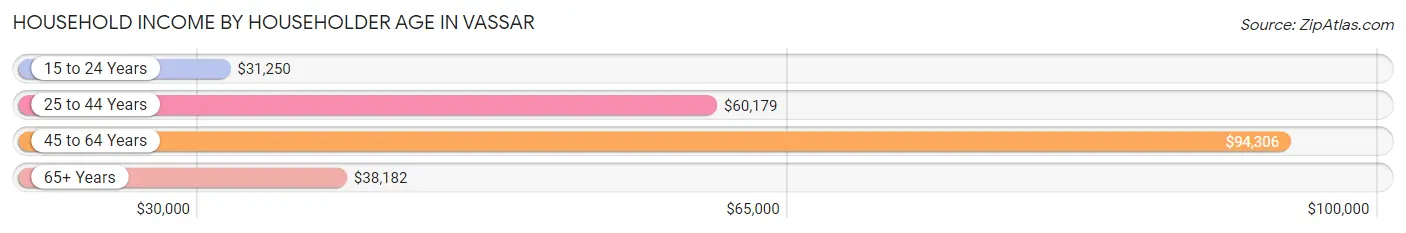
Household Income by Householder Age in Vassar
The median household income in Vassar is $55,833, with the highest median household income of $94,306 found in the 45 to 64 years age bracket for the primary householder. A total of 417 households (37.7%) fall into this category. Meanwhile, the 15 to 24 years age bracket for the primary householder has the lowest median household income of $31,250, with 82 households (7.4%) in this group.
| Income Bracket | # Households | Median Income |
| 15 to 24 Years | 82 (7.4%) | $31,250 |
| 25 to 44 Years | 329 (29.7%) | $60,179 |
| 45 to 64 Years | 417 (37.7%) | $94,306 |
| 65+ Years | 278 (25.1%) | $38,182 |
| Total | 1,106 (100.0%) | $55,833 |
Poverty in Vassar
Income Below Poverty by Sex and Age in Vassar
With 12.9% poverty level for males and 15.0% for females among the residents of Vassar, under 5 year old males and 18 to 24 year old females are the most vulnerable to poverty, with 15 males (34.9%) and 54 females (45.4%) in their respective age groups living below the poverty level.
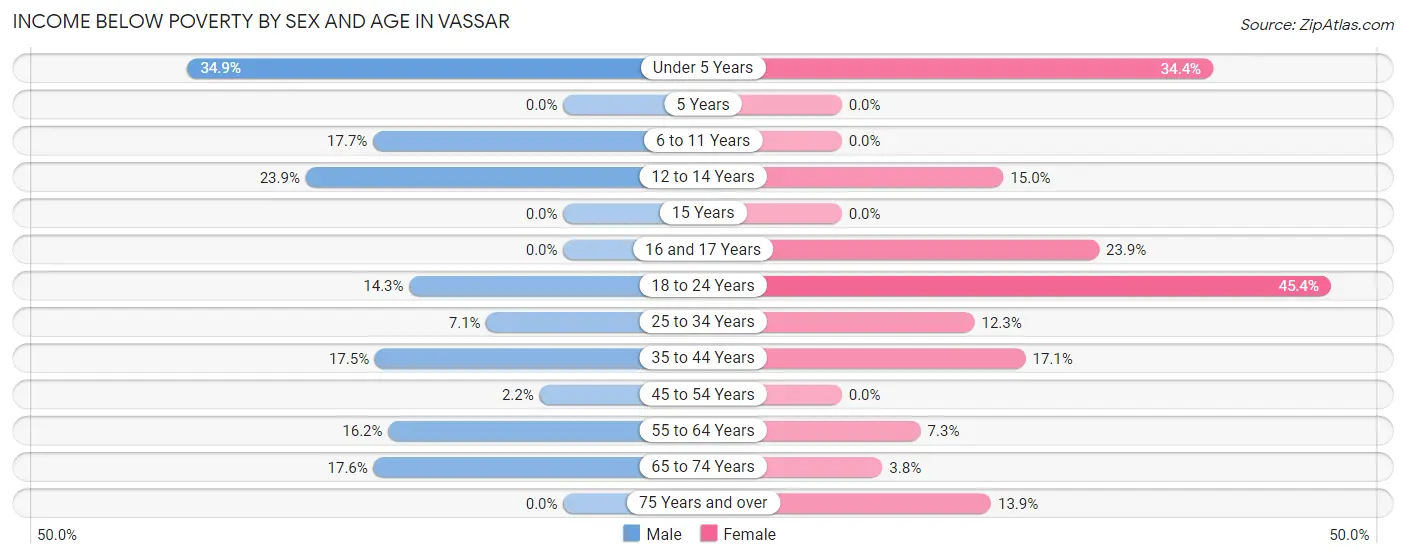
| Age Bracket | Male | Female |
| Under 5 Years | 15 (34.9%) | 31 (34.4%) |
| 5 Years | 0 (0.0%) | 0 (0.0%) |
| 6 to 11 Years | 18 (17.6%) | 0 (0.0%) |
| 12 to 14 Years | 11 (23.9%) | 3 (15.0%) |
| 15 Years | 0 (0.0%) | 0 (0.0%) |
| 16 and 17 Years | 0 (0.0%) | 16 (23.9%) |
| 18 to 24 Years | 36 (14.3%) | 54 (45.4%) |
| 25 to 34 Years | 8 (7.1%) | 17 (12.3%) |
| 35 to 44 Years | 36 (17.5%) | 29 (17.1%) |
| 45 to 54 Years | 5 (2.2%) | 0 (0.0%) |
| 55 to 64 Years | 19 (16.2%) | 9 (7.3%) |
| 65 to 74 Years | 28 (17.6%) | 4 (3.8%) |
| 75 Years and over | 0 (0.0%) | 9 (13.9%) |
| Total | 176 (12.9%) | 172 (15.0%) |
Income Above Poverty by Sex and Age in Vassar
According to the poverty statistics in Vassar, males aged 5 years and females aged 5 years are the age groups that are most secure financially, with 100.0% of males and 100.0% of females in these age groups living above the poverty line.
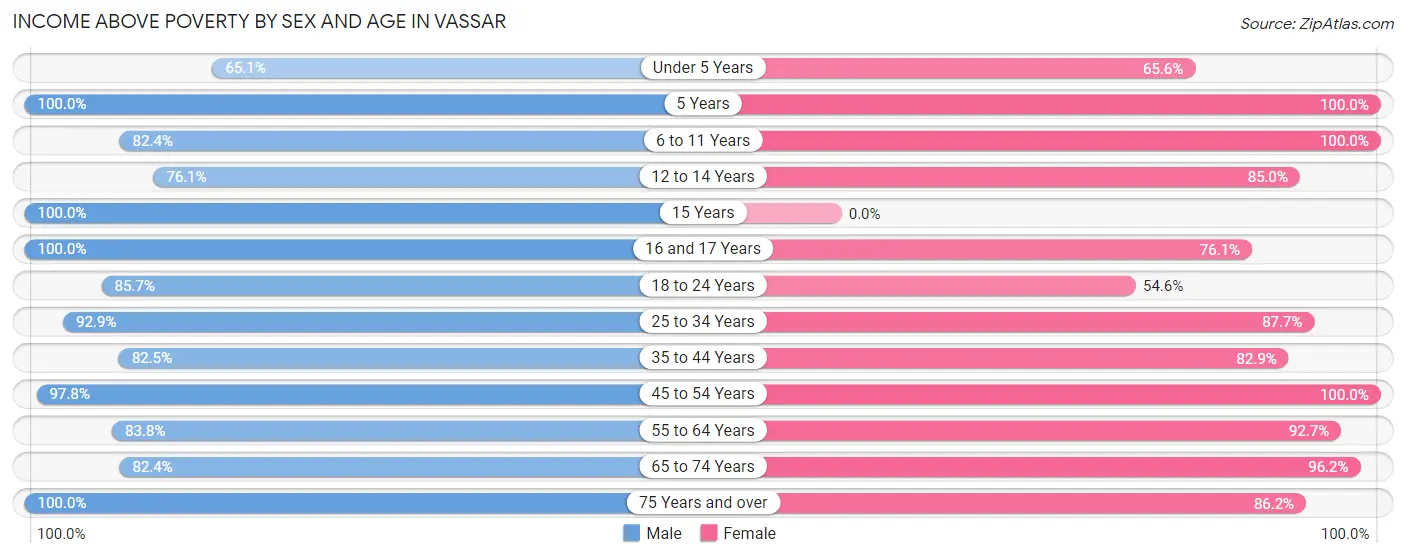
| Age Bracket | Male | Female |
| Under 5 Years | 28 (65.1%) | 59 (65.6%) |
| 5 Years | 13 (100.0%) | 10 (100.0%) |
| 6 to 11 Years | 84 (82.4%) | 38 (100.0%) |
| 12 to 14 Years | 35 (76.1%) | 17 (85.0%) |
| 15 Years | 23 (100.0%) | 0 (0.0%) |
| 16 and 17 Years | 21 (100.0%) | 51 (76.1%) |
| 18 to 24 Years | 216 (85.7%) | 65 (54.6%) |
| 25 to 34 Years | 104 (92.9%) | 121 (87.7%) |
| 35 to 44 Years | 170 (82.5%) | 141 (82.9%) |
| 45 to 54 Years | 221 (97.8%) | 203 (100.0%) |
| 55 to 64 Years | 98 (83.8%) | 114 (92.7%) |
| 65 to 74 Years | 131 (82.4%) | 102 (96.2%) |
| 75 Years and over | 50 (100.0%) | 56 (86.2%) |
| Total | 1,194 (87.2%) | 977 (85.0%) |
Income Below Poverty Among Married-Couple Families in Vassar
The poverty statistics for married-couple families in Vassar show that 2.3% or 10 of the total 441 families live below the poverty line. Families with 3 or 4 children have the highest poverty rate of 20.0%, comprising of 6 families. On the other hand, families with 1 or 2 children have the lowest poverty rate of 0.0%, which includes 0 families.
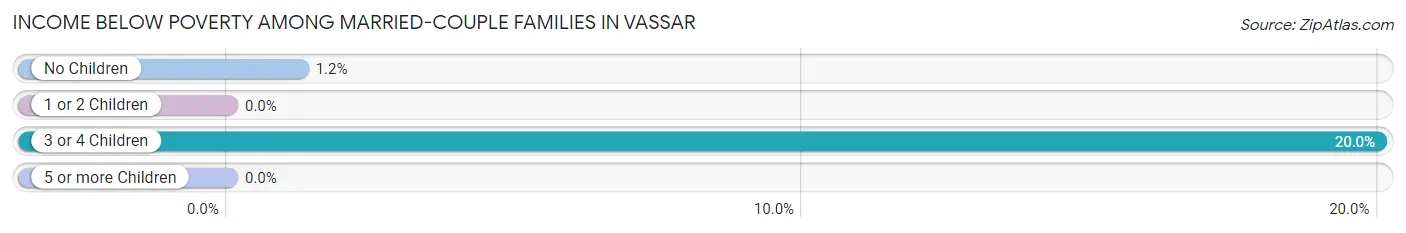
| Children | Above Poverty | Below Poverty |
| No Children | 321 (98.8%) | 4 (1.2%) |
| 1 or 2 Children | 50 (100.0%) | 0 (0.0%) |
| 3 or 4 Children | 24 (80.0%) | 6 (20.0%) |
| 5 or more Children | 36 (100.0%) | 0 (0.0%) |
| Total | 431 (97.7%) | 10 (2.3%) |
Income Below Poverty Among Single-Parent Households in Vassar
According to the poverty data in Vassar, 60.3% or 41 single-father households and 21.6% or 29 single-mother households are living below the poverty line. Among single-father households, those with 1 or 2 children have the highest poverty rate, with 41 households (75.9%) experiencing poverty. Likewise, among single-mother households, those with 1 or 2 children have the highest poverty rate, with 29 households (34.5%) falling below the poverty line.
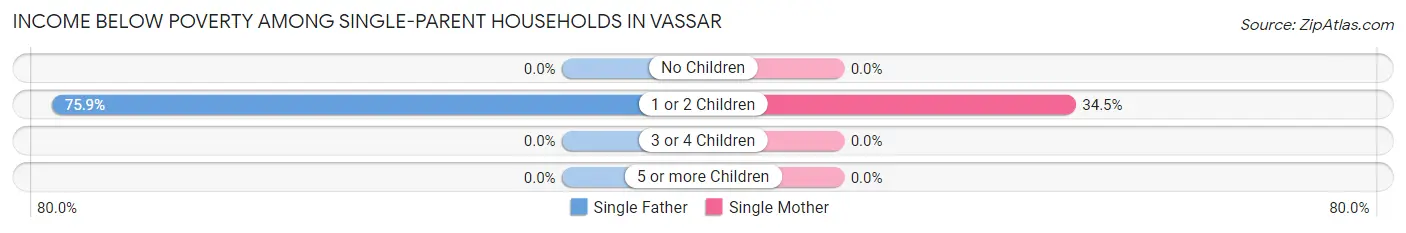
| Children | Single Father | Single Mother |
| No Children | 0 (0.0%) | 0 (0.0%) |
| 1 or 2 Children | 41 (75.9%) | 29 (34.5%) |
| 3 or 4 Children | 0 (0.0%) | 0 (0.0%) |
| 5 or more Children | 0 (0.0%) | 0 (0.0%) |
| Total | 41 (60.3%) | 29 (21.6%) |
Income Below Poverty Among Married-Couple vs Single-Parent Households in Vassar
The poverty data for Vassar shows that 10 of the married-couple family households (2.3%) and 70 of the single-parent households (34.6%) are living below the poverty level. Within the married-couple family households, those with 3 or 4 children have the highest poverty rate, with 6 households (20.0%) falling below the poverty line. Among the single-parent households, those with 1 or 2 children have the highest poverty rate, with 70 household (50.7%) living below poverty.
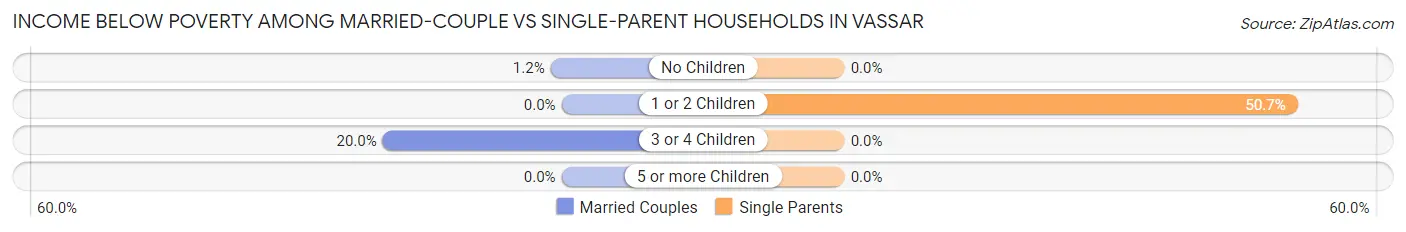
| Children | Married-Couple Families | Single-Parent Households |
| No Children | 4 (1.2%) | 0 (0.0%) |
| 1 or 2 Children | 0 (0.0%) | 70 (50.7%) |
| 3 or 4 Children | 6 (20.0%) | 0 (0.0%) |
| 5 or more Children | 0 (0.0%) | 0 (0.0%) |
| Total | 10 (2.3%) | 70 (34.6%) |
Race in Vassar
The most populous races in Vassar are White / Caucasian (2,458 | 90.4%), Hispanic or Latino (308 | 11.3%), and Two or more Races (167 | 6.1%).
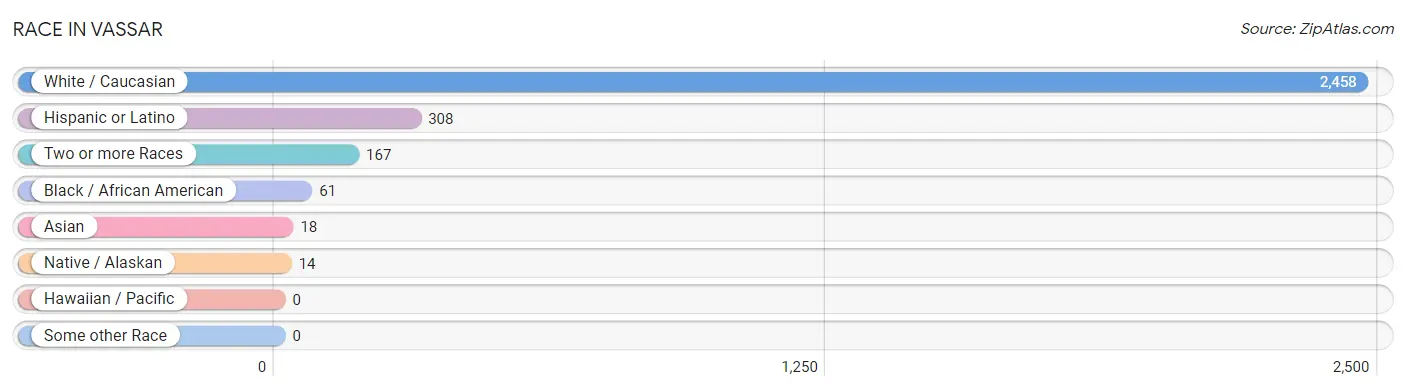
| Race | # Population | % Population |
| Asian | 18 | 0.7% |
| Black / African American | 61 | 2.2% |
| Hawaiian / Pacific | 0 | 0.0% |
| Hispanic or Latino | 308 | 11.3% |
| Native / Alaskan | 14 | 0.5% |
| White / Caucasian | 2,458 | 90.4% |
| Two or more Races | 167 | 6.1% |
| Some other Race | 0 | 0.0% |
| Total | 2,718 | 100.0% |
Ancestry in Vassar
The most populous ancestries reported in Vassar are German (625 | 23.0%), English (536 | 19.7%), Mexican (305 | 11.2%), Irish (249 | 9.2%), and Polish (192 | 7.1%), together accounting for 70.2% of all Vassar residents.
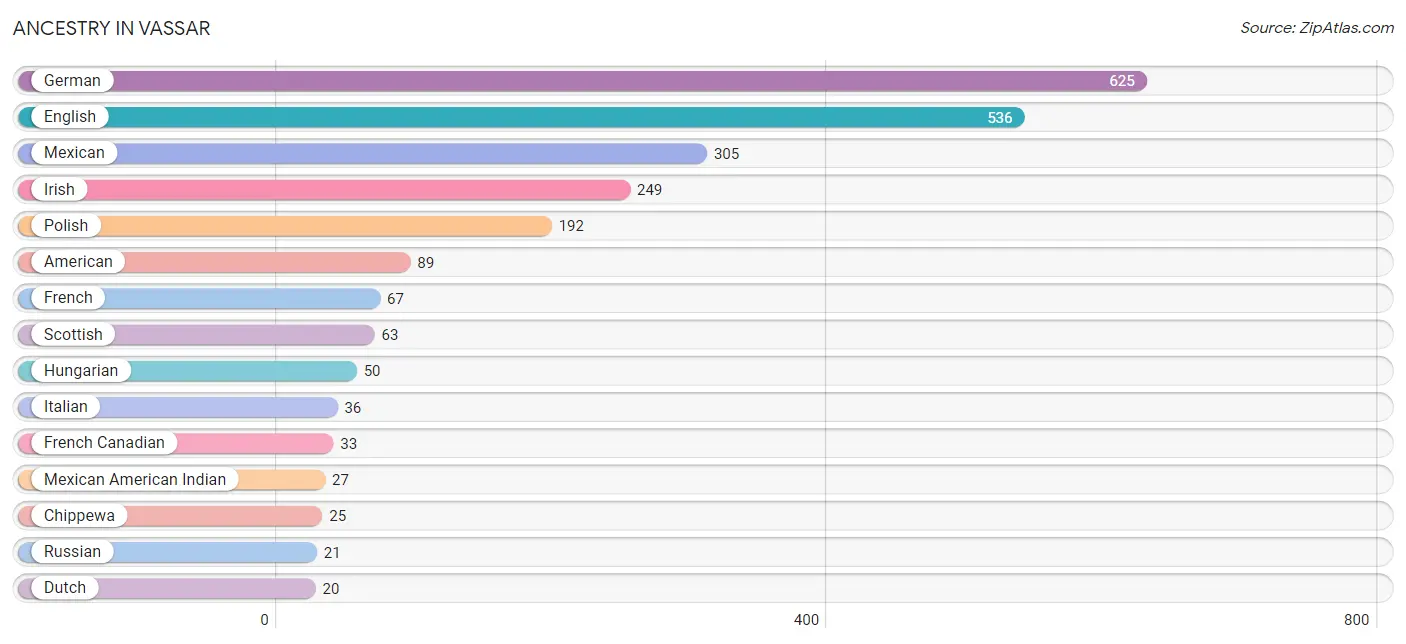
| Ancestry | # Population | % Population |
| American | 89 | 3.3% |
| Austrian | 5 | 0.2% |
| Belgian | 5 | 0.2% |
| British | 4 | 0.2% |
| Canadian | 13 | 0.5% |
| Cherokee | 4 | 0.2% |
| Chippewa | 25 | 0.9% |
| Czech | 7 | 0.3% |
| Danish | 4 | 0.2% |
| Dominican | 3 | 0.1% |
| Dutch | 20 | 0.7% |
| English | 536 | 19.7% |
| European | 15 | 0.5% |
| French | 67 | 2.5% |
| French Canadian | 33 | 1.2% |
| German | 625 | 23.0% |
| Hungarian | 50 | 1.8% |
| Irish | 249 | 9.2% |
| Italian | 36 | 1.3% |
| Lithuanian | 4 | 0.2% |
| Mexican | 305 | 11.2% |
| Mexican American Indian | 27 | 1.0% |
| Norwegian | 4 | 0.2% |
| Polish | 192 | 7.1% |
| Romanian | 5 | 0.2% |
| Russian | 21 | 0.8% |
| Scotch-Irish | 9 | 0.3% |
| Scottish | 63 | 2.3% |
| Swedish | 13 | 0.5% |
| Swiss | 4 | 0.2% |
| Thai | 18 | 0.7% |
| Ukrainian | 7 | 0.3% |
| Welsh | 6 | 0.2% | View All 33 Rows |
Immigrants in Vassar
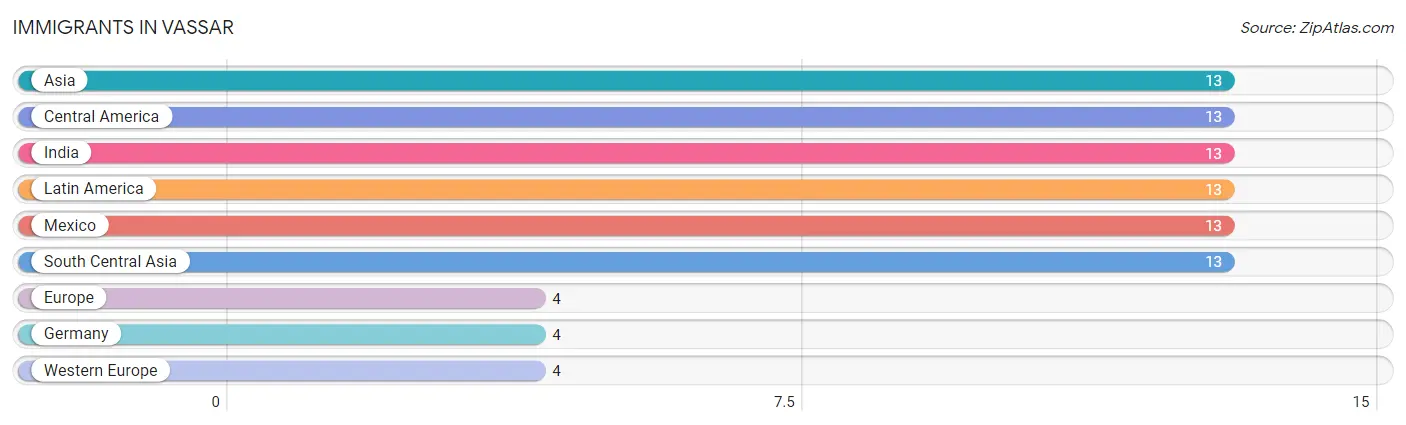
The most numerous immigrant groups reported in Vassar came from Asia (13 | 0.5%), Central America (13 | 0.5%), India (13 | 0.5%), Latin America (13 | 0.5%), and Mexico (13 | 0.5%), together accounting for 2.4% of all Vassar residents.
| Immigration Origin | # Population | % Population |
| Asia | 13 | 0.5% |
| Central America | 13 | 0.5% |
| Europe | 4 | 0.2% |
| Germany | 4 | 0.2% |
| India | 13 | 0.5% |
| Latin America | 13 | 0.5% |
| Mexico | 13 | 0.5% |
| South Central Asia | 13 | 0.5% |
| Western Europe | 4 | 0.2% | View All 9 Rows |
Sex and Age in Vassar
Sex and Age in Vassar
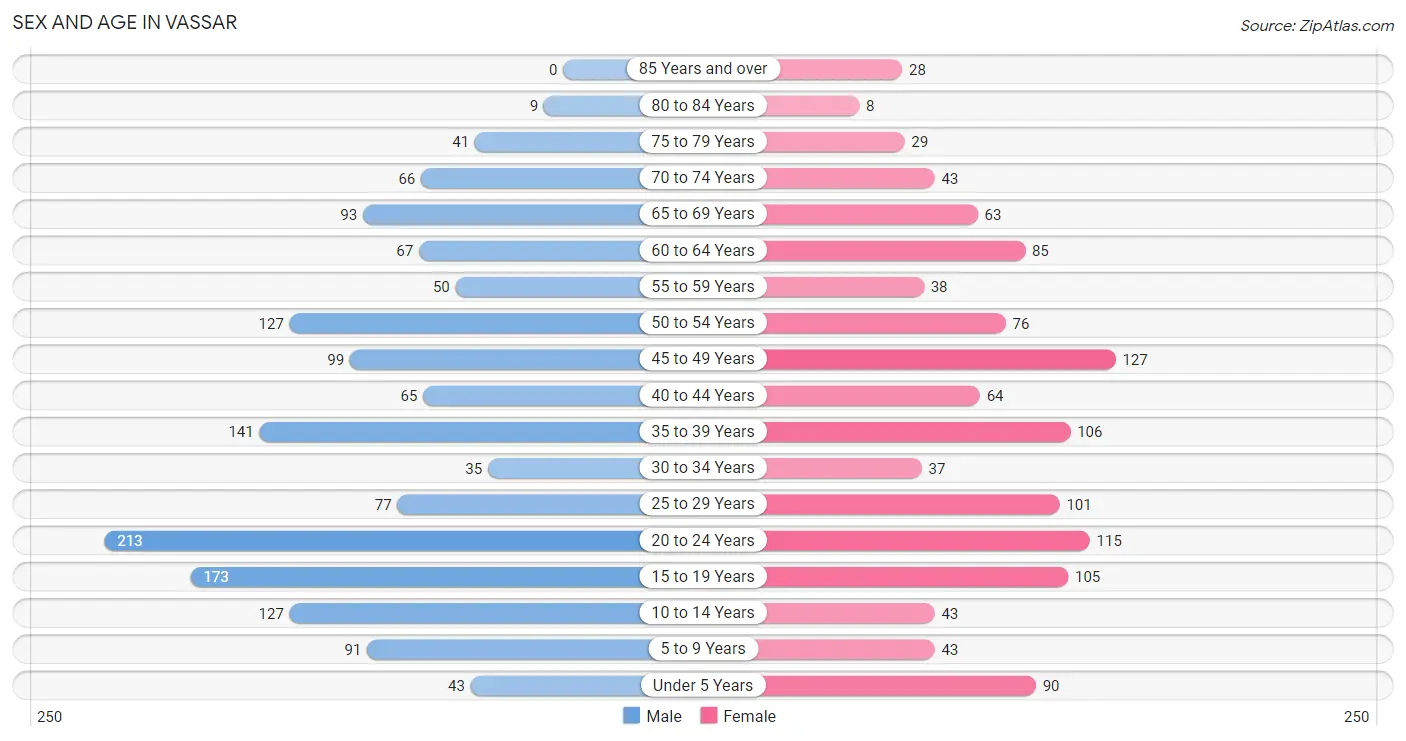
The most populous age groups in Vassar are 20 to 24 Years (213 | 14.0%) for men and 45 to 49 Years (127 | 10.6%) for women.
| Age Bracket | Male | Female |
| Under 5 Years | 43 (2.8%) | 90 (7.5%) |
| 5 to 9 Years | 91 (6.0%) | 43 (3.6%) |
| 10 to 14 Years | 127 (8.4%) | 43 (3.6%) |
| 15 to 19 Years | 173 (11.4%) | 105 (8.7%) |
| 20 to 24 Years | 213 (14.0%) | 115 (9.6%) |
| 25 to 29 Years | 77 (5.1%) | 101 (8.4%) |
| 30 to 34 Years | 35 (2.3%) | 37 (3.1%) |
| 35 to 39 Years | 141 (9.3%) | 106 (8.8%) |
| 40 to 44 Years | 65 (4.3%) | 64 (5.3%) |
| 45 to 49 Years | 99 (6.5%) | 127 (10.6%) |
| 50 to 54 Years | 127 (8.4%) | 76 (6.3%) |
| 55 to 59 Years | 50 (3.3%) | 38 (3.2%) |
| 60 to 64 Years | 67 (4.4%) | 85 (7.1%) |
| 65 to 69 Years | 93 (6.1%) | 63 (5.2%) |
| 70 to 74 Years | 66 (4.3%) | 43 (3.6%) |
| 75 to 79 Years | 41 (2.7%) | 29 (2.4%) |
| 80 to 84 Years | 9 (0.6%) | 8 (0.7%) |
| 85 Years and over | 0 (0.0%) | 28 (2.3%) |
| Total | 1,517 (100.0%) | 1,201 (100.0%) |
Families and Households in Vassar
Median Family Size in Vassar
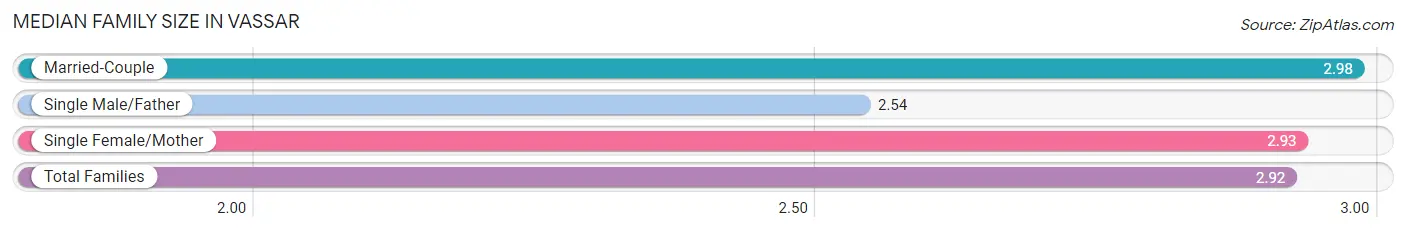
The median family size in Vassar is 2.92 persons per family, with married-couple families (441 | 68.6%) accounting for the largest median family size of 2.98 persons per family. On the other hand, single male/father families (68 | 10.6%) represent the smallest median family size with 2.54 persons per family.
| Family Type | # Families | Family Size |
| Married-Couple | 441 (68.6%) | 2.98 |
| Single Male/Father | 68 (10.6%) | 2.54 |
| Single Female/Mother | 134 (20.8%) | 2.93 |
| Total Families | 643 (100.0%) | 2.92 |
Median Household Size in Vassar
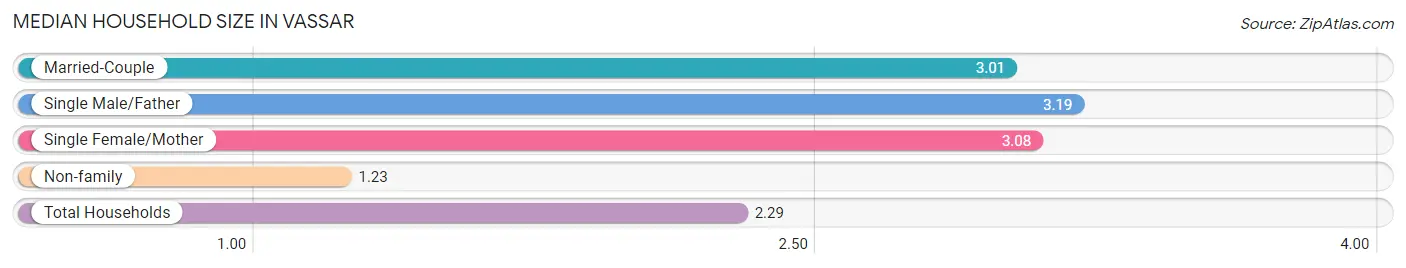
The median household size in Vassar is 2.29 persons per household, with single male/father households (68 | 6.1%) accounting for the largest median household size of 3.19 persons per household. non-family households (463 | 41.9%) represent the smallest median household size with 1.23 persons per household.
| Household Type | # Households | Household Size |
| Married-Couple | 441 (39.9%) | 3.01 |
| Single Male/Father | 68 (6.1%) | 3.19 |
| Single Female/Mother | 134 (12.1%) | 3.08 |
| Non-family | 463 (41.9%) | 1.23 |
| Total Households | 1,106 (100.0%) | 2.29 |
Household Size by Marriage Status in Vassar
Out of a total of 1,106 households in Vassar, 643 (58.1%) are family households, while 463 (41.9%) are nonfamily households. The most numerous type of family households are 2-person households, comprising 226, and the most common type of nonfamily households are 1-person households, comprising 400.
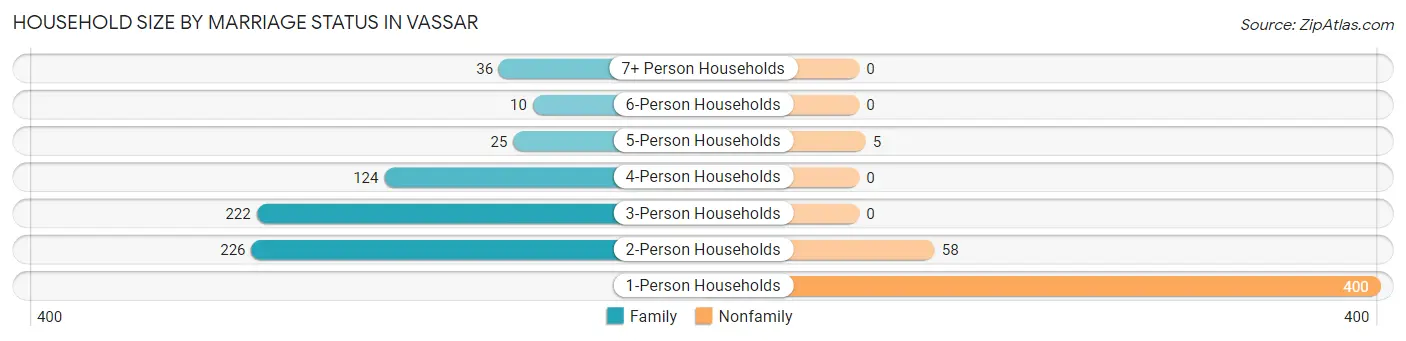
| Household Size | Family Households | Nonfamily Households |
| 1-Person Households | - | 400 (36.2%) |
| 2-Person Households | 226 (20.4%) | 58 (5.2%) |
| 3-Person Households | 222 (20.1%) | 0 (0.0%) |
| 4-Person Households | 124 (11.2%) | 0 (0.0%) |
| 5-Person Households | 25 (2.3%) | 5 (0.4%) |
| 6-Person Households | 10 (0.9%) | 0 (0.0%) |
| 7+ Person Households | 36 (3.3%) | 0 (0.0%) |
| Total | 643 (58.1%) | 463 (41.9%) |
Female Fertility in Vassar
Fertility by Age in Vassar
Average fertility rate in Vassar is 52.0 births per 1,000 women. Women in the age bracket of 20 to 34 years have the highest fertility rate with 63.0 births per 1,000 women. Women in the age bracket of 35 to 50 years acount for 54.3% of all women with births.
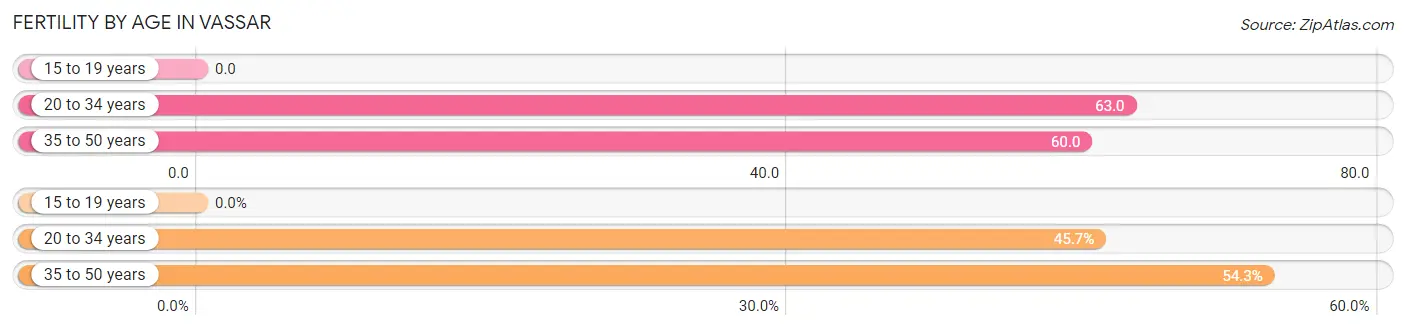
| Age Bracket | Women with Births | Births / 1,000 Women |
| 15 to 19 years | 0 (0.0%) | 0.0 |
| 20 to 34 years | 16 (45.7%) | 63.0 |
| 35 to 50 years | 19 (54.3%) | 60.0 |
| Total | 35 (100.0%) | 52.0 |
Fertility by Age by Marriage Status in Vassar
54.3% of women with births (35) in Vassar are married. The highest percentage of unmarried women with births falls into 20 to 34 years age bracket with 100.0% of them unmarried at the time of birth, while the lowest percentage of unmarried women with births belong to 35 to 50 years age bracket with 0.0% of them unmarried.
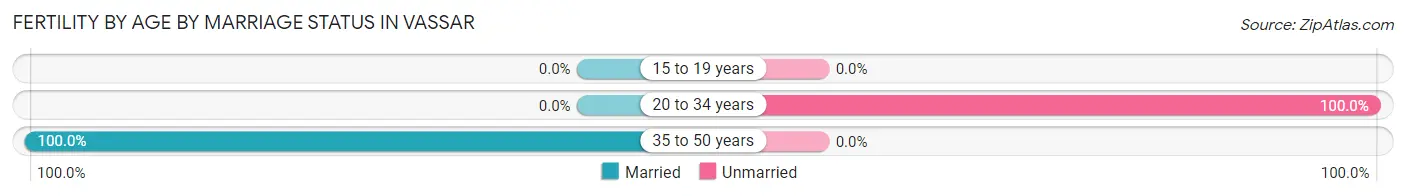
| Age Bracket | Married | Unmarried |
| 15 to 19 years | 0 (0.0%) | 0 (0.0%) |
| 20 to 34 years | 0 (0.0%) | 16 (100.0%) |
| 35 to 50 years | 19 (100.0%) | 0 (0.0%) |
| Total | 19 (54.3%) | 16 (45.7%) |
Fertility by Education in Vassar
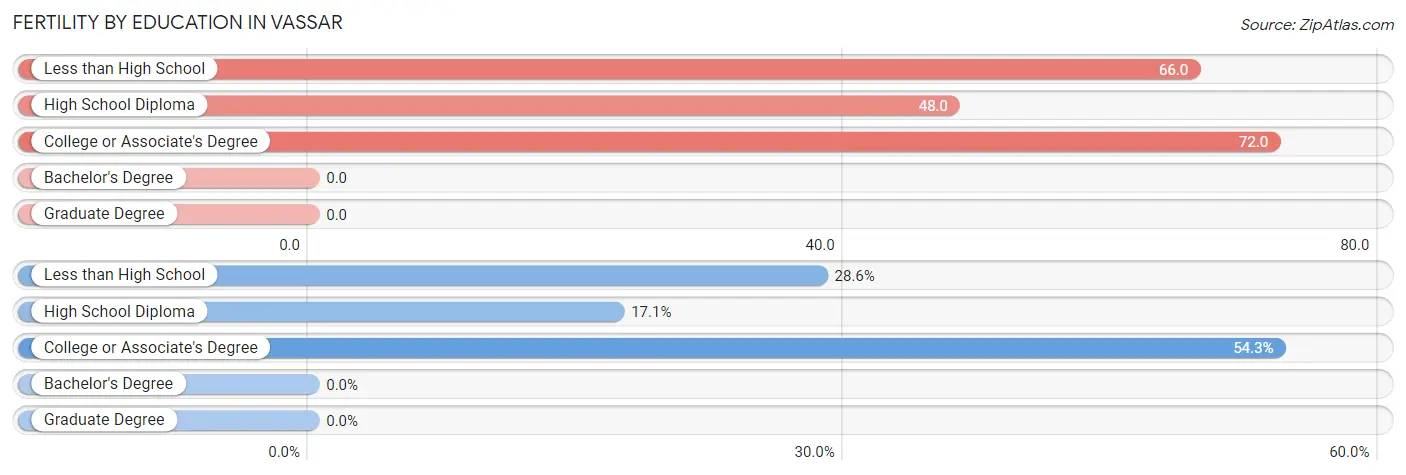
| Educational Attainment | Women with Births | Births / 1,000 Women |
| Less than High School | 10 (28.6%) | 66.0 |
| High School Diploma | 6 (17.1%) | 48.0 |
| College or Associate's Degree | 19 (54.3%) | 72.0 |
| Bachelor's Degree | 0 (0.0%) | 0.0 |
| Graduate Degree | 0 (0.0%) | 0.0 |
| Total | 35 (100.0%) | 52.0 |
Fertility by Education by Marriage Status in Vassar
45.7% of women with births in Vassar are unmarried. Women with the educational attainment of college or associate's degree are most likely to be married with 100.0% of them married at childbirth, while women with the educational attainment of less than high school are least likely to be married with 100.0% of them unmarried at childbirth.
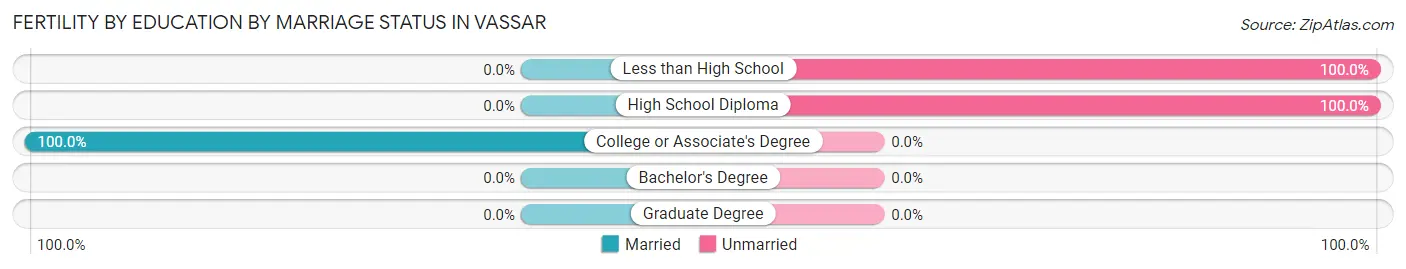
| Educational Attainment | Married | Unmarried |
| Less than High School | 0 (0.0%) | 10 (100.0%) |
| High School Diploma | 0 (0.0%) | 6 (100.0%) |
| College or Associate's Degree | 19 (100.0%) | 0 (0.0%) |
| Bachelor's Degree | 0 (0.0%) | 0 (0.0%) |
| Graduate Degree | 0 (0.0%) | 0 (0.0%) |
| Total | 19 (54.3%) | 16 (45.7%) |
Employment Characteristics in Vassar
Employment by Class of Employer in Vassar
Among the 1,165 employed individuals in Vassar, private company employees (928 | 79.7%), not-for-profit organizations (60 | 5.1%), and federal government employees (58 | 5.0%) make up the most common classes of employment.
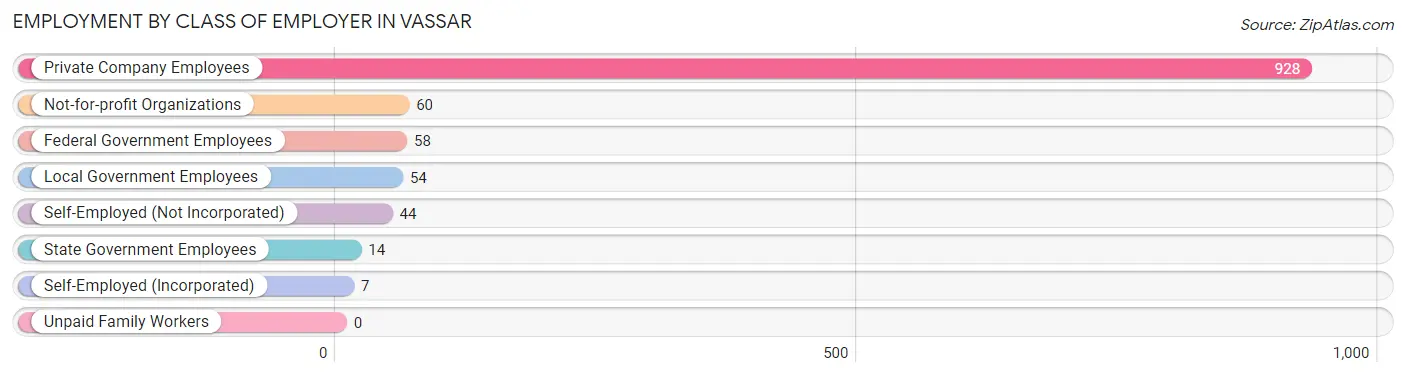
| Employer Class | # Employees | % Employees |
| Private Company Employees | 928 | 79.7% |
| Self-Employed (Incorporated) | 7 | 0.6% |
| Self-Employed (Not Incorporated) | 44 | 3.8% |
| Not-for-profit Organizations | 60 | 5.1% |
| Local Government Employees | 54 | 4.6% |
| State Government Employees | 14 | 1.2% |
| Federal Government Employees | 58 | 5.0% |
| Unpaid Family Workers | 0 | 0.0% |
| Total | 1,165 | 100.0% |
Employment Status by Age in Vassar
According to the labor force statistics for Vassar, out of the total population over 16 years of age (2,209), 60.9% or 1,345 individuals are in the labor force, with 12.1% or 163 of them unemployed. The age group with the highest labor force participation rate is 20 to 24 years, with 90.9% or 298 individuals in the labor force. Within the labor force, the 20 to 24 years age range has the highest percentage of unemployed individuals, with 29.9% or 89 of them being unemployed.
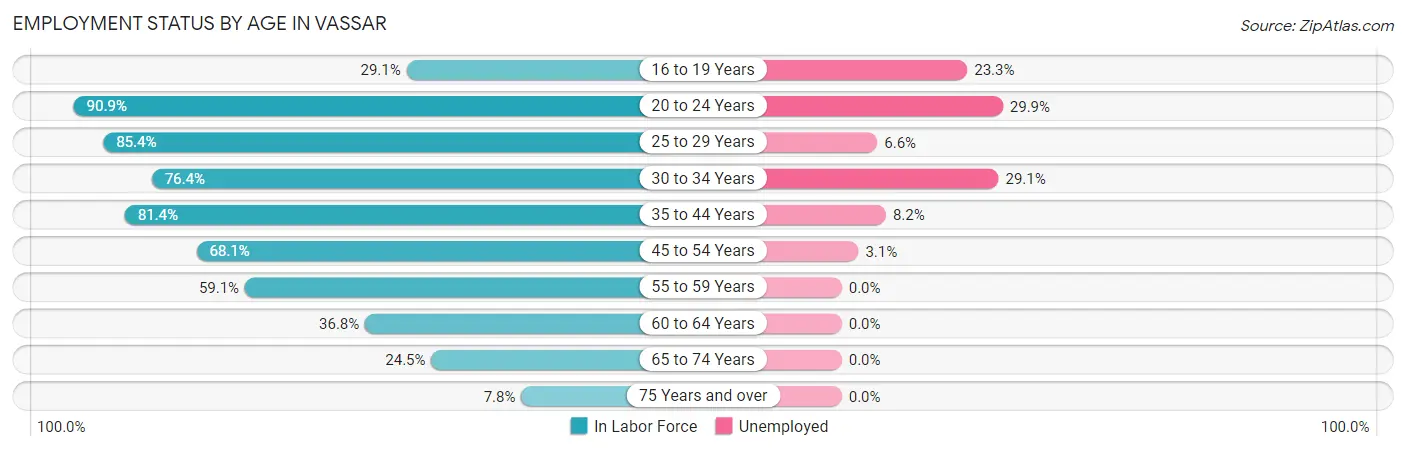
| Age Bracket | In Labor Force | Unemployed |
| 16 to 19 Years | 60 (29.1%) | 14 (23.3%) |
| 20 to 24 Years | 298 (90.9%) | 89 (29.9%) |
| 25 to 29 Years | 152 (85.4%) | 10 (6.6%) |
| 30 to 34 Years | 55 (76.4%) | 16 (29.1%) |
| 35 to 44 Years | 306 (81.4%) | 25 (8.2%) |
| 45 to 54 Years | 292 (68.1%) | 9 (3.1%) |
| 55 to 59 Years | 52 (59.1%) | 0 (0.0%) |
| 60 to 64 Years | 56 (36.8%) | 0 (0.0%) |
| 65 to 74 Years | 65 (24.5%) | 0 (0.0%) |
| 75 Years and over | 9 (7.8%) | 0 (0.0%) |
| Total | 1,345 (60.9%) | 163 (12.1%) |
Employment Status by Educational Attainment in Vassar
According to labor force statistics for Vassar, 70.5% of individuals (913) out of the total population between 25 and 64 years of age (1,295) are in the labor force, with 6.6% or 60 of them being unemployed. The group with the highest labor force participation rate are those with the educational attainment of bachelor's degree or higher, with 87.1% or 182 individuals in the labor force. Within the labor force, individuals with less than high school education have the highest percentage of unemployment, with 11.0% or 10 of them being unemployed.
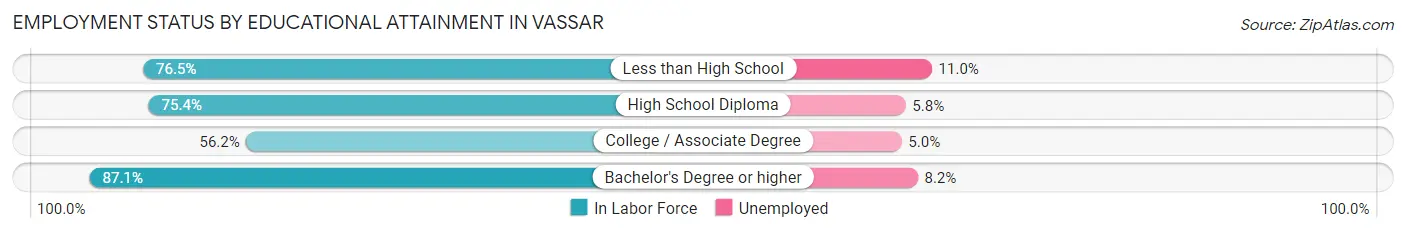
| Educational Attainment | In Labor Force | Unemployed |
| Less than High School | 91 (76.5%) | 13 (11.0%) |
| High School Diploma | 378 (75.4%) | 29 (5.8%) |
| College / Associate Degree | 262 (56.2%) | 23 (5.0%) |
| Bachelor's Degree or higher | 182 (87.1%) | 17 (8.2%) |
| Total | 913 (70.5%) | 85 (6.6%) |
Employment Occupations by Sex in Vassar
Management, Business, Science and Arts Occupations
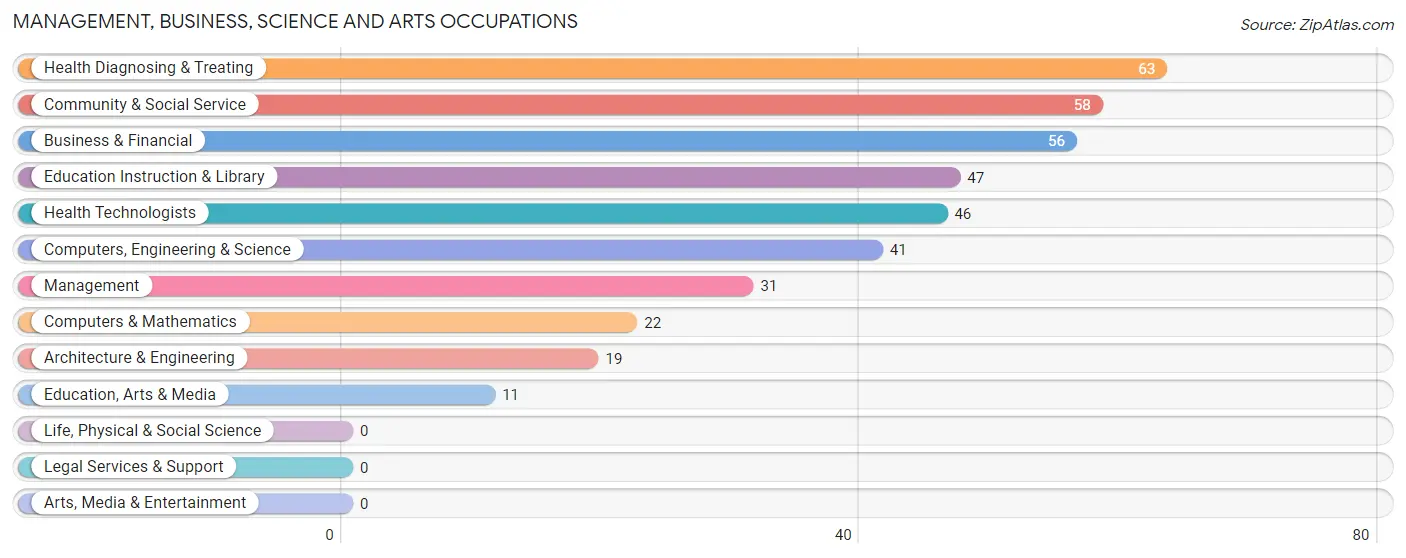
The most common Management, Business, Science and Arts occupations in Vassar are Health Diagnosing & Treating (63 | 5.3%), Community & Social Service (58 | 4.9%), Business & Financial (56 | 4.7%), Education Instruction & Library (47 | 4.0%), and Health Technologists (46 | 3.9%).
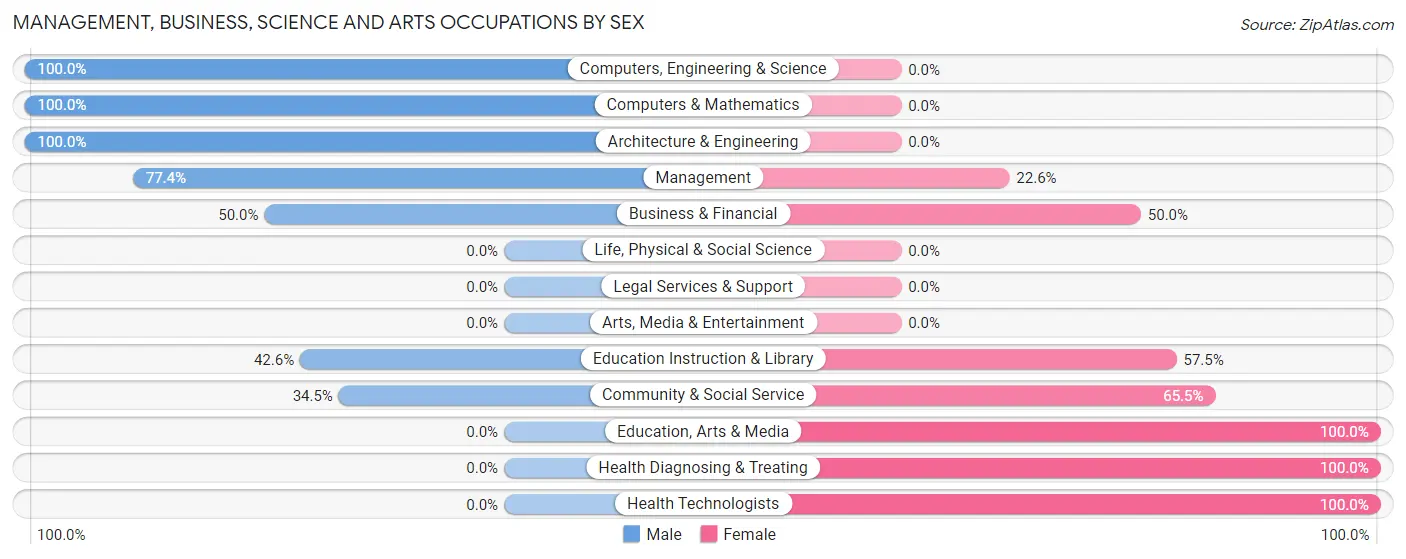
Management, Business, Science and Arts Occupations by Sex
Within the Management, Business, Science and Arts occupations in Vassar, the most male-oriented occupations are Computers, Engineering & Science (100.0%), Computers & Mathematics (100.0%), and Architecture & Engineering (100.0%), while the most female-oriented occupations are Education, Arts & Media (100.0%), Health Diagnosing & Treating (100.0%), and Health Technologists (100.0%).
| Occupation | Male | Female |
| Management | 24 (77.4%) | 7 (22.6%) |
| Business & Financial | 28 (50.0%) | 28 (50.0%) |
| Computers, Engineering & Science | 41 (100.0%) | 0 (0.0%) |
| Computers & Mathematics | 22 (100.0%) | 0 (0.0%) |
| Architecture & Engineering | 19 (100.0%) | 0 (0.0%) |
| Life, Physical & Social Science | 0 (0.0%) | 0 (0.0%) |
| Community & Social Service | 20 (34.5%) | 38 (65.5%) |
| Education, Arts & Media | 0 (0.0%) | 11 (100.0%) |
| Legal Services & Support | 0 (0.0%) | 0 (0.0%) |
| Education Instruction & Library | 20 (42.5%) | 27 (57.5%) |
| Arts, Media & Entertainment | 0 (0.0%) | 0 (0.0%) |
| Health Diagnosing & Treating | 0 (0.0%) | 63 (100.0%) |
| Health Technologists | 0 (0.0%) | 46 (100.0%) |
| Total (Category) | 113 (45.4%) | 136 (54.6%) |
| Total (Overall) | 688 (58.2%) | 494 (41.8%) |
Services Occupations
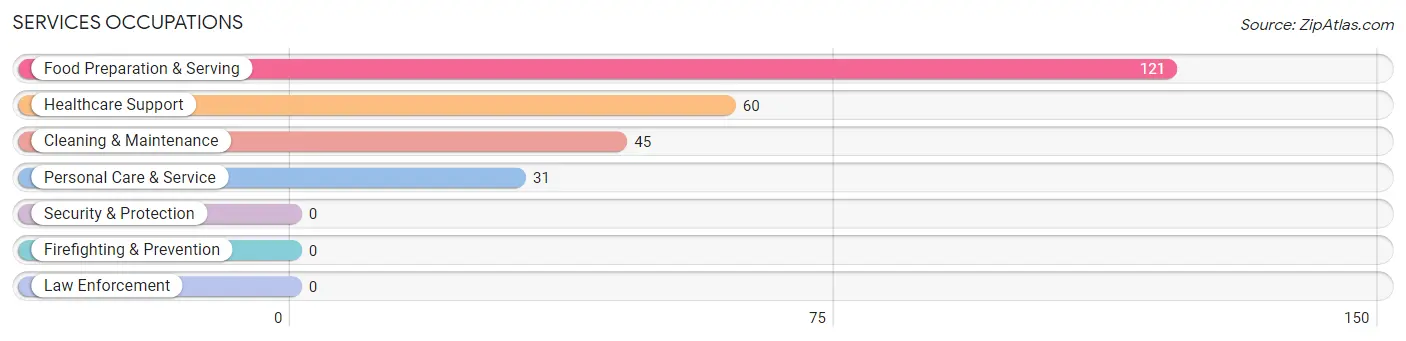
The most common Services occupations in Vassar are Food Preparation & Serving (121 | 10.2%), Healthcare Support (60 | 5.1%), Cleaning & Maintenance (45 | 3.8%), and Personal Care & Service (31 | 2.6%).
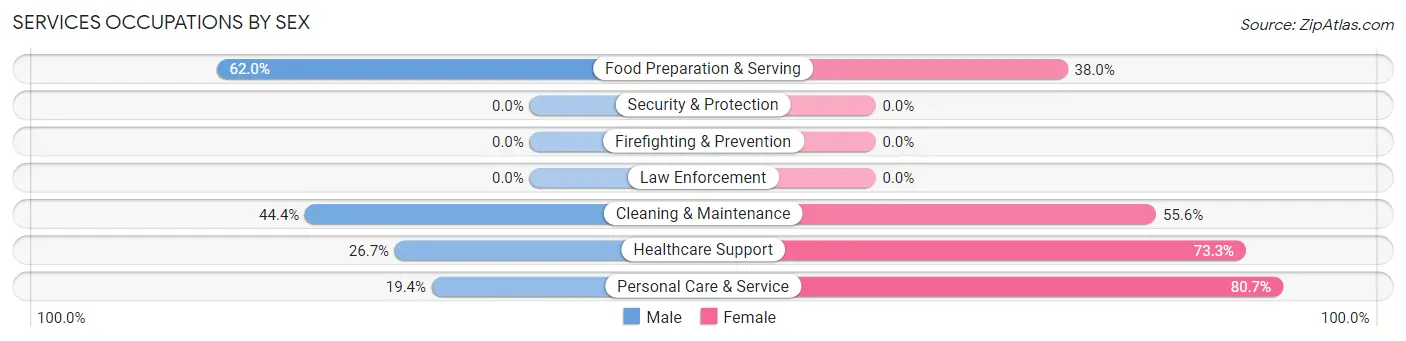
Services Occupations by Sex
Within the Services occupations in Vassar, the most male-oriented occupations are Food Preparation & Serving (62.0%), Cleaning & Maintenance (44.4%), and Healthcare Support (26.7%), while the most female-oriented occupations are Personal Care & Service (80.6%), Healthcare Support (73.3%), and Cleaning & Maintenance (55.6%).
| Occupation | Male | Female |
| Healthcare Support | 16 (26.7%) | 44 (73.3%) |
| Security & Protection | 0 (0.0%) | 0 (0.0%) |
| Firefighting & Prevention | 0 (0.0%) | 0 (0.0%) |
| Law Enforcement | 0 (0.0%) | 0 (0.0%) |
| Food Preparation & Serving | 75 (62.0%) | 46 (38.0%) |
| Cleaning & Maintenance | 20 (44.4%) | 25 (55.6%) |
| Personal Care & Service | 6 (19.4%) | 25 (80.6%) |
| Total (Category) | 117 (45.5%) | 140 (54.5%) |
| Total (Overall) | 688 (58.2%) | 494 (41.8%) |
Sales and Office Occupations
The most common Sales and Office occupations in Vassar are Sales & Related (110 | 9.3%), and Office & Administration (82 | 6.9%).
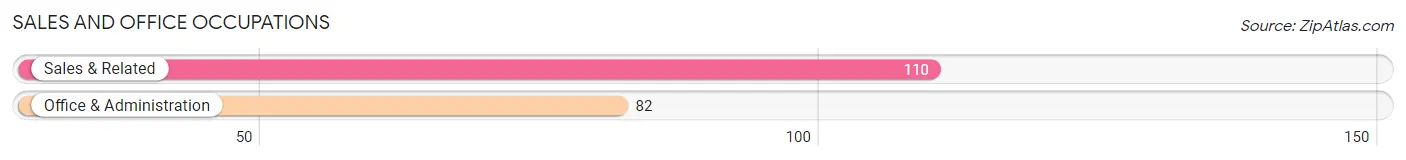
Sales and Office Occupations by Sex

| Occupation | Male | Female |
| Sales & Related | 21 (19.1%) | 89 (80.9%) |
| Office & Administration | 20 (24.4%) | 62 (75.6%) |
| Total (Category) | 41 (21.3%) | 151 (78.6%) |
| Total (Overall) | 688 (58.2%) | 494 (41.8%) |
Natural Resources, Construction and Maintenance Occupations
The most common Natural Resources, Construction and Maintenance occupations in Vassar are Construction & Extraction (191 | 16.2%), Farming, Fishing & Forestry (58 | 4.9%), and Installation, Maintenance & Repair (34 | 2.9%).
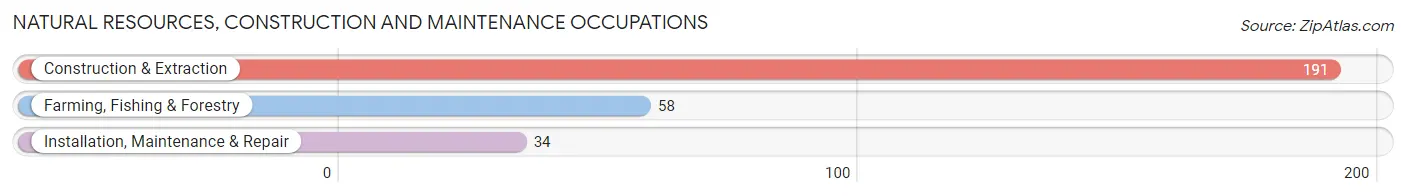
Natural Resources, Construction and Maintenance Occupations by Sex
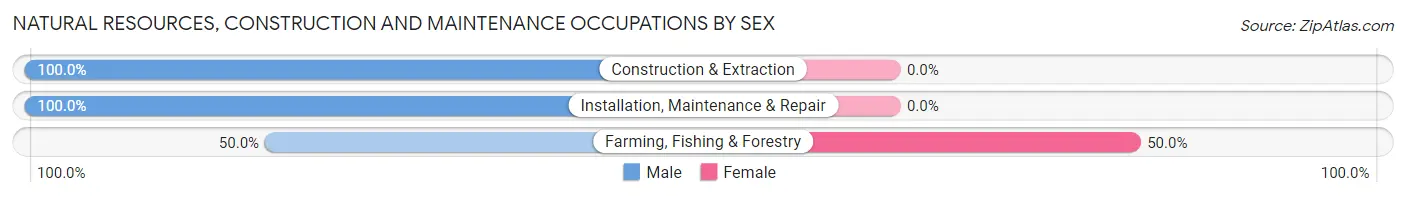
| Occupation | Male | Female |
| Farming, Fishing & Forestry | 29 (50.0%) | 29 (50.0%) |
| Construction & Extraction | 191 (100.0%) | 0 (0.0%) |
| Installation, Maintenance & Repair | 34 (100.0%) | 0 (0.0%) |
| Total (Category) | 254 (89.7%) | 29 (10.2%) |
| Total (Overall) | 688 (58.2%) | 494 (41.8%) |
Production, Transportation and Moving Occupations
The most common Production, Transportation and Moving occupations in Vassar are Production (106 | 9.0%), Material Moving (57 | 4.8%), and Transportation (38 | 3.2%).
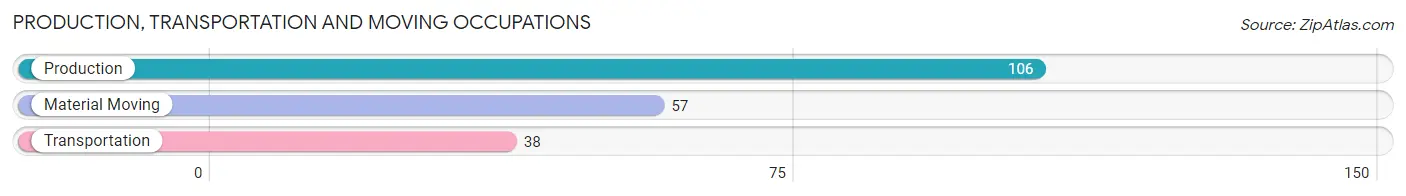
Production, Transportation and Moving Occupations by Sex
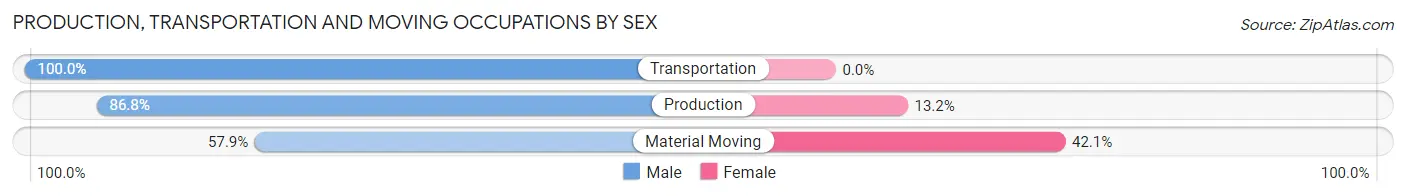
| Occupation | Male | Female |
| Production | 92 (86.8%) | 14 (13.2%) |
| Transportation | 38 (100.0%) | 0 (0.0%) |
| Material Moving | 33 (57.9%) | 24 (42.1%) |
| Total (Category) | 163 (81.1%) | 38 (18.9%) |
| Total (Overall) | 688 (58.2%) | 494 (41.8%) |
Employment Industries by Sex in Vassar
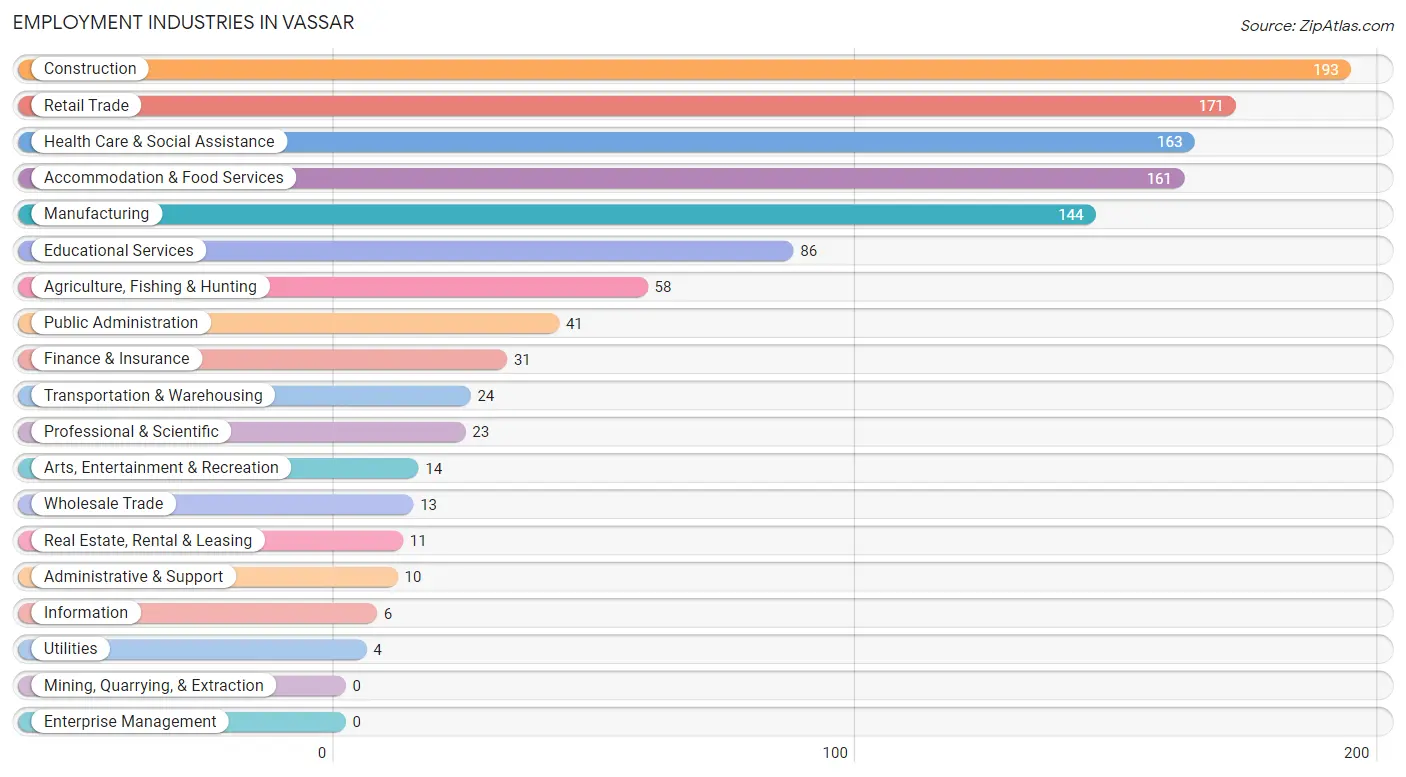
Employment Industries in Vassar
The major employment industries in Vassar include Construction (193 | 16.3%), Retail Trade (171 | 14.5%), Health Care & Social Assistance (163 | 13.8%), Accommodation & Food Services (161 | 13.6%), and Manufacturing (144 | 12.2%).
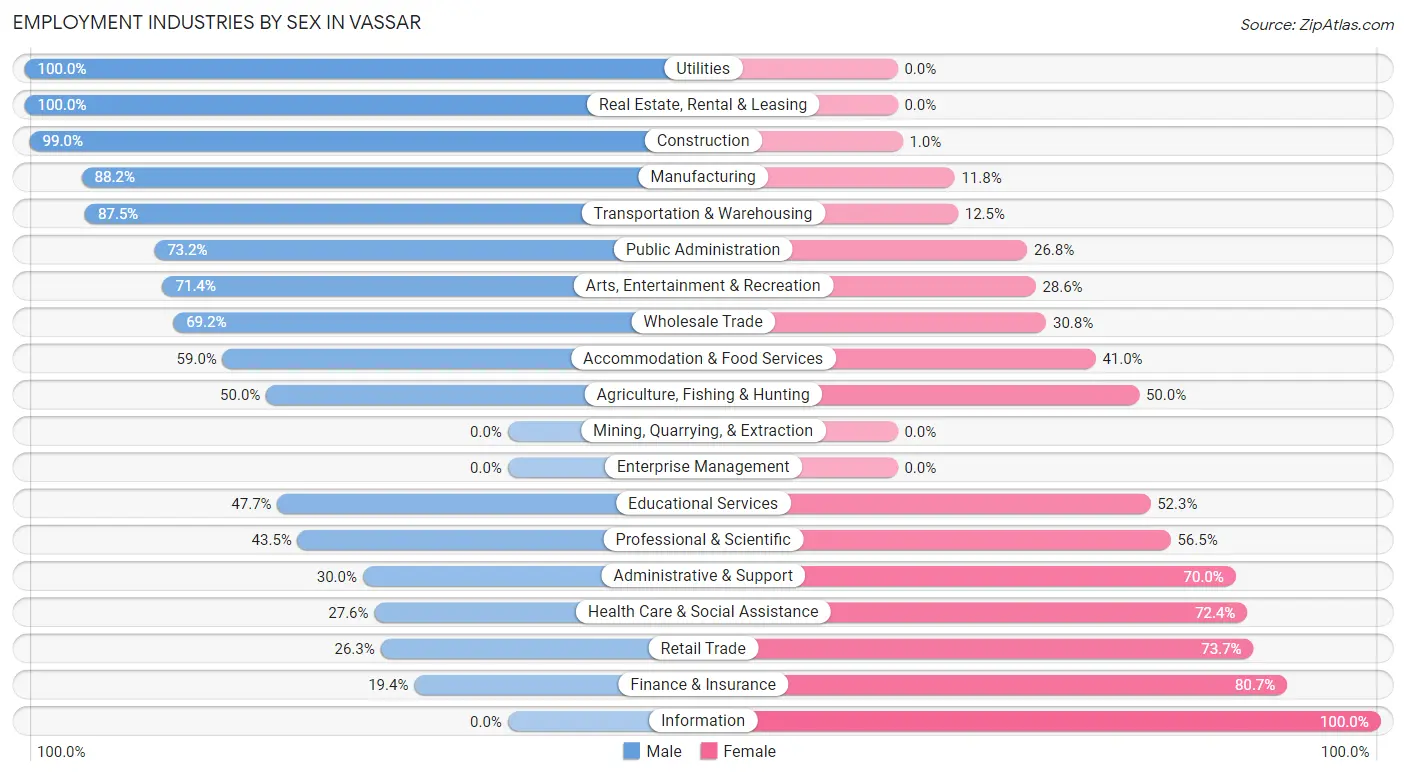
Employment Industries by Sex in Vassar
The Vassar industries that see more men than women are Utilities (100.0%), Real Estate, Rental & Leasing (100.0%), and Construction (99.0%), whereas the industries that tend to have a higher number of women are Information (100.0%), Finance & Insurance (80.6%), and Retail Trade (73.7%).
| Industry | Male | Female |
| Agriculture, Fishing & Hunting | 29 (50.0%) | 29 (50.0%) |
| Mining, Quarrying, & Extraction | 0 (0.0%) | 0 (0.0%) |
| Construction | 191 (99.0%) | 2 (1.0%) |
| Manufacturing | 127 (88.2%) | 17 (11.8%) |
| Wholesale Trade | 9 (69.2%) | 4 (30.8%) |
| Retail Trade | 45 (26.3%) | 126 (73.7%) |
| Transportation & Warehousing | 21 (87.5%) | 3 (12.5%) |
| Utilities | 4 (100.0%) | 0 (0.0%) |
| Information | 0 (0.0%) | 6 (100.0%) |
| Finance & Insurance | 6 (19.4%) | 25 (80.6%) |
| Real Estate, Rental & Leasing | 11 (100.0%) | 0 (0.0%) |
| Professional & Scientific | 10 (43.5%) | 13 (56.5%) |
| Enterprise Management | 0 (0.0%) | 0 (0.0%) |
| Administrative & Support | 3 (30.0%) | 7 (70.0%) |
| Educational Services | 41 (47.7%) | 45 (52.3%) |
| Health Care & Social Assistance | 45 (27.6%) | 118 (72.4%) |
| Arts, Entertainment & Recreation | 10 (71.4%) | 4 (28.6%) |
| Accommodation & Food Services | 95 (59.0%) | 66 (41.0%) |
| Public Administration | 30 (73.2%) | 11 (26.8%) |
| Total | 688 (58.2%) | 494 (41.8%) |
Education in Vassar
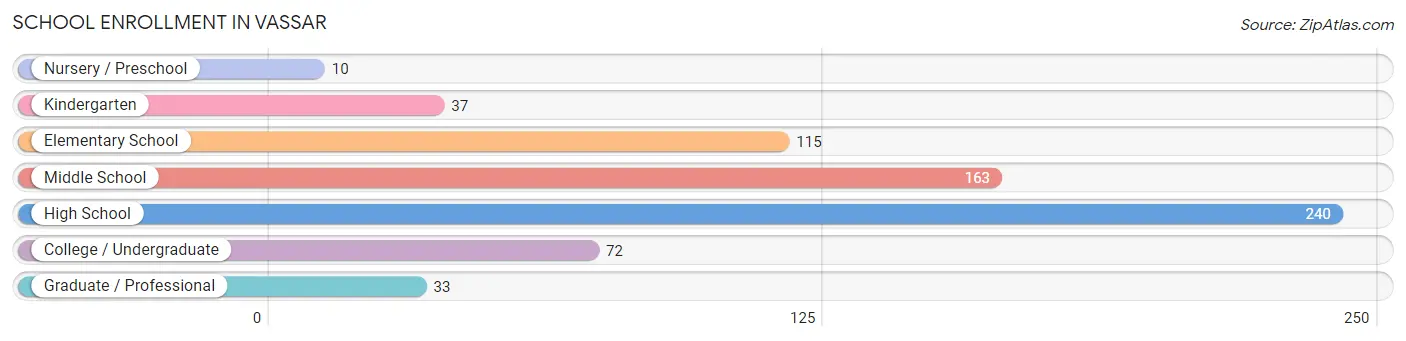
School Enrollment in Vassar
The most common levels of schooling among the 670 students in Vassar are high school (240 | 35.8%), middle school (163 | 24.3%), and elementary school (115 | 17.2%).
| School Level | # Students | % Students |
| Nursery / Preschool | 10 | 1.5% |
| Kindergarten | 37 | 5.5% |
| Elementary School | 115 | 17.2% |
| Middle School | 163 | 24.3% |
| High School | 240 | 35.8% |
| College / Undergraduate | 72 | 10.7% |
| Graduate / Professional | 33 | 4.9% |
| Total | 670 | 100.0% |
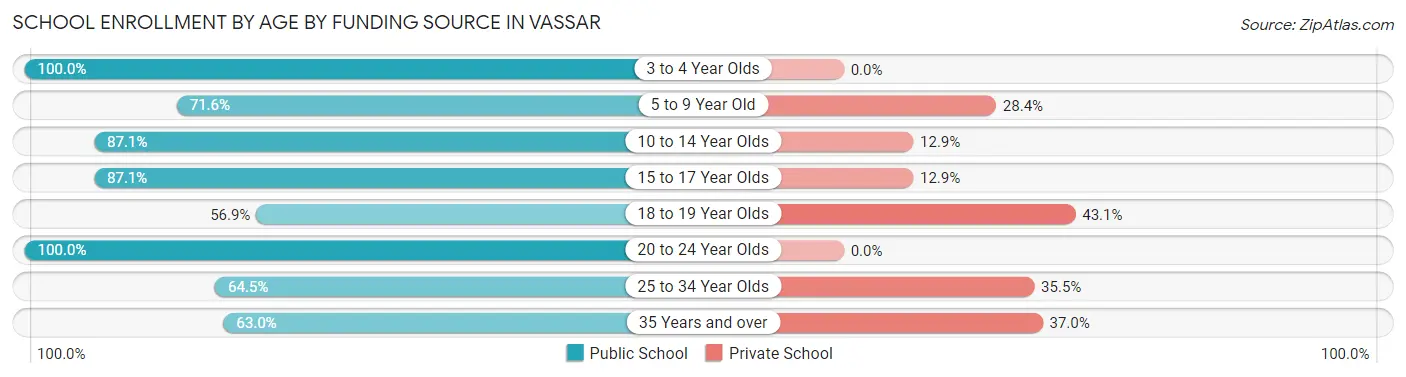
School Enrollment by Age by Funding Source in Vassar
Out of a total of 670 students who are enrolled in schools in Vassar, 130 (19.4%) attend a private institution, while the remaining 540 (80.6%) are enrolled in public schools. The age group of 18 to 19 year olds has the highest likelihood of being enrolled in private schools, with 22 (43.1% in the age bracket) enrolled. Conversely, the age group of 3 to 4 year olds has the lowest likelihood of being enrolled in a private school, with 5 (100.0% in the age bracket) attending a public institution.
| Age Bracket | Public School | Private School |
| 3 to 4 Year Olds | 5 (100.0%) | 0 (0.0%) |
| 5 to 9 Year Old | 96 (71.6%) | 38 (28.4%) |
| 10 to 14 Year Olds | 148 (87.1%) | 22 (12.9%) |
| 15 to 17 Year Olds | 182 (87.1%) | 27 (12.9%) |
| 18 to 19 Year Olds | 29 (56.9%) | 22 (43.1%) |
| 20 to 24 Year Olds | 43 (100.0%) | 0 (0.0%) |
| 25 to 34 Year Olds | 20 (64.5%) | 11 (35.5%) |
| 35 Years and over | 17 (63.0%) | 10 (37.0%) |
| Total | 540 (80.6%) | 130 (19.4%) |
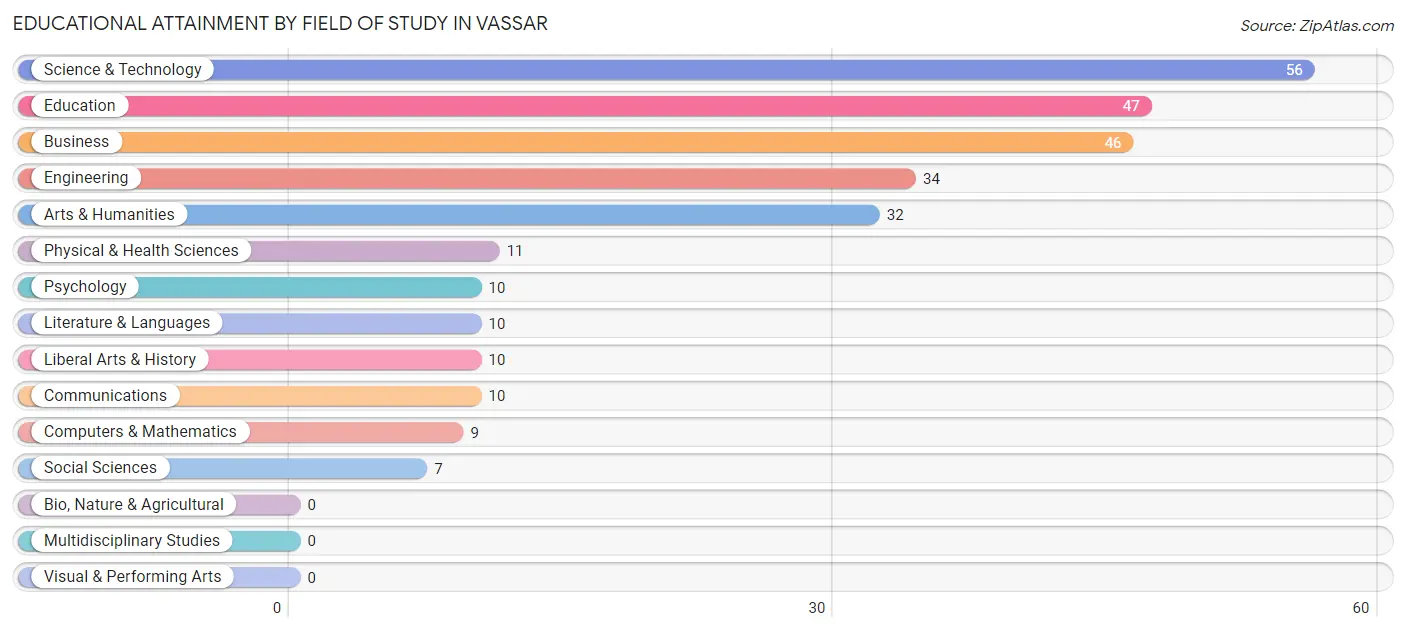
Educational Attainment by Field of Study in Vassar
Science & technology (56 | 19.9%), education (47 | 16.7%), business (46 | 16.3%), engineering (34 | 12.1%), and arts & humanities (32 | 11.4%) are the most common fields of study among 282 individuals in Vassar who have obtained a bachelor's degree or higher.
| Field of Study | # Graduates | % Graduates |
| Computers & Mathematics | 9 | 3.2% |
| Bio, Nature & Agricultural | 0 | 0.0% |
| Physical & Health Sciences | 11 | 3.9% |
| Psychology | 10 | 3.5% |
| Social Sciences | 7 | 2.5% |
| Engineering | 34 | 12.1% |
| Multidisciplinary Studies | 0 | 0.0% |
| Science & Technology | 56 | 19.9% |
| Business | 46 | 16.3% |
| Education | 47 | 16.7% |
| Literature & Languages | 10 | 3.5% |
| Liberal Arts & History | 10 | 3.5% |
| Visual & Performing Arts | 0 | 0.0% |
| Communications | 10 | 3.5% |
| Arts & Humanities | 32 | 11.4% |
| Total | 282 | 100.0% |
Transportation & Commute in Vassar
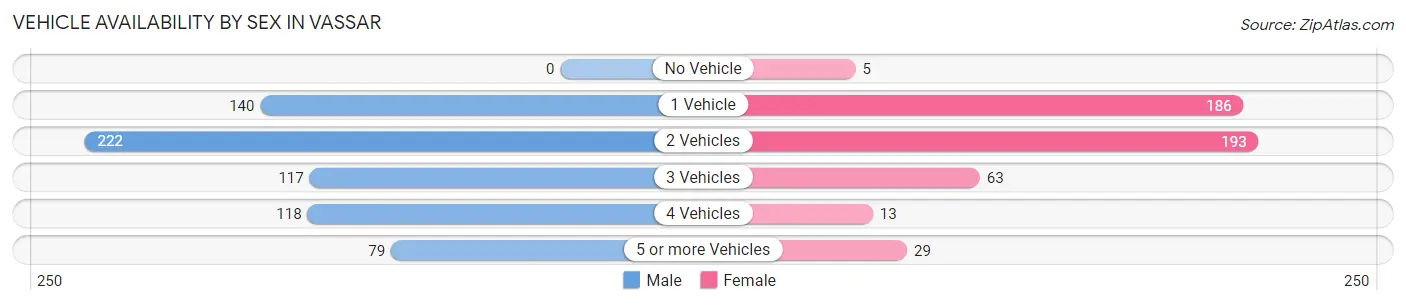
Vehicle Availability by Sex in Vassar
The most prevalent vehicle ownership categories in Vassar are males with 2 vehicles (222, accounting for 32.8%) and females with 2 vehicles (193, making up 45.4%).
| Vehicles Available | Male | Female |
| No Vehicle | 0 (0.0%) | 5 (1.0%) |
| 1 Vehicle | 140 (20.7%) | 186 (38.0%) |
| 2 Vehicles | 222 (32.8%) | 193 (39.5%) |
| 3 Vehicles | 117 (17.3%) | 63 (12.9%) |
| 4 Vehicles | 118 (17.5%) | 13 (2.7%) |
| 5 or more Vehicles | 79 (11.7%) | 29 (5.9%) |
| Total | 676 (100.0%) | 489 (100.0%) |
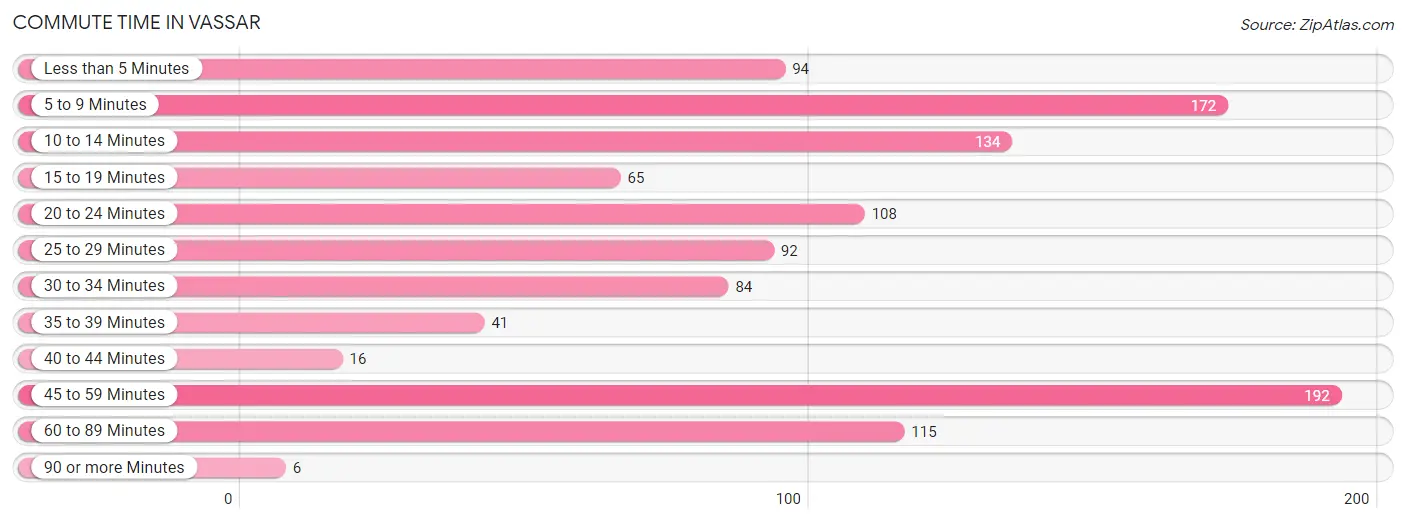
Commute Time in Vassar
The most frequently occuring commute durations in Vassar are 45 to 59 minutes (192 commuters, 17.2%), 5 to 9 minutes (172 commuters, 15.4%), and 10 to 14 minutes (134 commuters, 12.0%).
| Commute Time | # Commuters | % Commuters |
| Less than 5 Minutes | 94 | 8.4% |
| 5 to 9 Minutes | 172 | 15.4% |
| 10 to 14 Minutes | 134 | 12.0% |
| 15 to 19 Minutes | 65 | 5.8% |
| 20 to 24 Minutes | 108 | 9.7% |
| 25 to 29 Minutes | 92 | 8.2% |
| 30 to 34 Minutes | 84 | 7.5% |
| 35 to 39 Minutes | 41 | 3.7% |
| 40 to 44 Minutes | 16 | 1.4% |
| 45 to 59 Minutes | 192 | 17.2% |
| 60 to 89 Minutes | 115 | 10.3% |
| 90 or more Minutes | 6 | 0.5% |
Commute Time by Sex in Vassar
The most common commute times in Vassar are 45 to 59 minutes (116 commuters, 17.7%) for males and 5 to 9 minutes (80 commuters, 17.2%) for females.
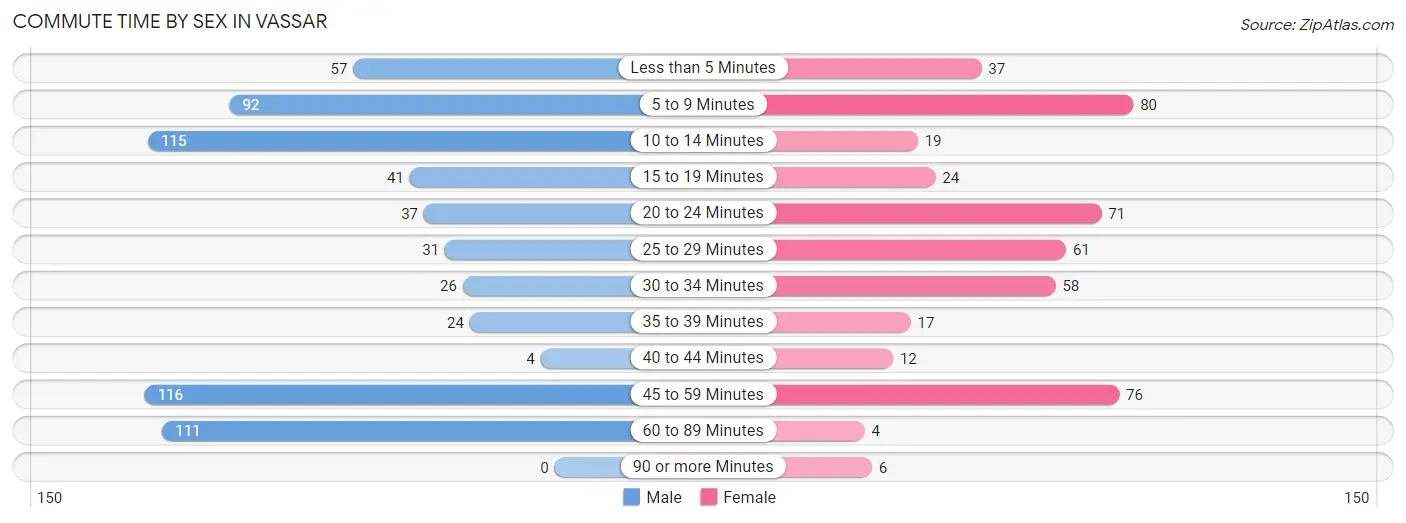
| Commute Time | Male | Female |
| Less than 5 Minutes | 57 (8.7%) | 37 (8.0%) |
| 5 to 9 Minutes | 92 (14.1%) | 80 (17.2%) |
| 10 to 14 Minutes | 115 (17.6%) | 19 (4.1%) |
| 15 to 19 Minutes | 41 (6.3%) | 24 (5.2%) |
| 20 to 24 Minutes | 37 (5.7%) | 71 (15.3%) |
| 25 to 29 Minutes | 31 (4.7%) | 61 (13.1%) |
| 30 to 34 Minutes | 26 (4.0%) | 58 (12.5%) |
| 35 to 39 Minutes | 24 (3.7%) | 17 (3.7%) |
| 40 to 44 Minutes | 4 (0.6%) | 12 (2.6%) |
| 45 to 59 Minutes | 116 (17.7%) | 76 (16.3%) |
| 60 to 89 Minutes | 111 (17.0%) | 4 (0.9%) |
| 90 or more Minutes | 0 (0.0%) | 6 (1.3%) |
Time of Departure to Work by Sex in Vassar
The most frequent times of departure to work in Vassar are 6:30 AM to 6:59 AM (231, 35.3%) for males and 12:00 PM to 3:59 PM (60, 12.9%) for females.
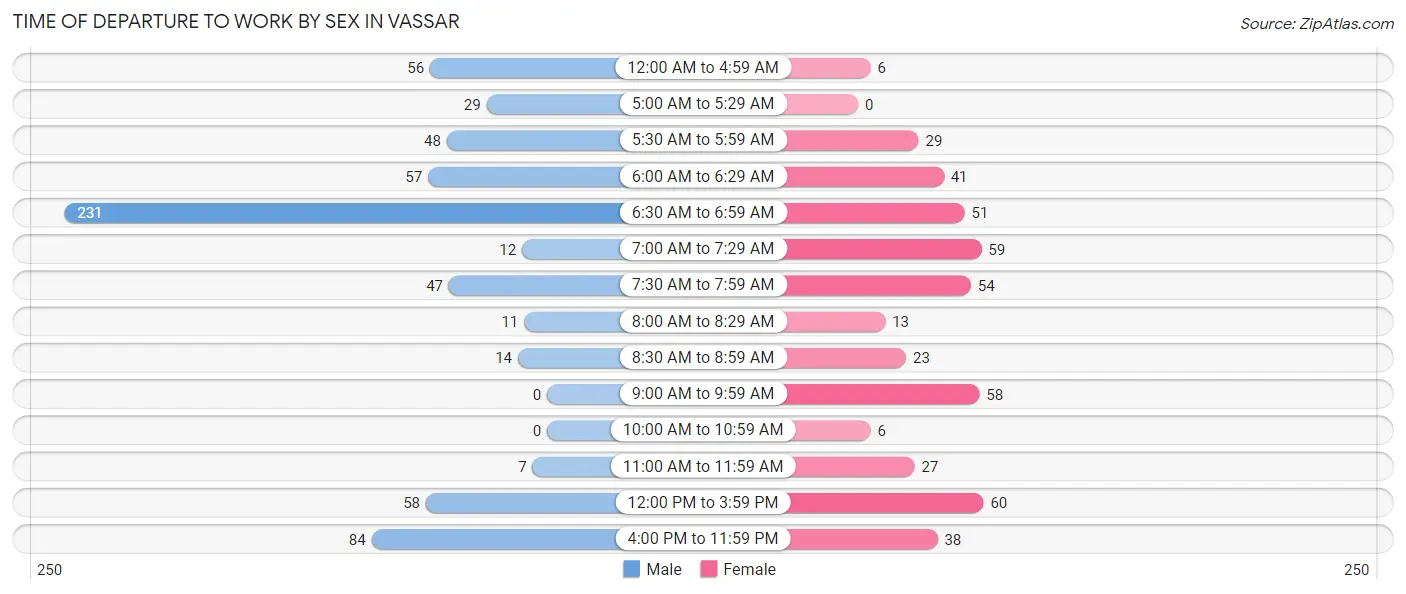
| Time of Departure | Male | Female |
| 12:00 AM to 4:59 AM | 56 (8.6%) | 6 (1.3%) |
| 5:00 AM to 5:29 AM | 29 (4.4%) | 0 (0.0%) |
| 5:30 AM to 5:59 AM | 48 (7.3%) | 29 (6.2%) |
| 6:00 AM to 6:29 AM | 57 (8.7%) | 41 (8.8%) |
| 6:30 AM to 6:59 AM | 231 (35.3%) | 51 (11.0%) |
| 7:00 AM to 7:29 AM | 12 (1.8%) | 59 (12.7%) |
| 7:30 AM to 7:59 AM | 47 (7.2%) | 54 (11.6%) |
| 8:00 AM to 8:29 AM | 11 (1.7%) | 13 (2.8%) |
| 8:30 AM to 8:59 AM | 14 (2.1%) | 23 (5.0%) |
| 9:00 AM to 9:59 AM | 0 (0.0%) | 58 (12.5%) |
| 10:00 AM to 10:59 AM | 0 (0.0%) | 6 (1.3%) |
| 11:00 AM to 11:59 AM | 7 (1.1%) | 27 (5.8%) |
| 12:00 PM to 3:59 PM | 58 (8.9%) | 60 (12.9%) |
| 4:00 PM to 11:59 PM | 84 (12.8%) | 38 (8.2%) |
| Total | 654 (100.0%) | 465 (100.0%) |
Housing Occupancy in Vassar
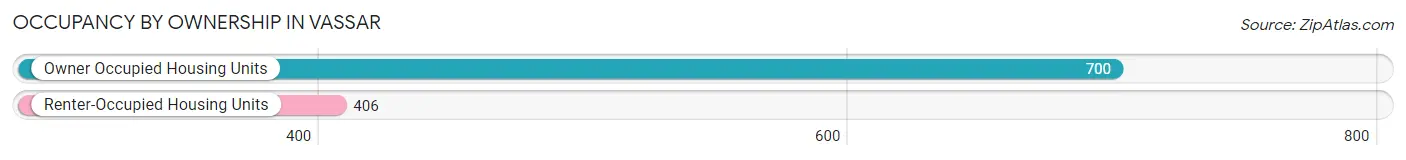
Occupancy by Ownership in Vassar
Of the total 1,106 dwellings in Vassar, owner-occupied units account for 700 (63.3%), while renter-occupied units make up 406 (36.7%).
| Occupancy | # Housing Units | % Housing Units |
| Owner Occupied Housing Units | 700 | 63.3% |
| Renter-Occupied Housing Units | 406 | 36.7% |
| Total Occupied Housing Units | 1,106 | 100.0% |
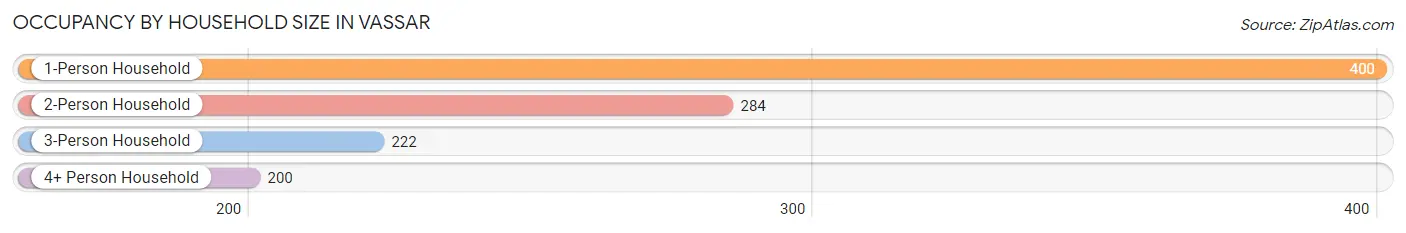
Occupancy by Household Size in Vassar
| Household Size | # Housing Units | % Housing Units |
| 1-Person Household | 400 | 36.2% |
| 2-Person Household | 284 | 25.7% |
| 3-Person Household | 222 | 20.1% |
| 4+ Person Household | 200 | 18.1% |
| Total Housing Units | 1,106 | 100.0% |
Occupancy by Ownership by Household Size in Vassar
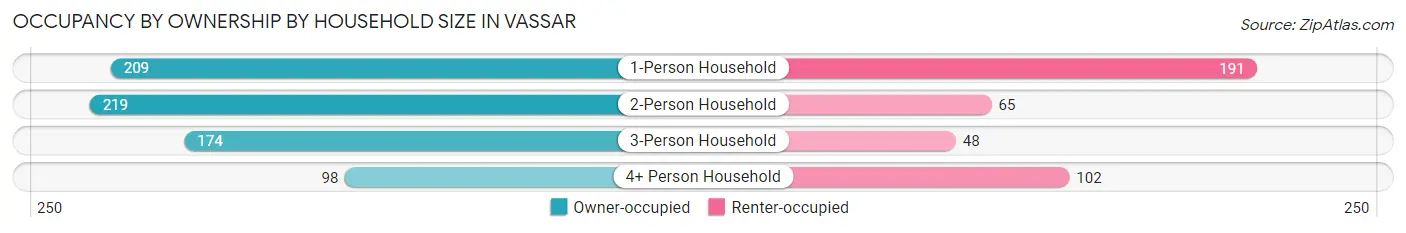
| Household Size | Owner-occupied | Renter-occupied |
| 1-Person Household | 209 (52.2%) | 191 (47.7%) |
| 2-Person Household | 219 (77.1%) | 65 (22.9%) |
| 3-Person Household | 174 (78.4%) | 48 (21.6%) |
| 4+ Person Household | 98 (49.0%) | 102 (51.0%) |
| Total Housing Units | 700 (63.3%) | 406 (36.7%) |
Occupancy by Educational Attainment in Vassar
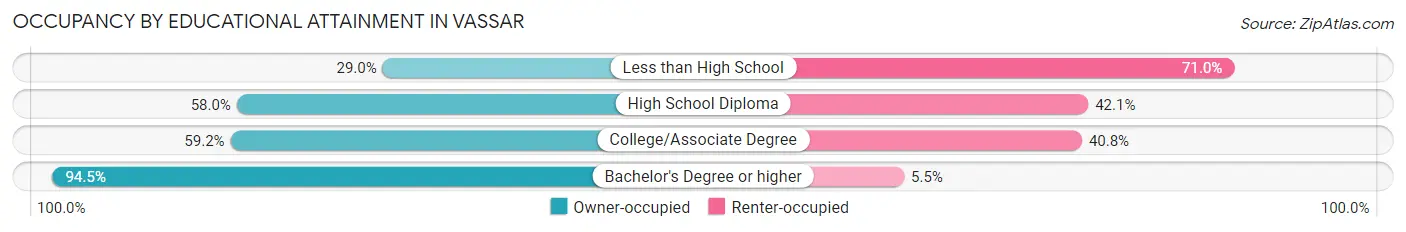
| Household Size | Owner-occupied | Renter-occupied |
| Less than High School | 18 (29.0%) | 44 (71.0%) |
| High School Diploma | 288 (58.0%) | 209 (42.0%) |
| College/Associate Degree | 206 (59.2%) | 142 (40.8%) |
| Bachelor's Degree or higher | 188 (94.5%) | 11 (5.5%) |
Occupancy by Age of Householder in Vassar
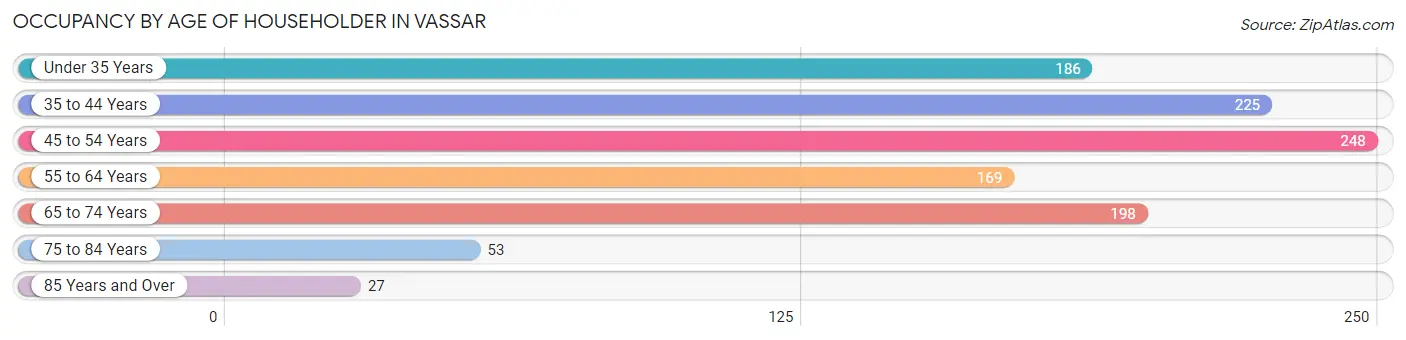
| Age Bracket | # Households | % Households |
| Under 35 Years | 186 | 16.8% |
| 35 to 44 Years | 225 | 20.3% |
| 45 to 54 Years | 248 | 22.4% |
| 55 to 64 Years | 169 | 15.3% |
| 65 to 74 Years | 198 | 17.9% |
| 75 to 84 Years | 53 | 4.8% |
| 85 Years and Over | 27 | 2.4% |
| Total | 1,106 | 100.0% |
Housing Finances in Vassar
Median Income by Occupancy in Vassar
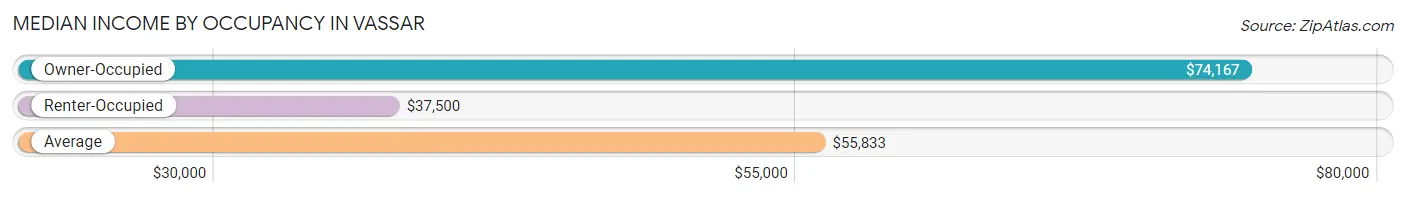
| Occupancy Type | # Households | Median Income |
| Owner-Occupied | 700 (63.3%) | $74,167 |
| Renter-Occupied | 406 (36.7%) | $37,500 |
| Average | 1,106 (100.0%) | $55,833 |
Occupancy by Householder Income Bracket in Vassar
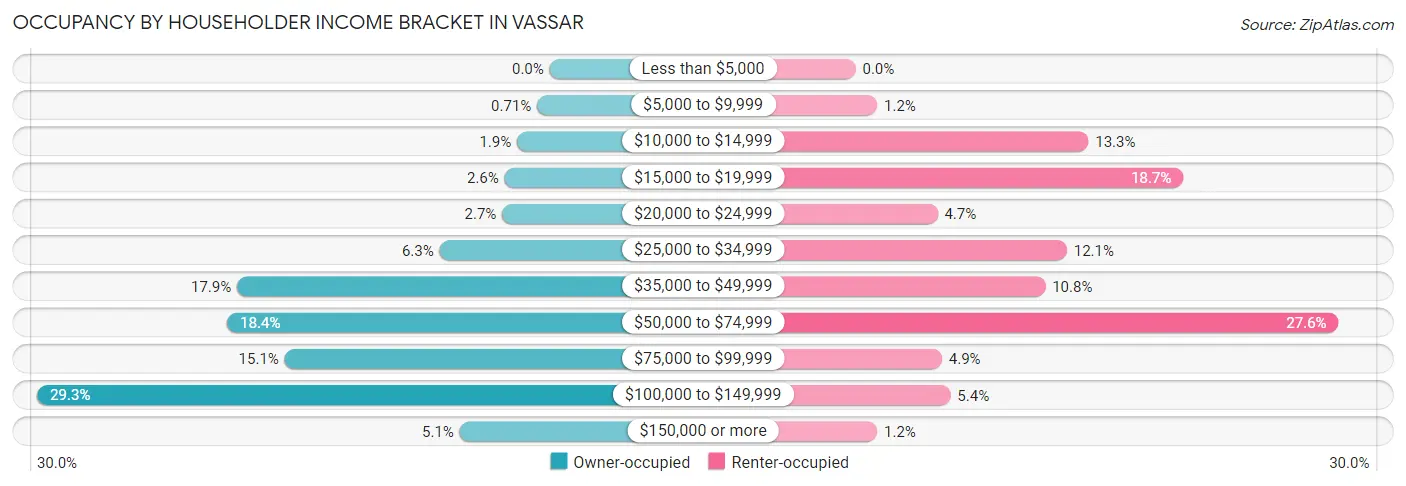
| Income Bracket | Owner-occupied | Renter-occupied |
| Less than $5,000 | 0 (0.0%) | 0 (0.0%) |
| $5,000 to $9,999 | 5 (0.7%) | 5 (1.2%) |
| $10,000 to $14,999 | 13 (1.9%) | 54 (13.3%) |
| $15,000 to $19,999 | 18 (2.6%) | 76 (18.7%) |
| $20,000 to $24,999 | 19 (2.7%) | 19 (4.7%) |
| $25,000 to $34,999 | 44 (6.3%) | 49 (12.1%) |
| $35,000 to $49,999 | 125 (17.9%) | 44 (10.8%) |
| $50,000 to $74,999 | 129 (18.4%) | 112 (27.6%) |
| $75,000 to $99,999 | 106 (15.1%) | 20 (4.9%) |
| $100,000 to $149,999 | 205 (29.3%) | 22 (5.4%) |
| $150,000 or more | 36 (5.1%) | 5 (1.2%) |
| Total | 700 (100.0%) | 406 (100.0%) |
Monthly Housing Cost Tiers in Vassar
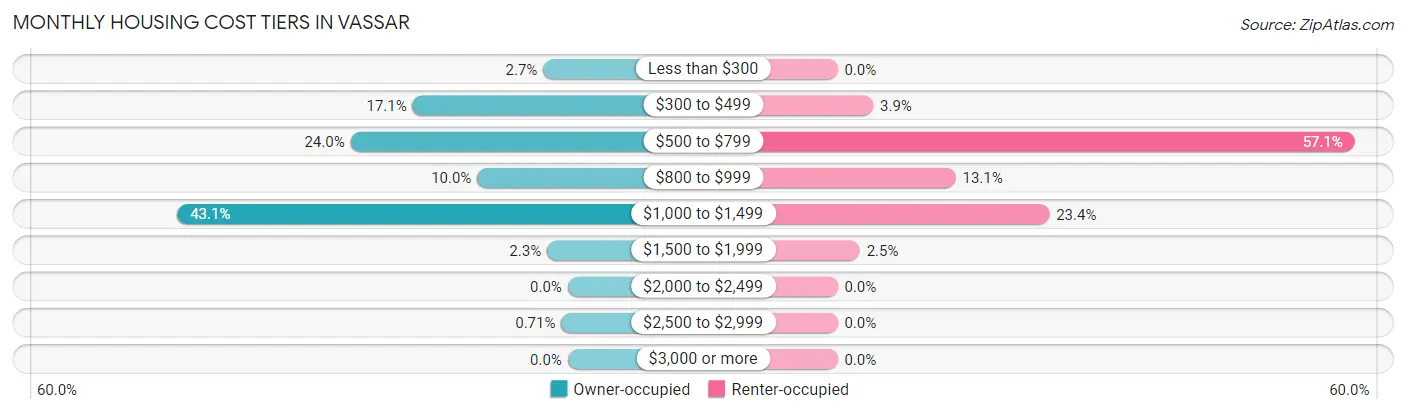
| Monthly Cost | Owner-occupied | Renter-occupied |
| Less than $300 | 19 (2.7%) | 0 (0.0%) |
| $300 to $499 | 120 (17.1%) | 16 (3.9%) |
| $500 to $799 | 168 (24.0%) | 232 (57.1%) |
| $800 to $999 | 70 (10.0%) | 53 (13.1%) |
| $1,000 to $1,499 | 302 (43.1%) | 95 (23.4%) |
| $1,500 to $1,999 | 16 (2.3%) | 10 (2.5%) |
| $2,000 to $2,499 | 0 (0.0%) | 0 (0.0%) |
| $2,500 to $2,999 | 5 (0.7%) | 0 (0.0%) |
| $3,000 or more | 0 (0.0%) | 0 (0.0%) |
| Total | 700 (100.0%) | 406 (100.0%) |
Physical Housing Characteristics in Vassar
Housing Structures in Vassar
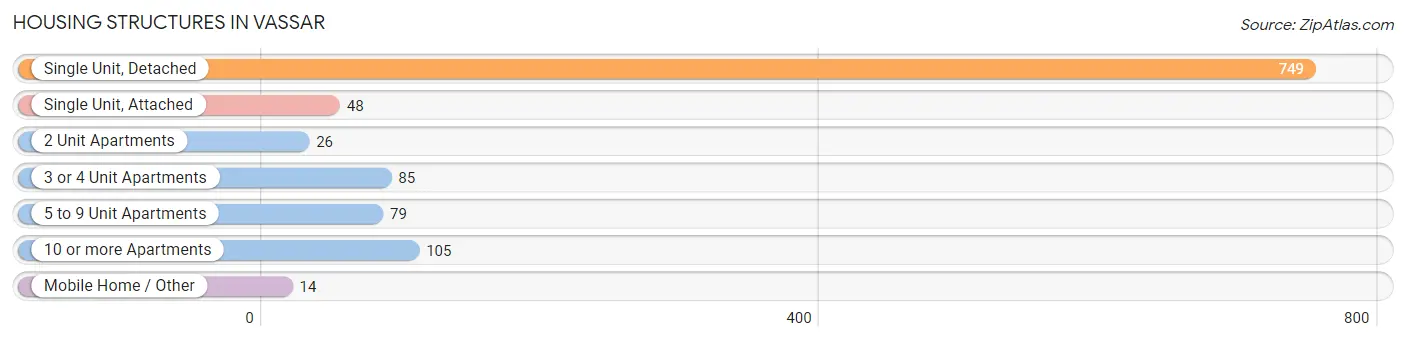
| Structure Type | # Housing Units | % Housing Units |
| Single Unit, Detached | 749 | 67.7% |
| Single Unit, Attached | 48 | 4.3% |
| 2 Unit Apartments | 26 | 2.4% |
| 3 or 4 Unit Apartments | 85 | 7.7% |
| 5 to 9 Unit Apartments | 79 | 7.1% |
| 10 or more Apartments | 105 | 9.5% |
| Mobile Home / Other | 14 | 1.3% |
| Total | 1,106 | 100.0% |
Housing Structures by Occupancy in Vassar
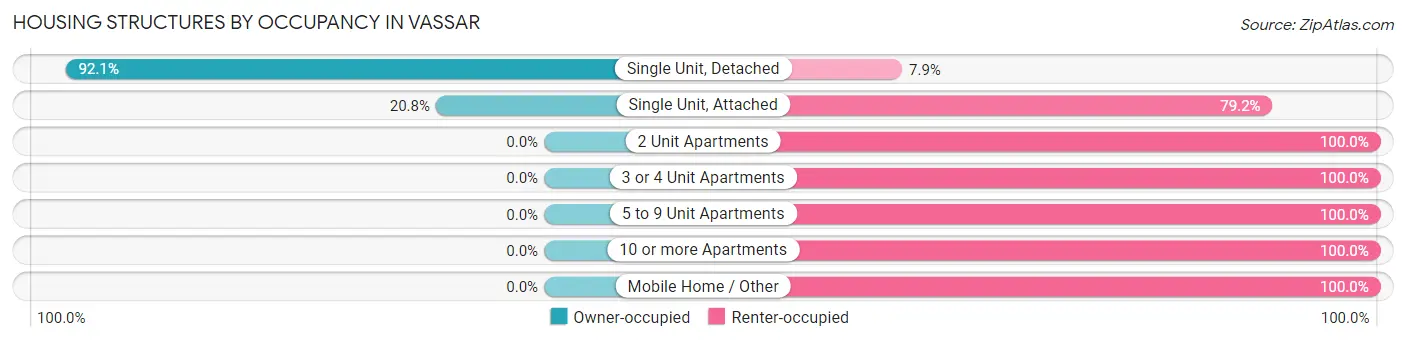
| Structure Type | Owner-occupied | Renter-occupied |
| Single Unit, Detached | 690 (92.1%) | 59 (7.9%) |
| Single Unit, Attached | 10 (20.8%) | 38 (79.2%) |
| 2 Unit Apartments | 0 (0.0%) | 26 (100.0%) |
| 3 or 4 Unit Apartments | 0 (0.0%) | 85 (100.0%) |
| 5 to 9 Unit Apartments | 0 (0.0%) | 79 (100.0%) |
| 10 or more Apartments | 0 (0.0%) | 105 (100.0%) |
| Mobile Home / Other | 0 (0.0%) | 14 (100.0%) |
| Total | 700 (63.3%) | 406 (36.7%) |
Housing Structures by Number of Rooms in Vassar
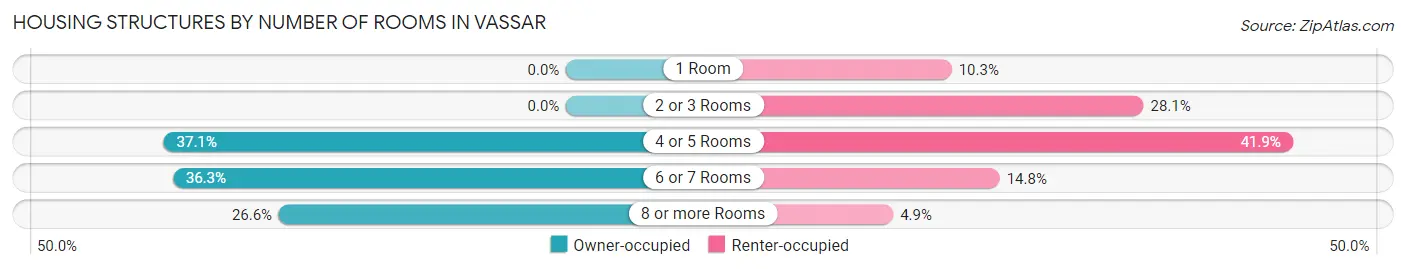
| Number of Rooms | Owner-occupied | Renter-occupied |
| 1 Room | 0 (0.0%) | 42 (10.3%) |
| 2 or 3 Rooms | 0 (0.0%) | 114 (28.1%) |
| 4 or 5 Rooms | 260 (37.1%) | 170 (41.9%) |
| 6 or 7 Rooms | 254 (36.3%) | 60 (14.8%) |
| 8 or more Rooms | 186 (26.6%) | 20 (4.9%) |
| Total | 700 (100.0%) | 406 (100.0%) |
Housing Structure by Heating Type in Vassar
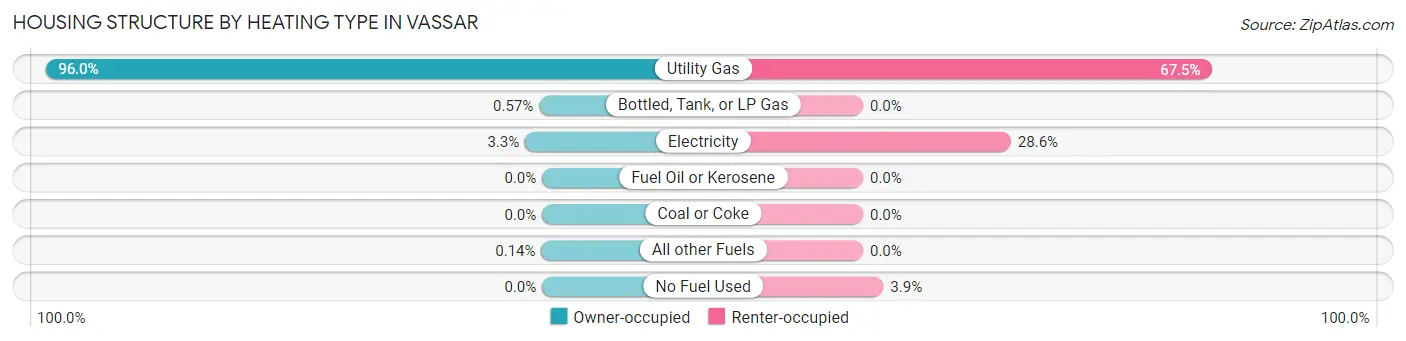
| Heating Type | Owner-occupied | Renter-occupied |
| Utility Gas | 672 (96.0%) | 274 (67.5%) |
| Bottled, Tank, or LP Gas | 4 (0.6%) | 0 (0.0%) |
| Electricity | 23 (3.3%) | 116 (28.6%) |
| Fuel Oil or Kerosene | 0 (0.0%) | 0 (0.0%) |
| Coal or Coke | 0 (0.0%) | 0 (0.0%) |
| All other Fuels | 1 (0.1%) | 0 (0.0%) |
| No Fuel Used | 0 (0.0%) | 16 (3.9%) |
| Total | 700 (100.0%) | 406 (100.0%) |
Household Vehicle Usage in Vassar
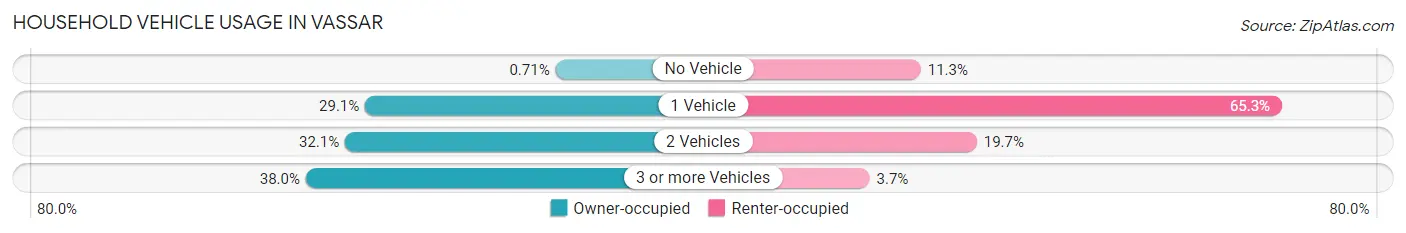
| Vehicles per Household | Owner-occupied | Renter-occupied |
| No Vehicle | 5 (0.7%) | 46 (11.3%) |
| 1 Vehicle | 204 (29.1%) | 265 (65.3%) |
| 2 Vehicles | 225 (32.1%) | 80 (19.7%) |
| 3 or more Vehicles | 266 (38.0%) | 15 (3.7%) |
| Total | 700 (100.0%) | 406 (100.0%) |
Real Estate & Mortgages in Vassar
Real Estate and Mortgage Overview in Vassar
| Characteristic | Without Mortgage | With Mortgage |
| Housing Units | 253 | 447 |
| Median Property Value | $94,000 | $132,200 |
| Median Household Income | $52,813 | $18 |
| Monthly Housing Costs | $465 | $0 |
| Real Estate Taxes | $1,766 | $5 |
Property Value by Mortgage Status in Vassar
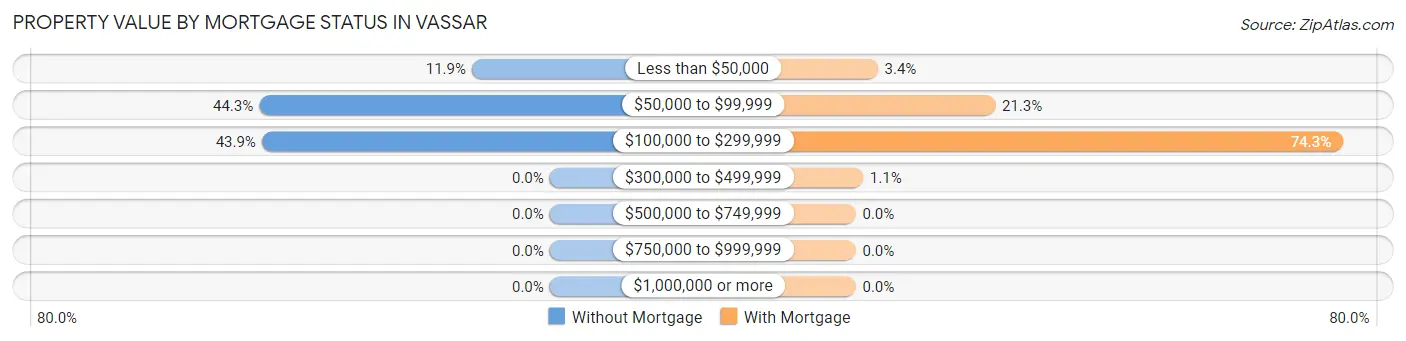
| Property Value | Without Mortgage | With Mortgage |
| Less than $50,000 | 30 (11.9%) | 15 (3.4%) |
| $50,000 to $99,999 | 112 (44.3%) | 95 (21.2%) |
| $100,000 to $299,999 | 111 (43.9%) | 332 (74.3%) |
| $300,000 to $499,999 | 0 (0.0%) | 5 (1.1%) |
| $500,000 to $749,999 | 0 (0.0%) | 0 (0.0%) |
| $750,000 to $999,999 | 0 (0.0%) | 0 (0.0%) |
| $1,000,000 or more | 0 (0.0%) | 0 (0.0%) |
| Total | 253 (100.0%) | 447 (100.0%) |
Household Income by Mortgage Status in Vassar
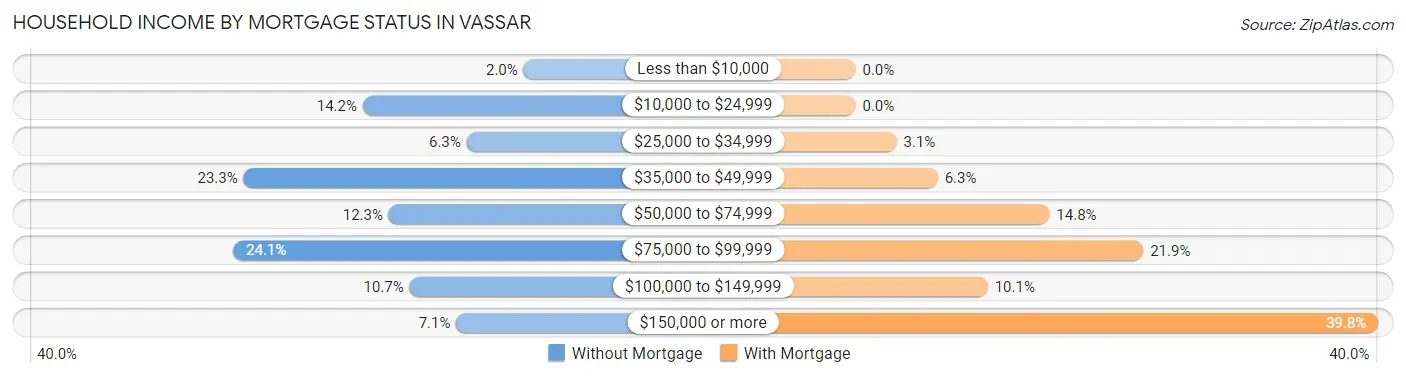
| Household Income | Without Mortgage | With Mortgage |
| Less than $10,000 | 5 (2.0%) | 0 (0.0%) |
| $10,000 to $24,999 | 36 (14.2%) | 0 (0.0%) |
| $25,000 to $34,999 | 16 (6.3%) | 14 (3.1%) |
| $35,000 to $49,999 | 59 (23.3%) | 28 (6.3%) |
| $50,000 to $74,999 | 31 (12.2%) | 66 (14.8%) |
| $75,000 to $99,999 | 61 (24.1%) | 98 (21.9%) |
| $100,000 to $149,999 | 27 (10.7%) | 45 (10.1%) |
| $150,000 or more | 18 (7.1%) | 178 (39.8%) |
| Total | 253 (100.0%) | 447 (100.0%) |
Property Value to Household Income Ratio in Vassar
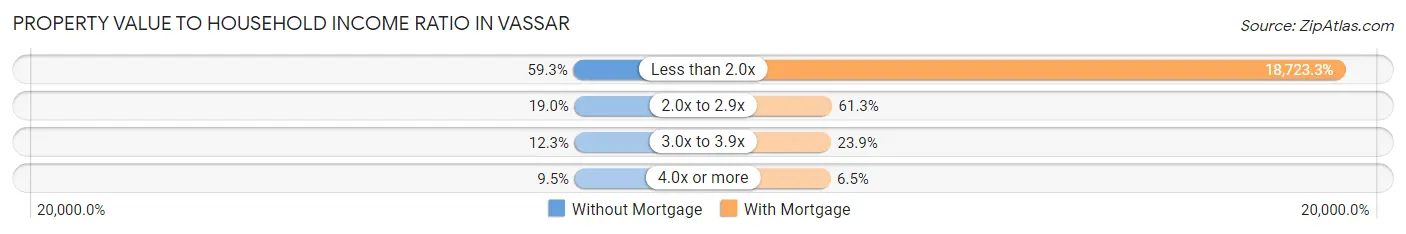
| Value-to-Income Ratio | Without Mortgage | With Mortgage |
| Less than 2.0x | 150 (59.3%) | 83,693 (18,723.3%) |
| 2.0x to 2.9x | 48 (19.0%) | 274 (61.3%) |
| 3.0x to 3.9x | 31 (12.2%) | 107 (23.9%) |
| 4.0x or more | 24 (9.5%) | 29 (6.5%) |
| Total | 253 (100.0%) | 447 (100.0%) |
Real Estate Taxes by Mortgage Status in Vassar
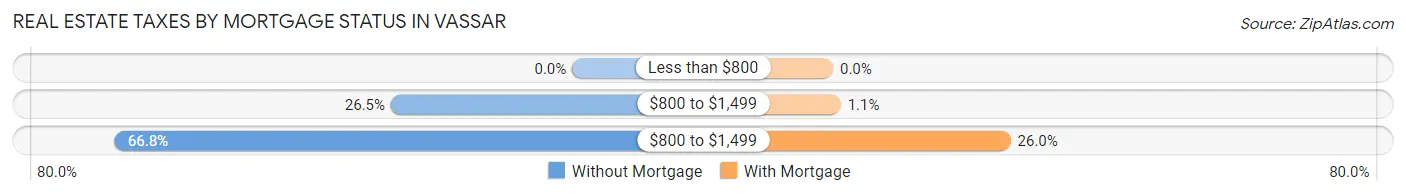
| Property Taxes | Without Mortgage | With Mortgage |
| Less than $800 | 0 (0.0%) | 0 (0.0%) |
| $800 to $1,499 | 67 (26.5%) | 5 (1.1%) |
| $800 to $1,499 | 169 (66.8%) | 116 (26.0%) |
| Total | 253 (100.0%) | 447 (100.0%) |
Health & Disability in Vassar
Health Insurance Coverage by Age in Vassar
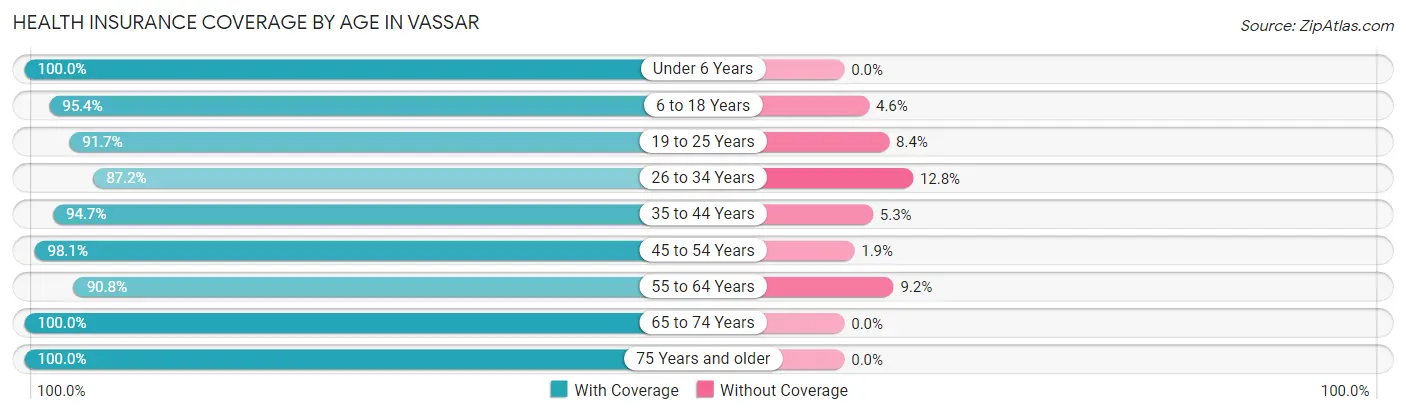
| Age Bracket | With Coverage | Without Coverage |
| Under 6 Years | 156 (100.0%) | 0 (0.0%) |
| 6 to 18 Years | 331 (95.4%) | 16 (4.6%) |
| 19 to 25 Years | 362 (91.6%) | 33 (8.4%) |
| 26 to 34 Years | 184 (87.2%) | 27 (12.8%) |
| 35 to 44 Years | 356 (94.7%) | 20 (5.3%) |
| 45 to 54 Years | 421 (98.1%) | 8 (1.9%) |
| 55 to 64 Years | 218 (90.8%) | 22 (9.2%) |
| 65 to 74 Years | 265 (100.0%) | 0 (0.0%) |
| 75 Years and older | 115 (100.0%) | 0 (0.0%) |
| Total | 2,408 (95.0%) | 126 (5.0%) |
Health Insurance Coverage by Citizenship Status in Vassar
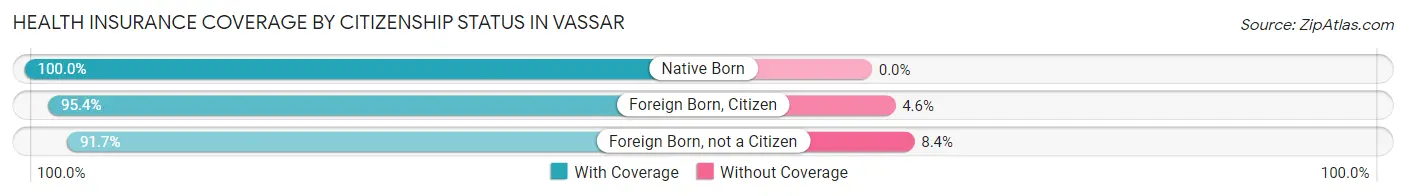
| Citizenship Status | With Coverage | Without Coverage |
| Native Born | 156 (100.0%) | 0 (0.0%) |
| Foreign Born, Citizen | 331 (95.4%) | 16 (4.6%) |
| Foreign Born, not a Citizen | 362 (91.6%) | 33 (8.4%) |
Health Insurance Coverage by Household Income in Vassar
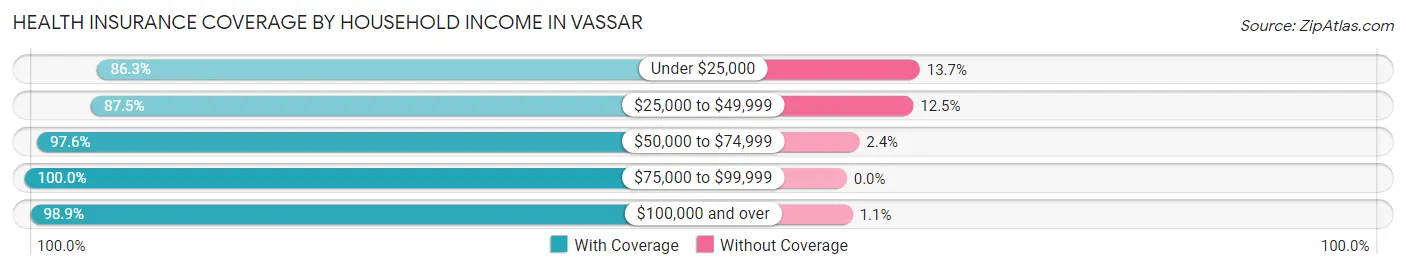
| Household Income | With Coverage | Without Coverage |
| Under $25,000 | 284 (86.3%) | 45 (13.7%) |
| $25,000 to $49,999 | 407 (87.5%) | 58 (12.5%) |
| $50,000 to $74,999 | 580 (97.6%) | 14 (2.4%) |
| $75,000 to $99,999 | 332 (100.0%) | 0 (0.0%) |
| $100,000 and over | 801 (98.9%) | 9 (1.1%) |
Public vs Private Health Insurance Coverage by Age in Vassar
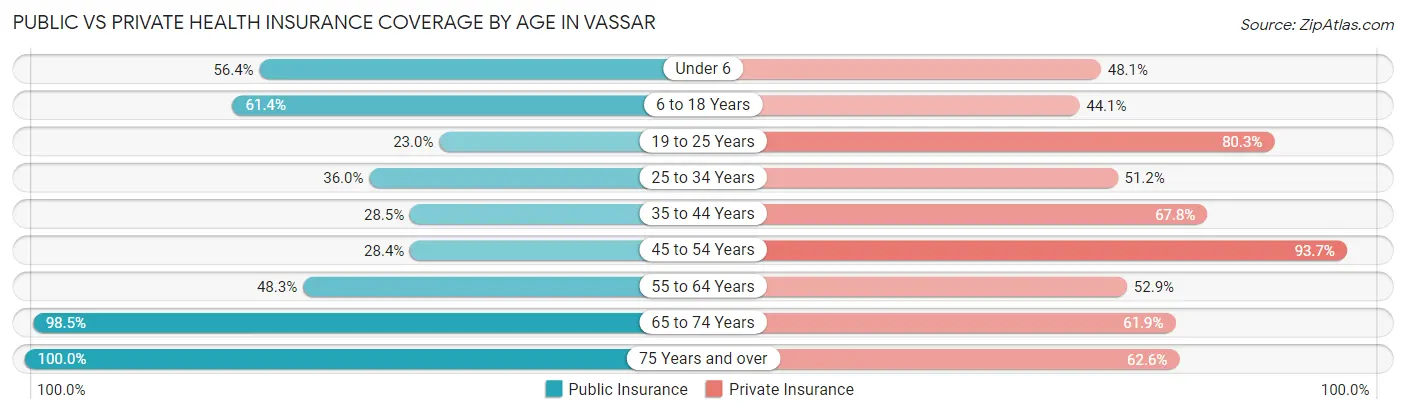
| Age Bracket | Public Insurance | Private Insurance |
| Under 6 | 88 (56.4%) | 75 (48.1%) |
| 6 to 18 Years | 213 (61.4%) | 153 (44.1%) |
| 19 to 25 Years | 91 (23.0%) | 317 (80.2%) |
| 25 to 34 Years | 76 (36.0%) | 108 (51.2%) |
| 35 to 44 Years | 107 (28.5%) | 255 (67.8%) |
| 45 to 54 Years | 122 (28.4%) | 402 (93.7%) |
| 55 to 64 Years | 116 (48.3%) | 127 (52.9%) |
| 65 to 74 Years | 261 (98.5%) | 164 (61.9%) |
| 75 Years and over | 115 (100.0%) | 72 (62.6%) |
| Total | 1,189 (46.9%) | 1,673 (66.0%) |
Disability Status by Sex by Age in Vassar
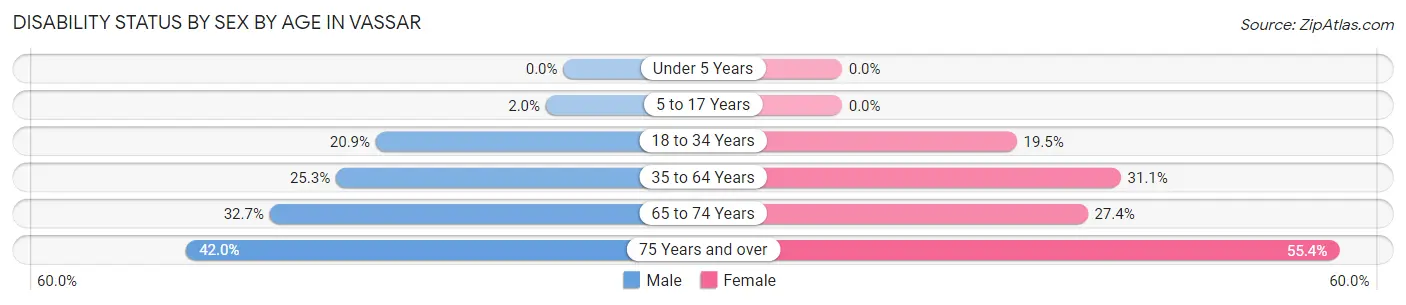
| Age Bracket | Male | Female |
| Under 5 Years | 0 (0.0%) | 0 (0.0%) |
| 5 to 17 Years | 4 (1.9%) | 0 (0.0%) |
| 18 to 34 Years | 76 (20.9%) | 50 (19.5%) |
| 35 to 64 Years | 139 (25.3%) | 154 (31.0%) |
| 65 to 74 Years | 52 (32.7%) | 29 (27.4%) |
| 75 Years and over | 21 (42.0%) | 36 (55.4%) |
Disability Class by Sex by Age in Vassar
Disability Class: Hearing Difficulty
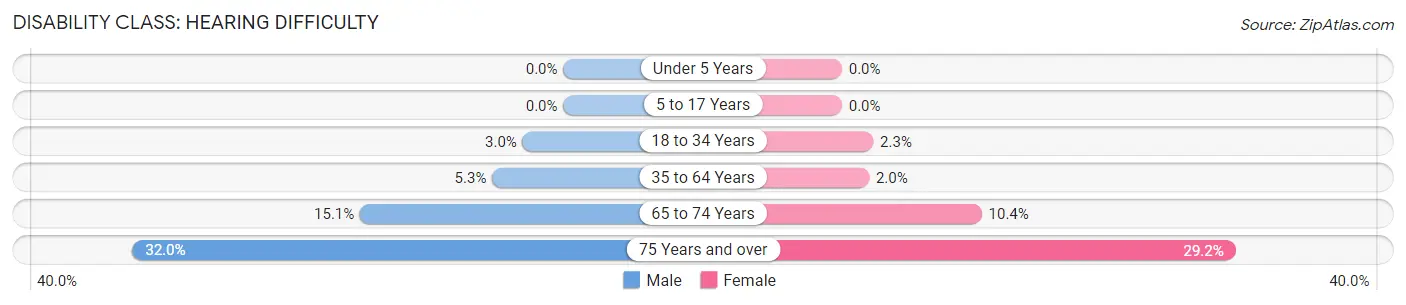
| Age Bracket | Male | Female |
| Under 5 Years | 0 (0.0%) | 0 (0.0%) |
| 5 to 17 Years | 0 (0.0%) | 0 (0.0%) |
| 18 to 34 Years | 11 (3.0%) | 6 (2.3%) |
| 35 to 64 Years | 29 (5.3%) | 10 (2.0%) |
| 65 to 74 Years | 24 (15.1%) | 11 (10.4%) |
| 75 Years and over | 16 (32.0%) | 19 (29.2%) |
Disability Class: Vision Difficulty
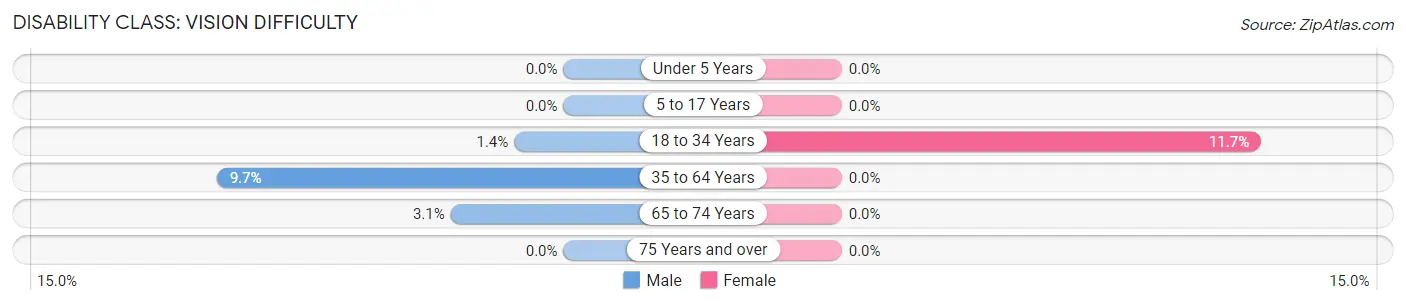
| Age Bracket | Male | Female |
| Under 5 Years | 0 (0.0%) | 0 (0.0%) |
| 5 to 17 Years | 0 (0.0%) | 0 (0.0%) |
| 18 to 34 Years | 5 (1.4%) | 30 (11.7%) |
| 35 to 64 Years | 53 (9.7%) | 0 (0.0%) |
| 65 to 74 Years | 5 (3.1%) | 0 (0.0%) |
| 75 Years and over | 0 (0.0%) | 0 (0.0%) |
Disability Class: Cognitive Difficulty
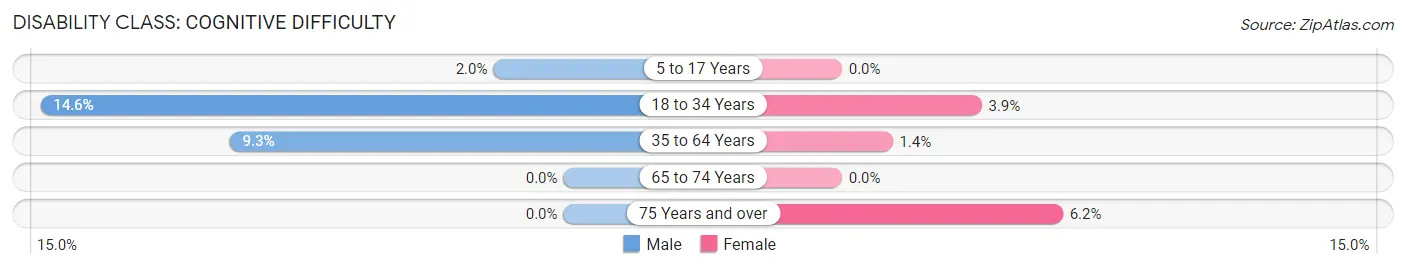
| Age Bracket | Male | Female |
| 5 to 17 Years | 4 (1.9%) | 0 (0.0%) |
| 18 to 34 Years | 53 (14.6%) | 10 (3.9%) |
| 35 to 64 Years | 51 (9.3%) | 7 (1.4%) |
| 65 to 74 Years | 0 (0.0%) | 0 (0.0%) |
| 75 Years and over | 0 (0.0%) | 4 (6.1%) |
Disability Class: Ambulatory Difficulty
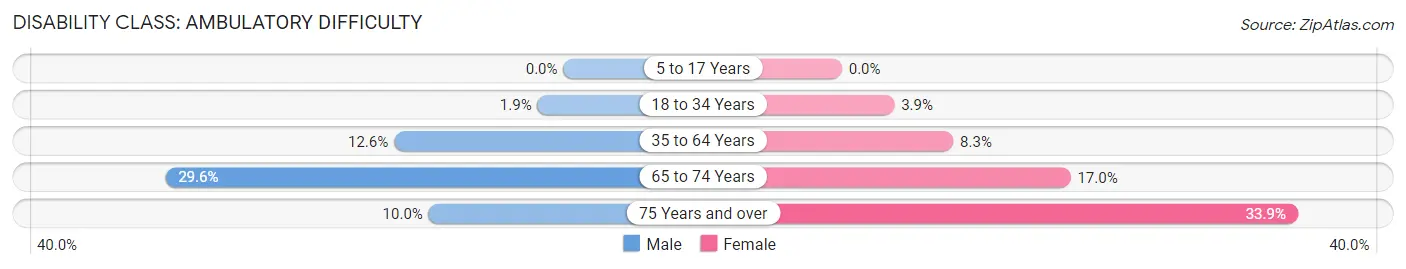
| Age Bracket | Male | Female |
| 5 to 17 Years | 0 (0.0%) | 0 (0.0%) |
| 18 to 34 Years | 7 (1.9%) | 10 (3.9%) |
| 35 to 64 Years | 69 (12.6%) | 41 (8.3%) |
| 65 to 74 Years | 47 (29.6%) | 18 (17.0%) |
| 75 Years and over | 5 (10.0%) | 22 (33.9%) |
Disability Class: Self-Care Difficulty
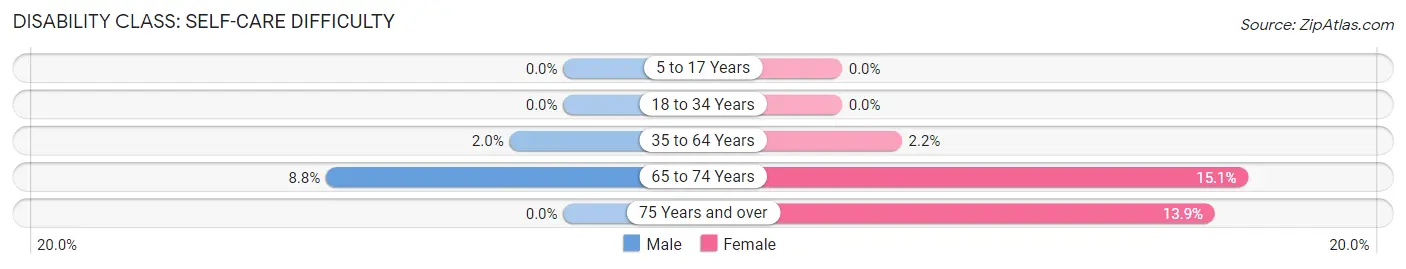
| Age Bracket | Male | Female |
| 5 to 17 Years | 0 (0.0%) | 0 (0.0%) |
| 18 to 34 Years | 0 (0.0%) | 0 (0.0%) |
| 35 to 64 Years | 11 (2.0%) | 11 (2.2%) |
| 65 to 74 Years | 14 (8.8%) | 16 (15.1%) |
| 75 Years and over | 0 (0.0%) | 9 (13.9%) |
Technology Access in Vassar
Computing Device Access in Vassar
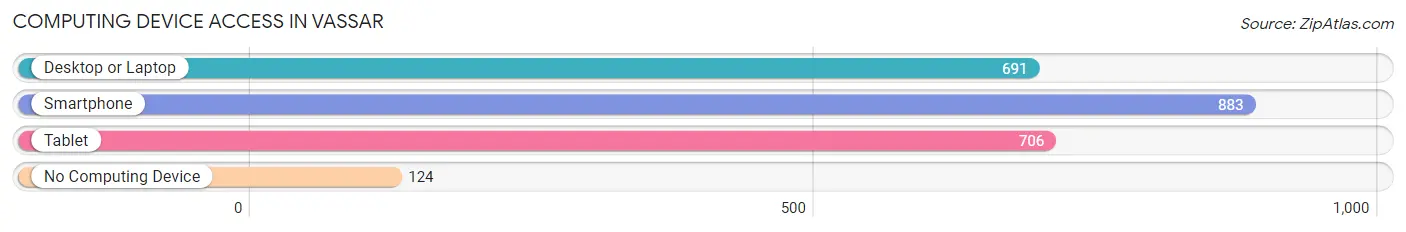
| Device Type | # Households | % Households |
| Desktop or Laptop | 691 | 62.5% |
| Smartphone | 883 | 79.8% |
| Tablet | 706 | 63.8% |
| No Computing Device | 124 | 11.2% |
| Total | 1,106 | 100.0% |
Internet Access in Vassar
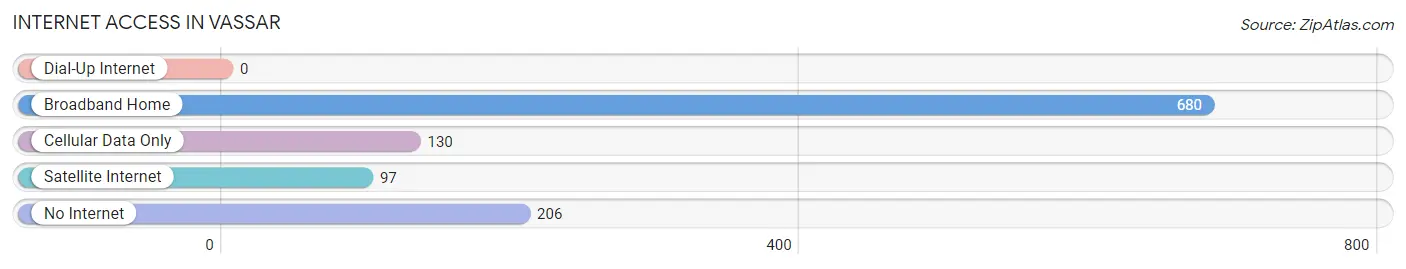
| Internet Type | # Households | % Households |
| Dial-Up Internet | 0 | 0.0% |
| Broadband Home | 680 | 61.5% |
| Cellular Data Only | 130 | 11.7% |
| Satellite Internet | 97 | 8.8% |
| No Internet | 206 | 18.6% |
| Total | 1,106 | 100.0% |
Vassar Summary
Vassar, Michigan is a small city located in Tuscola County in the state of Michigan. It is situated on the Cass River, approximately 40 miles northeast of Saginaw. The city has a population of approximately 3,500 people and is part of the Saginaw-Bay City-Midland metropolitan area.
History
Vassar was founded in 1854 by a group of settlers from New York. The city was named after Matthew Vassar, the founder of Vassar College in Poughkeepsie, New York. The settlers were attracted to the area by the abundance of timber and the potential for farming. The first post office was established in 1856 and the city was incorporated in 1871.
In the late 19th century, Vassar was a thriving lumber town. The city was home to several sawmills and a large number of lumberjacks. The lumber industry was the main source of employment for the city’s residents.
In the early 20th century, the lumber industry began to decline and the city’s economy shifted to agriculture. The city’s population grew steadily throughout the 20th century and by the year 2000, the population had reached 3,500.
Geography
Vassar is located in the Saginaw Valley region of Michigan. The city is situated on the Cass River, approximately 40 miles northeast of Saginaw. The city is surrounded by farmland and is located near the Huron National Forest.
The climate in Vassar is typical of the Midwest. Summers are warm and humid, while winters are cold and snowy. The average annual temperature is around 50 degrees Fahrenheit.
Economy
The economy of Vassar is largely based on agriculture. The city is home to several farms, which produce a variety of crops, including corn, soybeans, wheat, and hay. The city is also home to several manufacturing companies, which produce a variety of products, including automotive parts, furniture, and medical supplies.
The city is also home to several retail stores, restaurants, and other businesses. The city’s largest employer is the Vassar Public Schools, which employs over 500 people.
Demographics
As of the 2010 census, the population of Vassar was 3,500. The racial makeup of the city was 95.3% White, 1.2% African American, 0.7% Native American, 0.4% Asian, 0.1% Pacific Islander, 0.7% from other races, and 1.8% from two or more races. Hispanic or Latino of any race were 2.2% of the population.
The median household income in Vassar was $41,250, and the median family income was $50,000. The per capita income was $20,845. About 11.2% of families and 14.2% of the population were below the poverty line, including 19.2% of those under age 18 and 8.2% of those age 65 or over.
Vassar is a small city with a rich history and a diverse economy. The city is home to a variety of businesses, including farms, manufacturing companies, and retail stores. The city’s population is largely white, but there is a small minority population. The city’s economy is largely based on agriculture, but there are also a variety of other businesses in the city.
Common Questions
What is Per Capita Income in Vassar?
Per Capita income in Vassar is $27,364.
What is the Median Family Income in Vassar?
Median Family Income in Vassar is $70,625.
What is the Median Household income in Vassar?
Median Household Income in Vassar is $55,833.
What is Income or Wage Gap in Vassar?
Income or Wage Gap in Vassar is 9.7%.
Women in Vassar earn 90.3 cents for every dollar earned by a man.
What is Inequality or Gini Index in Vassar?
Inequality or Gini Index in Vassar is 0.36.
What is the Total Population of Vassar?
Total Population of Vassar is 2,718.
What is the Total Male Population of Vassar?
Total Male Population of Vassar is 1,517.
What is the Total Female Population of Vassar?
Total Female Population of Vassar is 1,201.
What is the Ratio of Males per 100 Females in Vassar?
There are 126.31 Males per 100 Females in Vassar.
What is the Ratio of Females per 100 Males in Vassar?
There are 79.17 Females per 100 Males in Vassar.
What is the Median Population Age in Vassar?
Median Population Age in Vassar is 37.0 Years.
What is the Average Family Size in Vassar
Average Family Size in Vassar is 2.9 People.
What is the Average Household Size in Vassar
Average Household Size in Vassar is 2.3 People.
How Large is the Labor Force in Vassar?
There are 1,345 People in the Labor Forcein in Vassar.
What is the Percentage of People in the Labor Force in Vassar?
60.9% of People are in the Labor Force in Vassar.
What is the Unemployment Rate in Vassar?
Unemployment Rate in Vassar is 12.1%.