New Buffalo, MI Map & Demographics
New Buffalo Map
New Buffalo Overview
$52,528
PER CAPITA INCOME
$113,333
AVG FAMILY INCOME
$61,875
AVG HOUSEHOLD INCOME
54.6%
WAGE / INCOME GAP [ % ]
45.4¢/ $1
WAGE / INCOME GAP [ $ ]
$7,138
FAMILY INCOME DEFICIT
0.53
INEQUALITY / GINI INDEX
1,362
TOTAL POPULATION
634
MALE POPULATION
728
FEMALE POPULATION
87.09
MALES / 100 FEMALES
114.83
FEMALES / 100 MALES
51.1
MEDIAN AGE
2.9
AVG FAMILY SIZE
1.9
AVG HOUSEHOLD SIZE
781
LABOR FORCE [ PEOPLE ]
64.8%
PERCENT IN LABOR FORCE
1.3%
UNEMPLOYMENT RATE
New Buffalo Zip Codes
New Buffalo Area Codes
Income in New Buffalo
Income Overview in New Buffalo
Per Capita Income in New Buffalo is $52,528, while median incomes of families and households are $113,333 and $61,875 respectively.
| Characteristic | Number | Measure |
| Per Capita Income | 1,362 | $52,528 |
| Median Family Income | 324 | $113,333 |
| Mean Family Income | 324 | $150,356 |
| Median Household Income | 732 | $61,875 |
| Mean Household Income | 732 | $95,812 |
| Income Deficit | 324 | $7,138 |
| Wage / Income Gap (%) | 1,362 | 54.65% |
| Wage / Income Gap ($) | 1,362 | 45.35¢ per $1 |
| Gini / Inequality Index | 1,362 | 0.53 |
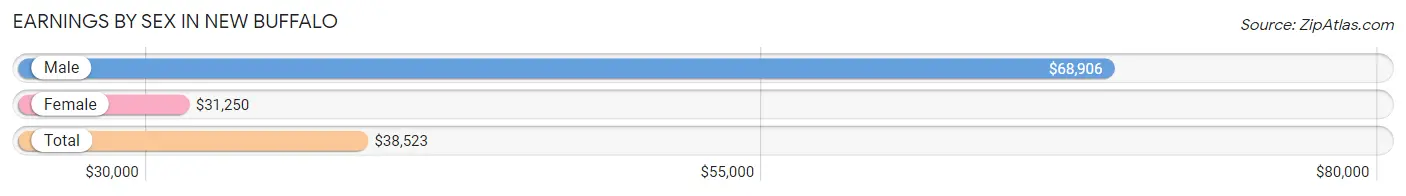
Earnings by Sex in New Buffalo
Average Earnings in New Buffalo are $38,523, $68,906 for men and $31,250 for women, a difference of 54.6%.
| Sex | Number | Average Earnings |
| Male | 399 (47.3%) | $68,906 |
| Female | 444 (52.7%) | $31,250 |
| Total | 843 (100.0%) | $38,523 |
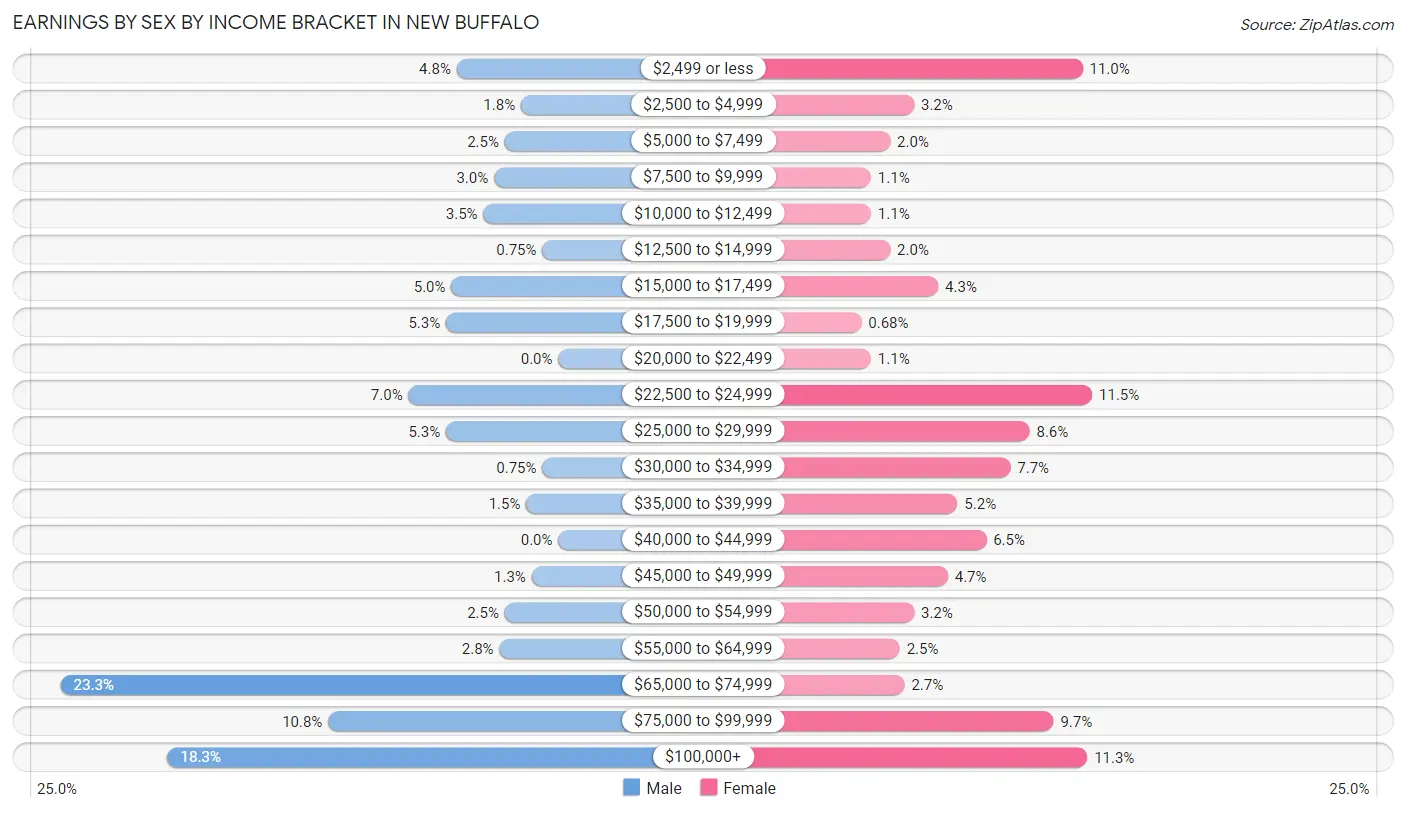
Earnings by Sex by Income Bracket in New Buffalo
The most common earnings brackets in New Buffalo are $65,000 to $74,999 for men (93 | 23.3%) and $22,500 to $24,999 for women (51 | 11.5%).
| Income | Male | Female |
| $2,499 or less | 19 (4.8%) | 49 (11.0%) |
| $2,500 to $4,999 | 7 (1.8%) | 14 (3.2%) |
| $5,000 to $7,499 | 10 (2.5%) | 9 (2.0%) |
| $7,500 to $9,999 | 12 (3.0%) | 5 (1.1%) |
| $10,000 to $12,499 | 14 (3.5%) | 5 (1.1%) |
| $12,500 to $14,999 | 3 (0.7%) | 9 (2.0%) |
| $15,000 to $17,499 | 20 (5.0%) | 19 (4.3%) |
| $17,500 to $19,999 | 21 (5.3%) | 3 (0.7%) |
| $20,000 to $22,499 | 0 (0.0%) | 5 (1.1%) |
| $22,500 to $24,999 | 28 (7.0%) | 51 (11.5%) |
| $25,000 to $29,999 | 21 (5.3%) | 38 (8.6%) |
| $30,000 to $34,999 | 3 (0.7%) | 34 (7.7%) |
| $35,000 to $39,999 | 6 (1.5%) | 23 (5.2%) |
| $40,000 to $44,999 | 0 (0.0%) | 29 (6.5%) |
| $45,000 to $49,999 | 5 (1.3%) | 21 (4.7%) |
| $50,000 to $54,999 | 10 (2.5%) | 14 (3.2%) |
| $55,000 to $64,999 | 11 (2.8%) | 11 (2.5%) |
| $65,000 to $74,999 | 93 (23.3%) | 12 (2.7%) |
| $75,000 to $99,999 | 43 (10.8%) | 43 (9.7%) |
| $100,000+ | 73 (18.3%) | 50 (11.3%) |
| Total | 399 (100.0%) | 444 (100.0%) |
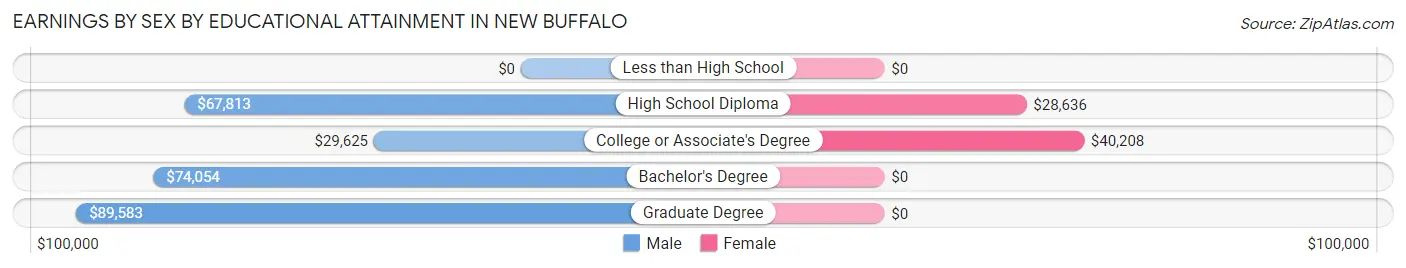
Earnings by Sex by Educational Attainment in New Buffalo
Average earnings in New Buffalo are $73,156 for men and $35,208 for women, a difference of 51.9%. Men with an educational attainment of graduate degree enjoy the highest average annual earnings of $89,583, while those with college or associate's degree education earn the least with $29,625. Women with an educational attainment of college or associate's degree earn the most with the average annual earnings of $40,208, while those with high school diploma education have the smallest earnings of $28,636.
| Educational Attainment | Male Income | Female Income |
| Less than High School | - | - |
| High School Diploma | $67,813 | $28,636 |
| College or Associate's Degree | $29,625 | $40,208 |
| Bachelor's Degree | $74,054 | $0 |
| Graduate Degree | $89,583 | $0 |
| Total | $73,156 | $35,208 |
Family Income in New Buffalo
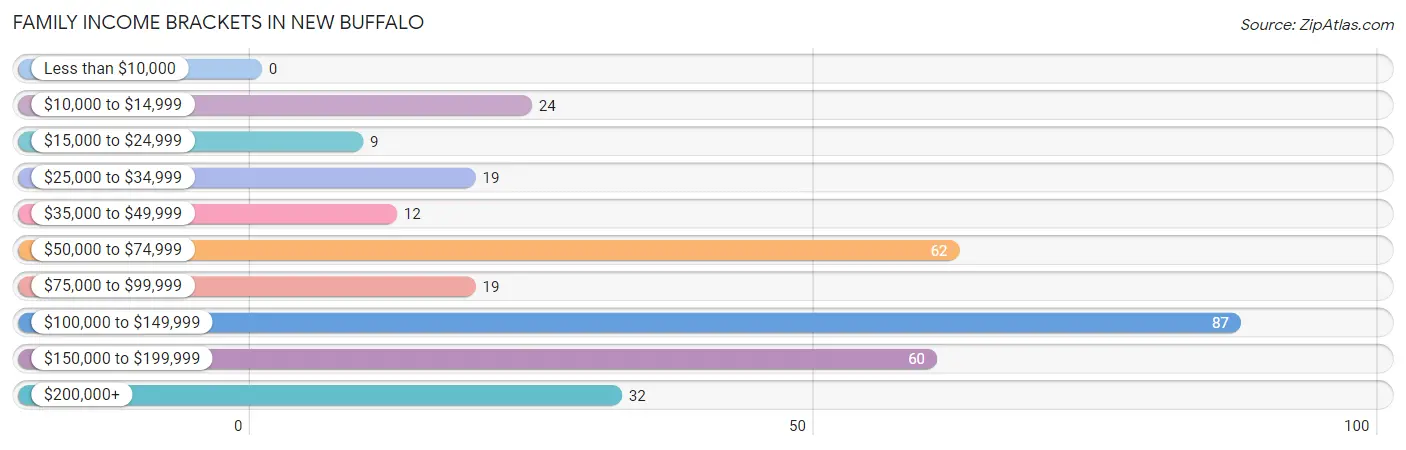
Family Income Brackets in New Buffalo
According to the New Buffalo family income data, there are 87 families falling into the $100,000 to $149,999 income range, which is the most common income bracket and makes up 26.9% of all families.
| Income Bracket | # Families | % Families |
| Less than $10,000 | 0 | 0.0% |
| $10,000 to $14,999 | 24 | 7.4% |
| $15,000 to $24,999 | 9 | 2.8% |
| $25,000 to $34,999 | 19 | 5.9% |
| $35,000 to $49,999 | 12 | 3.7% |
| $50,000 to $74,999 | 62 | 19.1% |
| $75,000 to $99,999 | 19 | 5.9% |
| $100,000 to $149,999 | 87 | 26.9% |
| $150,000 to $199,999 | 60 | 18.5% |
| $200,000+ | 32 | 9.9% |
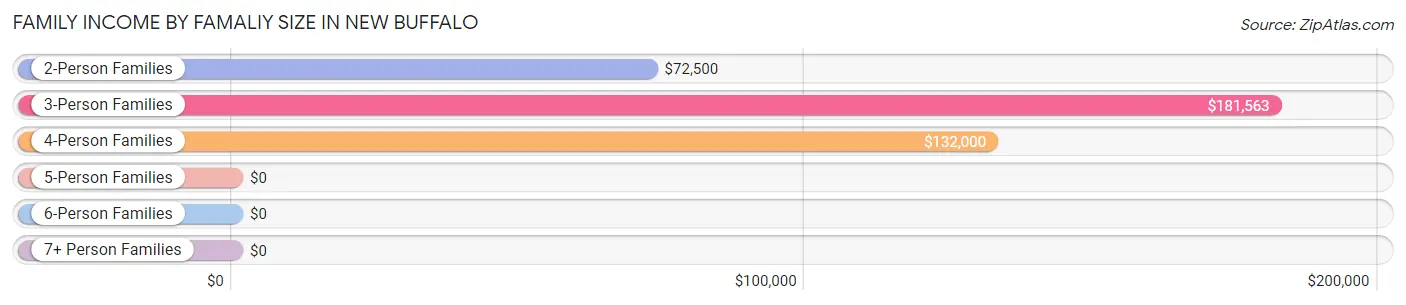
Family Income by Famaliy Size in New Buffalo
3-person families (68 | 21.0%) account for the highest median family income in New Buffalo with $181,563 per family, while 3-person families (68 | 21.0%) have the highest median income of $60,521 per family member.
| Income Bracket | # Families | Median Income |
| 2-Person Families | 190 (58.6%) | $72,500 |
| 3-Person Families | 68 (21.0%) | $181,563 |
| 4-Person Families | 40 (12.3%) | $132,000 |
| 5-Person Families | 22 (6.8%) | $0 |
| 6-Person Families | 0 (0.0%) | $0 |
| 7+ Person Families | 4 (1.2%) | $0 |
| Total | 324 (100.0%) | $113,333 |
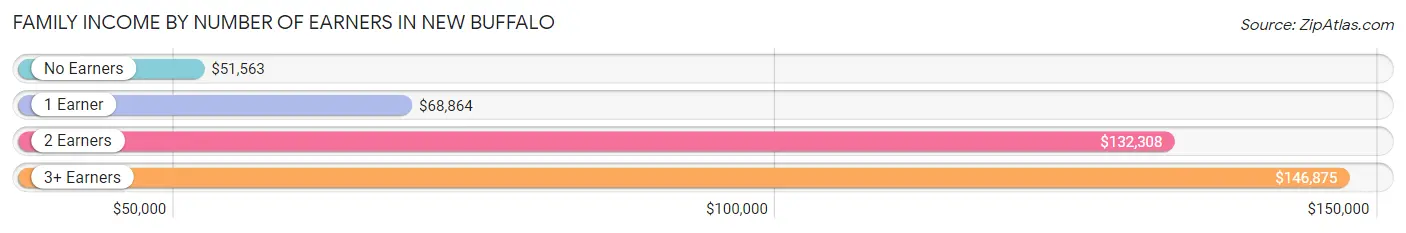
Family Income by Number of Earners in New Buffalo
The median family income in New Buffalo is $113,333, with families comprising 3+ earners (49) having the highest median family income of $146,875, while families with no earners (61) have the lowest median family income of $51,563, accounting for 15.1% and 18.8% of families, respectively.
| Number of Earners | # Families | Median Income |
| No Earners | 61 (18.8%) | $51,563 |
| 1 Earner | 80 (24.7%) | $68,864 |
| 2 Earners | 134 (41.4%) | $132,308 |
| 3+ Earners | 49 (15.1%) | $146,875 |
| Total | 324 (100.0%) | $113,333 |
Household Income in New Buffalo
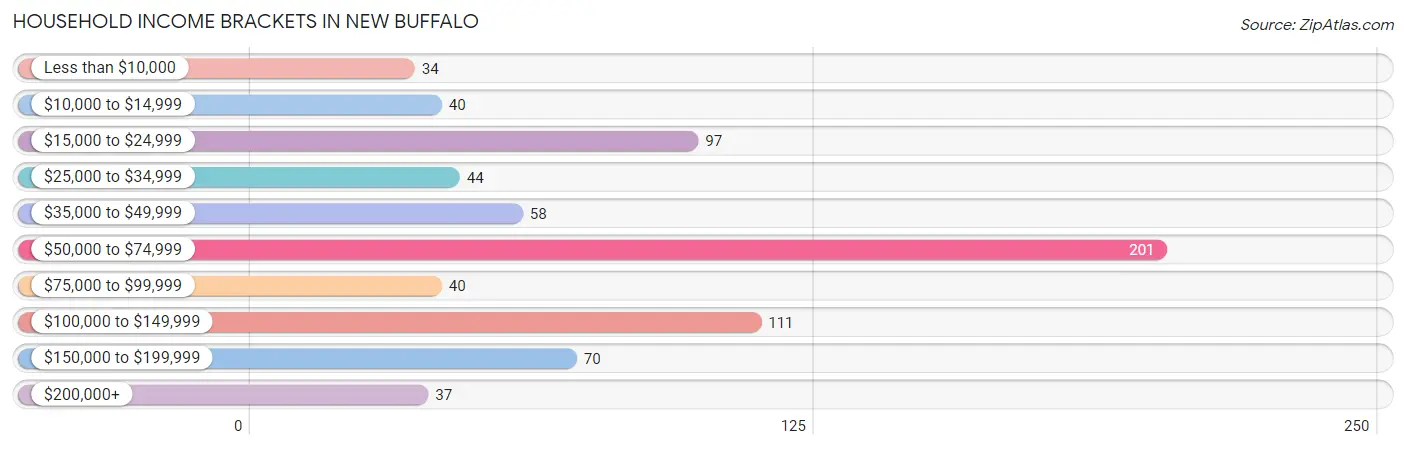
Household Income Brackets in New Buffalo
With 201 households falling in the category, the $50,000 to $74,999 income range is the most frequent in New Buffalo, accounting for 27.5% of all households. In contrast, only 34 households (4.6%) fall into the less than $10,000 income bracket, making it the least populous group.
| Income Bracket | # Households | % Households |
| Less than $10,000 | 34 | 4.6% |
| $10,000 to $14,999 | 40 | 5.5% |
| $15,000 to $24,999 | 97 | 13.3% |
| $25,000 to $34,999 | 44 | 6.0% |
| $35,000 to $49,999 | 58 | 7.9% |
| $50,000 to $74,999 | 201 | 27.5% |
| $75,000 to $99,999 | 40 | 5.5% |
| $100,000 to $149,999 | 111 | 15.2% |
| $150,000 to $199,999 | 70 | 9.6% |
| $200,000+ | 37 | 5.1% |
Household Income by Householder Age in New Buffalo
The median household income in New Buffalo is $61,875, with the highest median household income of $73,875 found in the 45 to 64 years age bracket for the primary householder. A total of 343 households (46.9%) fall into this category. Meanwhile, the 15 to 24 years age bracket for the primary householder has the lowest median household income of $0, with 7 households (1.0%) in this group.
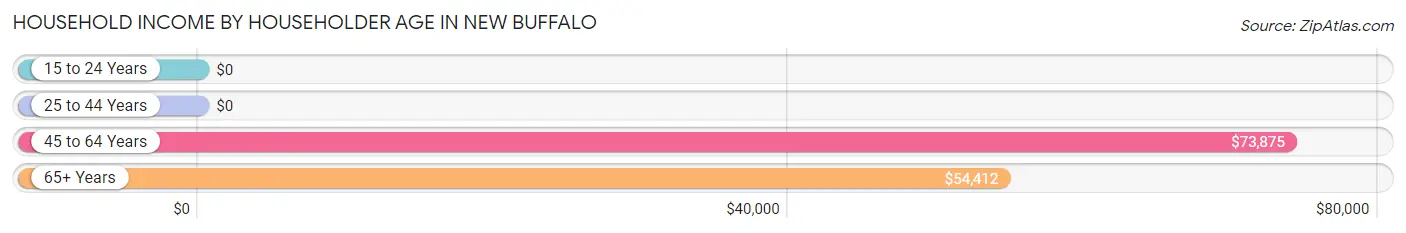
| Income Bracket | # Households | Median Income |
| 15 to 24 Years | 7 (1.0%) | $0 |
| 25 to 44 Years | 118 (16.1%) | $0 |
| 45 to 64 Years | 343 (46.9%) | $73,875 |
| 65+ Years | 264 (36.1%) | $54,412 |
| Total | 732 (100.0%) | $61,875 |
Poverty in New Buffalo
Income Below Poverty by Sex and Age in New Buffalo
With 11.5% poverty level for males and 11.5% for females among the residents of New Buffalo, under 5 year old males and under 5 year old females are the most vulnerable to poverty, with 7 males (35.0%) and 7 females (41.2%) in their respective age groups living below the poverty level.
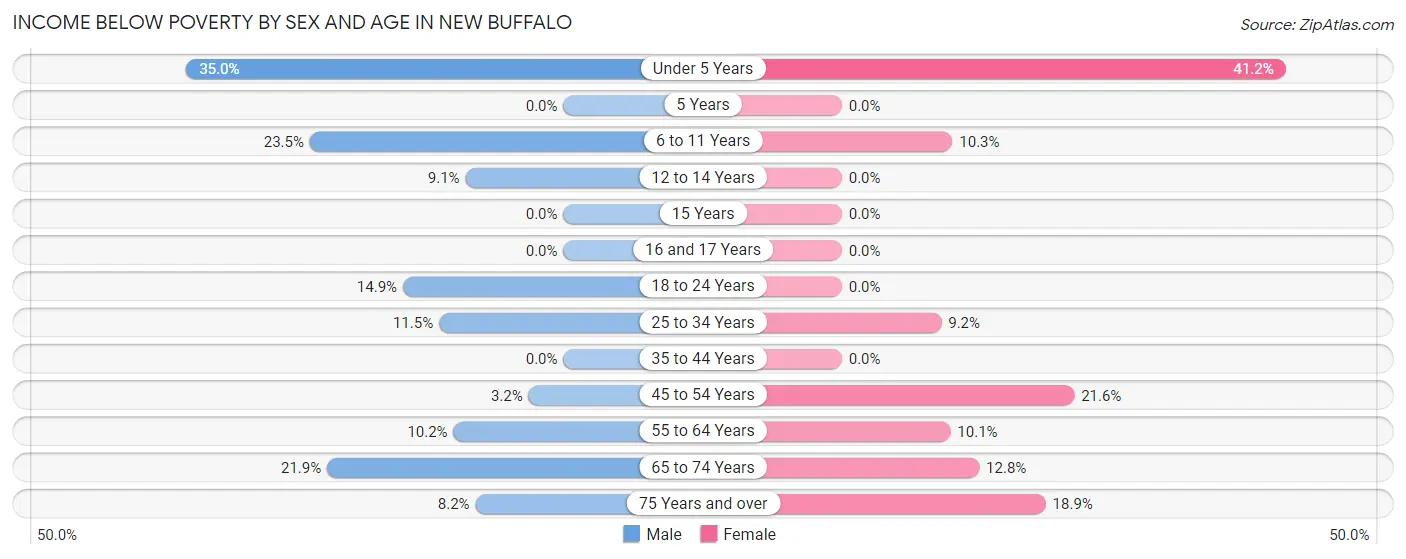
| Age Bracket | Male | Female |
| Under 5 Years | 7 (35.0%) | 7 (41.2%) |
| 5 Years | 0 (0.0%) | 0 (0.0%) |
| 6 to 11 Years | 8 (23.5%) | 4 (10.3%) |
| 12 to 14 Years | 1 (9.1%) | 0 (0.0%) |
| 15 Years | 0 (0.0%) | 0 (0.0%) |
| 16 and 17 Years | 0 (0.0%) | 0 (0.0%) |
| 18 to 24 Years | 7 (14.9%) | 0 (0.0%) |
| 25 to 34 Years | 6 (11.5%) | 6 (9.2%) |
| 35 to 44 Years | 0 (0.0%) | 0 (0.0%) |
| 45 to 54 Years | 5 (3.2%) | 22 (21.6%) |
| 55 to 64 Years | 10 (10.2%) | 12 (10.1%) |
| 65 to 74 Years | 25 (21.9%) | 19 (12.8%) |
| 75 Years and over | 4 (8.2%) | 14 (18.9%) |
| Total | 73 (11.5%) | 84 (11.5%) |
Income Above Poverty by Sex and Age in New Buffalo
According to the poverty statistics in New Buffalo, males aged 5 years and females aged 5 years are the age groups that are most secure financially, with 100.0% of males and 100.0% of females in these age groups living above the poverty line.
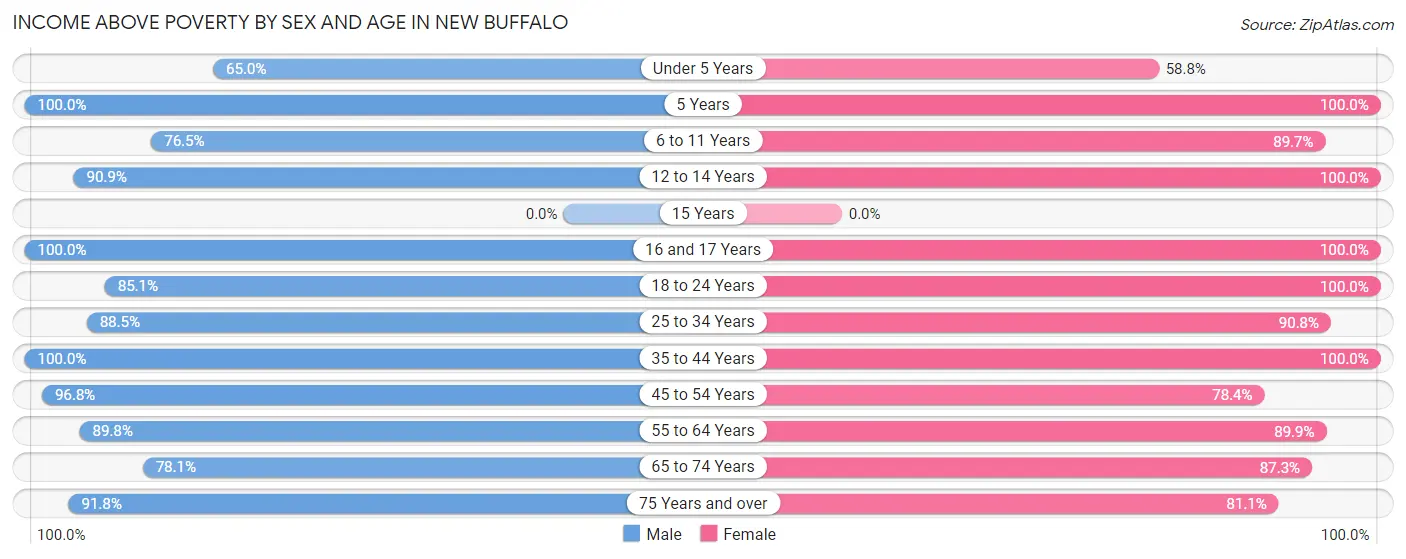
| Age Bracket | Male | Female |
| Under 5 Years | 13 (65.0%) | 10 (58.8%) |
| 5 Years | 4 (100.0%) | 6 (100.0%) |
| 6 to 11 Years | 26 (76.5%) | 35 (89.7%) |
| 12 to 14 Years | 10 (90.9%) | 25 (100.0%) |
| 15 Years | 0 (0.0%) | 0 (0.0%) |
| 16 and 17 Years | 14 (100.0%) | 9 (100.0%) |
| 18 to 24 Years | 40 (85.1%) | 32 (100.0%) |
| 25 to 34 Years | 46 (88.5%) | 59 (90.8%) |
| 35 to 44 Years | 36 (100.0%) | 91 (100.0%) |
| 45 to 54 Years | 150 (96.8%) | 80 (78.4%) |
| 55 to 64 Years | 88 (89.8%) | 107 (89.9%) |
| 65 to 74 Years | 89 (78.1%) | 130 (87.3%) |
| 75 Years and over | 45 (91.8%) | 60 (81.1%) |
| Total | 561 (88.5%) | 644 (88.5%) |
Income Below Poverty Among Married-Couple Families in New Buffalo
The poverty statistics for married-couple families in New Buffalo show that 12.6% or 34 of the total 271 families live below the poverty line. Families with 3 or 4 children have the highest poverty rate of 28.6%, comprising of 6 families. On the other hand, families with no children have the lowest poverty rate of 9.8%, which includes 19 families.
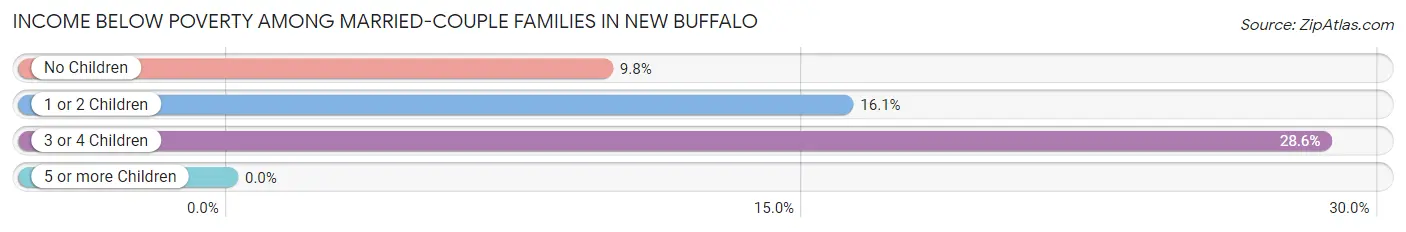
| Children | Above Poverty | Below Poverty |
| No Children | 175 (90.2%) | 19 (9.8%) |
| 1 or 2 Children | 47 (83.9%) | 9 (16.1%) |
| 3 or 4 Children | 15 (71.4%) | 6 (28.6%) |
| 5 or more Children | 0 (0.0%) | 0 (0.0%) |
| Total | 237 (87.5%) | 34 (12.6%) |
Income Below Poverty Among Single-Parent Households in New Buffalo
| Children | Single Father | Single Mother |
| No Children | 0 (0.0%) | 0 (0.0%) |
| 1 or 2 Children | 0 (0.0%) | 0 (0.0%) |
| 3 or 4 Children | 0 (0.0%) | 0 (0.0%) |
| 5 or more Children | 0 (0.0%) | 0 (0.0%) |
| Total | 0 (0.0%) | 0 (0.0%) |
Income Below Poverty Among Married-Couple vs Single-Parent Households in New Buffalo
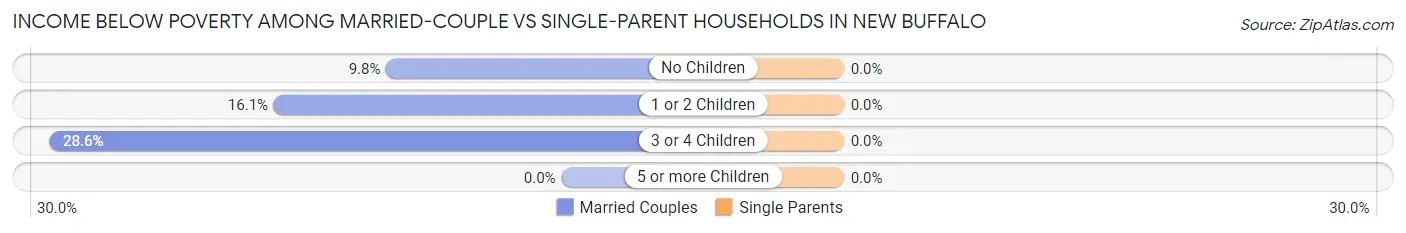
| Children | Married-Couple Families | Single-Parent Households |
| No Children | 19 (9.8%) | 0 (0.0%) |
| 1 or 2 Children | 9 (16.1%) | 0 (0.0%) |
| 3 or 4 Children | 6 (28.6%) | 0 (0.0%) |
| 5 or more Children | 0 (0.0%) | 0 (0.0%) |
| Total | 34 (12.6%) | 0 (0.0%) |
Race in New Buffalo
The most populous races in New Buffalo are White / Caucasian (1,290 | 94.7%), Hispanic or Latino (83 | 6.1%), and Native / Alaskan (23 | 1.7%).
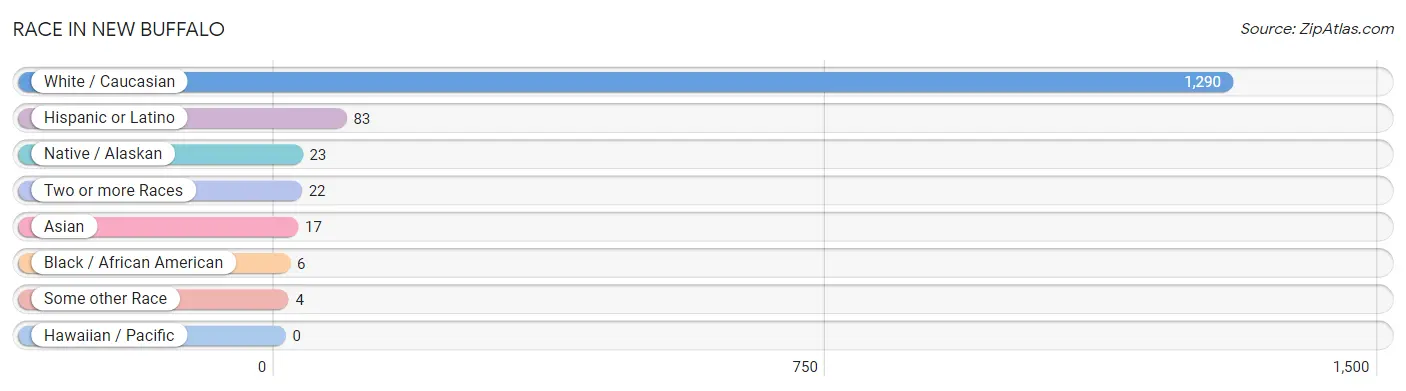
| Race | # Population | % Population |
| Asian | 17 | 1.3% |
| Black / African American | 6 | 0.4% |
| Hawaiian / Pacific | 0 | 0.0% |
| Hispanic or Latino | 83 | 6.1% |
| Native / Alaskan | 23 | 1.7% |
| White / Caucasian | 1,290 | 94.7% |
| Two or more Races | 22 | 1.6% |
| Some other Race | 4 | 0.3% |
| Total | 1,362 | 100.0% |
Ancestry in New Buffalo
The most populous ancestries reported in New Buffalo are German (428 | 31.4%), Irish (225 | 16.5%), Polish (142 | 10.4%), Italian (131 | 9.6%), and English (121 | 8.9%), together accounting for 76.9% of all New Buffalo residents.
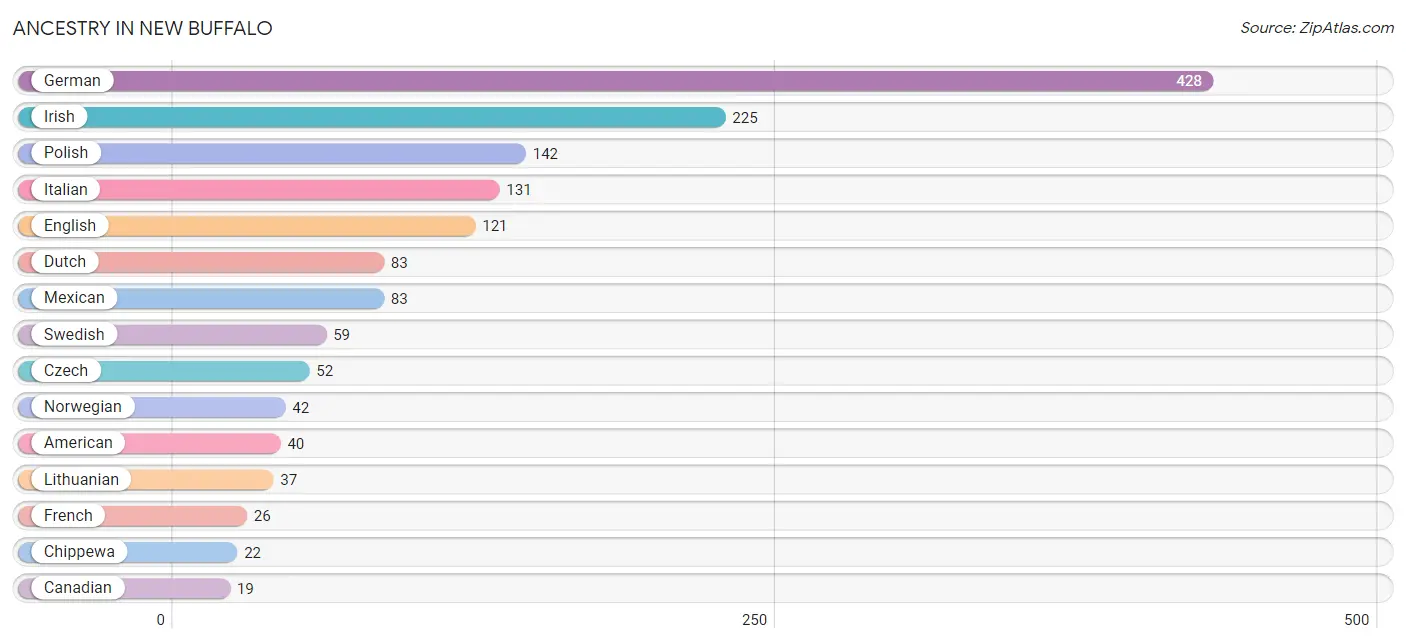
| Ancestry | # Population | % Population |
| American | 40 | 2.9% |
| British | 14 | 1.0% |
| Burmese | 1 | 0.1% |
| Canadian | 19 | 1.4% |
| Chippewa | 22 | 1.6% |
| Czech | 52 | 3.8% |
| Czechoslovakian | 5 | 0.4% |
| Danish | 5 | 0.4% |
| Dutch | 83 | 6.1% |
| Eastern European | 12 | 0.9% |
| English | 121 | 8.9% |
| French | 26 | 1.9% |
| French Canadian | 2 | 0.2% |
| German | 428 | 31.4% |
| Greek | 14 | 1.0% |
| Guamanian / Chamorro | 13 | 0.9% |
| Indian (Asian) | 19 | 1.4% |
| Irish | 225 | 16.5% |
| Italian | 131 | 9.6% |
| Japanese | 5 | 0.4% |
| Lithuanian | 37 | 2.7% |
| Mexican | 83 | 6.1% |
| Norwegian | 42 | 3.1% |
| Pennsylvania German | 4 | 0.3% |
| Polish | 142 | 10.4% |
| Potawatomi | 1 | 0.1% |
| Russian | 18 | 1.3% |
| Scotch-Irish | 19 | 1.4% |
| Scottish | 14 | 1.0% |
| Swedish | 59 | 4.3% |
| Swiss | 3 | 0.2% |
| Ukrainian | 4 | 0.3% |
| Welsh | 7 | 0.5% | View All 33 Rows |
Immigrants in New Buffalo
The most numerous immigrant groups reported in New Buffalo came from Asia (21 | 1.5%), Europe (20 | 1.5%), Eastern Europe (15 | 1.1%), Eastern Asia (12 | 0.9%), and China (11 | 0.8%), together accounting for 5.8% of all New Buffalo residents.
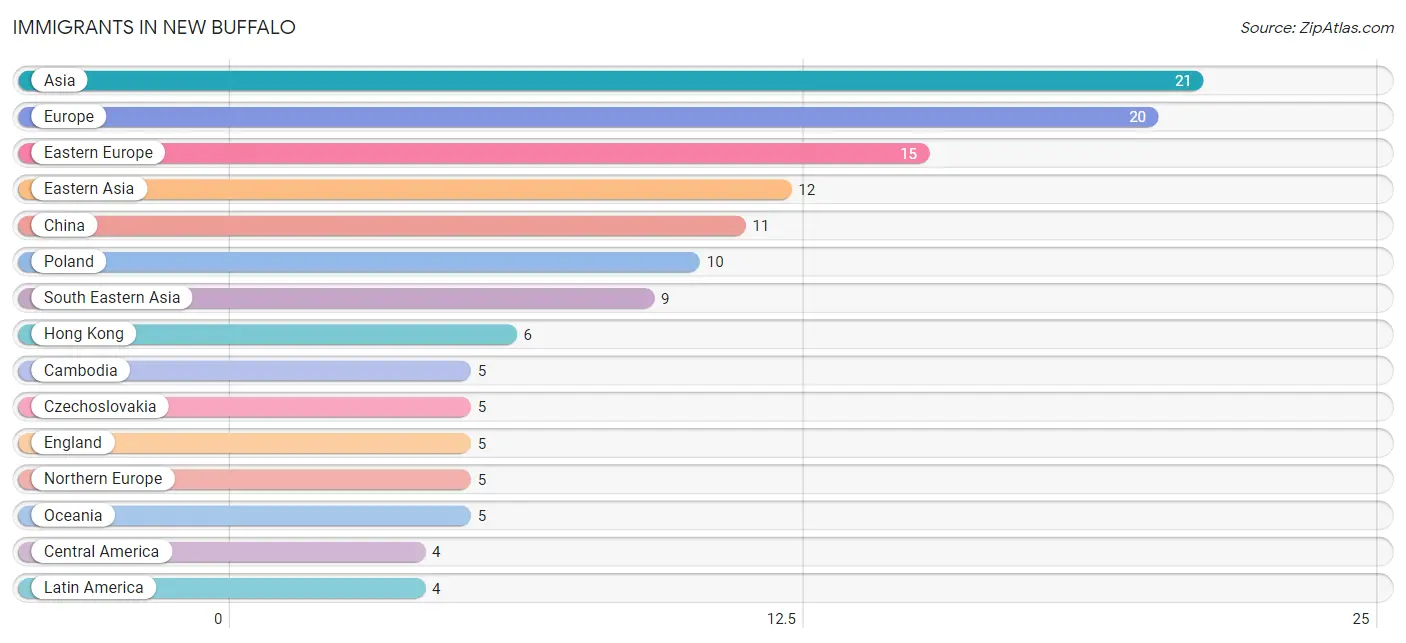
| Immigration Origin | # Population | % Population |
| Asia | 21 | 1.5% |
| Cambodia | 5 | 0.4% |
| Central America | 4 | 0.3% |
| China | 11 | 0.8% |
| Czechoslovakia | 5 | 0.4% |
| Eastern Asia | 12 | 0.9% |
| Eastern Europe | 15 | 1.1% |
| England | 5 | 0.4% |
| Europe | 20 | 1.5% |
| Hong Kong | 6 | 0.4% |
| Korea | 1 | 0.1% |
| Latin America | 4 | 0.3% |
| Mexico | 4 | 0.3% |
| Northern Europe | 5 | 0.4% |
| Oceania | 5 | 0.4% |
| Philippines | 4 | 0.3% |
| Poland | 10 | 0.7% |
| South Eastern Asia | 9 | 0.7% | View All 18 Rows |
Sex and Age in New Buffalo
Sex and Age in New Buffalo
The most populous age groups in New Buffalo are 45 to 49 Years (120 | 18.9%) for men and 65 to 69 Years (123 | 16.9%) for women.
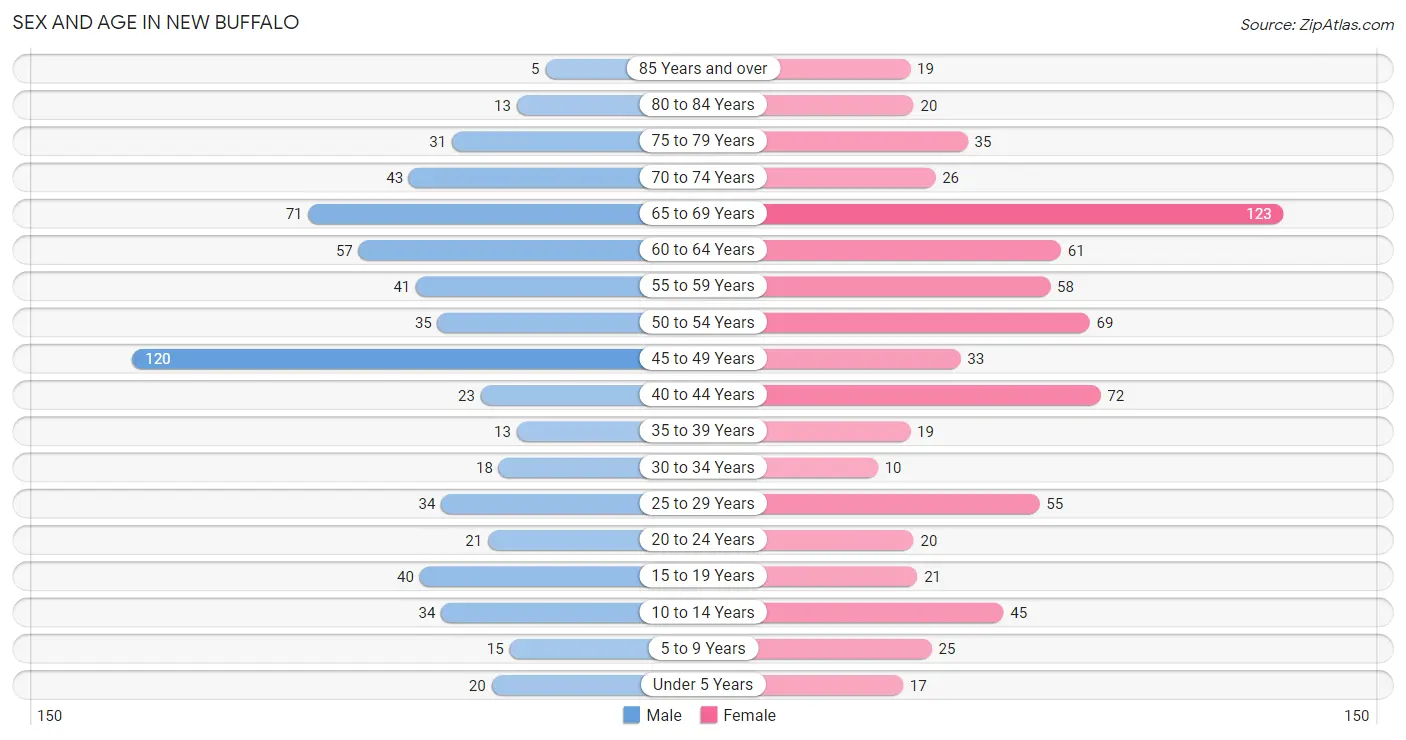
| Age Bracket | Male | Female |
| Under 5 Years | 20 (3.2%) | 17 (2.3%) |
| 5 to 9 Years | 15 (2.4%) | 25 (3.4%) |
| 10 to 14 Years | 34 (5.4%) | 45 (6.2%) |
| 15 to 19 Years | 40 (6.3%) | 21 (2.9%) |
| 20 to 24 Years | 21 (3.3%) | 20 (2.8%) |
| 25 to 29 Years | 34 (5.4%) | 55 (7.5%) |
| 30 to 34 Years | 18 (2.8%) | 10 (1.4%) |
| 35 to 39 Years | 13 (2.1%) | 19 (2.6%) |
| 40 to 44 Years | 23 (3.6%) | 72 (9.9%) |
| 45 to 49 Years | 120 (18.9%) | 33 (4.5%) |
| 50 to 54 Years | 35 (5.5%) | 69 (9.5%) |
| 55 to 59 Years | 41 (6.5%) | 58 (8.0%) |
| 60 to 64 Years | 57 (9.0%) | 61 (8.4%) |
| 65 to 69 Years | 71 (11.2%) | 123 (16.9%) |
| 70 to 74 Years | 43 (6.8%) | 26 (3.6%) |
| 75 to 79 Years | 31 (4.9%) | 35 (4.8%) |
| 80 to 84 Years | 13 (2.1%) | 20 (2.8%) |
| 85 Years and over | 5 (0.8%) | 19 (2.6%) |
| Total | 634 (100.0%) | 728 (100.0%) |
Families and Households in New Buffalo
Median Family Size in New Buffalo
The median family size in New Buffalo is 2.85 persons per family, with single female/mother families (45 | 13.9%) accounting for the largest median family size of 3.02 persons per family. On the other hand, single male/father families (8 | 2.5%) represent the smallest median family size with 2.13 persons per family.
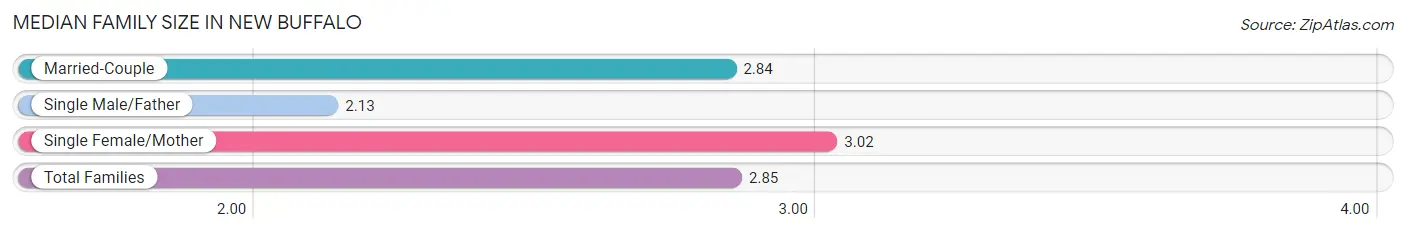
| Family Type | # Families | Family Size |
| Married-Couple | 271 (83.6%) | 2.84 |
| Single Male/Father | 8 (2.5%) | 2.13 |
| Single Female/Mother | 45 (13.9%) | 3.02 |
| Total Families | 324 (100.0%) | 2.85 |
Median Household Size in New Buffalo
The median household size in New Buffalo is 1.86 persons per household, with single female/mother households (45 | 6.1%) accounting for the largest median household size of 3.29 persons per household. non-family households (408 | 55.7%) represent the smallest median household size with 1.05 persons per household.
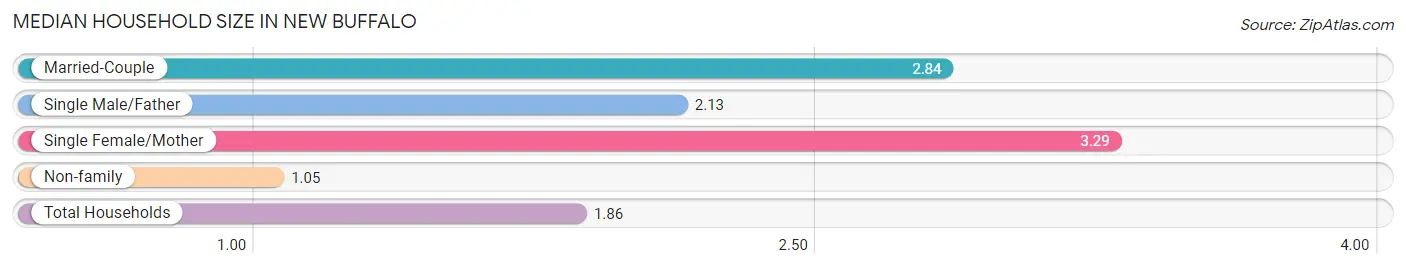
| Household Type | # Households | Household Size |
| Married-Couple | 271 (37.0%) | 2.84 |
| Single Male/Father | 8 (1.1%) | 2.13 |
| Single Female/Mother | 45 (6.1%) | 3.29 |
| Non-family | 408 (55.7%) | 1.05 |
| Total Households | 732 (100.0%) | 1.86 |
Household Size by Marriage Status in New Buffalo
Out of a total of 732 households in New Buffalo, 324 (44.3%) are family households, while 408 (55.7%) are nonfamily households. The most numerous type of family households are 2-person households, comprising 179, and the most common type of nonfamily households are 1-person households, comprising 388.
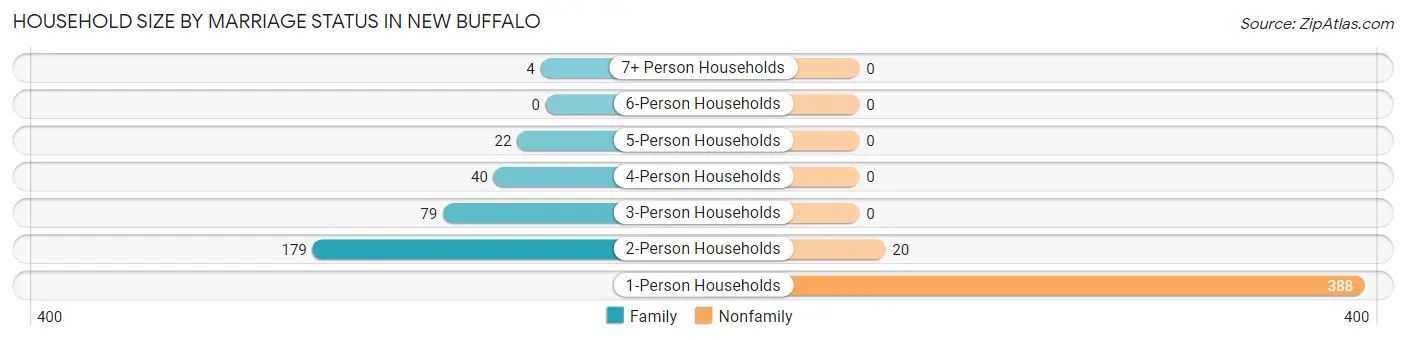
| Household Size | Family Households | Nonfamily Households |
| 1-Person Households | - | 388 (53.0%) |
| 2-Person Households | 179 (24.4%) | 20 (2.7%) |
| 3-Person Households | 79 (10.8%) | 0 (0.0%) |
| 4-Person Households | 40 (5.5%) | 0 (0.0%) |
| 5-Person Households | 22 (3.0%) | 0 (0.0%) |
| 6-Person Households | 0 (0.0%) | 0 (0.0%) |
| 7+ Person Households | 4 (0.5%) | 0 (0.0%) |
| Total | 324 (44.3%) | 408 (55.7%) |
Female Fertility in New Buffalo
Fertility by Age in New Buffalo
Average fertility rate in New Buffalo is 46.0 births per 1,000 women. Women in the age bracket of 20 to 34 years have the highest fertility rate with 129.0 births per 1,000 women. Women in the age bracket of 20 to 34 years acount for 100.0% of all women with births.
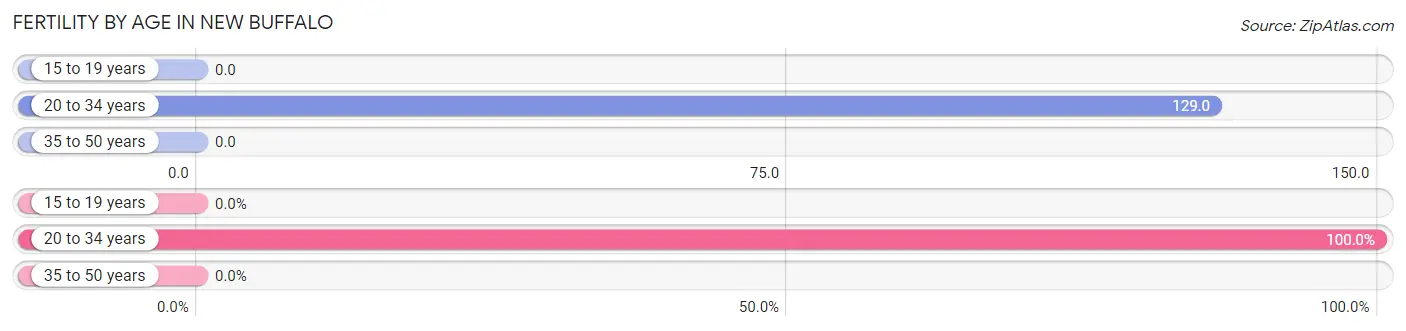
| Age Bracket | Women with Births | Births / 1,000 Women |
| 15 to 19 years | 0 (0.0%) | 0.0 |
| 20 to 34 years | 11 (100.0%) | 129.0 |
| 35 to 50 years | 0 (0.0%) | 0.0 |
| Total | 11 (100.0%) | 46.0 |
Fertility by Age by Marriage Status in New Buffalo
54.5% of women with births (11) in New Buffalo are married. The highest percentage of unmarried women with births falls into 20 to 34 years age bracket with 45.5% of them unmarried at the time of birth, while the lowest percentage of unmarried women with births belong to 20 to 34 years age bracket with 45.5% of them unmarried.
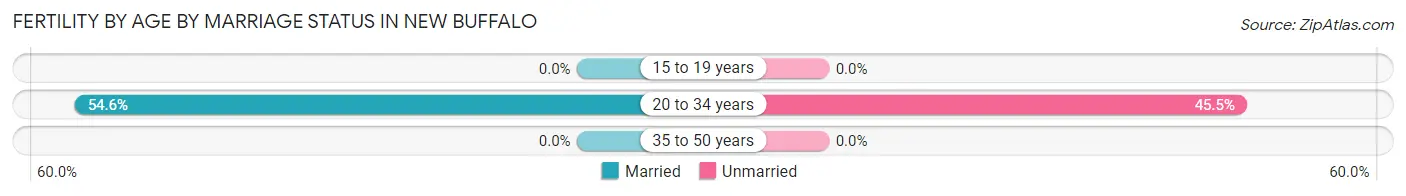
| Age Bracket | Married | Unmarried |
| 15 to 19 years | 0 (0.0%) | 0 (0.0%) |
| 20 to 34 years | 6 (54.5%) | 5 (45.5%) |
| 35 to 50 years | 0 (0.0%) | 0 (0.0%) |
| Total | 6 (54.5%) | 5 (45.5%) |
Fertility by Education in New Buffalo
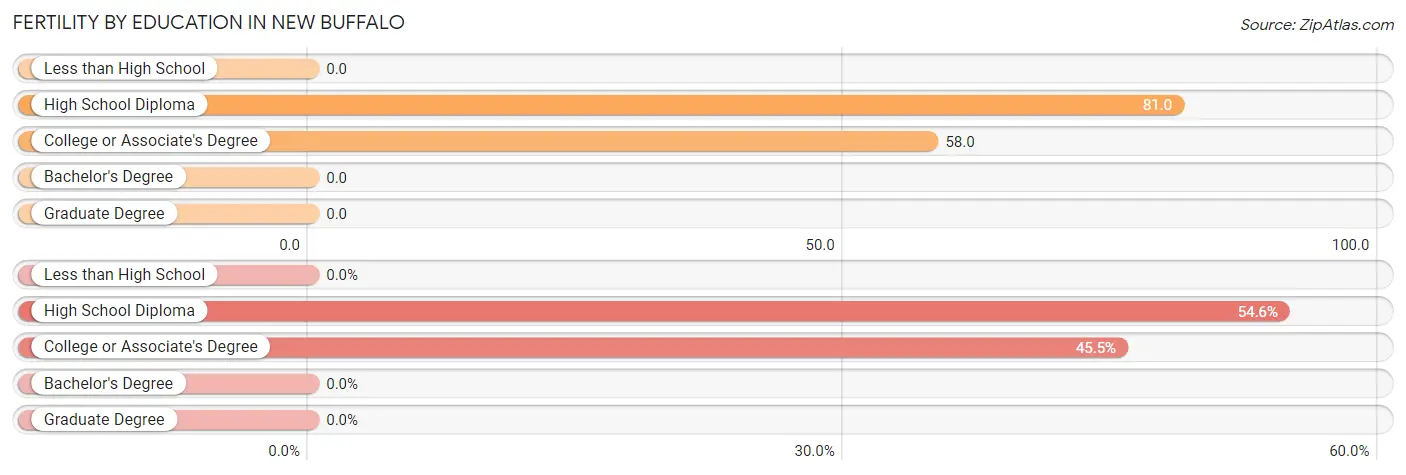
| Educational Attainment | Women with Births | Births / 1,000 Women |
| Less than High School | 0 (0.0%) | 0.0 |
| High School Diploma | 6 (54.5%) | 81.0 |
| College or Associate's Degree | 5 (45.5%) | 58.0 |
| Bachelor's Degree | 0 (0.0%) | 0.0 |
| Graduate Degree | 0 (0.0%) | 0.0 |
| Total | 11 (100.0%) | 46.0 |
Fertility by Education by Marriage Status in New Buffalo
45.5% of women with births in New Buffalo are unmarried. Women with the educational attainment of high school diploma are most likely to be married with 100.0% of them married at childbirth, while women with the educational attainment of college or associate's degree are least likely to be married with 100.0% of them unmarried at childbirth.
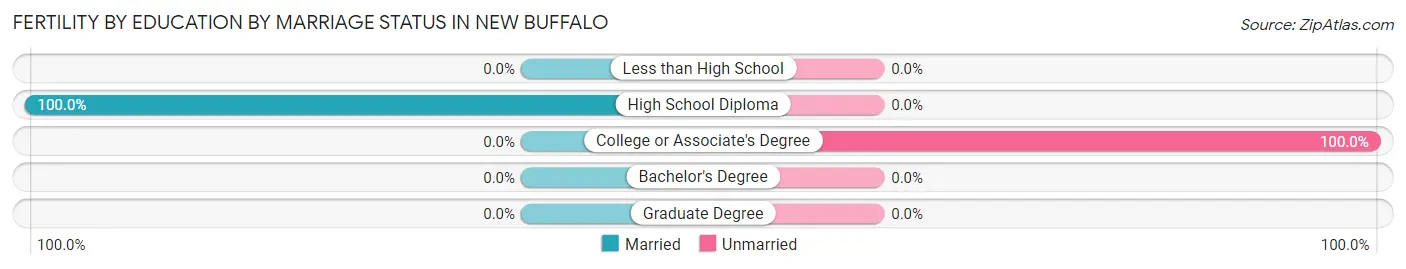
| Educational Attainment | Married | Unmarried |
| Less than High School | 0 (0.0%) | 0 (0.0%) |
| High School Diploma | 6 (100.0%) | 0 (0.0%) |
| College or Associate's Degree | 0 (0.0%) | 5 (100.0%) |
| Bachelor's Degree | 0 (0.0%) | 0 (0.0%) |
| Graduate Degree | 0 (0.0%) | 0 (0.0%) |
| Total | 6 (54.5%) | 5 (45.5%) |
Employment Characteristics in New Buffalo
Employment by Class of Employer in New Buffalo
Among the 764 employed individuals in New Buffalo, private company employees (491 | 64.3%), local government employees (140 | 18.3%), and not-for-profit organizations (56 | 7.3%) make up the most common classes of employment.
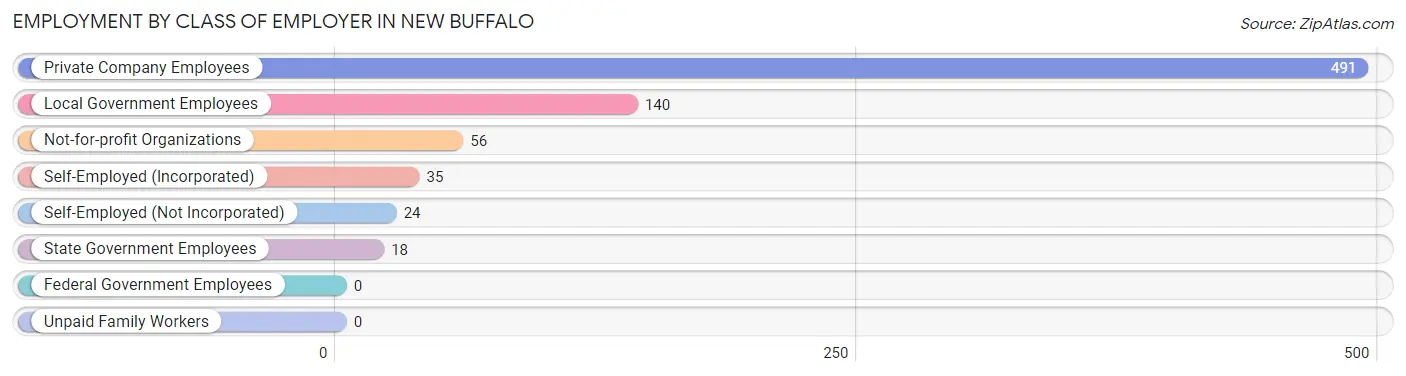
| Employer Class | # Employees | % Employees |
| Private Company Employees | 491 | 64.3% |
| Self-Employed (Incorporated) | 35 | 4.6% |
| Self-Employed (Not Incorporated) | 24 | 3.1% |
| Not-for-profit Organizations | 56 | 7.3% |
| Local Government Employees | 140 | 18.3% |
| State Government Employees | 18 | 2.4% |
| Federal Government Employees | 0 | 0.0% |
| Unpaid Family Workers | 0 | 0.0% |
| Total | 764 | 100.0% |
Employment Status by Age in New Buffalo
According to the labor force statistics for New Buffalo, out of the total population over 16 years of age (1,206), 64.8% or 781 individuals are in the labor force, with 1.3% or 10 of them unemployed. The age group with the highest labor force participation rate is 25 to 29 years, with 94.4% or 84 individuals in the labor force. Within the labor force, the 16 to 19 years age range has the highest percentage of unemployed individuals, with 10.7% or 6 of them being unemployed.
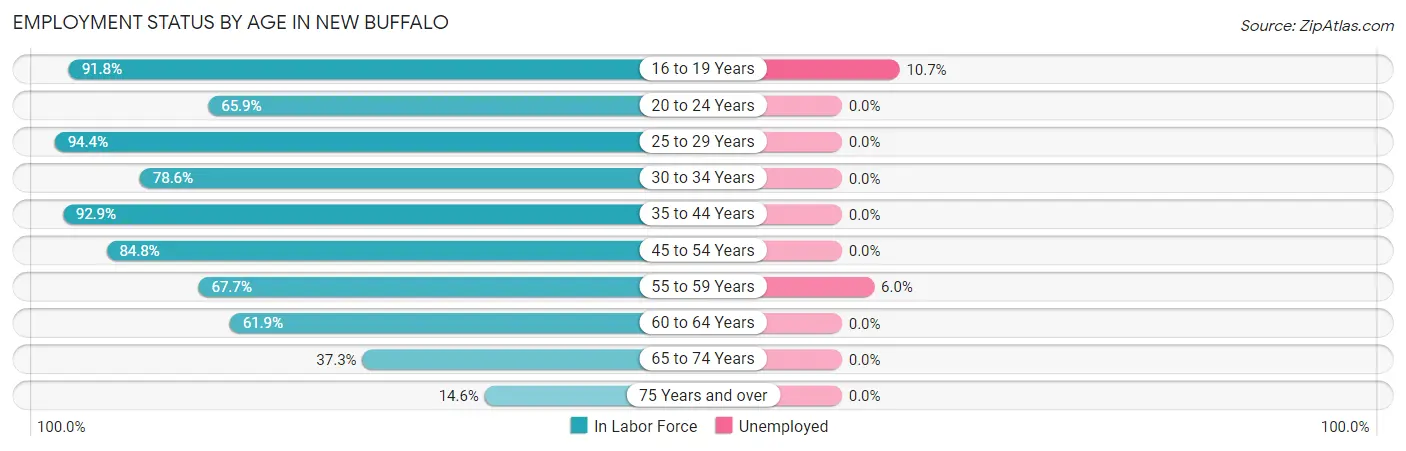
| Age Bracket | In Labor Force | Unemployed |
| 16 to 19 Years | 56 (91.8%) | 6 (10.7%) |
| 20 to 24 Years | 27 (65.9%) | 0 (0.0%) |
| 25 to 29 Years | 84 (94.4%) | 0 (0.0%) |
| 30 to 34 Years | 22 (78.6%) | 0 (0.0%) |
| 35 to 44 Years | 118 (92.9%) | 0 (0.0%) |
| 45 to 54 Years | 218 (84.8%) | 0 (0.0%) |
| 55 to 59 Years | 67 (67.7%) | 4 (6.0%) |
| 60 to 64 Years | 73 (61.9%) | 0 (0.0%) |
| 65 to 74 Years | 98 (37.3%) | 0 (0.0%) |
| 75 Years and over | 18 (14.6%) | 0 (0.0%) |
| Total | 781 (64.8%) | 10 (1.3%) |
Employment Status by Educational Attainment in New Buffalo
According to labor force statistics for New Buffalo, 81.1% of individuals (582) out of the total population between 25 and 64 years of age (718) are in the labor force, with 0.7% or 4 of them being unemployed. The group with the highest labor force participation rate are those with the educational attainment of bachelor's degree or higher, with 90.3% or 232 individuals in the labor force. Within the labor force, individuals with high school diploma education have the highest percentage of unemployment, with 2.6% or 4 of them being unemployed.
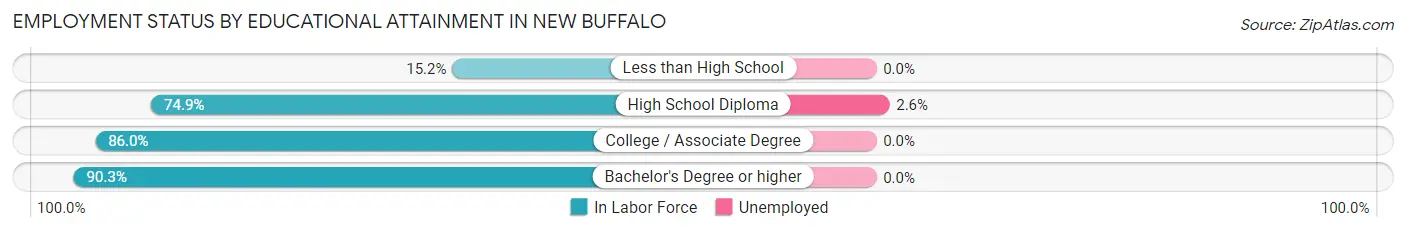
| Educational Attainment | In Labor Force | Unemployed |
| Less than High School | 5 (15.2%) | 0 (0.0%) |
| High School Diploma | 155 (74.9%) | 5 (2.6%) |
| College / Associate Degree | 190 (86.0%) | 0 (0.0%) |
| Bachelor's Degree or higher | 232 (90.3%) | 0 (0.0%) |
| Total | 582 (81.1%) | 5 (0.7%) |
Employment Occupations by Sex in New Buffalo
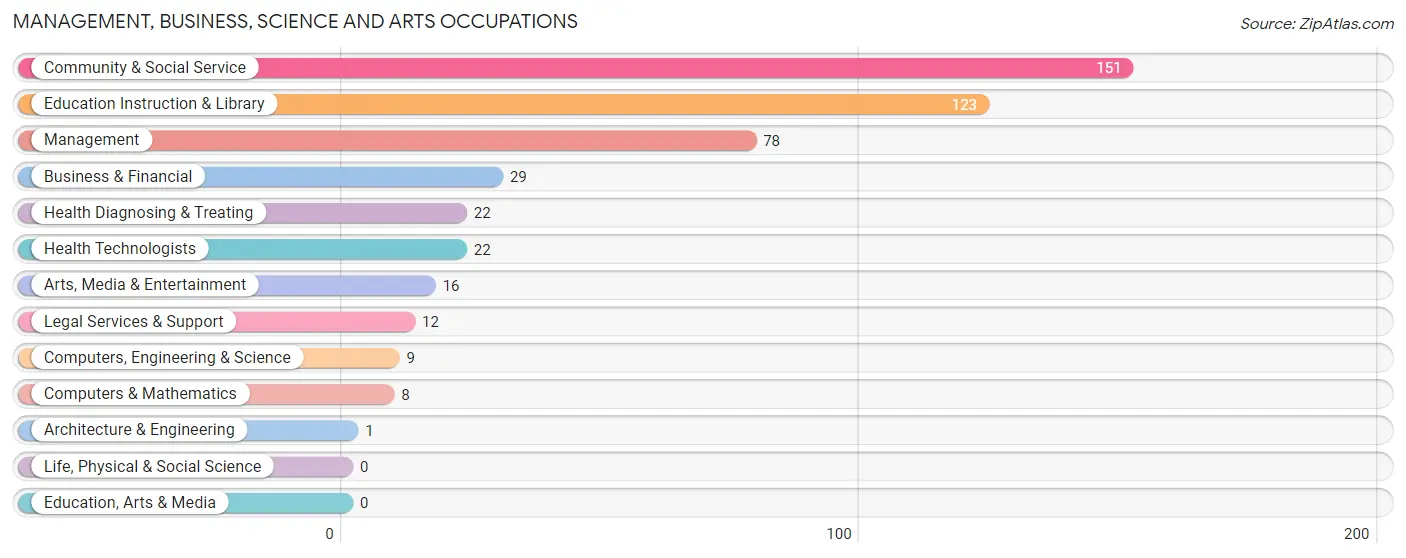
Management, Business, Science and Arts Occupations
The most common Management, Business, Science and Arts occupations in New Buffalo are Community & Social Service (151 | 19.6%), Education Instruction & Library (123 | 16.0%), Management (78 | 10.1%), Business & Financial (29 | 3.8%), and Health Diagnosing & Treating (22 | 2.9%).
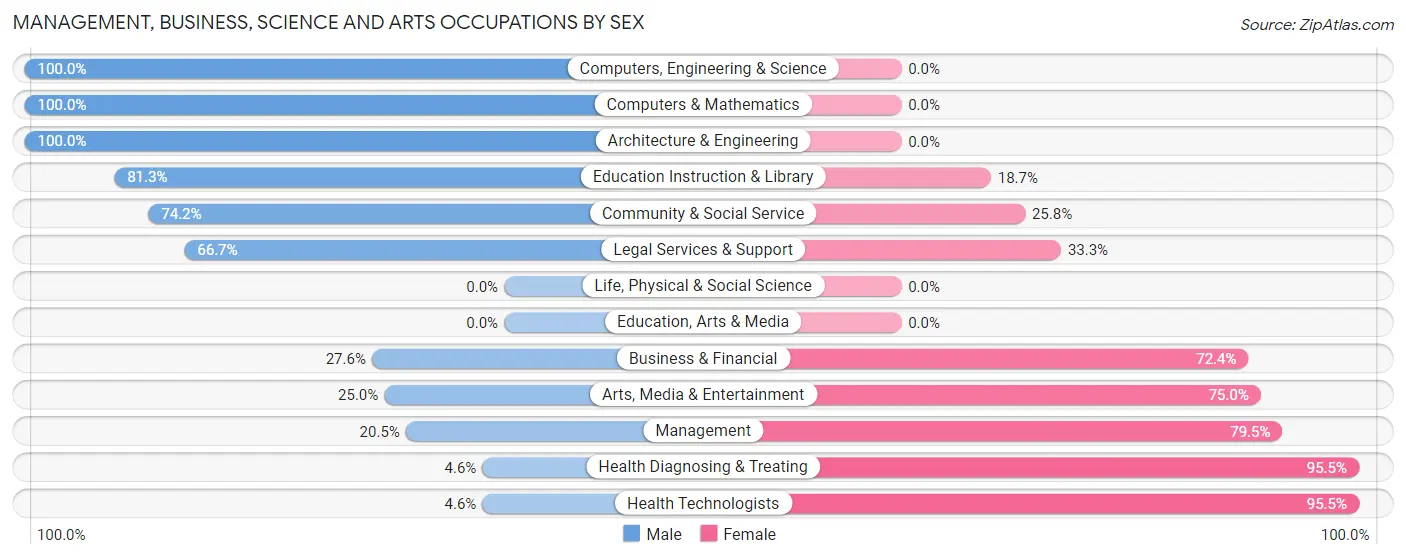
Management, Business, Science and Arts Occupations by Sex
Within the Management, Business, Science and Arts occupations in New Buffalo, the most male-oriented occupations are Computers, Engineering & Science (100.0%), Computers & Mathematics (100.0%), and Architecture & Engineering (100.0%), while the most female-oriented occupations are Health Diagnosing & Treating (95.5%), Health Technologists (95.5%), and Management (79.5%).
| Occupation | Male | Female |
| Management | 16 (20.5%) | 62 (79.5%) |
| Business & Financial | 8 (27.6%) | 21 (72.4%) |
| Computers, Engineering & Science | 9 (100.0%) | 0 (0.0%) |
| Computers & Mathematics | 8 (100.0%) | 0 (0.0%) |
| Architecture & Engineering | 1 (100.0%) | 0 (0.0%) |
| Life, Physical & Social Science | 0 (0.0%) | 0 (0.0%) |
| Community & Social Service | 112 (74.2%) | 39 (25.8%) |
| Education, Arts & Media | 0 (0.0%) | 0 (0.0%) |
| Legal Services & Support | 8 (66.7%) | 4 (33.3%) |
| Education Instruction & Library | 100 (81.3%) | 23 (18.7%) |
| Arts, Media & Entertainment | 4 (25.0%) | 12 (75.0%) |
| Health Diagnosing & Treating | 1 (4.5%) | 21 (95.5%) |
| Health Technologists | 1 (4.5%) | 21 (95.5%) |
| Total (Category) | 146 (50.5%) | 143 (49.5%) |
| Total (Overall) | 354 (45.9%) | 417 (54.1%) |
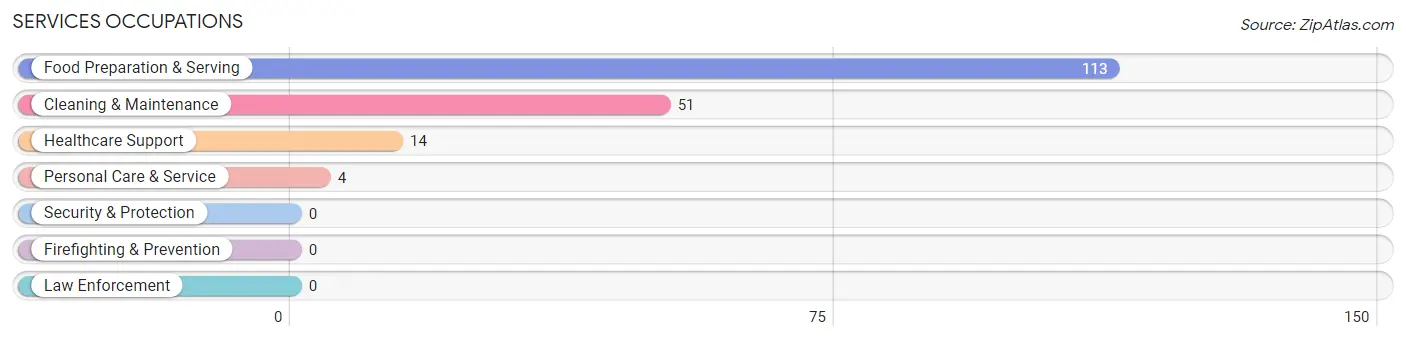
Services Occupations
The most common Services occupations in New Buffalo are Food Preparation & Serving (113 | 14.7%), Cleaning & Maintenance (51 | 6.6%), Healthcare Support (14 | 1.8%), and Personal Care & Service (4 | 0.5%).
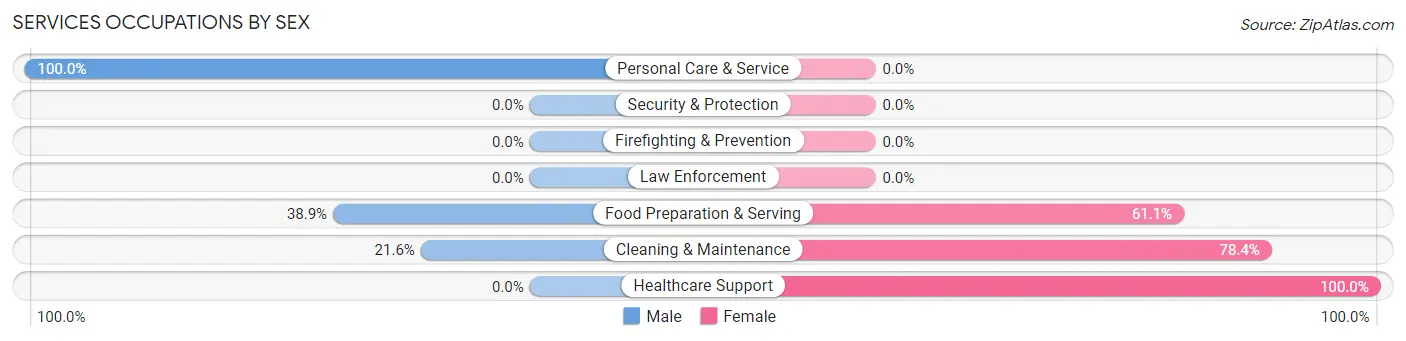
Services Occupations by Sex
Within the Services occupations in New Buffalo, the most male-oriented occupations are Personal Care & Service (100.0%), Food Preparation & Serving (38.9%), and Cleaning & Maintenance (21.6%), while the most female-oriented occupations are Healthcare Support (100.0%), Cleaning & Maintenance (78.4%), and Food Preparation & Serving (61.1%).
| Occupation | Male | Female |
| Healthcare Support | 0 (0.0%) | 14 (100.0%) |
| Security & Protection | 0 (0.0%) | 0 (0.0%) |
| Firefighting & Prevention | 0 (0.0%) | 0 (0.0%) |
| Law Enforcement | 0 (0.0%) | 0 (0.0%) |
| Food Preparation & Serving | 44 (38.9%) | 69 (61.1%) |
| Cleaning & Maintenance | 11 (21.6%) | 40 (78.4%) |
| Personal Care & Service | 4 (100.0%) | 0 (0.0%) |
| Total (Category) | 59 (32.4%) | 123 (67.6%) |
| Total (Overall) | 354 (45.9%) | 417 (54.1%) |
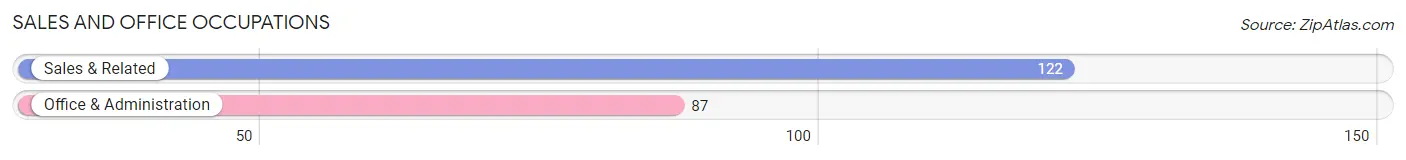
Sales and Office Occupations
The most common Sales and Office occupations in New Buffalo are Sales & Related (122 | 15.8%), and Office & Administration (87 | 11.3%).
Sales and Office Occupations by Sex

| Occupation | Male | Female |
| Sales & Related | 47 (38.5%) | 75 (61.5%) |
| Office & Administration | 17 (19.5%) | 70 (80.5%) |
| Total (Category) | 64 (30.6%) | 145 (69.4%) |
| Total (Overall) | 354 (45.9%) | 417 (54.1%) |
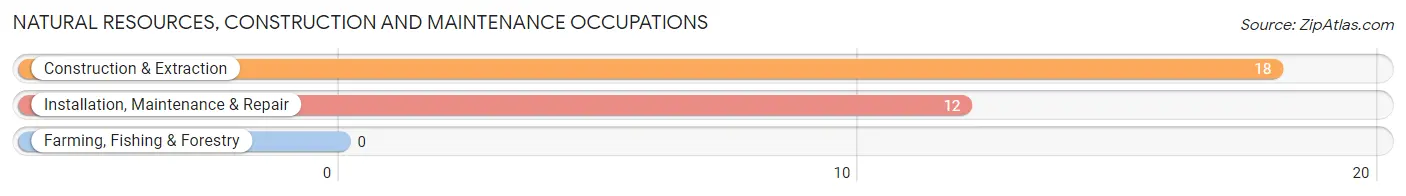
Natural Resources, Construction and Maintenance Occupations
The most common Natural Resources, Construction and Maintenance occupations in New Buffalo are Construction & Extraction (18 | 2.3%), and Installation, Maintenance & Repair (12 | 1.6%).
Natural Resources, Construction and Maintenance Occupations by Sex
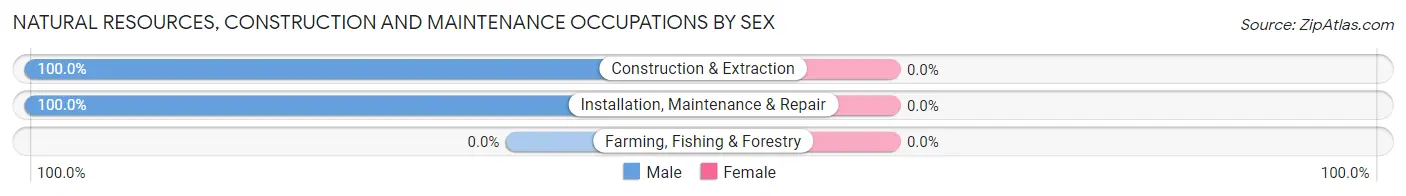
| Occupation | Male | Female |
| Farming, Fishing & Forestry | 0 (0.0%) | 0 (0.0%) |
| Construction & Extraction | 18 (100.0%) | 0 (0.0%) |
| Installation, Maintenance & Repair | 12 (100.0%) | 0 (0.0%) |
| Total (Category) | 30 (100.0%) | 0 (0.0%) |
| Total (Overall) | 354 (45.9%) | 417 (54.1%) |
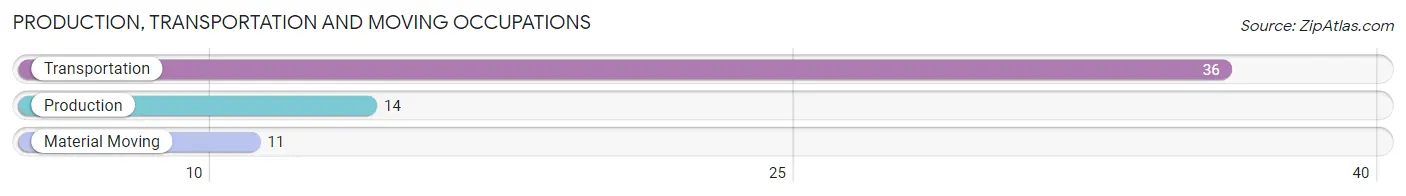
Production, Transportation and Moving Occupations
The most common Production, Transportation and Moving occupations in New Buffalo are Transportation (36 | 4.7%), Production (14 | 1.8%), and Material Moving (11 | 1.4%).
Production, Transportation and Moving Occupations by Sex
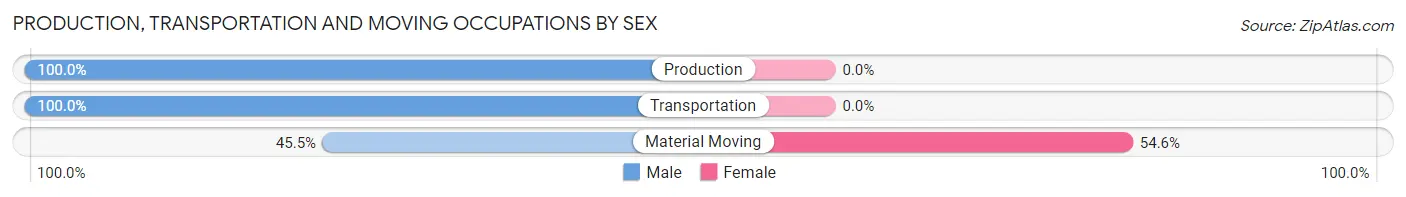
| Occupation | Male | Female |
| Production | 14 (100.0%) | 0 (0.0%) |
| Transportation | 36 (100.0%) | 0 (0.0%) |
| Material Moving | 5 (45.5%) | 6 (54.5%) |
| Total (Category) | 55 (90.2%) | 6 (9.8%) |
| Total (Overall) | 354 (45.9%) | 417 (54.1%) |
Employment Industries by Sex in New Buffalo
Employment Industries in New Buffalo
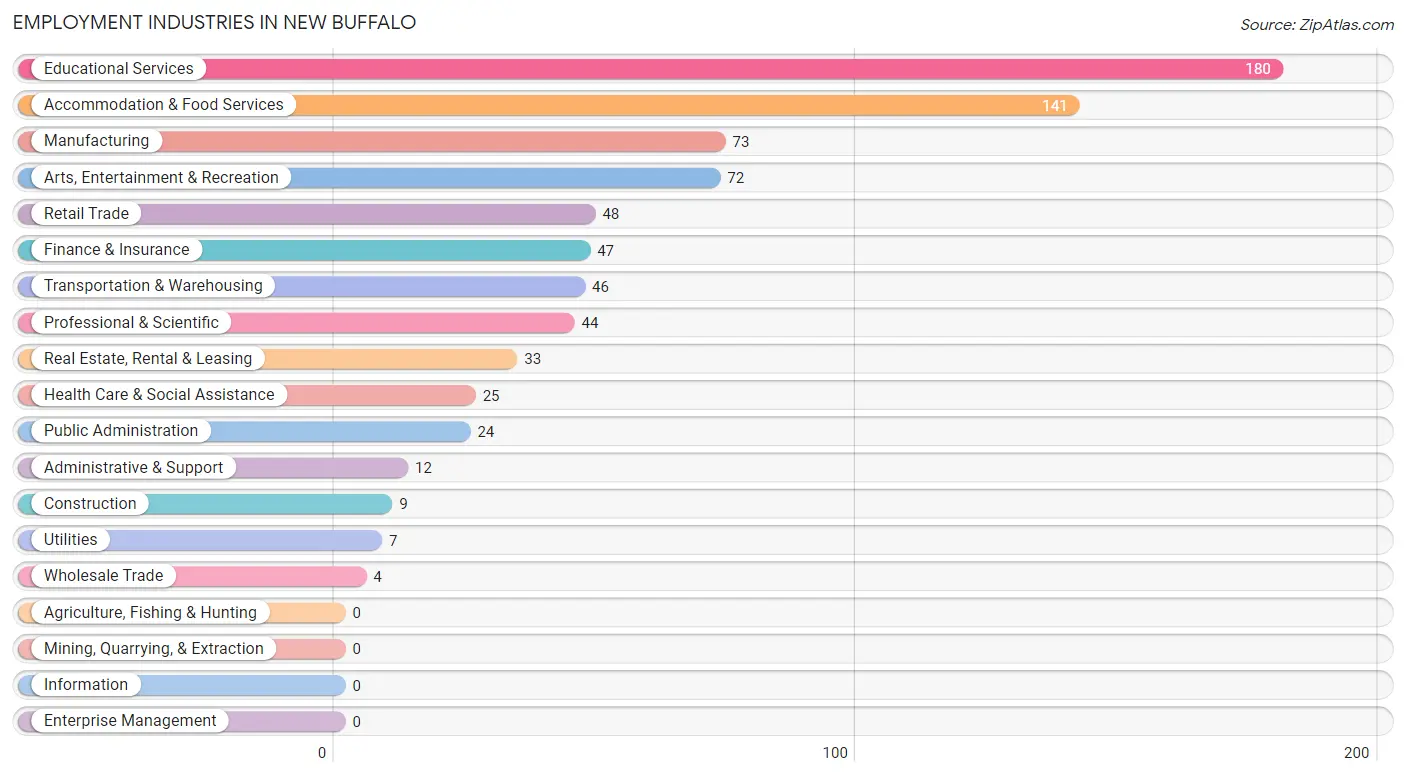
The major employment industries in New Buffalo include Educational Services (180 | 23.4%), Accommodation & Food Services (141 | 18.3%), Manufacturing (73 | 9.5%), Arts, Entertainment & Recreation (72 | 9.3%), and Retail Trade (48 | 6.2%).
Employment Industries by Sex in New Buffalo
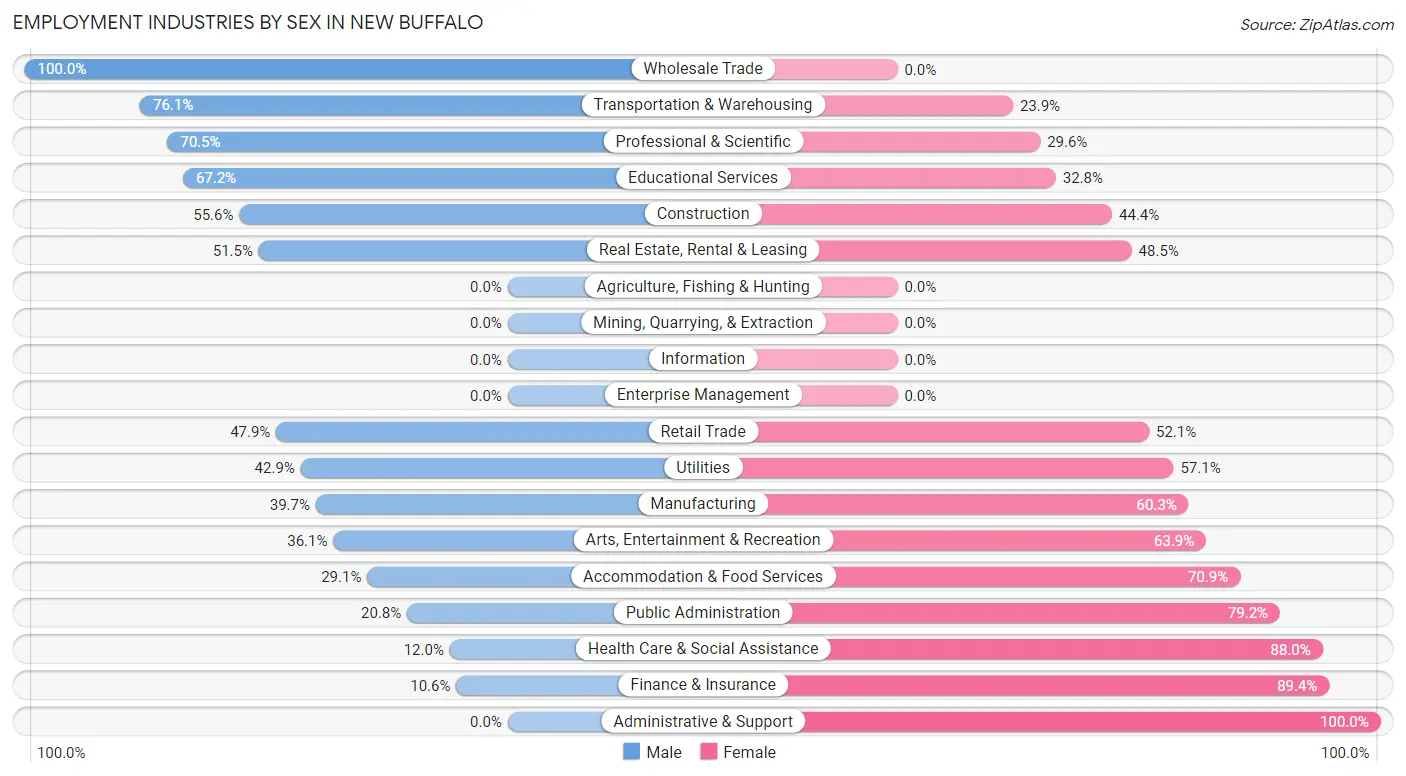
The New Buffalo industries that see more men than women are Wholesale Trade (100.0%), Transportation & Warehousing (76.1%), and Professional & Scientific (70.5%), whereas the industries that tend to have a higher number of women are Administrative & Support (100.0%), Finance & Insurance (89.4%), and Health Care & Social Assistance (88.0%).
| Industry | Male | Female |
| Agriculture, Fishing & Hunting | 0 (0.0%) | 0 (0.0%) |
| Mining, Quarrying, & Extraction | 0 (0.0%) | 0 (0.0%) |
| Construction | 5 (55.6%) | 4 (44.4%) |
| Manufacturing | 29 (39.7%) | 44 (60.3%) |
| Wholesale Trade | 4 (100.0%) | 0 (0.0%) |
| Retail Trade | 23 (47.9%) | 25 (52.1%) |
| Transportation & Warehousing | 35 (76.1%) | 11 (23.9%) |
| Utilities | 3 (42.9%) | 4 (57.1%) |
| Information | 0 (0.0%) | 0 (0.0%) |
| Finance & Insurance | 5 (10.6%) | 42 (89.4%) |
| Real Estate, Rental & Leasing | 17 (51.5%) | 16 (48.5%) |
| Professional & Scientific | 31 (70.5%) | 13 (29.5%) |
| Enterprise Management | 0 (0.0%) | 0 (0.0%) |
| Administrative & Support | 0 (0.0%) | 12 (100.0%) |
| Educational Services | 121 (67.2%) | 59 (32.8%) |
| Health Care & Social Assistance | 3 (12.0%) | 22 (88.0%) |
| Arts, Entertainment & Recreation | 26 (36.1%) | 46 (63.9%) |
| Accommodation & Food Services | 41 (29.1%) | 100 (70.9%) |
| Public Administration | 5 (20.8%) | 19 (79.2%) |
| Total | 354 (45.9%) | 417 (54.1%) |
Education in New Buffalo
School Enrollment in New Buffalo
The most common levels of schooling among the 223 students in New Buffalo are college / undergraduate (65 | 29.1%), middle school (60 | 26.9%), and high school (49 | 22.0%).
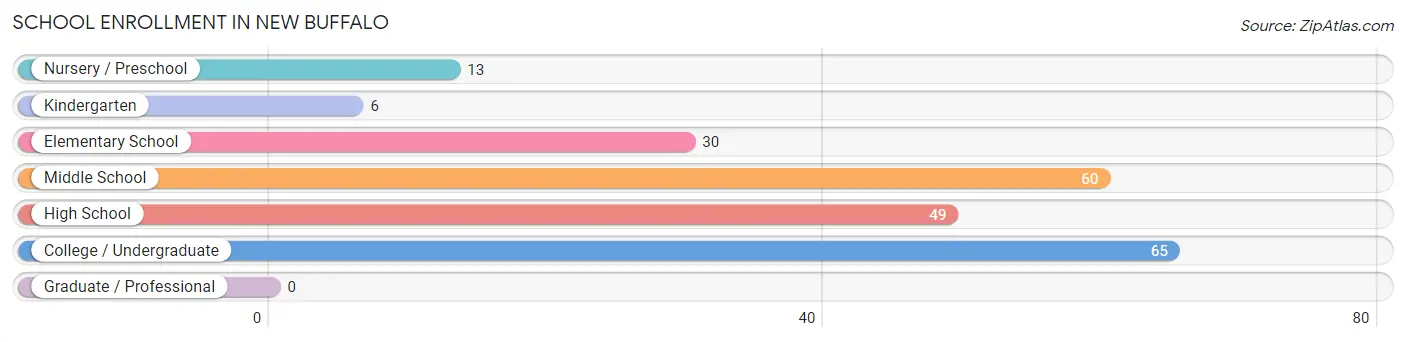
| School Level | # Students | % Students |
| Nursery / Preschool | 13 | 5.8% |
| Kindergarten | 6 | 2.7% |
| Elementary School | 30 | 13.5% |
| Middle School | 60 | 26.9% |
| High School | 49 | 22.0% |
| College / Undergraduate | 65 | 29.1% |
| Graduate / Professional | 0 | 0.0% |
| Total | 223 | 100.0% |
School Enrollment by Age by Funding Source in New Buffalo
Out of a total of 223 students who are enrolled in schools in New Buffalo, 24 (10.8%) attend a private institution, while the remaining 199 (89.2%) are enrolled in public schools. The age group of 5 to 9 year old has the highest likelihood of being enrolled in private schools, with 13 (32.5% in the age bracket) enrolled. Conversely, the age group of 10 to 14 year olds has the lowest likelihood of being enrolled in a private school, with 79 (100.0% in the age bracket) attending a public institution.
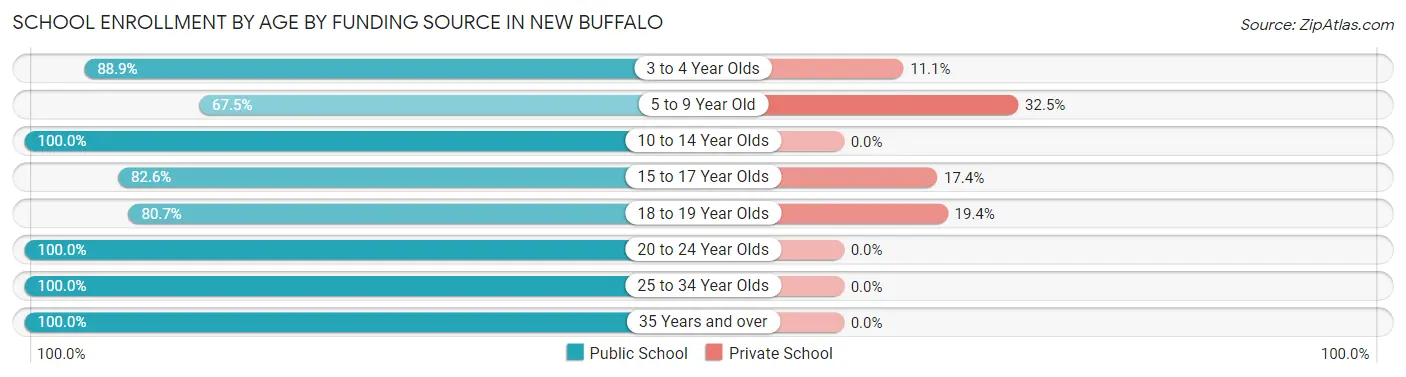
| Age Bracket | Public School | Private School |
| 3 to 4 Year Olds | 8 (88.9%) | 1 (11.1%) |
| 5 to 9 Year Old | 27 (67.5%) | 13 (32.5%) |
| 10 to 14 Year Olds | 79 (100.0%) | 0 (0.0%) |
| 15 to 17 Year Olds | 19 (82.6%) | 4 (17.4%) |
| 18 to 19 Year Olds | 25 (80.6%) | 6 (19.4%) |
| 20 to 24 Year Olds | 14 (100.0%) | 0 (0.0%) |
| 25 to 34 Year Olds | 24 (100.0%) | 0 (0.0%) |
| 35 Years and over | 3 (100.0%) | 0 (0.0%) |
| Total | 199 (89.2%) | 24 (10.8%) |
Educational Attainment by Field of Study in New Buffalo
Education (88 | 20.0%), visual & performing arts (84 | 19.1%), business (68 | 15.4%), liberal arts & history (67 | 15.2%), and social sciences (43 | 9.8%) are the most common fields of study among 440 individuals in New Buffalo who have obtained a bachelor's degree or higher.
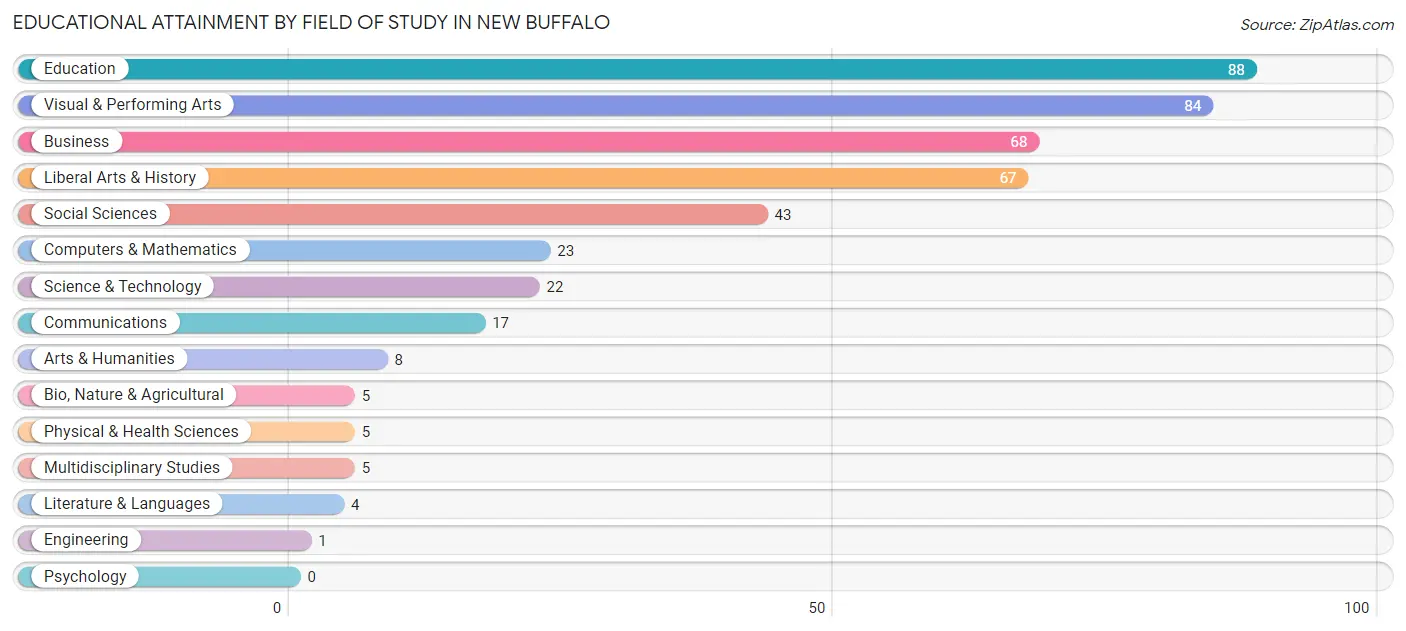
| Field of Study | # Graduates | % Graduates |
| Computers & Mathematics | 23 | 5.2% |
| Bio, Nature & Agricultural | 5 | 1.1% |
| Physical & Health Sciences | 5 | 1.1% |
| Psychology | 0 | 0.0% |
| Social Sciences | 43 | 9.8% |
| Engineering | 1 | 0.2% |
| Multidisciplinary Studies | 5 | 1.1% |
| Science & Technology | 22 | 5.0% |
| Business | 68 | 15.4% |
| Education | 88 | 20.0% |
| Literature & Languages | 4 | 0.9% |
| Liberal Arts & History | 67 | 15.2% |
| Visual & Performing Arts | 84 | 19.1% |
| Communications | 17 | 3.9% |
| Arts & Humanities | 8 | 1.8% |
| Total | 440 | 100.0% |
Transportation & Commute in New Buffalo
Vehicle Availability by Sex in New Buffalo
The most prevalent vehicle ownership categories in New Buffalo are males with 2 vehicles (156, accounting for 45.0%) and females with 2 vehicles (156, making up 37.4%).
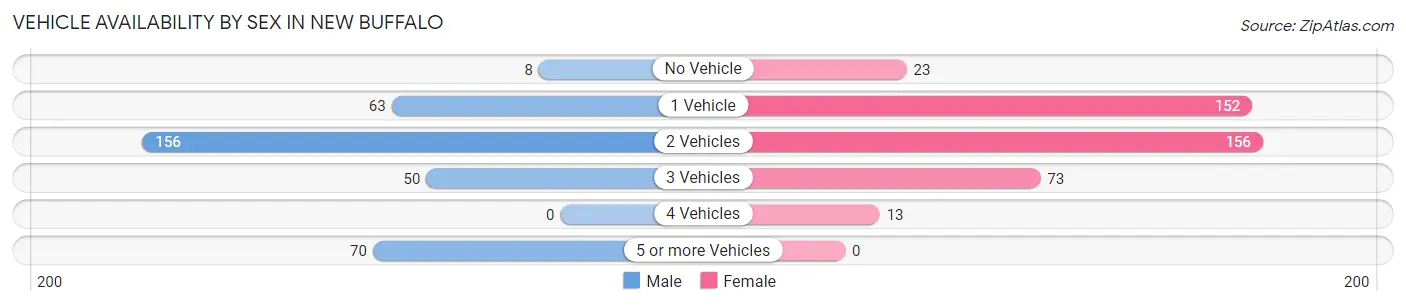
| Vehicles Available | Male | Female |
| No Vehicle | 8 (2.3%) | 23 (5.5%) |
| 1 Vehicle | 63 (18.2%) | 152 (36.4%) |
| 2 Vehicles | 156 (45.0%) | 156 (37.4%) |
| 3 Vehicles | 50 (14.4%) | 73 (17.5%) |
| 4 Vehicles | 0 (0.0%) | 13 (3.1%) |
| 5 or more Vehicles | 70 (20.2%) | 0 (0.0%) |
| Total | 347 (100.0%) | 417 (100.0%) |
Commute Time in New Buffalo
The most frequently occuring commute durations in New Buffalo are less than 5 minutes (146 commuters, 21.6%), 5 to 9 minutes (130 commuters, 19.2%), and 10 to 14 minutes (115 commuters, 17.0%).
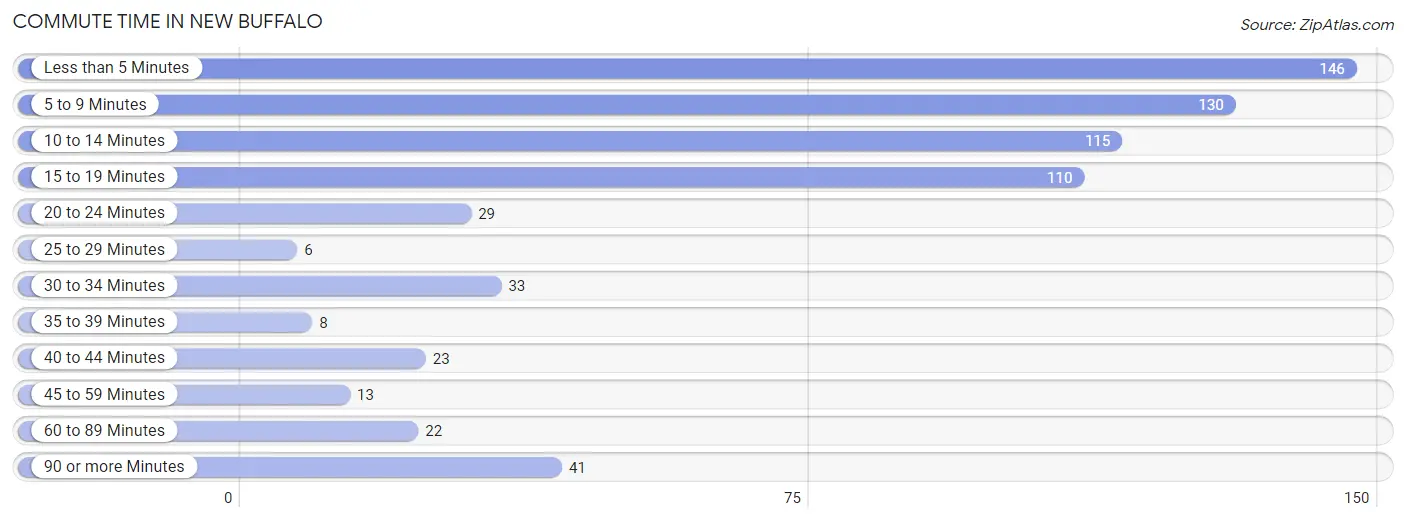
| Commute Time | # Commuters | % Commuters |
| Less than 5 Minutes | 146 | 21.6% |
| 5 to 9 Minutes | 130 | 19.2% |
| 10 to 14 Minutes | 115 | 17.0% |
| 15 to 19 Minutes | 110 | 16.3% |
| 20 to 24 Minutes | 29 | 4.3% |
| 25 to 29 Minutes | 6 | 0.9% |
| 30 to 34 Minutes | 33 | 4.9% |
| 35 to 39 Minutes | 8 | 1.2% |
| 40 to 44 Minutes | 23 | 3.4% |
| 45 to 59 Minutes | 13 | 1.9% |
| 60 to 89 Minutes | 22 | 3.3% |
| 90 or more Minutes | 41 | 6.1% |
Commute Time by Sex in New Buffalo
The most common commute times in New Buffalo are less than 5 minutes (110 commuters, 33.5%) for males and 15 to 19 minutes (79 commuters, 22.7%) for females.
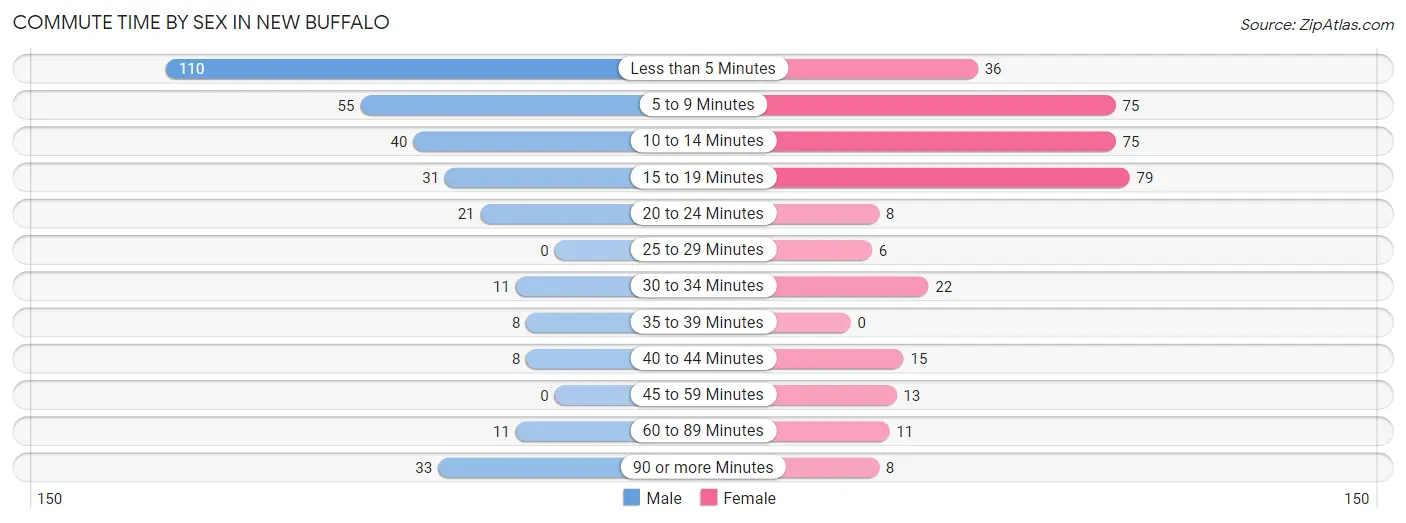
| Commute Time | Male | Female |
| Less than 5 Minutes | 110 (33.5%) | 36 (10.3%) |
| 5 to 9 Minutes | 55 (16.8%) | 75 (21.5%) |
| 10 to 14 Minutes | 40 (12.2%) | 75 (21.5%) |
| 15 to 19 Minutes | 31 (9.5%) | 79 (22.7%) |
| 20 to 24 Minutes | 21 (6.4%) | 8 (2.3%) |
| 25 to 29 Minutes | 0 (0.0%) | 6 (1.7%) |
| 30 to 34 Minutes | 11 (3.4%) | 22 (6.3%) |
| 35 to 39 Minutes | 8 (2.4%) | 0 (0.0%) |
| 40 to 44 Minutes | 8 (2.4%) | 15 (4.3%) |
| 45 to 59 Minutes | 0 (0.0%) | 13 (3.7%) |
| 60 to 89 Minutes | 11 (3.4%) | 11 (3.2%) |
| 90 or more Minutes | 33 (10.1%) | 8 (2.3%) |
Time of Departure to Work by Sex in New Buffalo
The most frequent times of departure to work in New Buffalo are 6:00 AM to 6:29 AM (82, 25.0%) for males and 8:00 AM to 8:29 AM (56, 16.1%) for females.
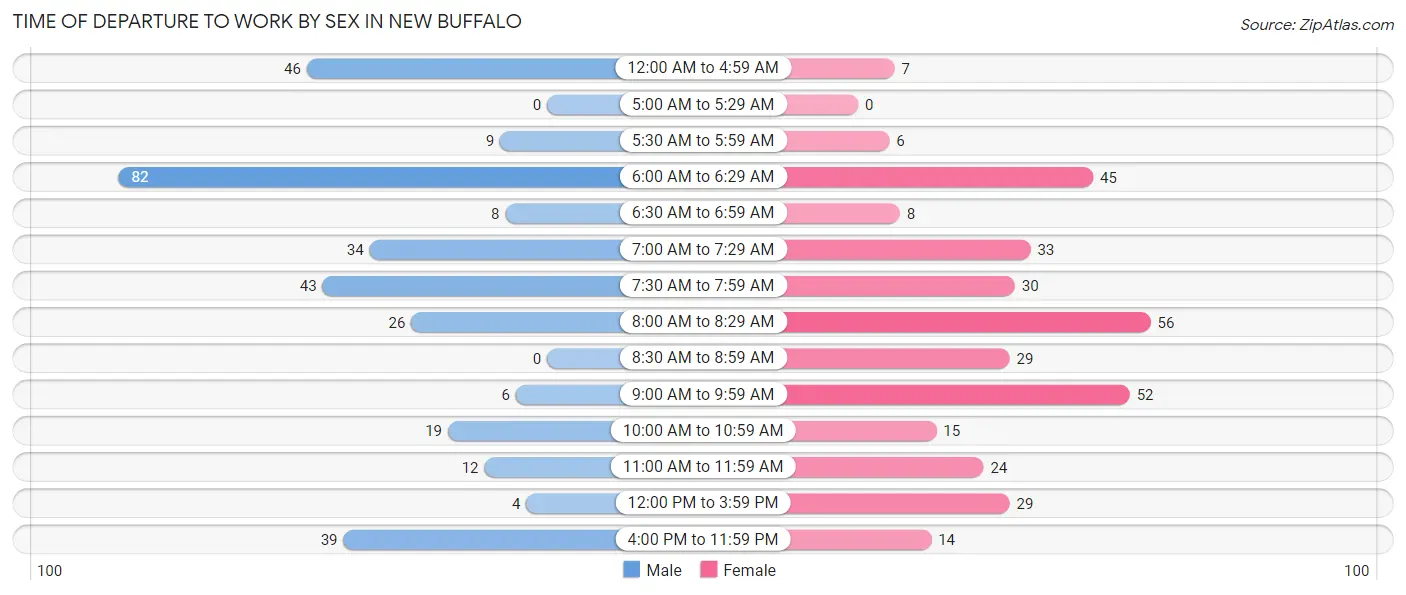
| Time of Departure | Male | Female |
| 12:00 AM to 4:59 AM | 46 (14.0%) | 7 (2.0%) |
| 5:00 AM to 5:29 AM | 0 (0.0%) | 0 (0.0%) |
| 5:30 AM to 5:59 AM | 9 (2.7%) | 6 (1.7%) |
| 6:00 AM to 6:29 AM | 82 (25.0%) | 45 (12.9%) |
| 6:30 AM to 6:59 AM | 8 (2.4%) | 8 (2.3%) |
| 7:00 AM to 7:29 AM | 34 (10.4%) | 33 (9.5%) |
| 7:30 AM to 7:59 AM | 43 (13.1%) | 30 (8.6%) |
| 8:00 AM to 8:29 AM | 26 (7.9%) | 56 (16.1%) |
| 8:30 AM to 8:59 AM | 0 (0.0%) | 29 (8.3%) |
| 9:00 AM to 9:59 AM | 6 (1.8%) | 52 (14.9%) |
| 10:00 AM to 10:59 AM | 19 (5.8%) | 15 (4.3%) |
| 11:00 AM to 11:59 AM | 12 (3.7%) | 24 (6.9%) |
| 12:00 PM to 3:59 PM | 4 (1.2%) | 29 (8.3%) |
| 4:00 PM to 11:59 PM | 39 (11.9%) | 14 (4.0%) |
| Total | 328 (100.0%) | 348 (100.0%) |
Housing Occupancy in New Buffalo
Occupancy by Ownership in New Buffalo
Of the total 732 dwellings in New Buffalo, owner-occupied units account for 572 (78.1%), while renter-occupied units make up 160 (21.9%).
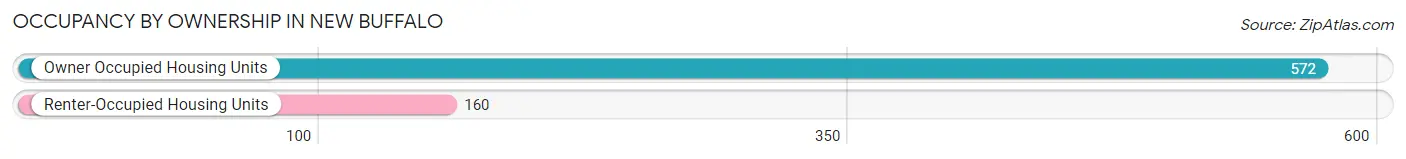
| Occupancy | # Housing Units | % Housing Units |
| Owner Occupied Housing Units | 572 | 78.1% |
| Renter-Occupied Housing Units | 160 | 21.9% |
| Total Occupied Housing Units | 732 | 100.0% |
Occupancy by Household Size in New Buffalo
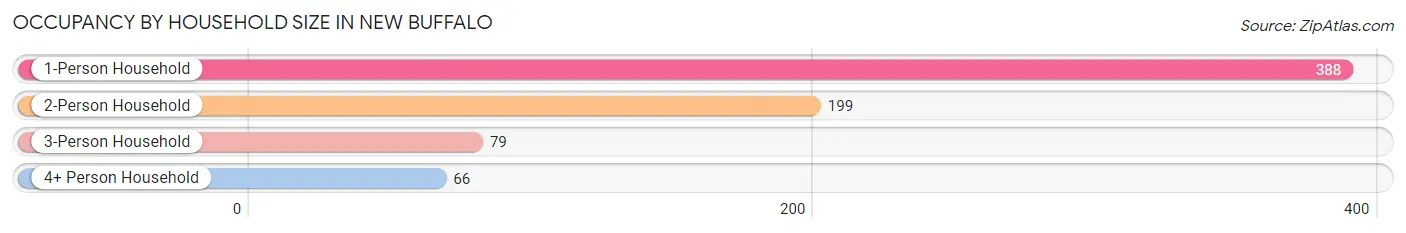
| Household Size | # Housing Units | % Housing Units |
| 1-Person Household | 388 | 53.0% |
| 2-Person Household | 199 | 27.2% |
| 3-Person Household | 79 | 10.8% |
| 4+ Person Household | 66 | 9.0% |
| Total Housing Units | 732 | 100.0% |
Occupancy by Ownership by Household Size in New Buffalo
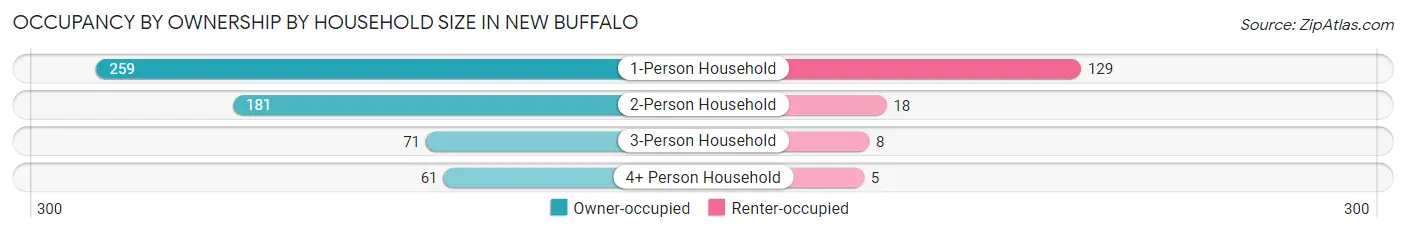
| Household Size | Owner-occupied | Renter-occupied |
| 1-Person Household | 259 (66.7%) | 129 (33.3%) |
| 2-Person Household | 181 (90.9%) | 18 (9.0%) |
| 3-Person Household | 71 (89.9%) | 8 (10.1%) |
| 4+ Person Household | 61 (92.4%) | 5 (7.6%) |
| Total Housing Units | 572 (78.1%) | 160 (21.9%) |
Occupancy by Educational Attainment in New Buffalo
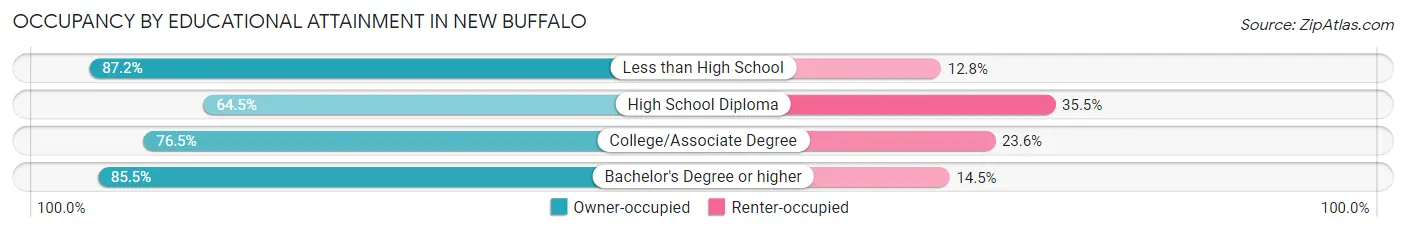
| Household Size | Owner-occupied | Renter-occupied |
| Less than High School | 34 (87.2%) | 5 (12.8%) |
| High School Diploma | 100 (64.5%) | 55 (35.5%) |
| College/Associate Degree | 185 (76.4%) | 57 (23.5%) |
| Bachelor's Degree or higher | 253 (85.5%) | 43 (14.5%) |
Occupancy by Age of Householder in New Buffalo
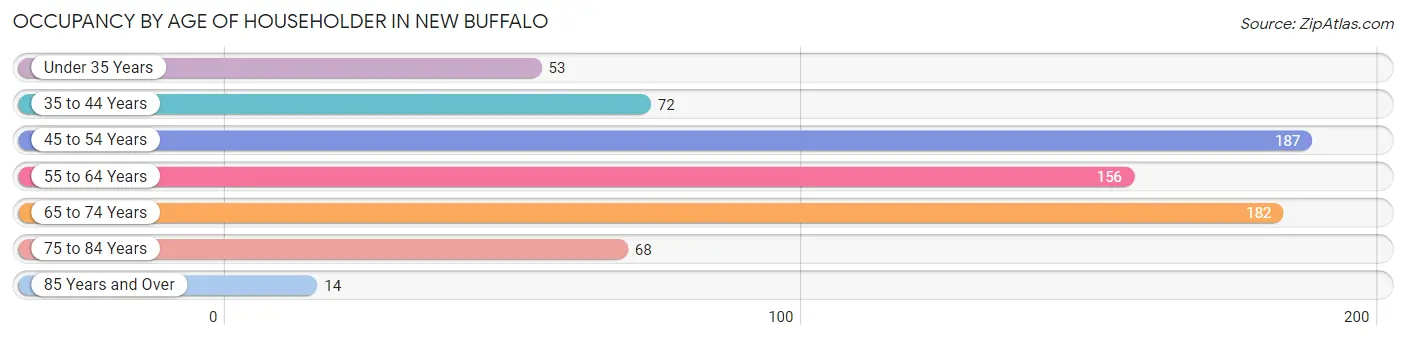
| Age Bracket | # Households | % Households |
| Under 35 Years | 53 | 7.2% |
| 35 to 44 Years | 72 | 9.8% |
| 45 to 54 Years | 187 | 25.6% |
| 55 to 64 Years | 156 | 21.3% |
| 65 to 74 Years | 182 | 24.9% |
| 75 to 84 Years | 68 | 9.3% |
| 85 Years and Over | 14 | 1.9% |
| Total | 732 | 100.0% |
Housing Finances in New Buffalo
Median Income by Occupancy in New Buffalo
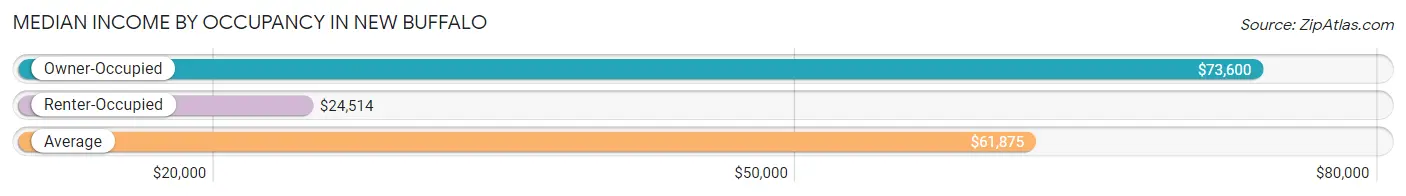
| Occupancy Type | # Households | Median Income |
| Owner-Occupied | 572 (78.1%) | $73,600 |
| Renter-Occupied | 160 (21.9%) | $24,514 |
| Average | 732 (100.0%) | $61,875 |
Occupancy by Householder Income Bracket in New Buffalo
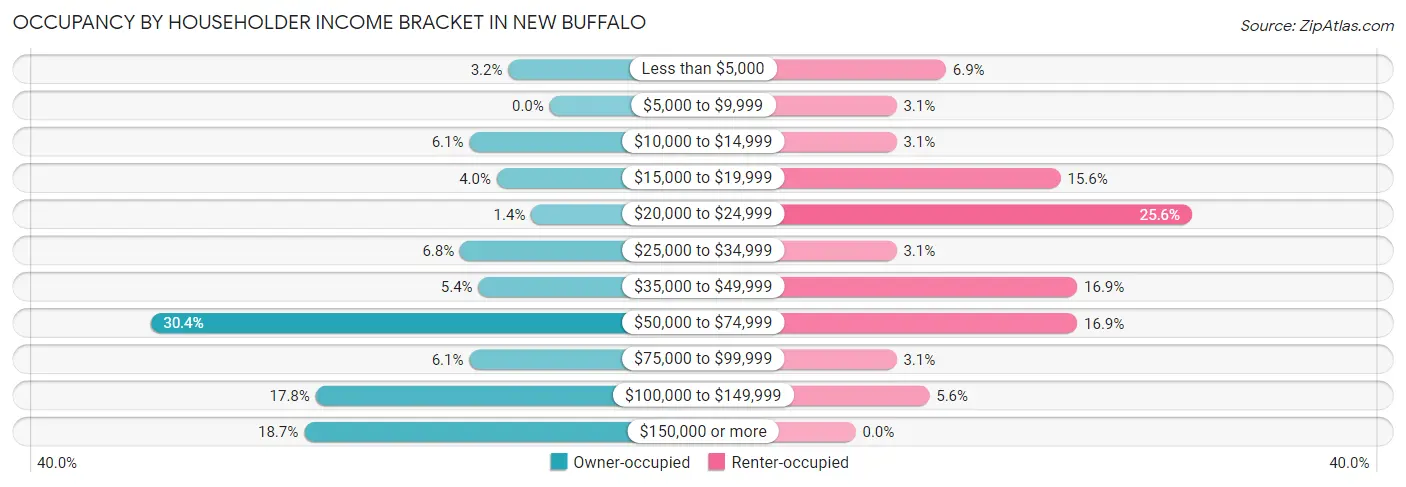
| Income Bracket | Owner-occupied | Renter-occupied |
| Less than $5,000 | 18 (3.2%) | 11 (6.9%) |
| $5,000 to $9,999 | 0 (0.0%) | 5 (3.1%) |
| $10,000 to $14,999 | 35 (6.1%) | 5 (3.1%) |
| $15,000 to $19,999 | 23 (4.0%) | 25 (15.6%) |
| $20,000 to $24,999 | 8 (1.4%) | 41 (25.6%) |
| $25,000 to $34,999 | 39 (6.8%) | 5 (3.1%) |
| $35,000 to $49,999 | 31 (5.4%) | 27 (16.9%) |
| $50,000 to $74,999 | 174 (30.4%) | 27 (16.9%) |
| $75,000 to $99,999 | 35 (6.1%) | 5 (3.1%) |
| $100,000 to $149,999 | 102 (17.8%) | 9 (5.6%) |
| $150,000 or more | 107 (18.7%) | 0 (0.0%) |
| Total | 572 (100.0%) | 160 (100.0%) |
Monthly Housing Cost Tiers in New Buffalo
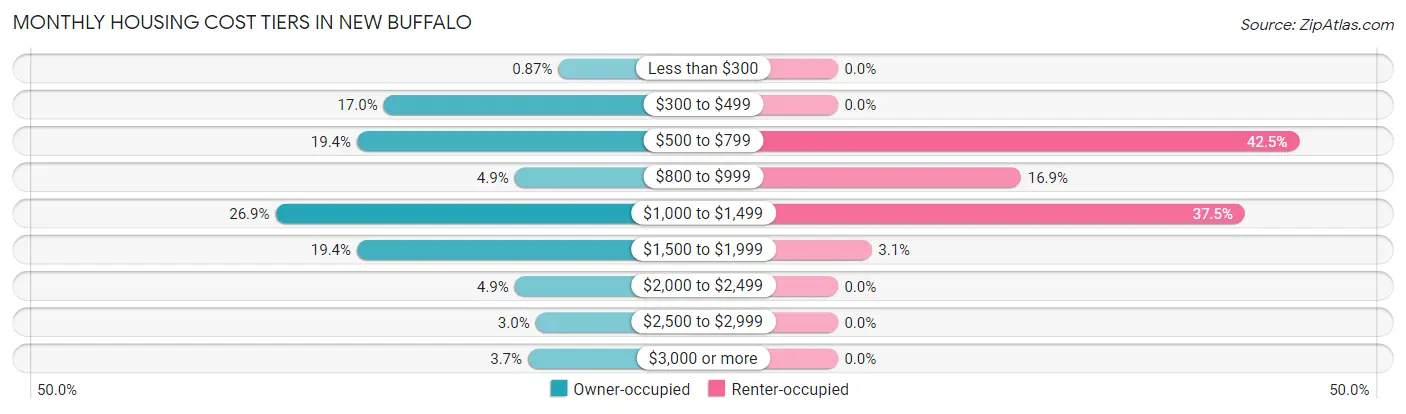
| Monthly Cost | Owner-occupied | Renter-occupied |
| Less than $300 | 5 (0.9%) | 0 (0.0%) |
| $300 to $499 | 97 (17.0%) | 0 (0.0%) |
| $500 to $799 | 111 (19.4%) | 68 (42.5%) |
| $800 to $999 | 28 (4.9%) | 27 (16.9%) |
| $1,000 to $1,499 | 154 (26.9%) | 60 (37.5%) |
| $1,500 to $1,999 | 111 (19.4%) | 5 (3.1%) |
| $2,000 to $2,499 | 28 (4.9%) | 0 (0.0%) |
| $2,500 to $2,999 | 17 (3.0%) | 0 (0.0%) |
| $3,000 or more | 21 (3.7%) | 0 (0.0%) |
| Total | 572 (100.0%) | 160 (100.0%) |
Physical Housing Characteristics in New Buffalo
Housing Structures in New Buffalo
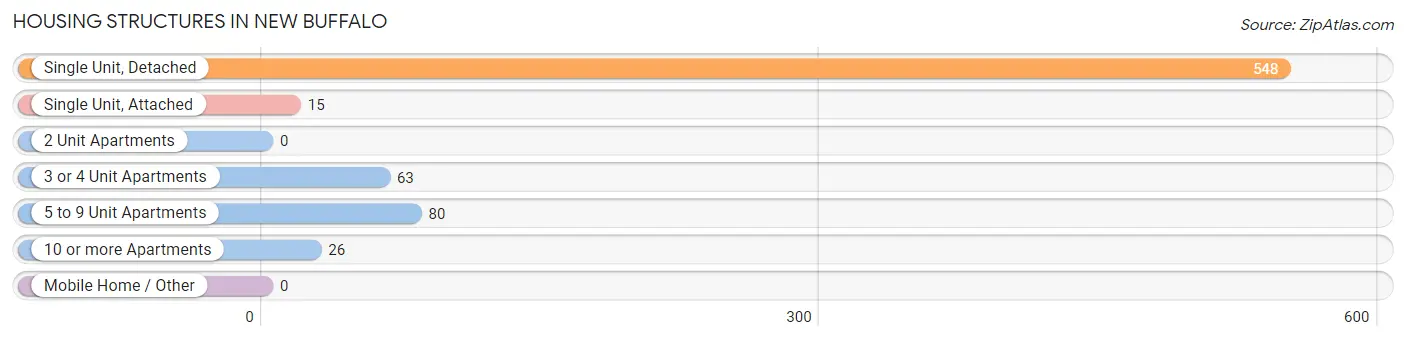
| Structure Type | # Housing Units | % Housing Units |
| Single Unit, Detached | 548 | 74.9% |
| Single Unit, Attached | 15 | 2.1% |
| 2 Unit Apartments | 0 | 0.0% |
| 3 or 4 Unit Apartments | 63 | 8.6% |
| 5 to 9 Unit Apartments | 80 | 10.9% |
| 10 or more Apartments | 26 | 3.5% |
| Mobile Home / Other | 0 | 0.0% |
| Total | 732 | 100.0% |
Housing Structures by Occupancy in New Buffalo
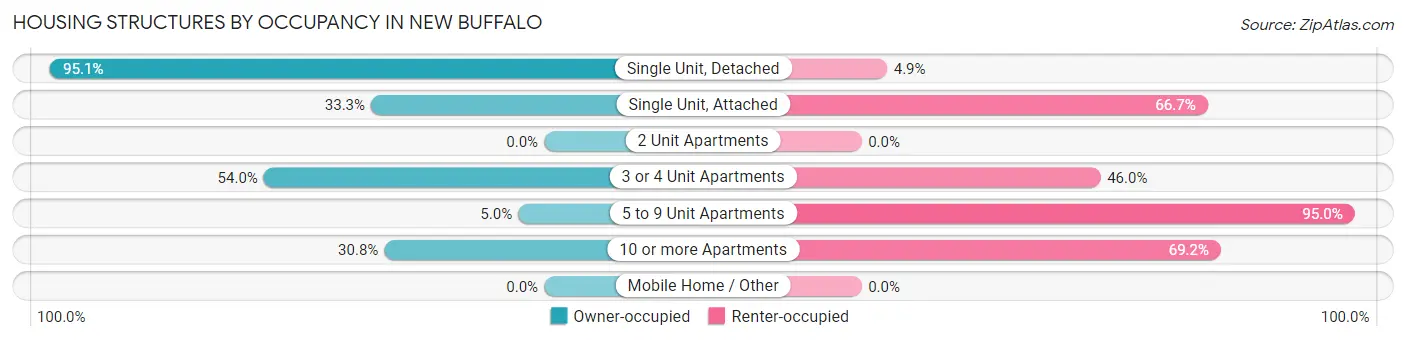
| Structure Type | Owner-occupied | Renter-occupied |
| Single Unit, Detached | 521 (95.1%) | 27 (4.9%) |
| Single Unit, Attached | 5 (33.3%) | 10 (66.7%) |
| 2 Unit Apartments | 0 (0.0%) | 0 (0.0%) |
| 3 or 4 Unit Apartments | 34 (54.0%) | 29 (46.0%) |
| 5 to 9 Unit Apartments | 4 (5.0%) | 76 (95.0%) |
| 10 or more Apartments | 8 (30.8%) | 18 (69.2%) |
| Mobile Home / Other | 0 (0.0%) | 0 (0.0%) |
| Total | 572 (78.1%) | 160 (21.9%) |
Housing Structures by Number of Rooms in New Buffalo
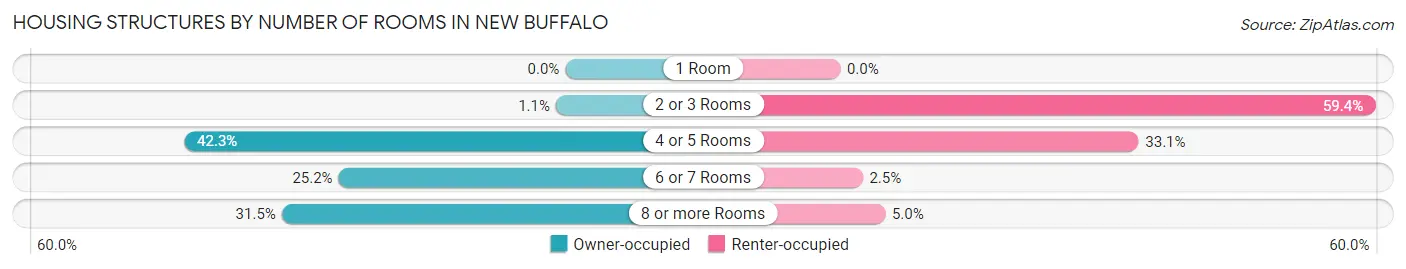
| Number of Rooms | Owner-occupied | Renter-occupied |
| 1 Room | 0 (0.0%) | 0 (0.0%) |
| 2 or 3 Rooms | 6 (1.1%) | 95 (59.4%) |
| 4 or 5 Rooms | 242 (42.3%) | 53 (33.1%) |
| 6 or 7 Rooms | 144 (25.2%) | 4 (2.5%) |
| 8 or more Rooms | 180 (31.5%) | 8 (5.0%) |
| Total | 572 (100.0%) | 160 (100.0%) |
Housing Structure by Heating Type in New Buffalo
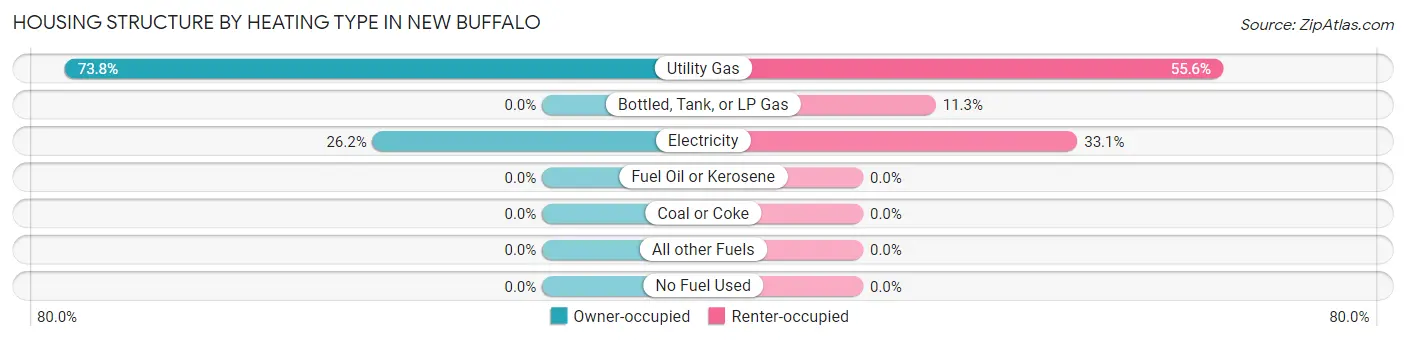
| Heating Type | Owner-occupied | Renter-occupied |
| Utility Gas | 422 (73.8%) | 89 (55.6%) |
| Bottled, Tank, or LP Gas | 0 (0.0%) | 18 (11.3%) |
| Electricity | 150 (26.2%) | 53 (33.1%) |
| Fuel Oil or Kerosene | 0 (0.0%) | 0 (0.0%) |
| Coal or Coke | 0 (0.0%) | 0 (0.0%) |
| All other Fuels | 0 (0.0%) | 0 (0.0%) |
| No Fuel Used | 0 (0.0%) | 0 (0.0%) |
| Total | 572 (100.0%) | 160 (100.0%) |
Household Vehicle Usage in New Buffalo
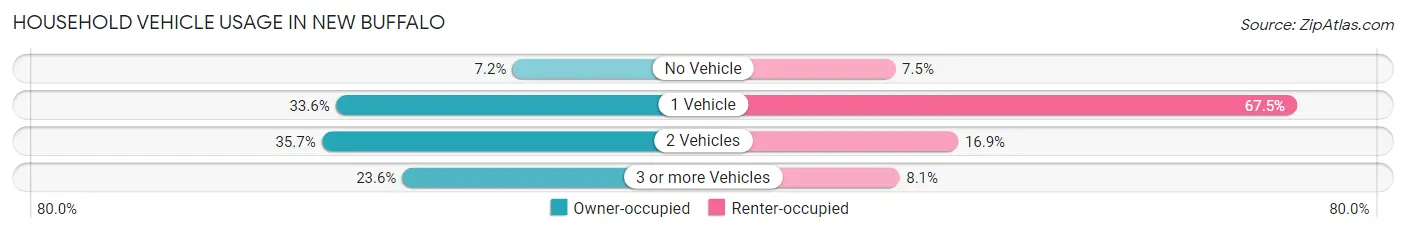
| Vehicles per Household | Owner-occupied | Renter-occupied |
| No Vehicle | 41 (7.2%) | 12 (7.5%) |
| 1 Vehicle | 192 (33.6%) | 108 (67.5%) |
| 2 Vehicles | 204 (35.7%) | 27 (16.9%) |
| 3 or more Vehicles | 135 (23.6%) | 13 (8.1%) |
| Total | 572 (100.0%) | 160 (100.0%) |
Real Estate & Mortgages in New Buffalo
Real Estate and Mortgage Overview in New Buffalo
| Characteristic | Without Mortgage | With Mortgage |
| Housing Units | 243 | 329 |
| Median Property Value | $281,300 | $323,800 |
| Median Household Income | $64,750 | $56 |
| Monthly Housing Costs | $612 | $17 |
| Real Estate Taxes | $2,575 | $5 |
Property Value by Mortgage Status in New Buffalo
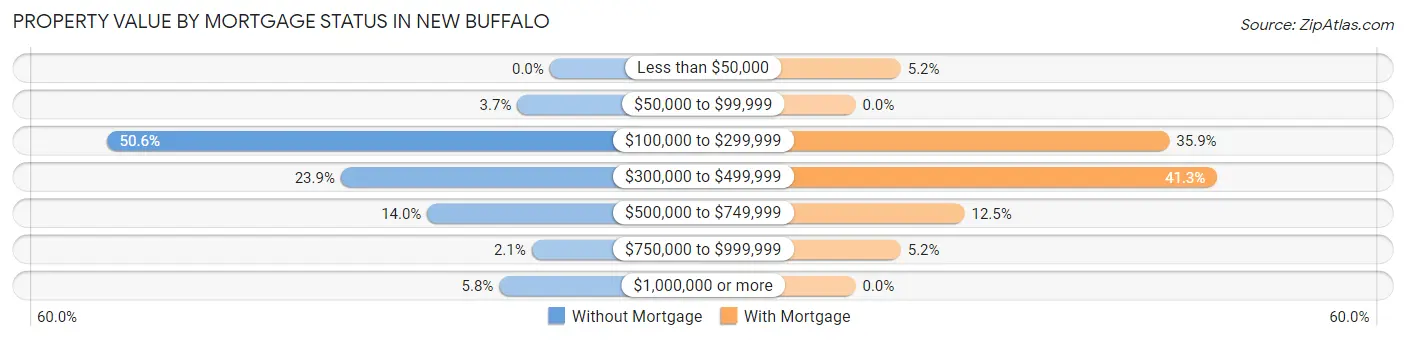
| Property Value | Without Mortgage | With Mortgage |
| Less than $50,000 | 0 (0.0%) | 17 (5.2%) |
| $50,000 to $99,999 | 9 (3.7%) | 0 (0.0%) |
| $100,000 to $299,999 | 123 (50.6%) | 118 (35.9%) |
| $300,000 to $499,999 | 58 (23.9%) | 136 (41.3%) |
| $500,000 to $749,999 | 34 (14.0%) | 41 (12.5%) |
| $750,000 to $999,999 | 5 (2.1%) | 17 (5.2%) |
| $1,000,000 or more | 14 (5.8%) | 0 (0.0%) |
| Total | 243 (100.0%) | 329 (100.0%) |
Household Income by Mortgage Status in New Buffalo
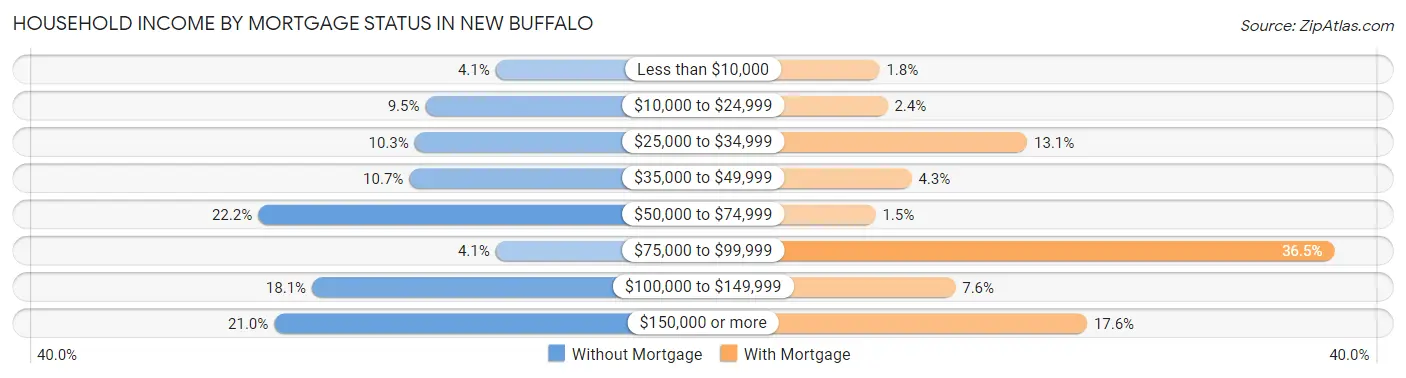
| Household Income | Without Mortgage | With Mortgage |
| Less than $10,000 | 10 (4.1%) | 6 (1.8%) |
| $10,000 to $24,999 | 23 (9.5%) | 8 (2.4%) |
| $25,000 to $34,999 | 25 (10.3%) | 43 (13.1%) |
| $35,000 to $49,999 | 26 (10.7%) | 14 (4.3%) |
| $50,000 to $74,999 | 54 (22.2%) | 5 (1.5%) |
| $75,000 to $99,999 | 10 (4.1%) | 120 (36.5%) |
| $100,000 to $149,999 | 44 (18.1%) | 25 (7.6%) |
| $150,000 or more | 51 (21.0%) | 58 (17.6%) |
| Total | 243 (100.0%) | 329 (100.0%) |
Property Value to Household Income Ratio in New Buffalo
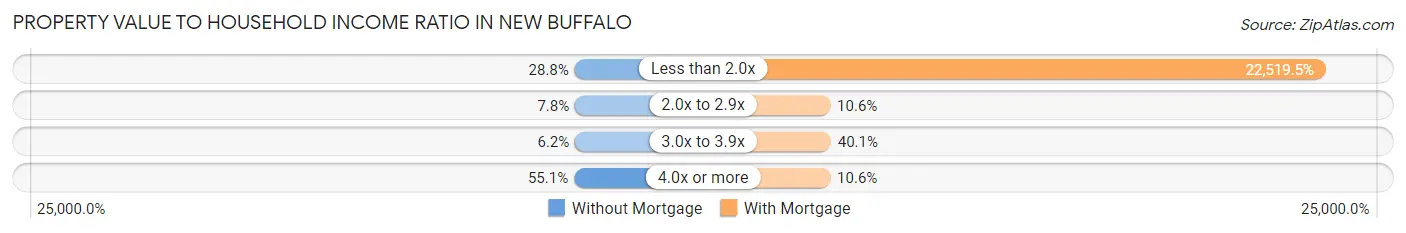
| Value-to-Income Ratio | Without Mortgage | With Mortgage |
| Less than 2.0x | 70 (28.8%) | 74,089 (22,519.5%) |
| 2.0x to 2.9x | 19 (7.8%) | 35 (10.6%) |
| 3.0x to 3.9x | 15 (6.2%) | 132 (40.1%) |
| 4.0x or more | 134 (55.1%) | 35 (10.6%) |
| Total | 243 (100.0%) | 329 (100.0%) |
Real Estate Taxes by Mortgage Status in New Buffalo
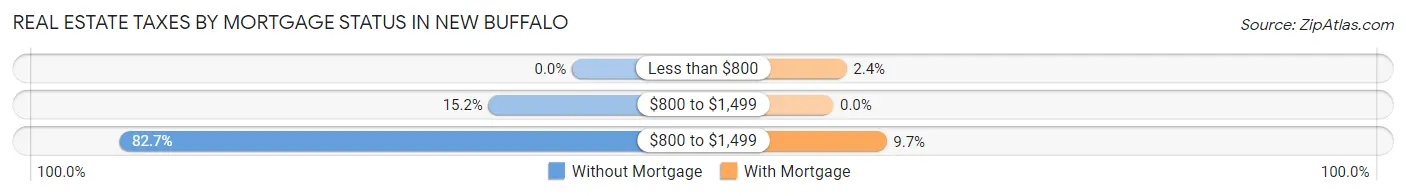
| Property Taxes | Without Mortgage | With Mortgage |
| Less than $800 | 0 (0.0%) | 8 (2.4%) |
| $800 to $1,499 | 37 (15.2%) | 0 (0.0%) |
| $800 to $1,499 | 201 (82.7%) | 32 (9.7%) |
| Total | 243 (100.0%) | 329 (100.0%) |
Health & Disability in New Buffalo
Health Insurance Coverage by Age in New Buffalo
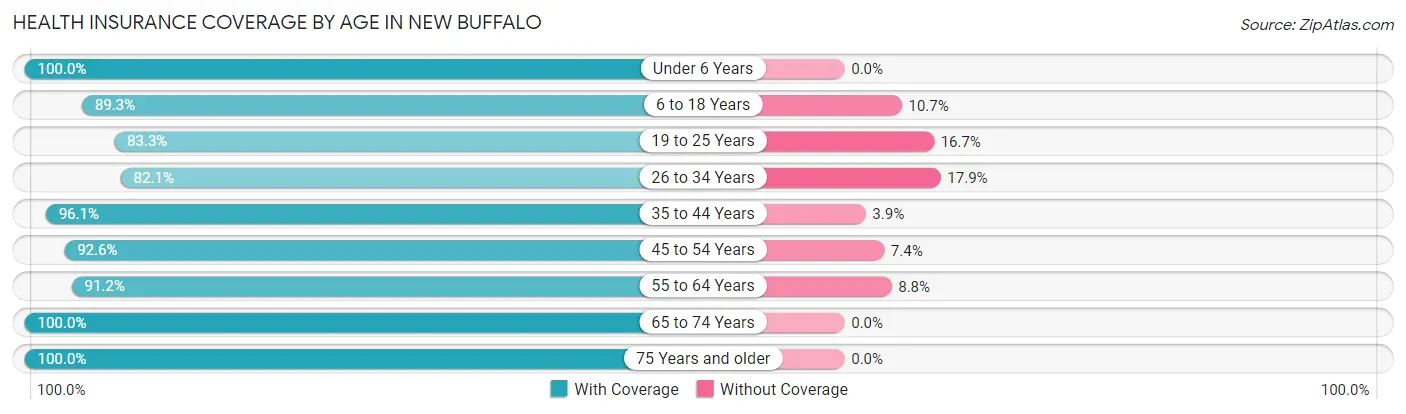
| Age Bracket | With Coverage | Without Coverage |
| Under 6 Years | 47 (100.0%) | 0 (0.0%) |
| 6 to 18 Years | 134 (89.3%) | 16 (10.7%) |
| 19 to 25 Years | 60 (83.3%) | 12 (16.7%) |
| 26 to 34 Years | 87 (82.1%) | 19 (17.9%) |
| 35 to 44 Years | 122 (96.1%) | 5 (3.9%) |
| 45 to 54 Years | 238 (92.6%) | 19 (7.4%) |
| 55 to 64 Years | 198 (91.2%) | 19 (8.8%) |
| 65 to 74 Years | 263 (100.0%) | 0 (0.0%) |
| 75 Years and older | 123 (100.0%) | 0 (0.0%) |
| Total | 1,272 (93.4%) | 90 (6.6%) |
Health Insurance Coverage by Citizenship Status in New Buffalo
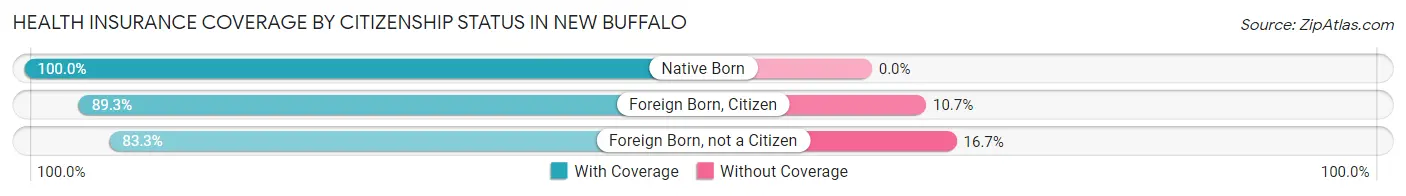
| Citizenship Status | With Coverage | Without Coverage |
| Native Born | 47 (100.0%) | 0 (0.0%) |
| Foreign Born, Citizen | 134 (89.3%) | 16 (10.7%) |
| Foreign Born, not a Citizen | 60 (83.3%) | 12 (16.7%) |
Health Insurance Coverage by Household Income in New Buffalo
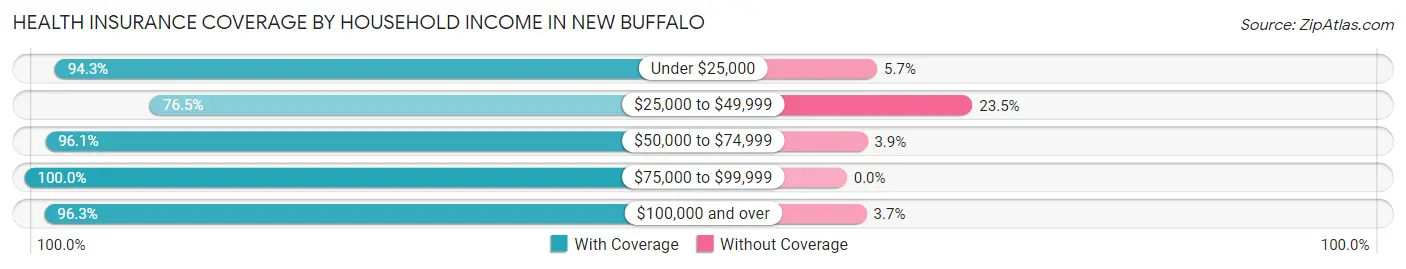
| Household Income | With Coverage | Without Coverage |
| Under $25,000 | 199 (94.3%) | 12 (5.7%) |
| $25,000 to $49,999 | 143 (76.5%) | 44 (23.5%) |
| $50,000 to $74,999 | 273 (96.1%) | 11 (3.9%) |
| $75,000 to $99,999 | 62 (100.0%) | 0 (0.0%) |
| $100,000 and over | 595 (96.3%) | 23 (3.7%) |
Public vs Private Health Insurance Coverage by Age in New Buffalo
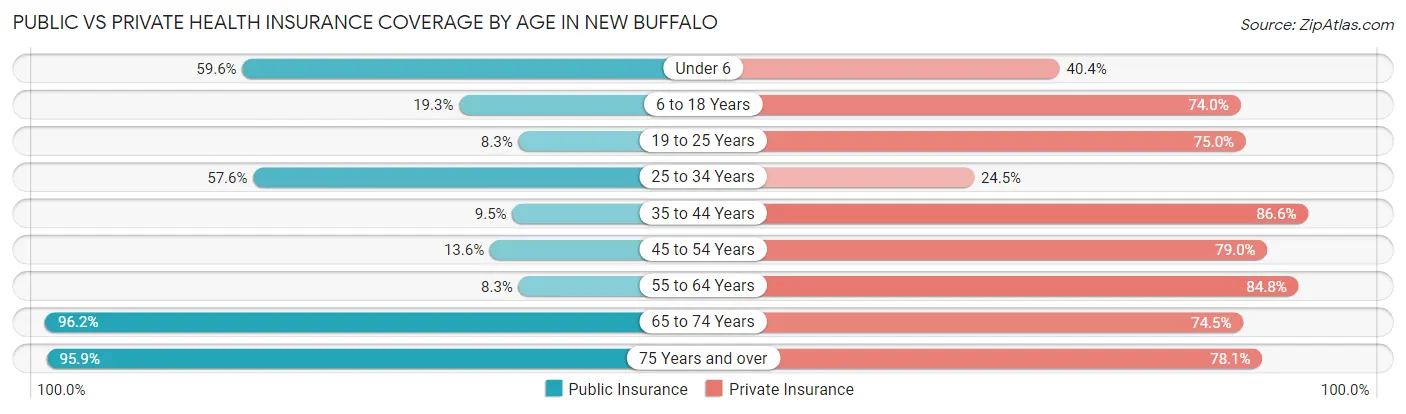
| Age Bracket | Public Insurance | Private Insurance |
| Under 6 | 28 (59.6%) | 19 (40.4%) |
| 6 to 18 Years | 29 (19.3%) | 111 (74.0%) |
| 19 to 25 Years | 6 (8.3%) | 54 (75.0%) |
| 25 to 34 Years | 61 (57.6%) | 26 (24.5%) |
| 35 to 44 Years | 12 (9.5%) | 110 (86.6%) |
| 45 to 54 Years | 35 (13.6%) | 203 (79.0%) |
| 55 to 64 Years | 18 (8.3%) | 184 (84.8%) |
| 65 to 74 Years | 253 (96.2%) | 196 (74.5%) |
| 75 Years and over | 118 (95.9%) | 96 (78.0%) |
| Total | 560 (41.1%) | 999 (73.4%) |
Disability Status by Sex by Age in New Buffalo
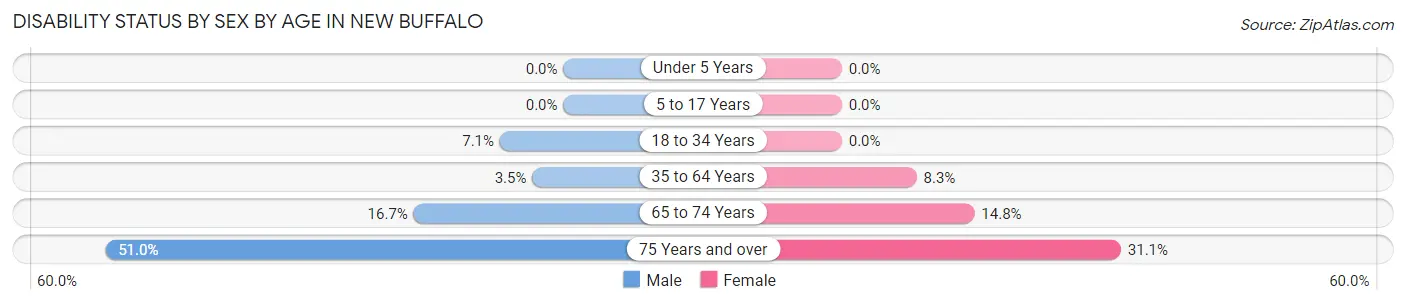
| Age Bracket | Male | Female |
| Under 5 Years | 0 (0.0%) | 0 (0.0%) |
| 5 to 17 Years | 0 (0.0%) | 0 (0.0%) |
| 18 to 34 Years | 7 (7.1%) | 0 (0.0%) |
| 35 to 64 Years | 10 (3.5%) | 26 (8.3%) |
| 65 to 74 Years | 19 (16.7%) | 22 (14.8%) |
| 75 Years and over | 25 (51.0%) | 23 (31.1%) |
Disability Class by Sex by Age in New Buffalo
Disability Class: Hearing Difficulty
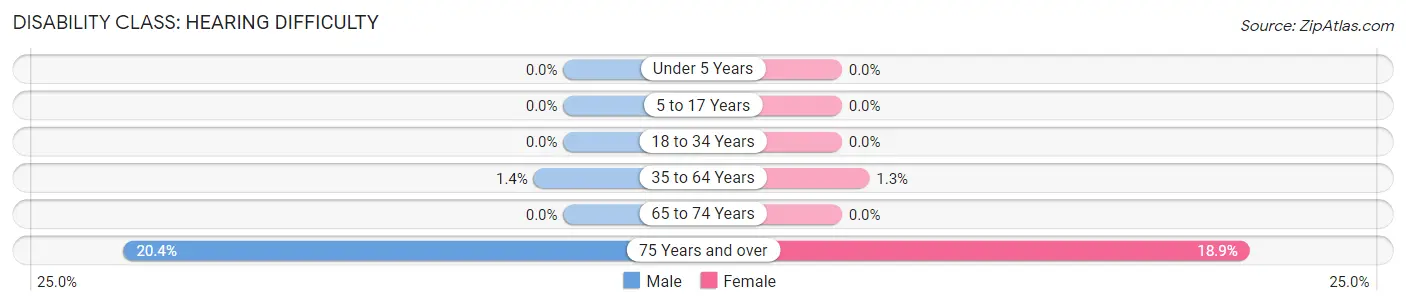
| Age Bracket | Male | Female |
| Under 5 Years | 0 (0.0%) | 0 (0.0%) |
| 5 to 17 Years | 0 (0.0%) | 0 (0.0%) |
| 18 to 34 Years | 0 (0.0%) | 0 (0.0%) |
| 35 to 64 Years | 4 (1.4%) | 4 (1.3%) |
| 65 to 74 Years | 0 (0.0%) | 0 (0.0%) |
| 75 Years and over | 10 (20.4%) | 14 (18.9%) |
Disability Class: Vision Difficulty
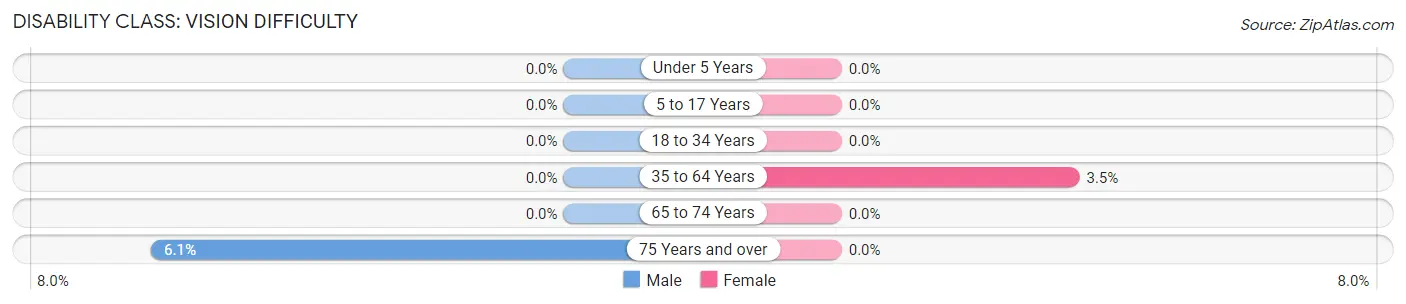
| Age Bracket | Male | Female |
| Under 5 Years | 0 (0.0%) | 0 (0.0%) |
| 5 to 17 Years | 0 (0.0%) | 0 (0.0%) |
| 18 to 34 Years | 0 (0.0%) | 0 (0.0%) |
| 35 to 64 Years | 0 (0.0%) | 11 (3.5%) |
| 65 to 74 Years | 0 (0.0%) | 0 (0.0%) |
| 75 Years and over | 3 (6.1%) | 0 (0.0%) |
Disability Class: Cognitive Difficulty
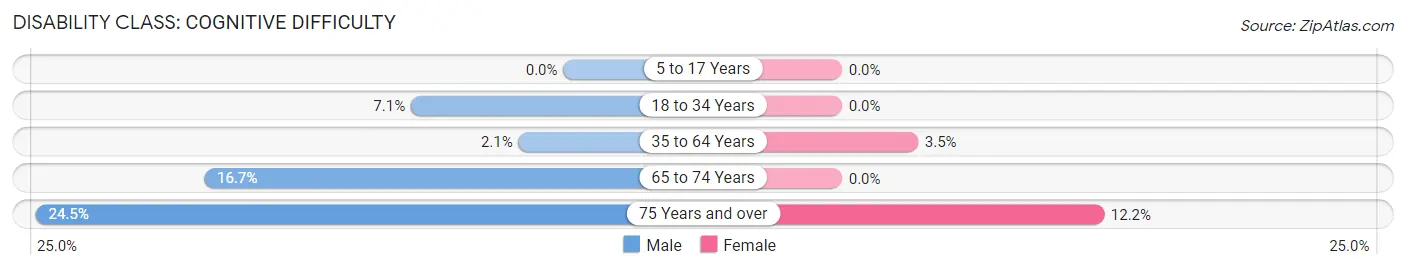
| Age Bracket | Male | Female |
| 5 to 17 Years | 0 (0.0%) | 0 (0.0%) |
| 18 to 34 Years | 7 (7.1%) | 0 (0.0%) |
| 35 to 64 Years | 6 (2.1%) | 11 (3.5%) |
| 65 to 74 Years | 19 (16.7%) | 0 (0.0%) |
| 75 Years and over | 12 (24.5%) | 9 (12.2%) |
Disability Class: Ambulatory Difficulty
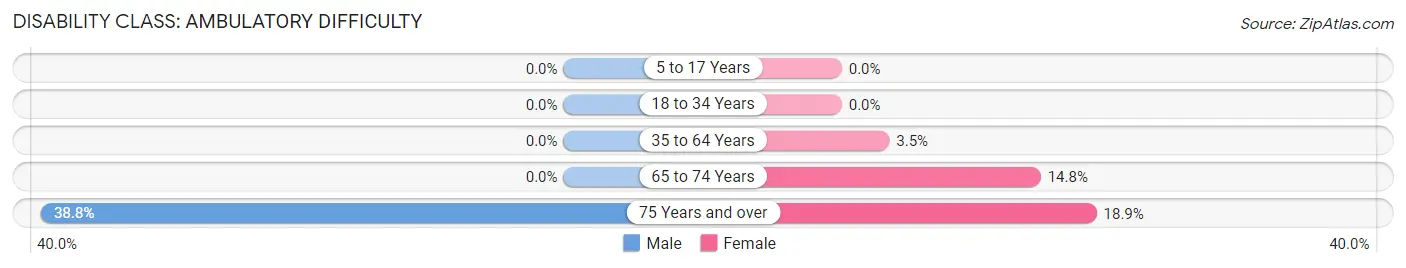
| Age Bracket | Male | Female |
| 5 to 17 Years | 0 (0.0%) | 0 (0.0%) |
| 18 to 34 Years | 0 (0.0%) | 0 (0.0%) |
| 35 to 64 Years | 0 (0.0%) | 11 (3.5%) |
| 65 to 74 Years | 0 (0.0%) | 22 (14.8%) |
| 75 Years and over | 19 (38.8%) | 14 (18.9%) |
Disability Class: Self-Care Difficulty
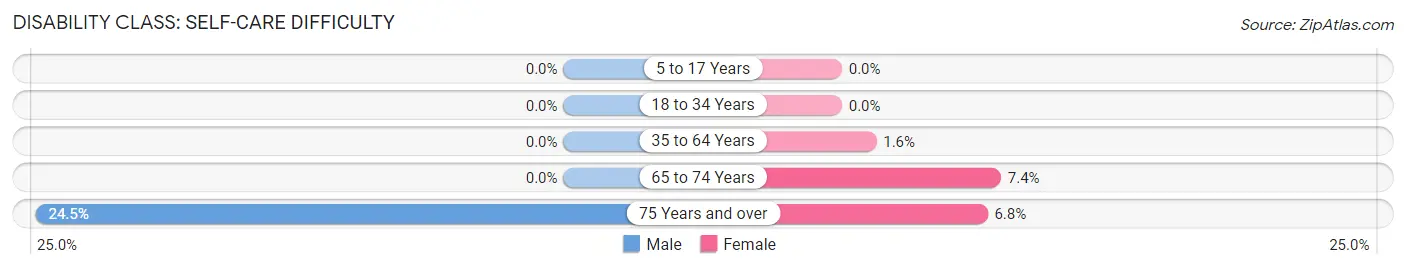
| Age Bracket | Male | Female |
| 5 to 17 Years | 0 (0.0%) | 0 (0.0%) |
| 18 to 34 Years | 0 (0.0%) | 0 (0.0%) |
| 35 to 64 Years | 0 (0.0%) | 5 (1.6%) |
| 65 to 74 Years | 0 (0.0%) | 11 (7.4%) |
| 75 Years and over | 12 (24.5%) | 5 (6.8%) |
Technology Access in New Buffalo
Computing Device Access in New Buffalo
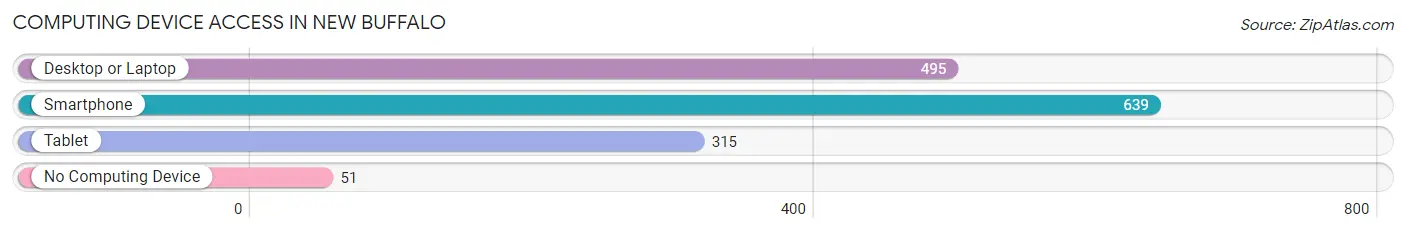
| Device Type | # Households | % Households |
| Desktop or Laptop | 495 | 67.6% |
| Smartphone | 639 | 87.3% |
| Tablet | 315 | 43.0% |
| No Computing Device | 51 | 7.0% |
| Total | 732 | 100.0% |
Internet Access in New Buffalo
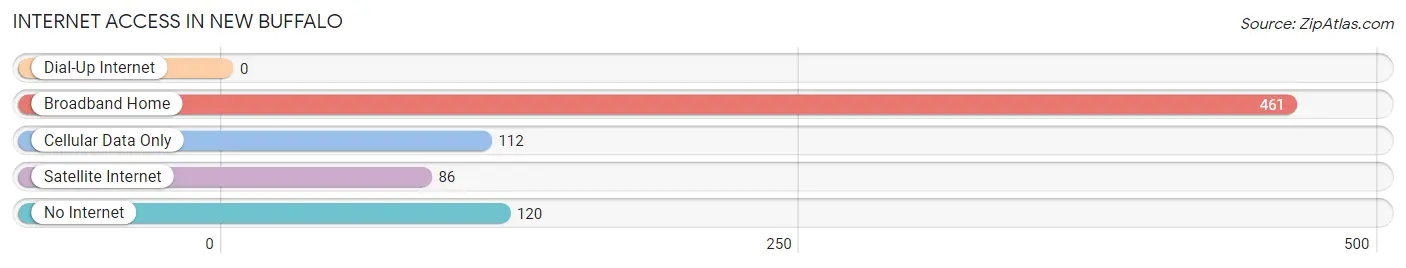
| Internet Type | # Households | % Households |
| Dial-Up Internet | 0 | 0.0% |
| Broadband Home | 461 | 63.0% |
| Cellular Data Only | 112 | 15.3% |
| Satellite Internet | 86 | 11.7% |
| No Internet | 120 | 16.4% |
| Total | 732 | 100.0% |
New Buffalo Summary
New Buffalo, Michigan is a small city located in Berrien County, Michigan, United States. It is situated on the shore of Lake Michigan, approximately 60 miles east of Chicago, Illinois. The city has a population of about 4,500 people and is a popular tourist destination due to its proximity to the lake and its many attractions.
History
The area that is now New Buffalo was first settled in the early 1800s by settlers from New York and Pennsylvania. The first permanent settlement was established in 1834 by a group of Quakers from New York. The settlement was named New Buffalo after the nearby Buffalo Creek. The settlement grew slowly but steadily, and by the mid-1800s, it had become a thriving community.
In 1869, the Michigan Central Railroad arrived in New Buffalo, connecting the city to Chicago and other major cities in the Midwest. This allowed for increased trade and commerce, and the city began to grow rapidly. By the early 1900s, New Buffalo had become a popular tourist destination, with many people coming to enjoy the lake and the city’s many attractions.
Geography
New Buffalo is located in southwestern Michigan, on the shore of Lake Michigan. The city is situated in Berrien County, approximately 60 miles east of Chicago, Illinois. The city is bordered by the cities of Three Oaks and Union Pier to the north, and by the townships of Chikaming and New Buffalo to the south. The city is located on the Galien River, which flows into Lake Michigan.
The city has a total area of 2.2 square miles, all of which is land. The terrain is mostly flat, with some rolling hills in the northern part of the city. The climate is humid continental, with hot summers and cold winters.
Economy
New Buffalo’s economy is largely based on tourism. The city is a popular destination for visitors from Chicago and other nearby cities, who come to enjoy the lake and the city’s many attractions. The city is also home to several businesses, including restaurants, retail stores, and hotels.
The city is also home to several manufacturing companies, including a furniture factory and a boat manufacturing plant. The city is also home to a large marina, which provides services to boaters from all over the Midwest.
Demographics
As of the 2010 census, New Buffalo had a population of 4,500 people. The racial makeup of the city was 94.3% White, 1.2% African American, 0.7% Native American, 0.7% Asian, 0.1% Pacific Islander, and 2.9% from other races. Hispanic or Latino of any race were 4.2% of the population.
The median household income in New Buffalo was $41,250, and the median family income was $50,000. The per capita income for the city was $20,945. About 11.2% of families and 14.2% of the population were below the poverty line, including 18.2% of those under age 18 and 8.2% of those age 65 or over.
New Buffalo is a small city with a rich history and a vibrant economy. The city is a popular tourist destination, and its economy is largely based on tourism. The city is also home to several businesses and manufacturing companies, and its population is diverse and growing.
Common Questions
What is Per Capita Income in New Buffalo?
Per Capita income in New Buffalo is $52,528.
What is the Median Family Income in New Buffalo?
Median Family Income in New Buffalo is $113,333.
What is the Median Household income in New Buffalo?
Median Household Income in New Buffalo is $61,875.
What is Income or Wage Gap in New Buffalo?
Income or Wage Gap in New Buffalo is 54.6%.
Women in New Buffalo earn 45.4 cents for every dollar earned by a man.
What is Family Income Deficit in New Buffalo?
Family Income Deficit in New Buffalo is $7,138.
Families that are below poverty line in New Buffalo earn $7,138 less on average than the poverty threshold level.
What is Inequality or Gini Index in New Buffalo?
Inequality or Gini Index in New Buffalo is 0.53.
What is the Total Population of New Buffalo?
Total Population of New Buffalo is 1,362.
What is the Total Male Population of New Buffalo?
Total Male Population of New Buffalo is 634.
What is the Total Female Population of New Buffalo?
Total Female Population of New Buffalo is 728.
What is the Ratio of Males per 100 Females in New Buffalo?
There are 87.09 Males per 100 Females in New Buffalo.
What is the Ratio of Females per 100 Males in New Buffalo?
There are 114.83 Females per 100 Males in New Buffalo.
What is the Median Population Age in New Buffalo?
Median Population Age in New Buffalo is 51.1 Years.
What is the Average Family Size in New Buffalo
Average Family Size in New Buffalo is 2.9 People.
What is the Average Household Size in New Buffalo
Average Household Size in New Buffalo is 1.9 People.
How Large is the Labor Force in New Buffalo?
There are 781 People in the Labor Forcein in New Buffalo.
What is the Percentage of People in the Labor Force in New Buffalo?
64.8% of People are in the Labor Force in New Buffalo.
What is the Unemployment Rate in New Buffalo?
Unemployment Rate in New Buffalo is 1.3%.