Zip Codes with the Highest Percentage of Population Employed in Accommodation & Food Services in Washington, MI
RELATED REPORTS & OPTIONS
Accommodation & Food Services
Washington
Compare Zip Codes
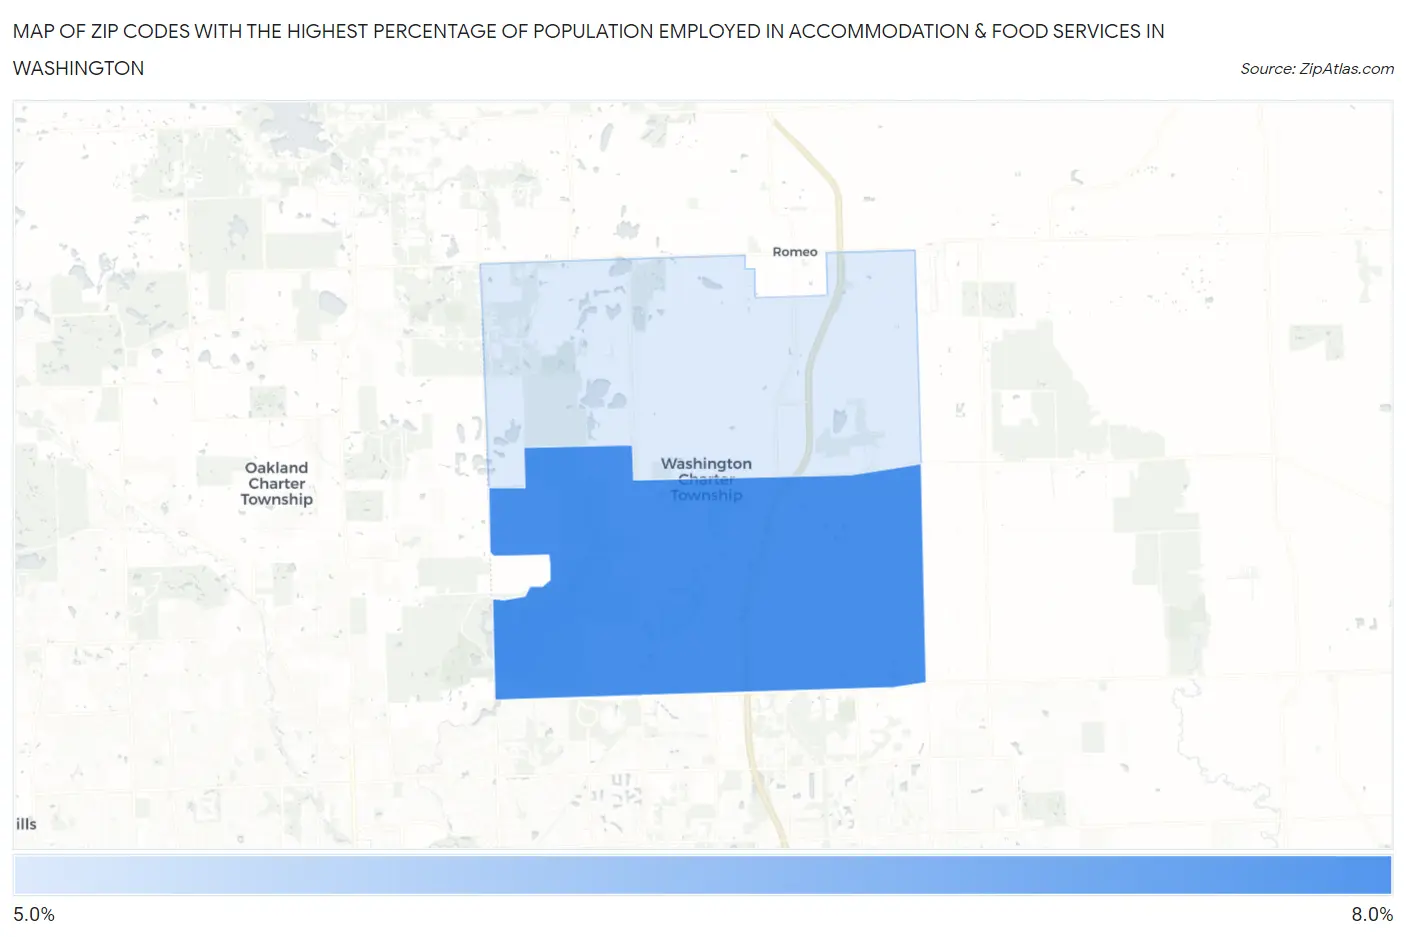
Map of Zip Codes with the Highest Percentage of Population Employed in Accommodation & Food Services in Washington
5.8%
6.5%
Zip Codes with the Highest Percentage of Population Employed in Accommodation & Food Services in Washington, MI
| Zip Code | % Employed | vs State | vs National | |
| 1. | 48094 | 6.5% | 7.1%(-0.633)#463 | 6.9%(-0.430)#12,002 |
| 2. | 48095 | 5.8% | 7.1%(-1.26)#554 | 6.9%(-1.05)#14,007 |
1
Common Questions
What are the Top Zip Codes with the Highest Percentage of Population Employed in Accommodation & Food Services in Washington, MI?
Top Zip Codes with the Highest Percentage of Population Employed in Accommodation & Food Services in Washington, MI are:
What zip code has the Highest Percentage of Population Employed in Accommodation & Food Services in Washington, MI?
48094 has the Highest Percentage of Population Employed in Accommodation & Food Services in Washington, MI with 6.5%.
What is the Percentage of Population Employed in Accommodation & Food Services in Michigan?
Percentage of Population Employed in Accommodation & Food Services in Michigan is 7.1%.
What is the Percentage of Population Employed in Accommodation & Food Services in the United States?
Percentage of Population Employed in Accommodation & Food Services in the United States is 6.9%.