Omer, MI Map & Demographics
Omer Map
Omer Overview
$26,605
PER CAPITA INCOME
$62,500
AVG FAMILY INCOME
$47,917
AVG HOUSEHOLD INCOME
33.1%
WAGE / INCOME GAP [ % ]
66.9¢/ $1
WAGE / INCOME GAP [ $ ]
0.37
INEQUALITY / GINI INDEX
245
TOTAL POPULATION
109
MALE POPULATION
136
FEMALE POPULATION
80.15
MALES / 100 FEMALES
124.77
FEMALES / 100 MALES
56.0
MEDIAN AGE
3.3
AVG FAMILY SIZE
2.5
AVG HOUSEHOLD SIZE
111
LABOR FORCE [ PEOPLE ]
48.9%
PERCENT IN LABOR FORCE
13.5%
UNEMPLOYMENT RATE
Omer Zip Codes
Omer Area Codes
Income in Omer
Income Overview in Omer
Per Capita Income in Omer is $26,605, while median incomes of families and households are $62,500 and $47,917 respectively.
| Characteristic | Number | Measure |
| Per Capita Income | 245 | $26,605 |
| Median Family Income | 56 | $62,500 |
| Mean Family Income | 56 | $71,793 |
| Median Household Income | 100 | $47,917 |
| Mean Household Income | 100 | $57,253 |
| Income Deficit | 56 | $0 |
| Wage / Income Gap (%) | 245 | 33.13% |
| Wage / Income Gap ($) | 245 | 66.87¢ per $1 |
| Gini / Inequality Index | 245 | 0.37 |
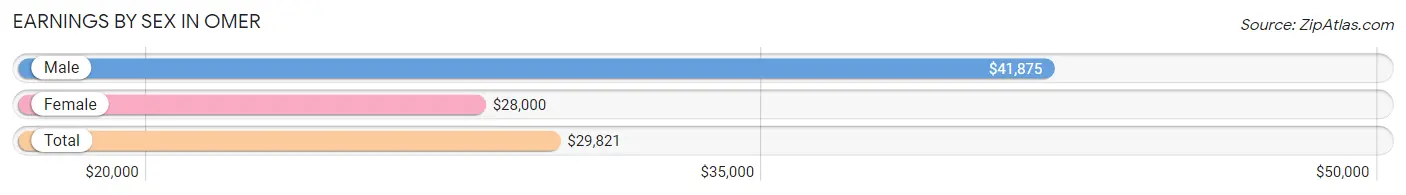
Earnings by Sex in Omer
Average Earnings in Omer are $29,821, $41,875 for men and $28,000 for women, a difference of 33.1%.
| Sex | Number | Average Earnings |
| Male | 49 (41.2%) | $41,875 |
| Female | 70 (58.8%) | $28,000 |
| Total | 119 (100.0%) | $29,821 |
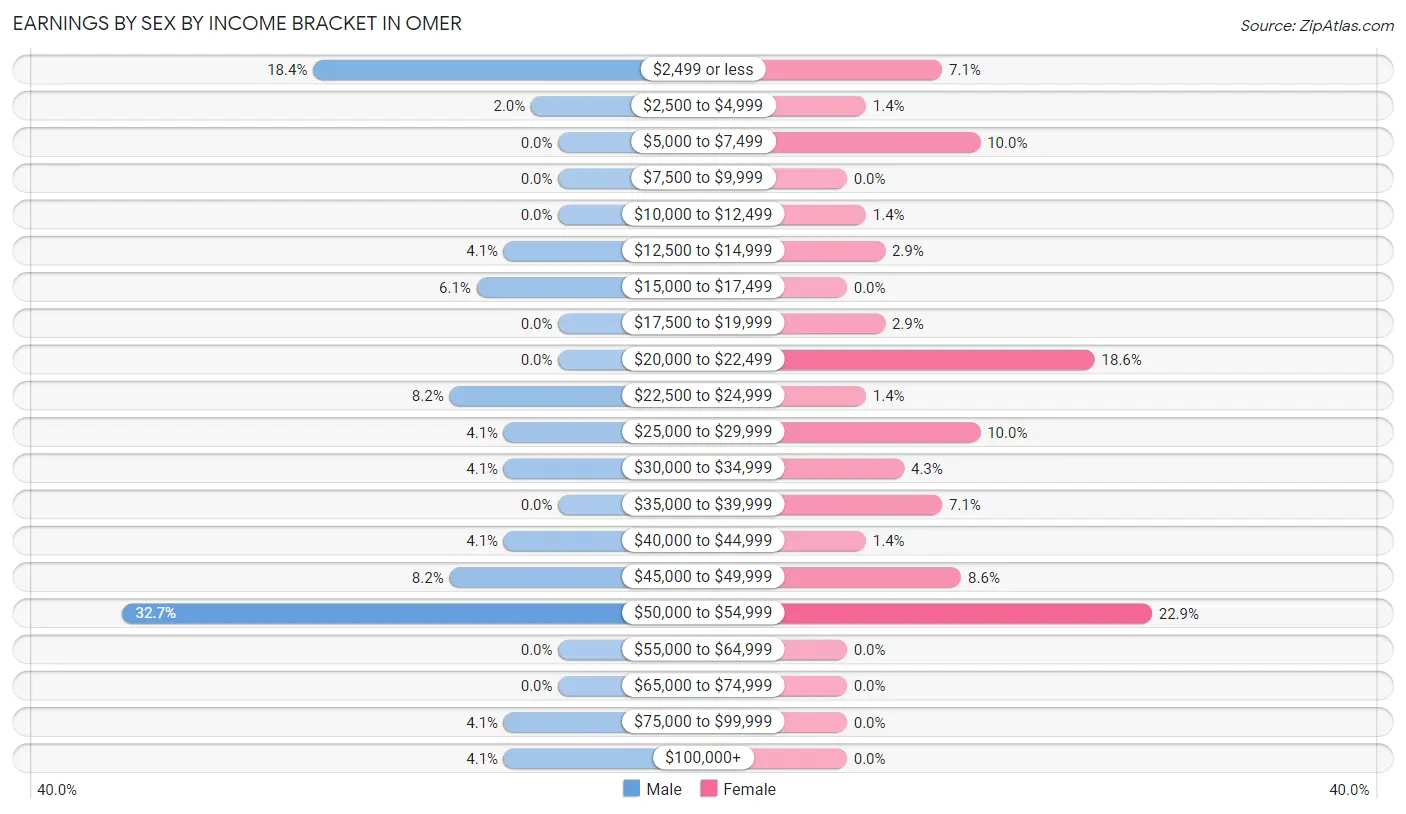
Earnings by Sex by Income Bracket in Omer
The most common earnings brackets in Omer are $50,000 to $54,999 for men (16 | 32.7%) and $50,000 to $54,999 for women (16 | 22.9%).
| Income | Male | Female |
| $2,499 or less | 9 (18.4%) | 5 (7.1%) |
| $2,500 to $4,999 | 1 (2.0%) | 1 (1.4%) |
| $5,000 to $7,499 | 0 (0.0%) | 7 (10.0%) |
| $7,500 to $9,999 | 0 (0.0%) | 0 (0.0%) |
| $10,000 to $12,499 | 0 (0.0%) | 1 (1.4%) |
| $12,500 to $14,999 | 2 (4.1%) | 2 (2.9%) |
| $15,000 to $17,499 | 3 (6.1%) | 0 (0.0%) |
| $17,500 to $19,999 | 0 (0.0%) | 2 (2.9%) |
| $20,000 to $22,499 | 0 (0.0%) | 13 (18.6%) |
| $22,500 to $24,999 | 4 (8.2%) | 1 (1.4%) |
| $25,000 to $29,999 | 2 (4.1%) | 7 (10.0%) |
| $30,000 to $34,999 | 2 (4.1%) | 3 (4.3%) |
| $35,000 to $39,999 | 0 (0.0%) | 5 (7.1%) |
| $40,000 to $44,999 | 2 (4.1%) | 1 (1.4%) |
| $45,000 to $49,999 | 4 (8.2%) | 6 (8.6%) |
| $50,000 to $54,999 | 16 (32.7%) | 16 (22.9%) |
| $55,000 to $64,999 | 0 (0.0%) | 0 (0.0%) |
| $65,000 to $74,999 | 0 (0.0%) | 0 (0.0%) |
| $75,000 to $99,999 | 2 (4.1%) | 0 (0.0%) |
| $100,000+ | 2 (4.1%) | 0 (0.0%) |
| Total | 49 (100.0%) | 70 (100.0%) |
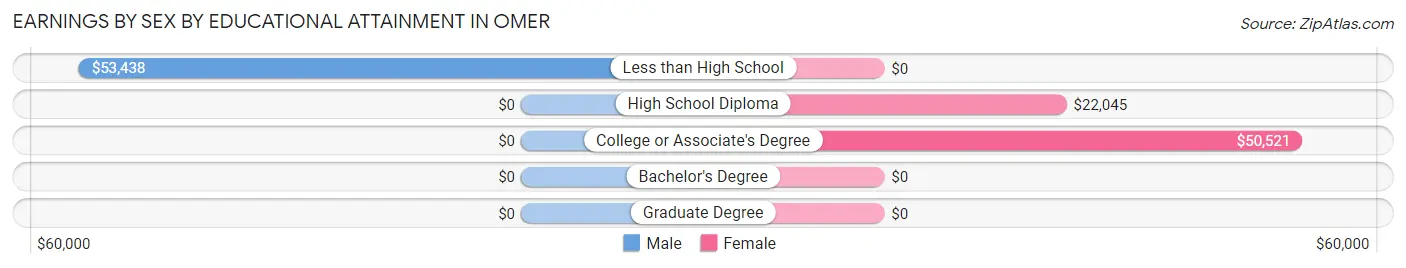
Earnings by Sex by Educational Attainment in Omer
Average earnings in Omer are $46,875 for men and $29,750 for women, a difference of 36.5%. Men with an educational attainment of less than high school enjoy the highest average annual earnings of $53,438, while those with less than high school education earn the least with $53,438. Women with an educational attainment of college or associate's degree earn the most with the average annual earnings of $50,521, while those with high school diploma education have the smallest earnings of $22,045.
| Educational Attainment | Male Income | Female Income |
| Less than High School | $53,438 | $0 |
| High School Diploma | - | - |
| College or Associate's Degree | - | - |
| Bachelor's Degree | - | - |
| Graduate Degree | - | - |
| Total | $46,875 | $29,750 |
Family Income in Omer
Family Income Brackets in Omer
According to the Omer family income data, there are 17 families falling into the $100,000 to $149,999 income range, which is the most common income bracket and makes up 30.4% of all families.
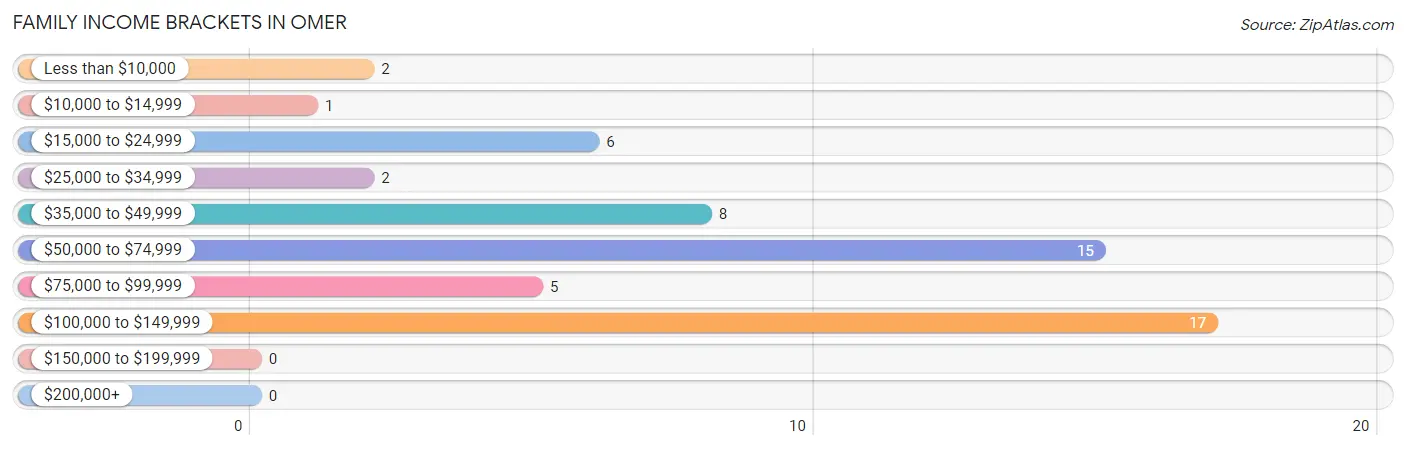
| Income Bracket | # Families | % Families |
| Less than $10,000 | 2 | 3.6% |
| $10,000 to $14,999 | 1 | 1.8% |
| $15,000 to $24,999 | 6 | 10.7% |
| $25,000 to $34,999 | 2 | 3.6% |
| $35,000 to $49,999 | 8 | 14.3% |
| $50,000 to $74,999 | 15 | 26.8% |
| $75,000 to $99,999 | 5 | 8.9% |
| $100,000 to $149,999 | 17 | 30.4% |
| $150,000 to $199,999 | 0 | 0.0% |
| $200,000+ | 0 | 0.0% |
Family Income by Famaliy Size in Omer
3-person families (7 | 12.5%) account for the highest median family income in Omer with $117,813 per family, while 3-person families (7 | 12.5%) have the highest median income of $39,271 per family member.
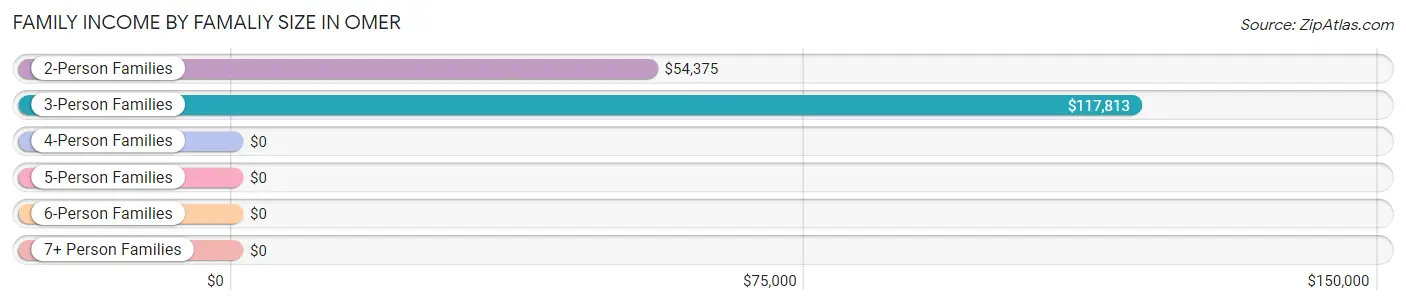
| Income Bracket | # Families | Median Income |
| 2-Person Families | 36 (64.3%) | $54,375 |
| 3-Person Families | 7 (12.5%) | $117,813 |
| 4-Person Families | 5 (8.9%) | $0 |
| 5-Person Families | 7 (12.5%) | $0 |
| 6-Person Families | 1 (1.8%) | $0 |
| 7+ Person Families | 0 (0.0%) | $0 |
| Total | 56 (100.0%) | $62,500 |
Family Income by Number of Earners in Omer
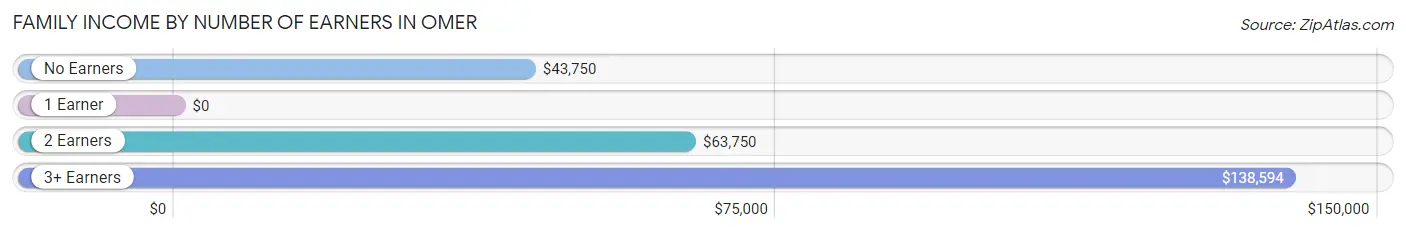
| Number of Earners | # Families | Median Income |
| No Earners | 20 (35.7%) | $43,750 |
| 1 Earner | 17 (30.4%) | $0 |
| 2 Earners | 10 (17.9%) | $63,750 |
| 3+ Earners | 9 (16.1%) | $138,594 |
| Total | 56 (100.0%) | $62,500 |
Household Income in Omer
Household Income Brackets in Omer
With 22 households falling in the category, the $15,000 to $24,999 income range is the most frequent in Omer, accounting for 22.0% of all households.
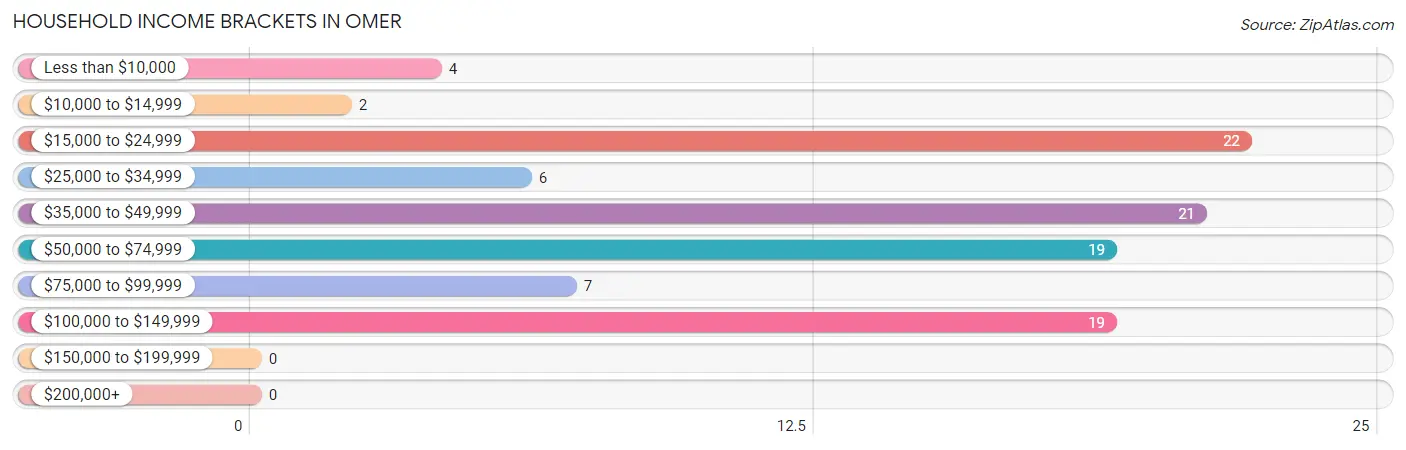
| Income Bracket | # Households | % Households |
| Less than $10,000 | 4 | 4.0% |
| $10,000 to $14,999 | 2 | 2.0% |
| $15,000 to $24,999 | 22 | 22.0% |
| $25,000 to $34,999 | 6 | 6.0% |
| $35,000 to $49,999 | 21 | 21.0% |
| $50,000 to $74,999 | 19 | 19.0% |
| $75,000 to $99,999 | 7 | 7.0% |
| $100,000 to $149,999 | 19 | 19.0% |
| $150,000 to $199,999 | 0 | 0.0% |
| $200,000+ | 0 | 0.0% |
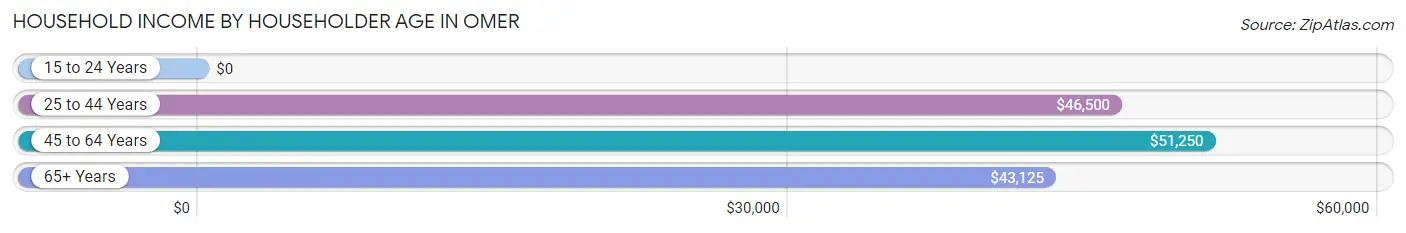
Household Income by Householder Age in Omer
The median household income in Omer is $47,917, with the highest median household income of $51,250 found in the 45 to 64 years age bracket for the primary householder. A total of 46 households (46.0%) fall into this category.
| Income Bracket | # Households | Median Income |
| 15 to 24 Years | 0 (0.0%) | $0 |
| 25 to 44 Years | 16 (16.0%) | $46,500 |
| 45 to 64 Years | 46 (46.0%) | $51,250 |
| 65+ Years | 38 (38.0%) | $43,125 |
| Total | 100 (100.0%) | $47,917 |
Poverty in Omer
Income Below Poverty by Sex and Age in Omer
With 14.7% poverty level for males and 2.2% for females among the residents of Omer, 55 to 64 year old males and 65 to 74 year old females are the most vulnerable to poverty, with 7 males (33.3%) and 2 females (6.2%) in their respective age groups living below the poverty level.
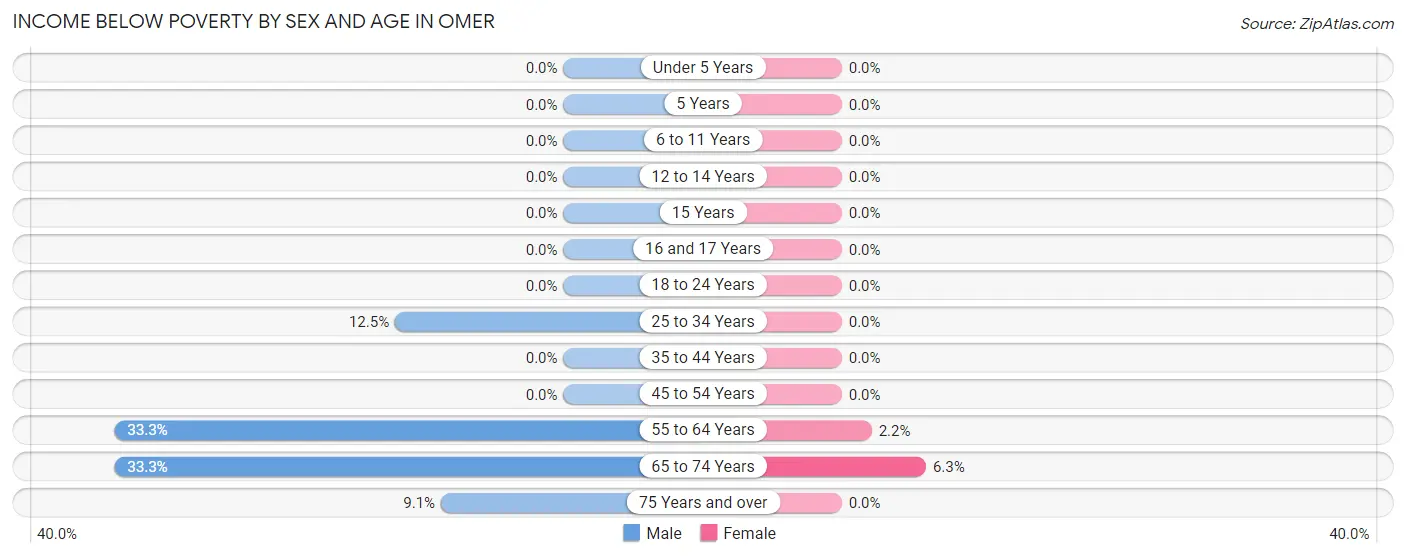
| Age Bracket | Male | Female |
| Under 5 Years | 0 (0.0%) | 0 (0.0%) |
| 5 Years | 0 (0.0%) | 0 (0.0%) |
| 6 to 11 Years | 0 (0.0%) | 0 (0.0%) |
| 12 to 14 Years | 0 (0.0%) | 0 (0.0%) |
| 15 Years | 0 (0.0%) | 0 (0.0%) |
| 16 and 17 Years | 0 (0.0%) | 0 (0.0%) |
| 18 to 24 Years | 0 (0.0%) | 0 (0.0%) |
| 25 to 34 Years | 2 (12.5%) | 0 (0.0%) |
| 35 to 44 Years | 0 (0.0%) | 0 (0.0%) |
| 45 to 54 Years | 0 (0.0%) | 0 (0.0%) |
| 55 to 64 Years | 7 (33.3%) | 1 (2.2%) |
| 65 to 74 Years | 6 (33.3%) | 2 (6.2%) |
| 75 Years and over | 1 (9.1%) | 0 (0.0%) |
| Total | 16 (14.7%) | 3 (2.2%) |
Income Above Poverty by Sex and Age in Omer
According to the poverty statistics in Omer, males aged 6 to 11 years and females aged 5 years are the age groups that are most secure financially, with 100.0% of males and 100.0% of females in these age groups living above the poverty line.
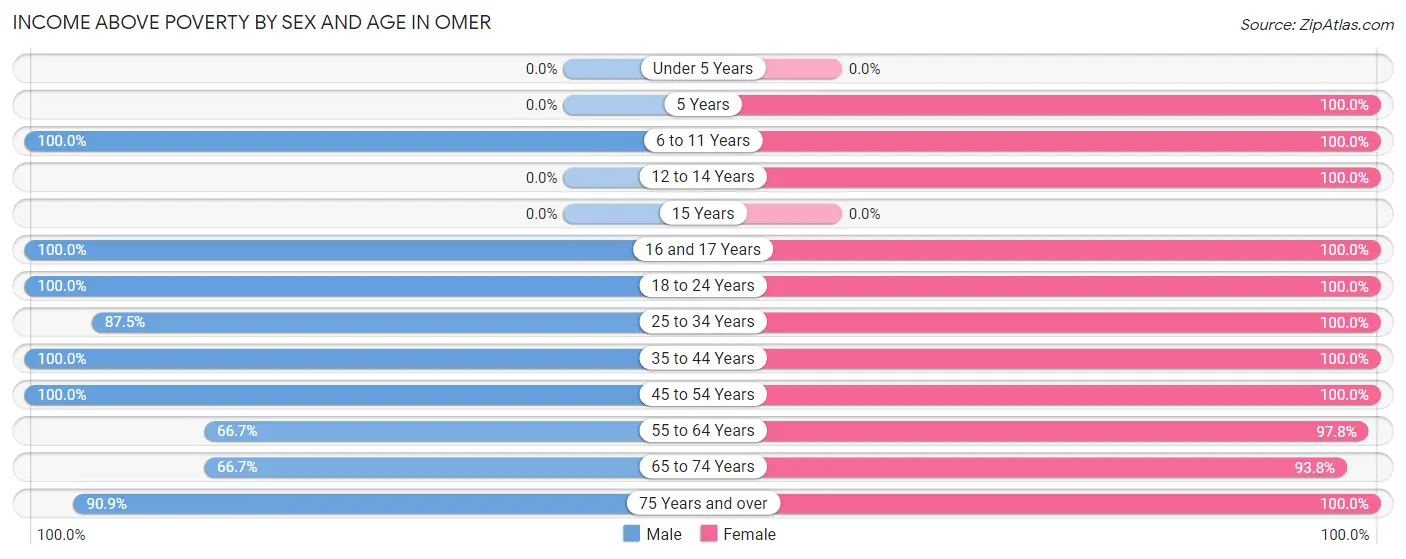
| Age Bracket | Male | Female |
| Under 5 Years | 0 (0.0%) | 0 (0.0%) |
| 5 Years | 0 (0.0%) | 1 (100.0%) |
| 6 to 11 Years | 6 (100.0%) | 5 (100.0%) |
| 12 to 14 Years | 0 (0.0%) | 6 (100.0%) |
| 15 Years | 0 (0.0%) | 0 (0.0%) |
| 16 and 17 Years | 3 (100.0%) | 4 (100.0%) |
| 18 to 24 Years | 14 (100.0%) | 3 (100.0%) |
| 25 to 34 Years | 14 (87.5%) | 5 (100.0%) |
| 35 to 44 Years | 8 (100.0%) | 5 (100.0%) |
| 45 to 54 Years | 12 (100.0%) | 20 (100.0%) |
| 55 to 64 Years | 14 (66.7%) | 44 (97.8%) |
| 65 to 74 Years | 12 (66.7%) | 30 (93.8%) |
| 75 Years and over | 10 (90.9%) | 10 (100.0%) |
| Total | 93 (85.3%) | 133 (97.8%) |
Income Below Poverty Among Married-Couple Families in Omer
The poverty statistics for married-couple families in Omer show that 4.8% or 2 of the total 42 families live below the poverty line. Families with no children have the highest poverty rate of 5.9%, comprising of 2 families. On the other hand, families with 1 or 2 children have the lowest poverty rate of 0.0%, which includes 0 families.
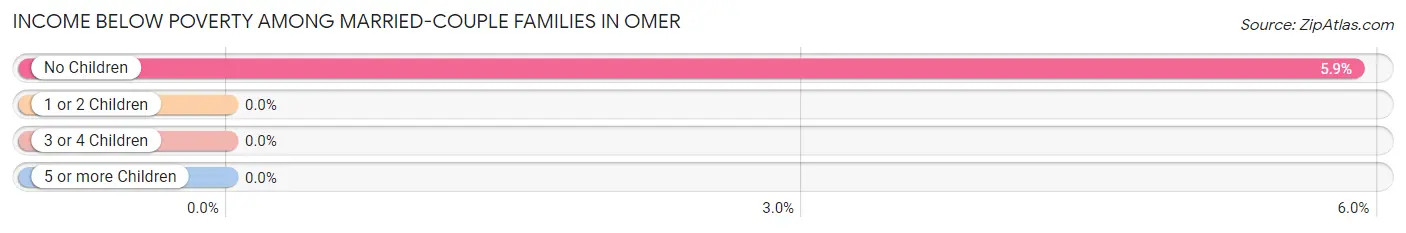
| Children | Above Poverty | Below Poverty |
| No Children | 32 (94.1%) | 2 (5.9%) |
| 1 or 2 Children | 7 (100.0%) | 0 (0.0%) |
| 3 or 4 Children | 1 (100.0%) | 0 (0.0%) |
| 5 or more Children | 0 (0.0%) | 0 (0.0%) |
| Total | 40 (95.2%) | 2 (4.8%) |
Income Below Poverty Among Single-Parent Households in Omer
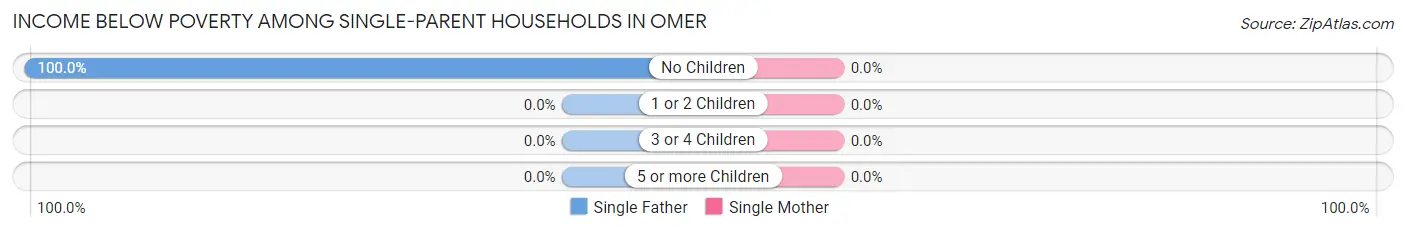
| Children | Single Father | Single Mother |
| No Children | 1 (100.0%) | 0 (0.0%) |
| 1 or 2 Children | 0 (0.0%) | 0 (0.0%) |
| 3 or 4 Children | 0 (0.0%) | 0 (0.0%) |
| 5 or more Children | 0 (0.0%) | 0 (0.0%) |
| Total | 1 (33.3%) | 0 (0.0%) |
Income Below Poverty Among Married-Couple vs Single-Parent Households in Omer
The poverty data for Omer shows that 2 of the married-couple family households (4.8%) and 1 of the single-parent households (7.1%) are living below the poverty level. Within the married-couple family households, those with no children have the highest poverty rate, with 2 households (5.9%) falling below the poverty line. Among the single-parent households, those with no children have the highest poverty rate, with 1 household (10.0%) living below poverty.
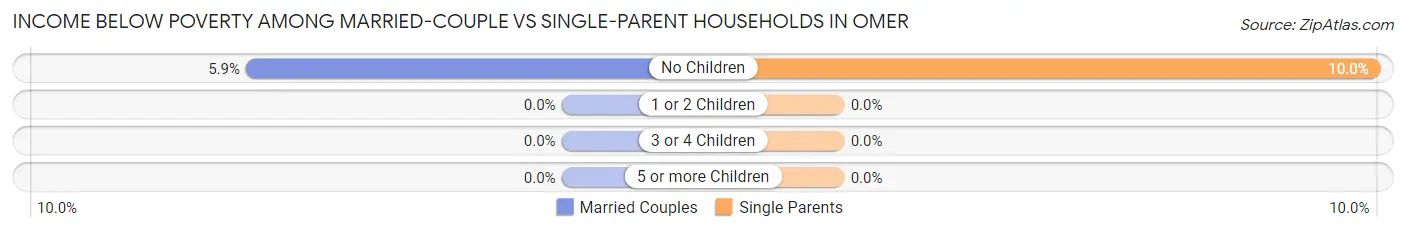
| Children | Married-Couple Families | Single-Parent Households |
| No Children | 2 (5.9%) | 1 (10.0%) |
| 1 or 2 Children | 0 (0.0%) | 0 (0.0%) |
| 3 or 4 Children | 0 (0.0%) | 0 (0.0%) |
| 5 or more Children | 0 (0.0%) | 0 (0.0%) |
| Total | 2 (4.8%) | 1 (7.1%) |
Race in Omer
The most populous races in Omer are White / Caucasian (227 | 92.6%), Native / Alaskan (11 | 4.5%), and Black / African American (5 | 2.0%).
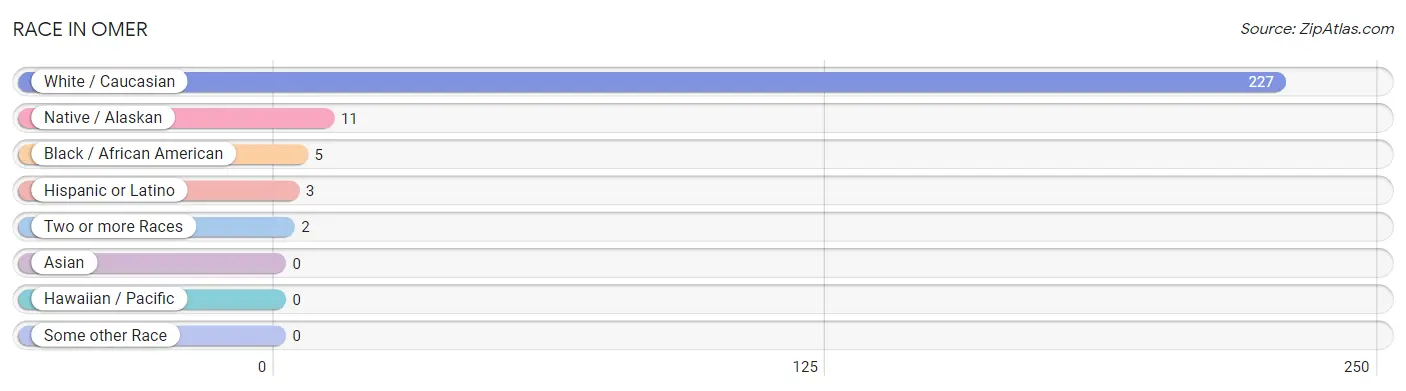
| Race | # Population | % Population |
| Asian | 0 | 0.0% |
| Black / African American | 5 | 2.0% |
| Hawaiian / Pacific | 0 | 0.0% |
| Hispanic or Latino | 3 | 1.2% |
| Native / Alaskan | 11 | 4.5% |
| White / Caucasian | 227 | 92.6% |
| Two or more Races | 2 | 0.8% |
| Some other Race | 0 | 0.0% |
| Total | 245 | 100.0% |
Ancestry in Omer
The most populous ancestries reported in Omer are Polish (44 | 18.0%), Irish (39 | 15.9%), German (27 | 11.0%), English (25 | 10.2%), and Chippewa (11 | 4.5%), together accounting for 59.6% of all Omer residents.
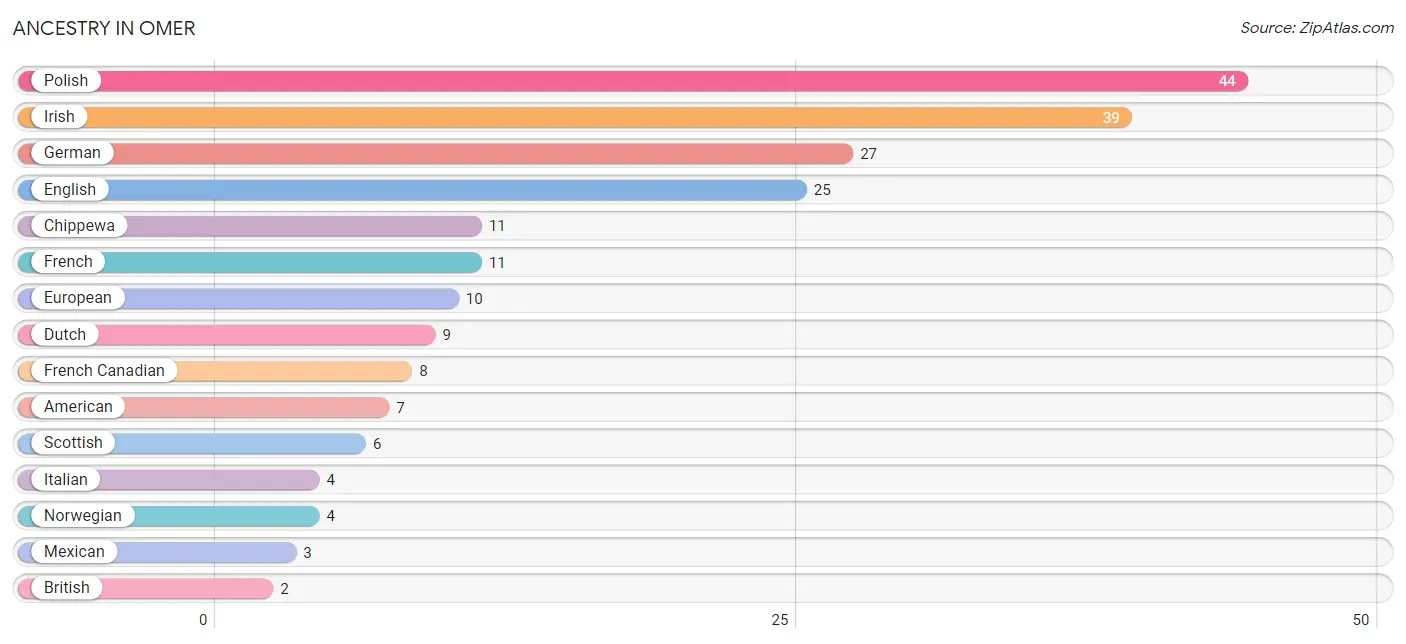
| Ancestry | # Population | % Population |
| American | 7 | 2.9% |
| British | 2 | 0.8% |
| Canadian | 2 | 0.8% |
| Chippewa | 11 | 4.5% |
| Czech | 2 | 0.8% |
| Dutch | 9 | 3.7% |
| English | 25 | 10.2% |
| European | 10 | 4.1% |
| French | 11 | 4.5% |
| French Canadian | 8 | 3.3% |
| German | 27 | 11.0% |
| Irish | 39 | 15.9% |
| Italian | 4 | 1.6% |
| Mexican | 3 | 1.2% |
| Navajo | 1 | 0.4% |
| Norwegian | 4 | 1.6% |
| Polish | 44 | 18.0% |
| Scottish | 6 | 2.5% | View All 18 Rows |
Immigrants in Omer
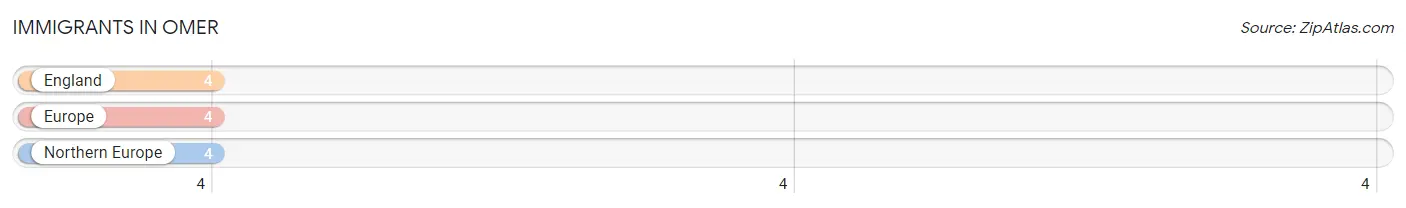
The most numerous immigrant groups reported in Omer came from England (4 | 1.6%), Europe (4 | 1.6%), and Northern Europe (4 | 1.6%), together accounting for 4.9% of all Omer residents.
| Immigration Origin | # Population | % Population |
| England | 4 | 1.6% |
| Europe | 4 | 1.6% |
| Northern Europe | 4 | 1.6% | View All 3 Rows |
Sex and Age in Omer
Sex and Age in Omer
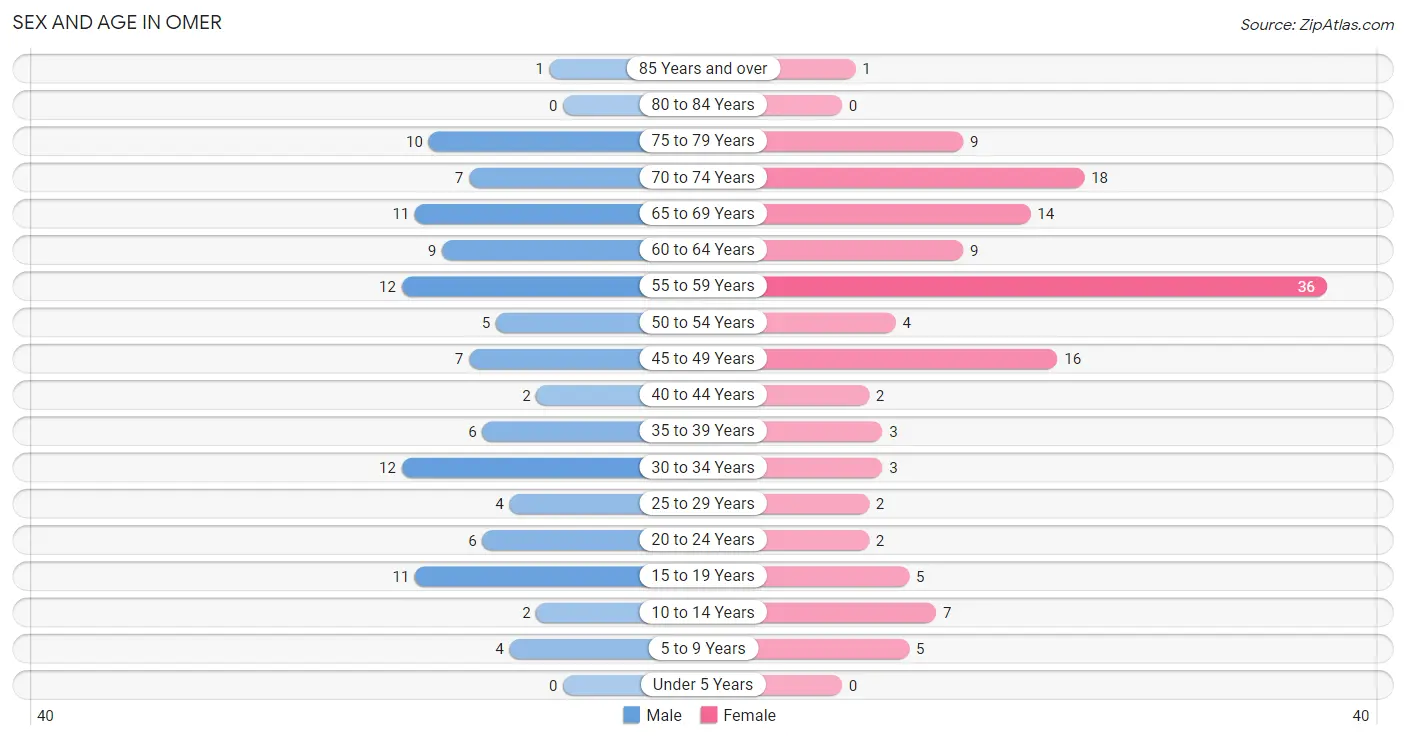
The most populous age groups in Omer are 30 to 34 Years (12 | 11.0%) for men and 55 to 59 Years (36 | 26.5%) for women.
| Age Bracket | Male | Female |
| Under 5 Years | 0 (0.0%) | 0 (0.0%) |
| 5 to 9 Years | 4 (3.7%) | 5 (3.7%) |
| 10 to 14 Years | 2 (1.8%) | 7 (5.1%) |
| 15 to 19 Years | 11 (10.1%) | 5 (3.7%) |
| 20 to 24 Years | 6 (5.5%) | 2 (1.5%) |
| 25 to 29 Years | 4 (3.7%) | 2 (1.5%) |
| 30 to 34 Years | 12 (11.0%) | 3 (2.2%) |
| 35 to 39 Years | 6 (5.5%) | 3 (2.2%) |
| 40 to 44 Years | 2 (1.8%) | 2 (1.5%) |
| 45 to 49 Years | 7 (6.4%) | 16 (11.8%) |
| 50 to 54 Years | 5 (4.6%) | 4 (2.9%) |
| 55 to 59 Years | 12 (11.0%) | 36 (26.5%) |
| 60 to 64 Years | 9 (8.3%) | 9 (6.6%) |
| 65 to 69 Years | 11 (10.1%) | 14 (10.3%) |
| 70 to 74 Years | 7 (6.4%) | 18 (13.2%) |
| 75 to 79 Years | 10 (9.2%) | 9 (6.6%) |
| 80 to 84 Years | 0 (0.0%) | 0 (0.0%) |
| 85 Years and over | 1 (0.9%) | 1 (0.7%) |
| Total | 109 (100.0%) | 136 (100.0%) |
Families and Households in Omer
Median Family Size in Omer
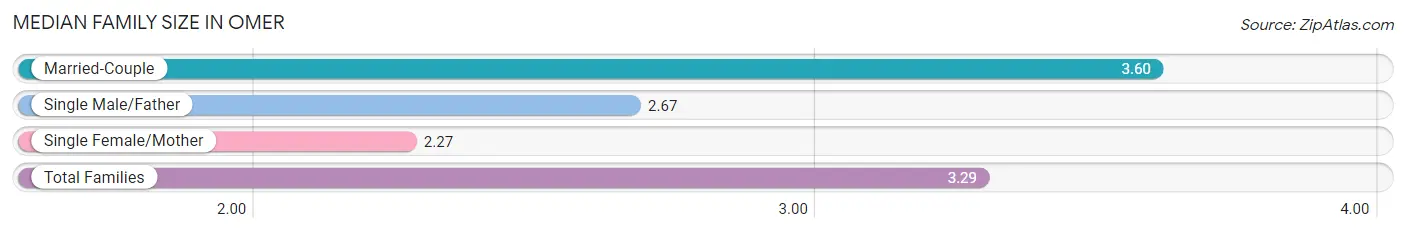
The median family size in Omer is 3.29 persons per family, with married-couple families (42 | 75.0%) accounting for the largest median family size of 3.6 persons per family. On the other hand, single female/mother families (11 | 19.6%) represent the smallest median family size with 2.27 persons per family.
| Family Type | # Families | Family Size |
| Married-Couple | 42 (75.0%) | 3.60 |
| Single Male/Father | 3 (5.4%) | 2.67 |
| Single Female/Mother | 11 (19.6%) | 2.27 |
| Total Families | 56 (100.0%) | 3.29 |
Median Household Size in Omer
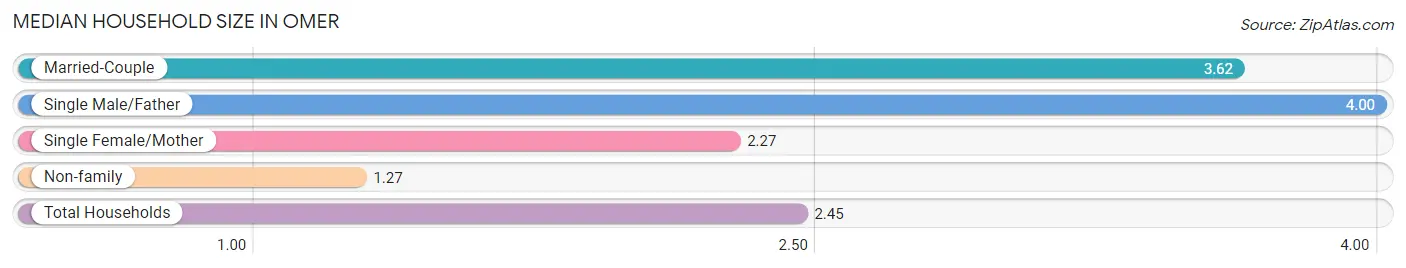
The median household size in Omer is 2.45 persons per household, with single male/father households (3 | 3.0%) accounting for the largest median household size of 4 persons per household. non-family households (44 | 44.0%) represent the smallest median household size with 1.27 persons per household.
| Household Type | # Households | Household Size |
| Married-Couple | 42 (42.0%) | 3.62 |
| Single Male/Father | 3 (3.0%) | 4.00 |
| Single Female/Mother | 11 (11.0%) | 2.27 |
| Non-family | 44 (44.0%) | 1.27 |
| Total Households | 100 (100.0%) | 2.45 |
Household Size by Marriage Status in Omer
Out of a total of 100 households in Omer, 56 (56.0%) are family households, while 44 (44.0%) are nonfamily households. The most numerous type of family households are 2-person households, comprising 33, and the most common type of nonfamily households are 1-person households, comprising 34.
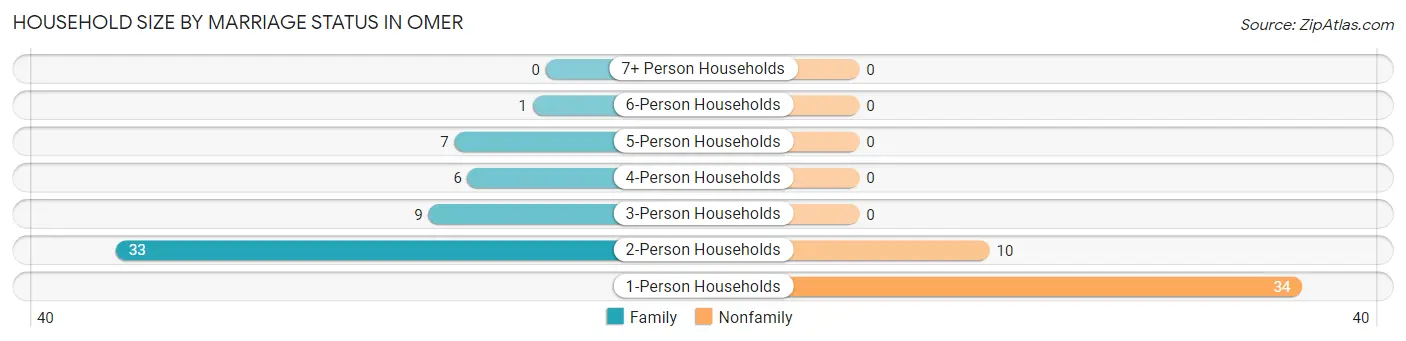
| Household Size | Family Households | Nonfamily Households |
| 1-Person Households | - | 34 (34.0%) |
| 2-Person Households | 33 (33.0%) | 10 (10.0%) |
| 3-Person Households | 9 (9.0%) | 0 (0.0%) |
| 4-Person Households | 6 (6.0%) | 0 (0.0%) |
| 5-Person Households | 7 (7.0%) | 0 (0.0%) |
| 6-Person Households | 1 (1.0%) | 0 (0.0%) |
| 7+ Person Households | 0 (0.0%) | 0 (0.0%) |
| Total | 56 (56.0%) | 44 (44.0%) |
Female Fertility in Omer
Fertility by Age in Omer
| Age Bracket | Women with Births | Births / 1,000 Women |
| 15 to 19 years | 0 (0.0%) | 0.0 |
| 20 to 34 years | 0 (0.0%) | 0.0 |
| 35 to 50 years | 0 (0.0%) | 0.0 |
| Total | 0 (0.0%) | 0.0 |
Fertility by Age by Marriage Status in Omer
| Age Bracket | Married | Unmarried |
| 15 to 19 years | 0 (0.0%) | 0 (0.0%) |
| 20 to 34 years | 0 (0.0%) | 0 (0.0%) |
| 35 to 50 years | 0 (0.0%) | 0 (0.0%) |
| Total | 0 (0.0%) | 0 (0.0%) |
Fertility by Education in Omer
| Educational Attainment | Women with Births | Births / 1,000 Women |
| Less than High School | 0 (0.0%) | 0.0 |
| High School Diploma | 0 (0.0%) | 0.0 |
| College or Associate's Degree | 0 (0.0%) | 0.0 |
| Bachelor's Degree | 0 (0.0%) | 0.0 |
| Graduate Degree | 0 (0.0%) | 0.0 |
| Total | 0 (0.0%) | 0.0 |
Fertility by Education by Marriage Status in Omer
| Educational Attainment | Married | Unmarried |
| Less than High School | 0 (0.0%) | 0 (0.0%) |
| High School Diploma | 0 (0.0%) | 0 (0.0%) |
| College or Associate's Degree | 0 (0.0%) | 0 (0.0%) |
| Bachelor's Degree | 0 (0.0%) | 0 (0.0%) |
| Graduate Degree | 0 (0.0%) | 0 (0.0%) |
| Total | 0 (0.0%) | 0 (0.0%) |
Employment Characteristics in Omer
Employment by Class of Employer in Omer
Among the 96 employed individuals in Omer, private company employees (81 | 84.4%), local government employees (8 | 8.3%), and self-employed (not incorporated) (4 | 4.2%) make up the most common classes of employment.
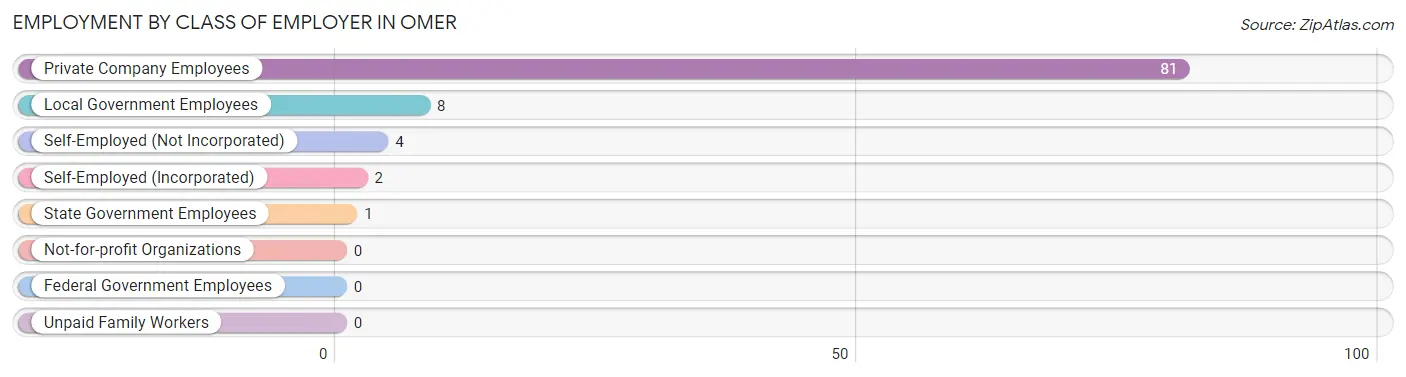
| Employer Class | # Employees | % Employees |
| Private Company Employees | 81 | 84.4% |
| Self-Employed (Incorporated) | 2 | 2.1% |
| Self-Employed (Not Incorporated) | 4 | 4.2% |
| Not-for-profit Organizations | 0 | 0.0% |
| Local Government Employees | 8 | 8.3% |
| State Government Employees | 1 | 1.0% |
| Federal Government Employees | 0 | 0.0% |
| Unpaid Family Workers | 0 | 0.0% |
| Total | 96 | 100.0% |
Employment Status by Age in Omer
According to the labor force statistics for Omer, out of the total population over 16 years of age (227), 48.9% or 111 individuals are in the labor force, with 13.5% or 15 of them unemployed. The age group with the highest labor force participation rate is 30 to 34 years, with 100.0% or 15 individuals in the labor force. Within the labor force, the 45 to 54 years age range has the highest percentage of unemployed individuals, with 37.5% or 12 of them being unemployed.
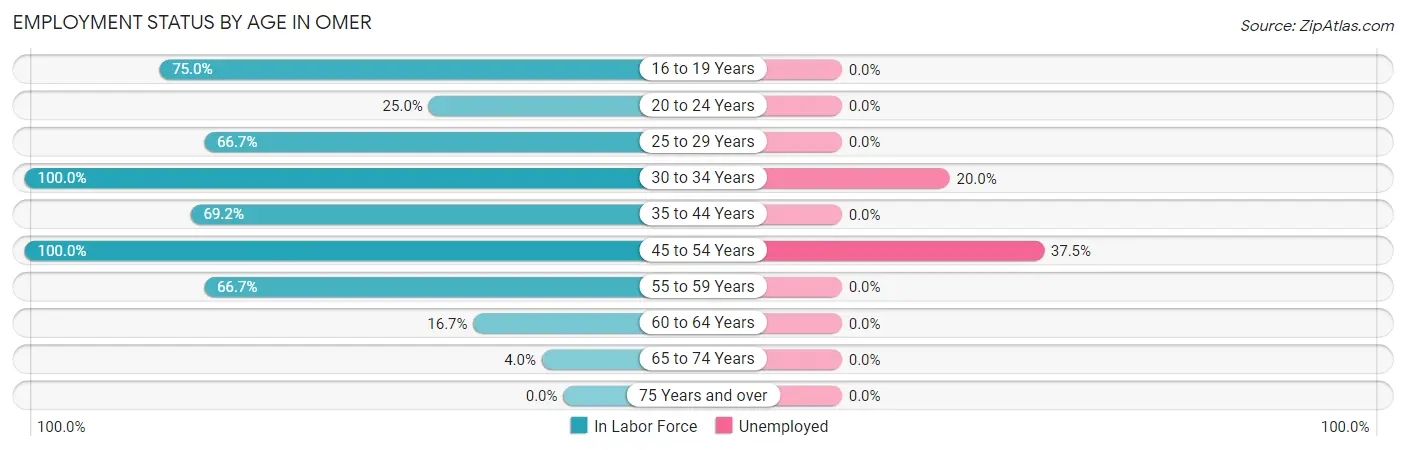
| Age Bracket | In Labor Force | Unemployed |
| 16 to 19 Years | 12 (75.0%) | 0 (0.0%) |
| 20 to 24 Years | 2 (25.0%) | 0 (0.0%) |
| 25 to 29 Years | 4 (66.7%) | 0 (0.0%) |
| 30 to 34 Years | 15 (100.0%) | 3 (20.0%) |
| 35 to 44 Years | 9 (69.2%) | 0 (0.0%) |
| 45 to 54 Years | 32 (100.0%) | 12 (37.5%) |
| 55 to 59 Years | 32 (66.7%) | 0 (0.0%) |
| 60 to 64 Years | 3 (16.7%) | 0 (0.0%) |
| 65 to 74 Years | 2 (4.0%) | 0 (0.0%) |
| 75 Years and over | 0 (0.0%) | 0 (0.0%) |
| Total | 111 (48.9%) | 15 (13.5%) |
Employment Status by Educational Attainment in Omer
According to labor force statistics for Omer, 72.0% of individuals (95) out of the total population between 25 and 64 years of age (132) are in the labor force, with 15.8% or 15 of them being unemployed. The group with the highest labor force participation rate are those with the educational attainment of less than high school, with 85.2% or 23 individuals in the labor force. Within the labor force, individuals with bachelor's degree or higher education have the highest percentage of unemployment, with 100.0% or 1 of them being unemployed.
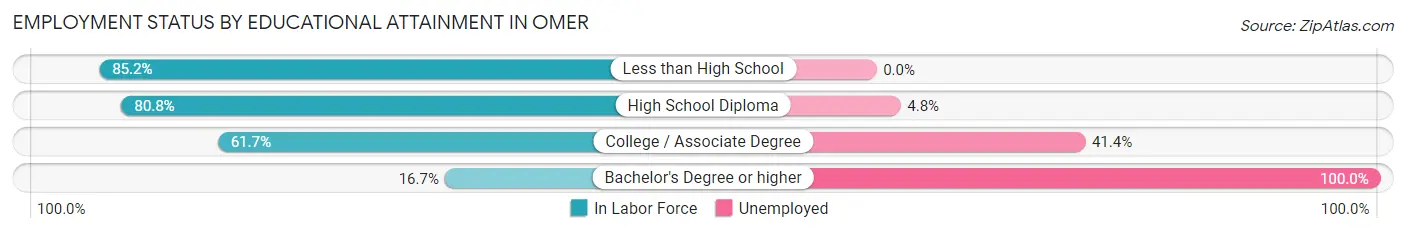
| Educational Attainment | In Labor Force | Unemployed |
| Less than High School | 23 (85.2%) | 0 (0.0%) |
| High School Diploma | 42 (80.8%) | 2 (4.8%) |
| College / Associate Degree | 29 (61.7%) | 19 (41.4%) |
| Bachelor's Degree or higher | 1 (16.7%) | 6 (100.0%) |
| Total | 95 (72.0%) | 21 (15.8%) |
Employment Occupations by Sex in Omer
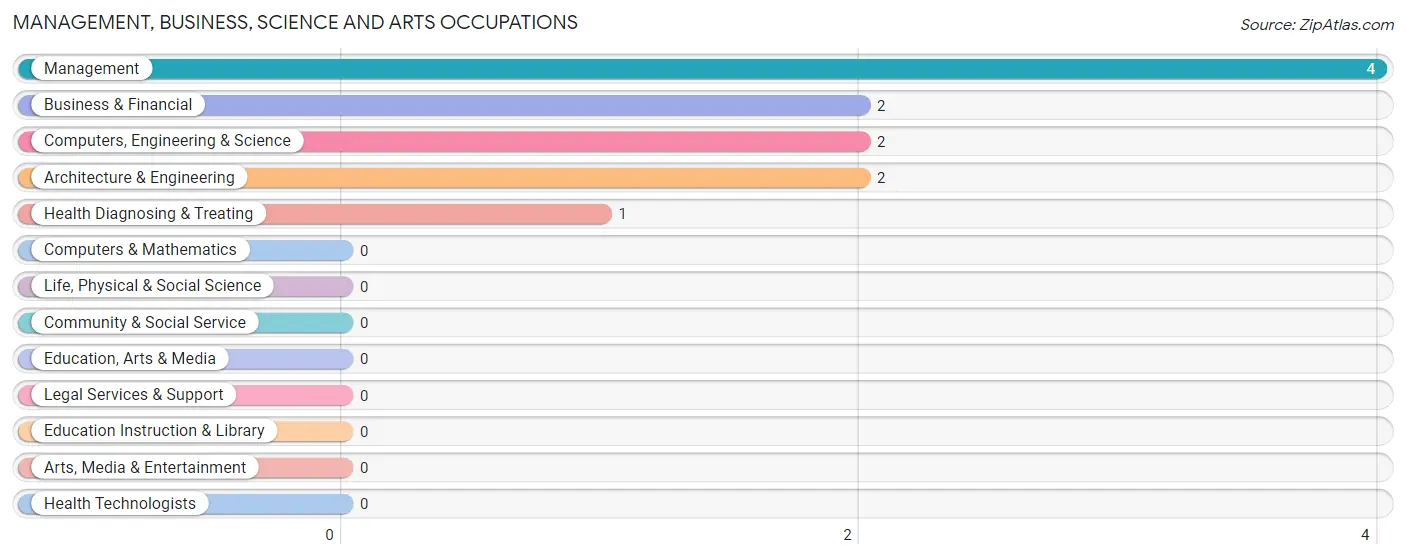
Management, Business, Science and Arts Occupations
The most common Management, Business, Science and Arts occupations in Omer are Management (4 | 4.2%), Business & Financial (2 | 2.1%), Computers, Engineering & Science (2 | 2.1%), Architecture & Engineering (2 | 2.1%), and Health Diagnosing & Treating (1 | 1.0%).
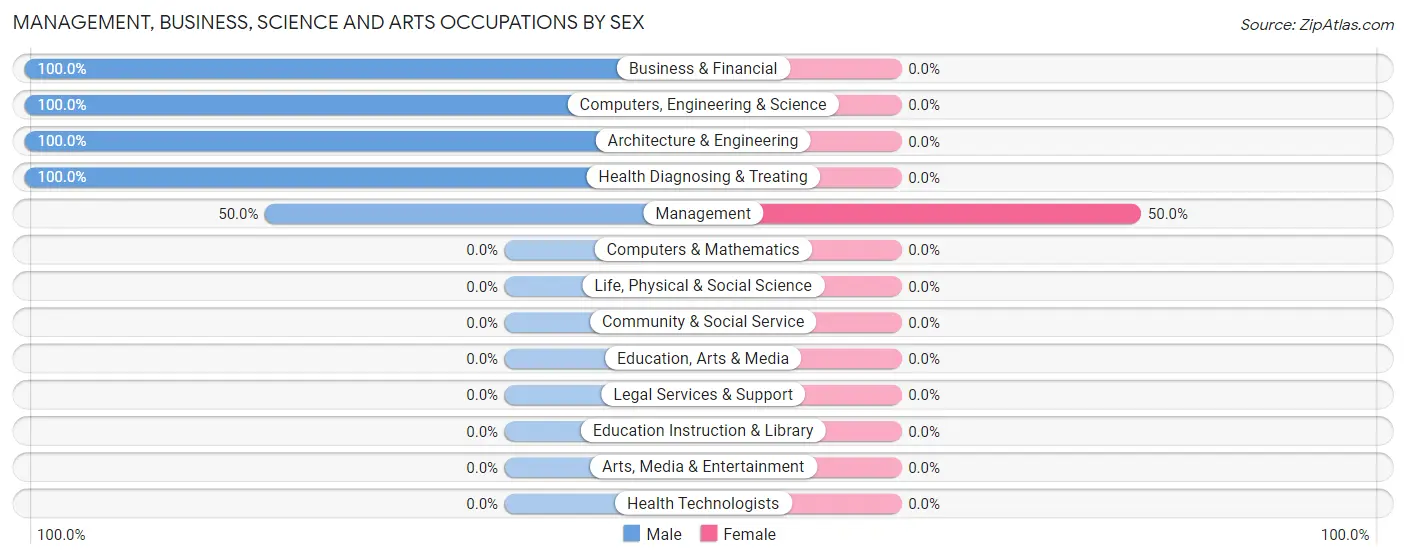
Management, Business, Science and Arts Occupations by Sex
| Occupation | Male | Female |
| Management | 2 (50.0%) | 2 (50.0%) |
| Business & Financial | 2 (100.0%) | 0 (0.0%) |
| Computers, Engineering & Science | 2 (100.0%) | 0 (0.0%) |
| Computers & Mathematics | 0 (0.0%) | 0 (0.0%) |
| Architecture & Engineering | 2 (100.0%) | 0 (0.0%) |
| Life, Physical & Social Science | 0 (0.0%) | 0 (0.0%) |
| Community & Social Service | 0 (0.0%) | 0 (0.0%) |
| Education, Arts & Media | 0 (0.0%) | 0 (0.0%) |
| Legal Services & Support | 0 (0.0%) | 0 (0.0%) |
| Education Instruction & Library | 0 (0.0%) | 0 (0.0%) |
| Arts, Media & Entertainment | 0 (0.0%) | 0 (0.0%) |
| Health Diagnosing & Treating | 1 (100.0%) | 0 (0.0%) |
| Health Technologists | 0 (0.0%) | 0 (0.0%) |
| Total (Category) | 7 (77.8%) | 2 (22.2%) |
| Total (Overall) | 47 (49.0%) | 49 (51.0%) |
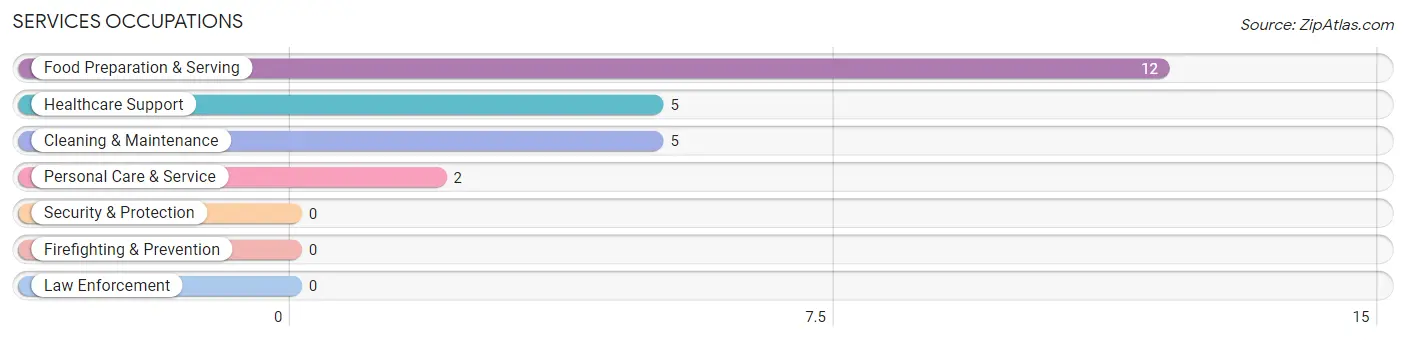
Services Occupations
The most common Services occupations in Omer are Food Preparation & Serving (12 | 12.5%), Healthcare Support (5 | 5.2%), Cleaning & Maintenance (5 | 5.2%), and Personal Care & Service (2 | 2.1%).
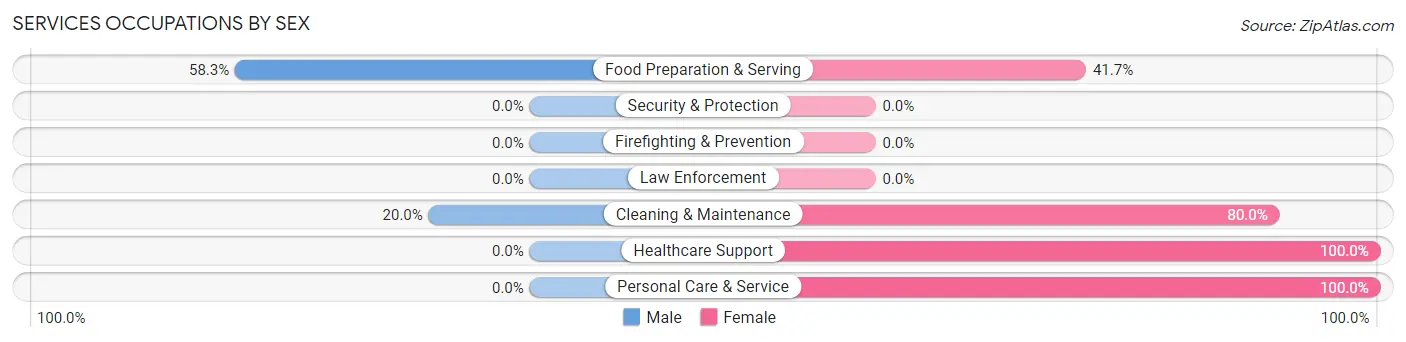
Services Occupations by Sex
Within the Services occupations in Omer, the most male-oriented occupations are Food Preparation & Serving (58.3%), and Cleaning & Maintenance (20.0%), while the most female-oriented occupations are Healthcare Support (100.0%), Personal Care & Service (100.0%), and Cleaning & Maintenance (80.0%).
| Occupation | Male | Female |
| Healthcare Support | 0 (0.0%) | 5 (100.0%) |
| Security & Protection | 0 (0.0%) | 0 (0.0%) |
| Firefighting & Prevention | 0 (0.0%) | 0 (0.0%) |
| Law Enforcement | 0 (0.0%) | 0 (0.0%) |
| Food Preparation & Serving | 7 (58.3%) | 5 (41.7%) |
| Cleaning & Maintenance | 1 (20.0%) | 4 (80.0%) |
| Personal Care & Service | 0 (0.0%) | 2 (100.0%) |
| Total (Category) | 8 (33.3%) | 16 (66.7%) |
| Total (Overall) | 47 (49.0%) | 49 (51.0%) |
Sales and Office Occupations
The most common Sales and Office occupations in Omer are Office & Administration (13 | 13.5%), and Sales & Related (3 | 3.1%).
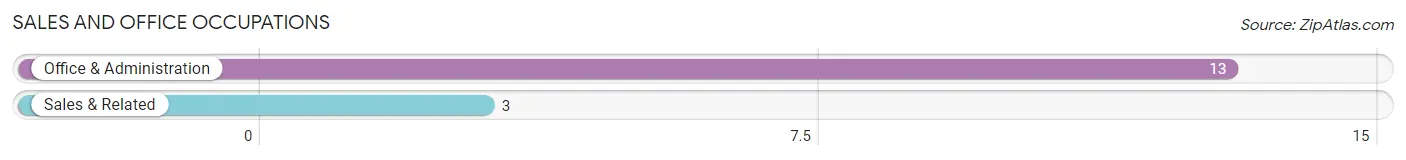
Sales and Office Occupations by Sex

| Occupation | Male | Female |
| Sales & Related | 3 (100.0%) | 0 (0.0%) |
| Office & Administration | 0 (0.0%) | 13 (100.0%) |
| Total (Category) | 3 (18.8%) | 13 (81.2%) |
| Total (Overall) | 47 (49.0%) | 49 (51.0%) |
Natural Resources, Construction and Maintenance Occupations
The most common Natural Resources, Construction and Maintenance occupations in Omer are Installation, Maintenance & Repair (6 | 6.2%), and Construction & Extraction (2 | 2.1%).
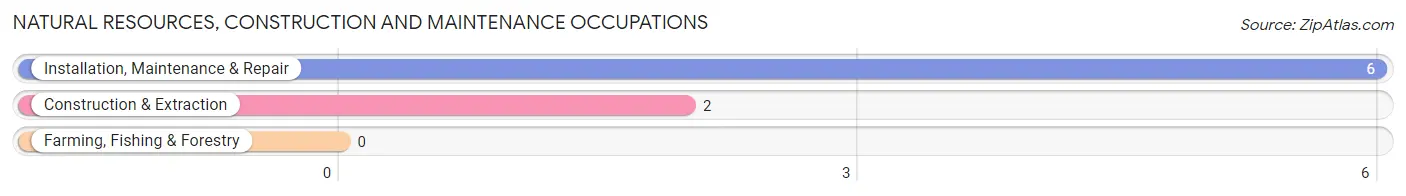
Natural Resources, Construction and Maintenance Occupations by Sex
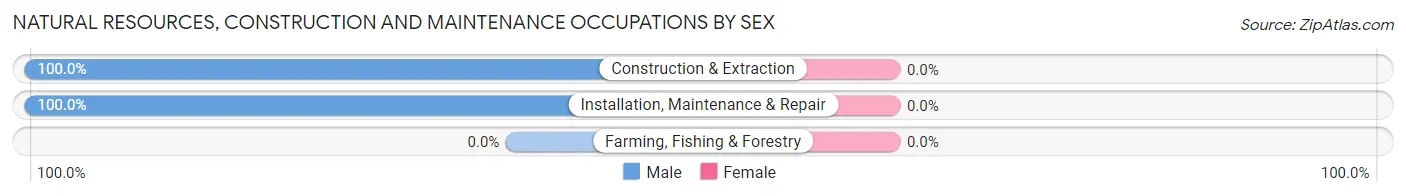
| Occupation | Male | Female |
| Farming, Fishing & Forestry | 0 (0.0%) | 0 (0.0%) |
| Construction & Extraction | 2 (100.0%) | 0 (0.0%) |
| Installation, Maintenance & Repair | 6 (100.0%) | 0 (0.0%) |
| Total (Category) | 8 (100.0%) | 0 (0.0%) |
| Total (Overall) | 47 (49.0%) | 49 (51.0%) |
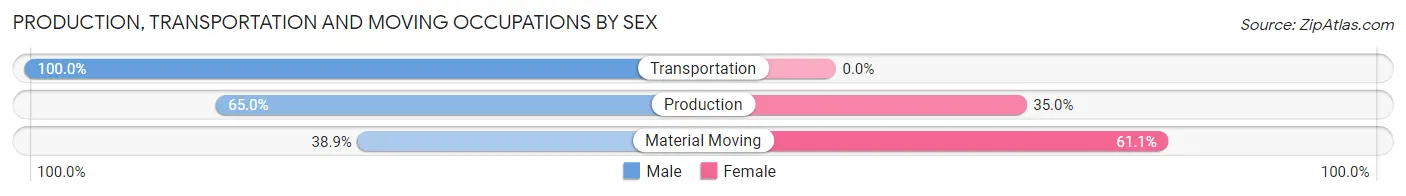
Production, Transportation and Moving Occupations
The most common Production, Transportation and Moving occupations in Omer are Production (20 | 20.8%), Material Moving (18 | 18.8%), and Transportation (1 | 1.0%).
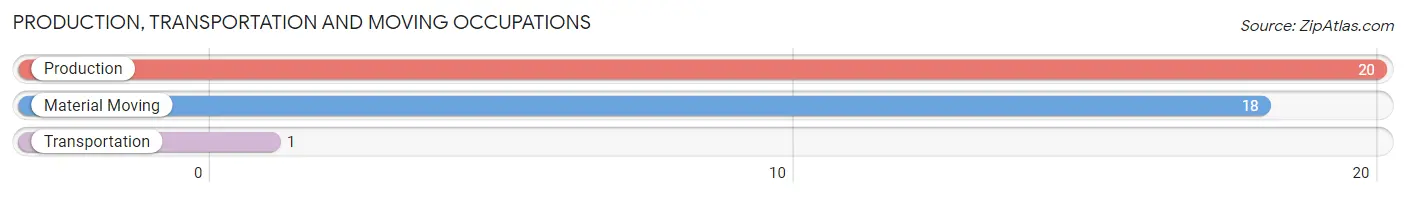
Production, Transportation and Moving Occupations by Sex
| Occupation | Male | Female |
| Production | 13 (65.0%) | 7 (35.0%) |
| Transportation | 1 (100.0%) | 0 (0.0%) |
| Material Moving | 7 (38.9%) | 11 (61.1%) |
| Total (Category) | 21 (53.8%) | 18 (46.2%) |
| Total (Overall) | 47 (49.0%) | 49 (51.0%) |
Employment Industries by Sex in Omer
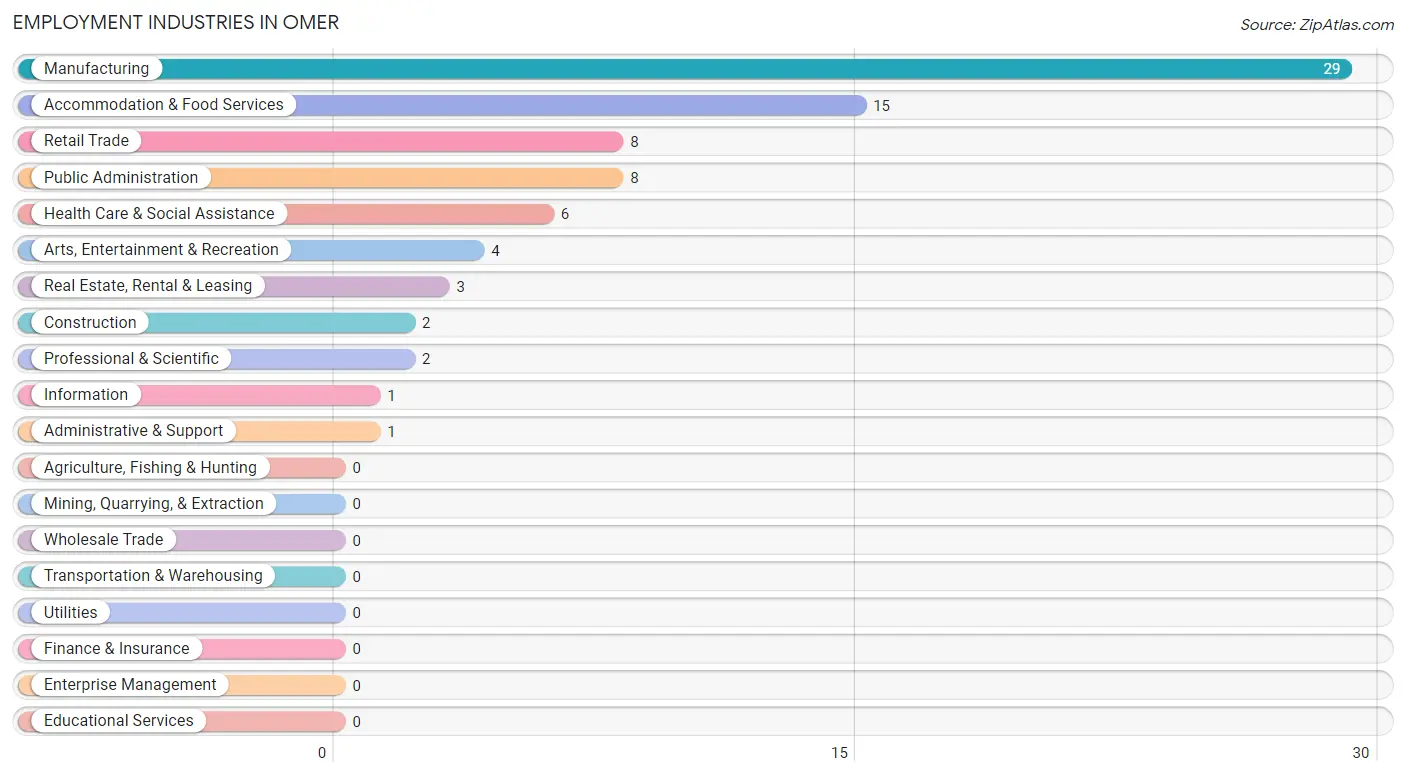
Employment Industries in Omer
The major employment industries in Omer include Manufacturing (29 | 30.2%), Accommodation & Food Services (15 | 15.6%), Retail Trade (8 | 8.3%), Public Administration (8 | 8.3%), and Health Care & Social Assistance (6 | 6.2%).
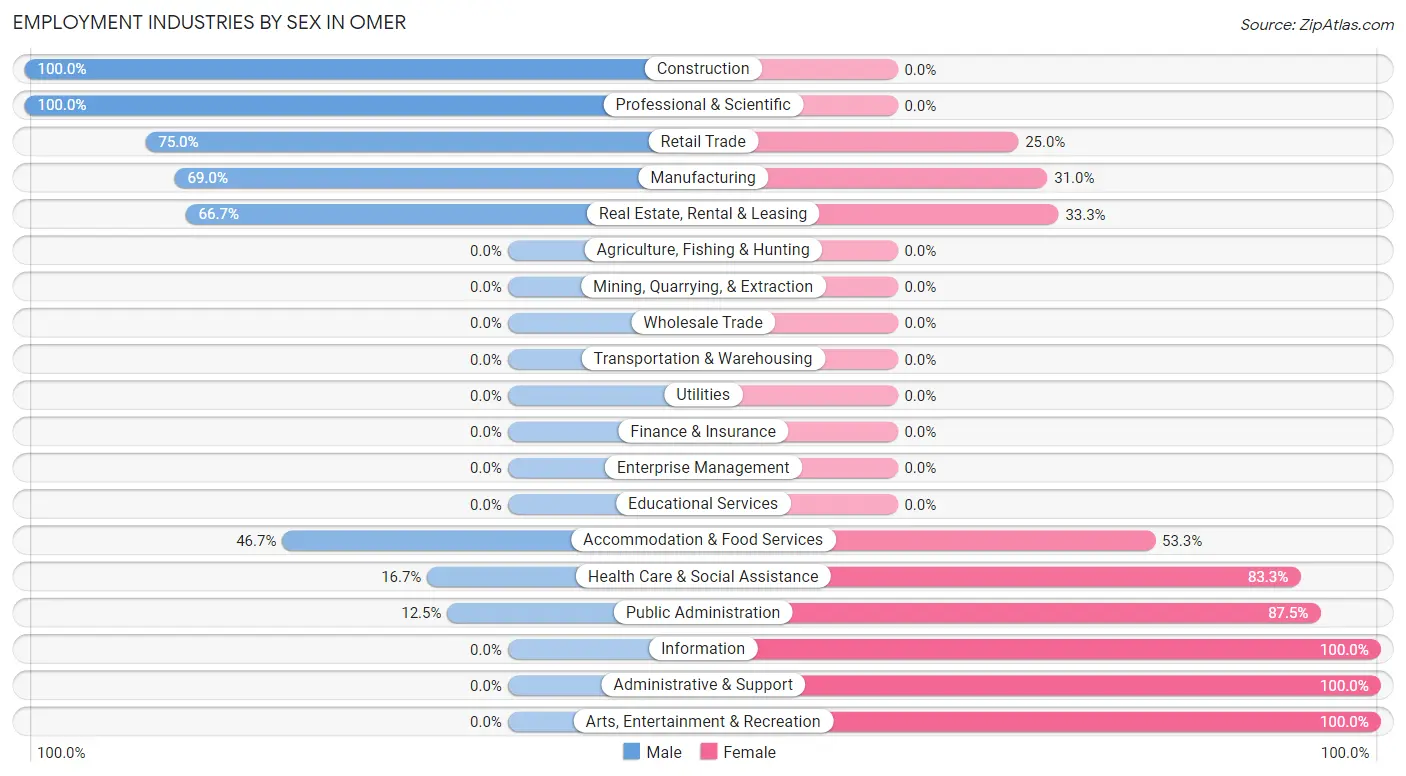
Employment Industries by Sex in Omer
The Omer industries that see more men than women are Construction (100.0%), Professional & Scientific (100.0%), and Retail Trade (75.0%), whereas the industries that tend to have a higher number of women are Information (100.0%), Administrative & Support (100.0%), and Arts, Entertainment & Recreation (100.0%).
| Industry | Male | Female |
| Agriculture, Fishing & Hunting | 0 (0.0%) | 0 (0.0%) |
| Mining, Quarrying, & Extraction | 0 (0.0%) | 0 (0.0%) |
| Construction | 2 (100.0%) | 0 (0.0%) |
| Manufacturing | 20 (69.0%) | 9 (31.0%) |
| Wholesale Trade | 0 (0.0%) | 0 (0.0%) |
| Retail Trade | 6 (75.0%) | 2 (25.0%) |
| Transportation & Warehousing | 0 (0.0%) | 0 (0.0%) |
| Utilities | 0 (0.0%) | 0 (0.0%) |
| Information | 0 (0.0%) | 1 (100.0%) |
| Finance & Insurance | 0 (0.0%) | 0 (0.0%) |
| Real Estate, Rental & Leasing | 2 (66.7%) | 1 (33.3%) |
| Professional & Scientific | 2 (100.0%) | 0 (0.0%) |
| Enterprise Management | 0 (0.0%) | 0 (0.0%) |
| Administrative & Support | 0 (0.0%) | 1 (100.0%) |
| Educational Services | 0 (0.0%) | 0 (0.0%) |
| Health Care & Social Assistance | 1 (16.7%) | 5 (83.3%) |
| Arts, Entertainment & Recreation | 0 (0.0%) | 4 (100.0%) |
| Accommodation & Food Services | 7 (46.7%) | 8 (53.3%) |
| Public Administration | 1 (12.5%) | 7 (87.5%) |
| Total | 47 (49.0%) | 49 (51.0%) |
Education in Omer
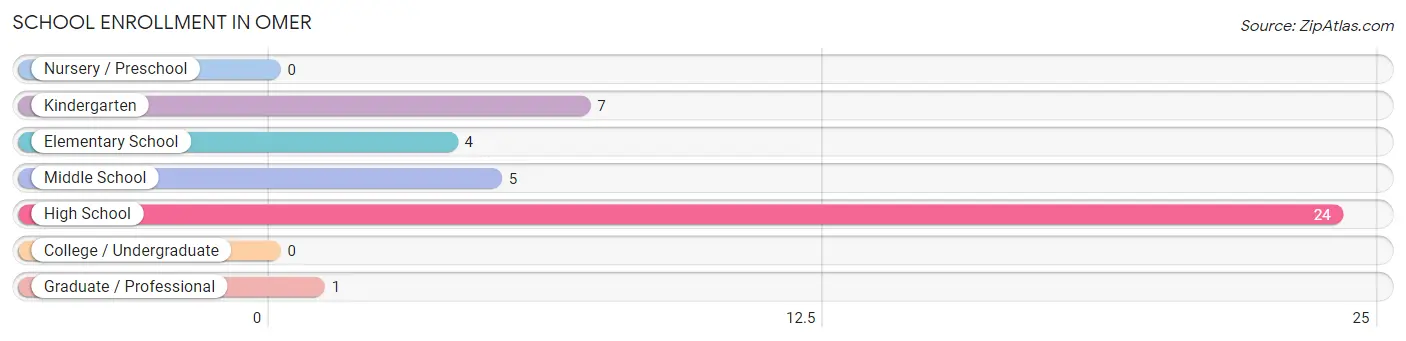
School Enrollment in Omer
The most common levels of schooling among the 41 students in Omer are high school (24 | 58.5%), kindergarten (7 | 17.1%), and middle school (5 | 12.2%).
| School Level | # Students | % Students |
| Nursery / Preschool | 0 | 0.0% |
| Kindergarten | 7 | 17.1% |
| Elementary School | 4 | 9.8% |
| Middle School | 5 | 12.2% |
| High School | 24 | 58.5% |
| College / Undergraduate | 0 | 0.0% |
| Graduate / Professional | 1 | 2.4% |
| Total | 41 | 100.0% |
School Enrollment by Age by Funding Source in Omer
Out of a total of 41 students who are enrolled in schools in Omer, 2 (4.9%) attend a private institution, while the remaining 39 (95.1%) are enrolled in public schools. The age group of 15 to 17 year olds has the highest likelihood of being enrolled in private schools, with 1 (14.3% in the age bracket) enrolled. Conversely, the age group of 5 to 9 year old has the lowest likelihood of being enrolled in a private school, with 9 (100.0% in the age bracket) attending a public institution.
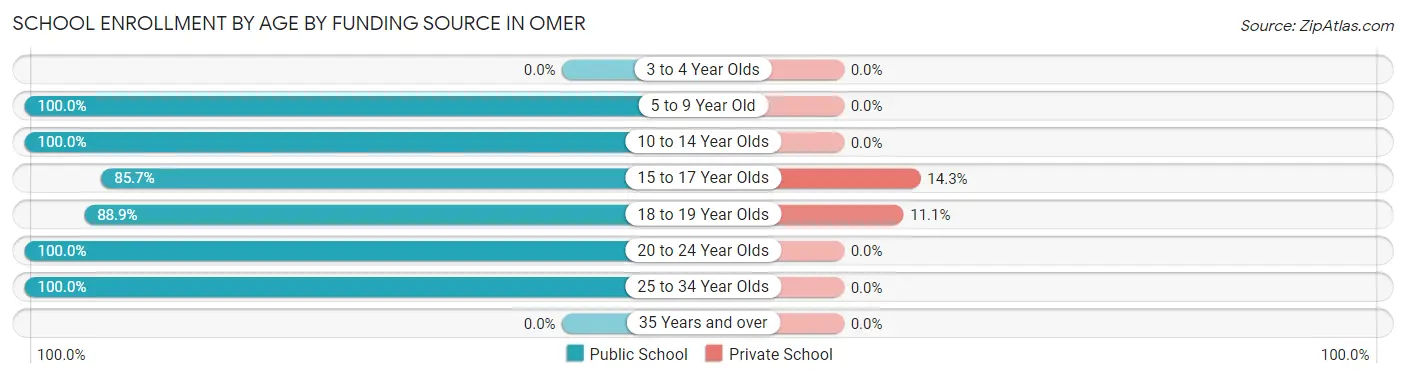
| Age Bracket | Public School | Private School |
| 3 to 4 Year Olds | 0 (0.0%) | 0 (0.0%) |
| 5 to 9 Year Old | 9 (100.0%) | 0 (0.0%) |
| 10 to 14 Year Olds | 9 (100.0%) | 0 (0.0%) |
| 15 to 17 Year Olds | 6 (85.7%) | 1 (14.3%) |
| 18 to 19 Year Olds | 8 (88.9%) | 1 (11.1%) |
| 20 to 24 Year Olds | 6 (100.0%) | 0 (0.0%) |
| 25 to 34 Year Olds | 1 (100.0%) | 0 (0.0%) |
| 35 Years and over | 0 (0.0%) | 0 (0.0%) |
| Total | 39 (95.1%) | 2 (4.9%) |
Educational Attainment by Field of Study in Omer
Arts & humanities (4 | 30.8%), engineering (2 | 15.4%), science & technology (2 | 15.4%), physical & health sciences (1 | 7.7%), and social sciences (1 | 7.7%) are the most common fields of study among 13 individuals in Omer who have obtained a bachelor's degree or higher.
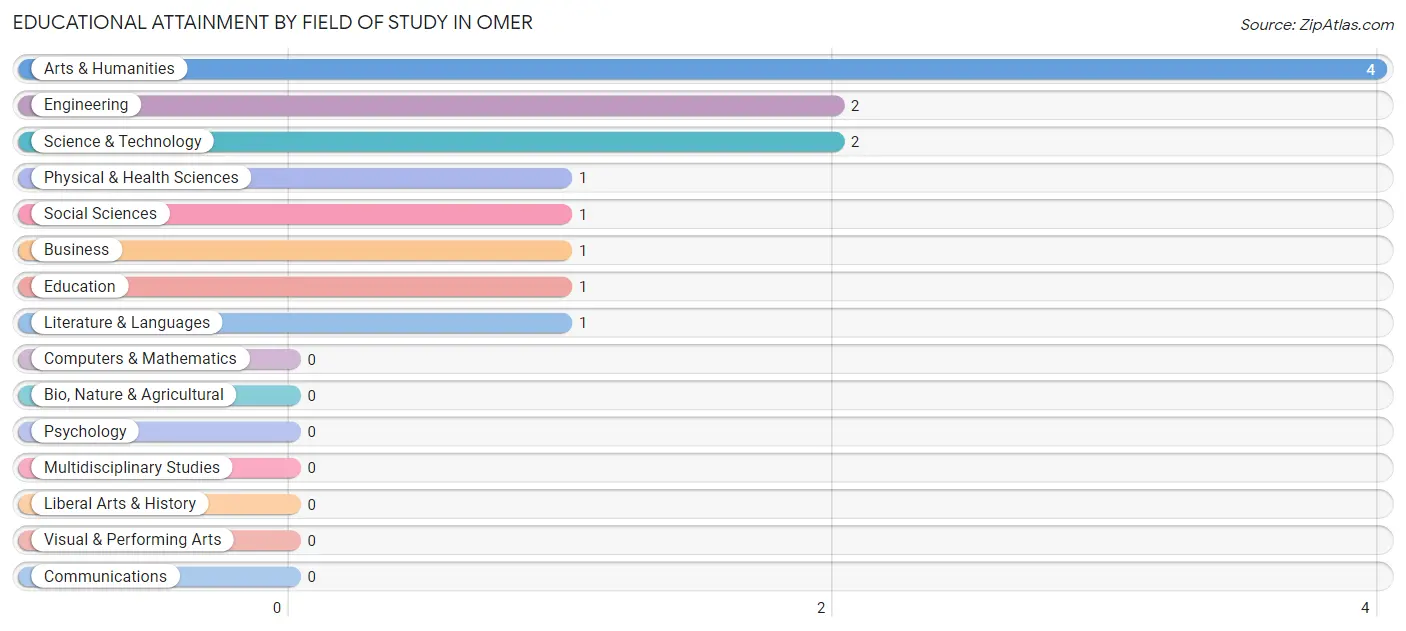
| Field of Study | # Graduates | % Graduates |
| Computers & Mathematics | 0 | 0.0% |
| Bio, Nature & Agricultural | 0 | 0.0% |
| Physical & Health Sciences | 1 | 7.7% |
| Psychology | 0 | 0.0% |
| Social Sciences | 1 | 7.7% |
| Engineering | 2 | 15.4% |
| Multidisciplinary Studies | 0 | 0.0% |
| Science & Technology | 2 | 15.4% |
| Business | 1 | 7.7% |
| Education | 1 | 7.7% |
| Literature & Languages | 1 | 7.7% |
| Liberal Arts & History | 0 | 0.0% |
| Visual & Performing Arts | 0 | 0.0% |
| Communications | 0 | 0.0% |
| Arts & Humanities | 4 | 30.8% |
| Total | 13 | 100.0% |
Transportation & Commute in Omer
Vehicle Availability by Sex in Omer
The most prevalent vehicle ownership categories in Omer are males with 3 vehicles (34, accounting for 72.3%) and females with 3 vehicles (25, making up 69.4%).
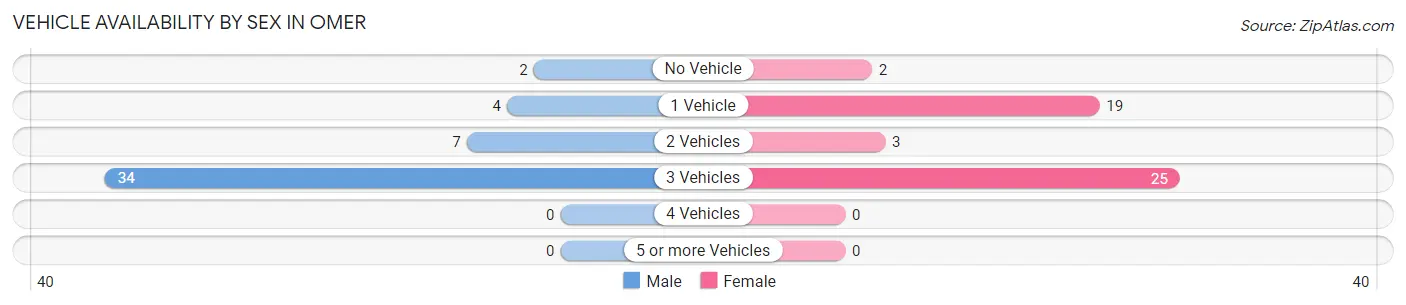
| Vehicles Available | Male | Female |
| No Vehicle | 2 (4.3%) | 2 (4.1%) |
| 1 Vehicle | 4 (8.5%) | 19 (38.8%) |
| 2 Vehicles | 7 (14.9%) | 3 (6.1%) |
| 3 Vehicles | 34 (72.3%) | 25 (51.0%) |
| 4 Vehicles | 0 (0.0%) | 0 (0.0%) |
| 5 or more Vehicles | 0 (0.0%) | 0 (0.0%) |
| Total | 47 (100.0%) | 49 (100.0%) |
Commute Time in Omer
The most frequently occuring commute durations in Omer are 30 to 34 minutes (30 commuters, 33.3%), 10 to 14 minutes (22 commuters, 24.4%), and 15 to 19 minutes (22 commuters, 24.4%).
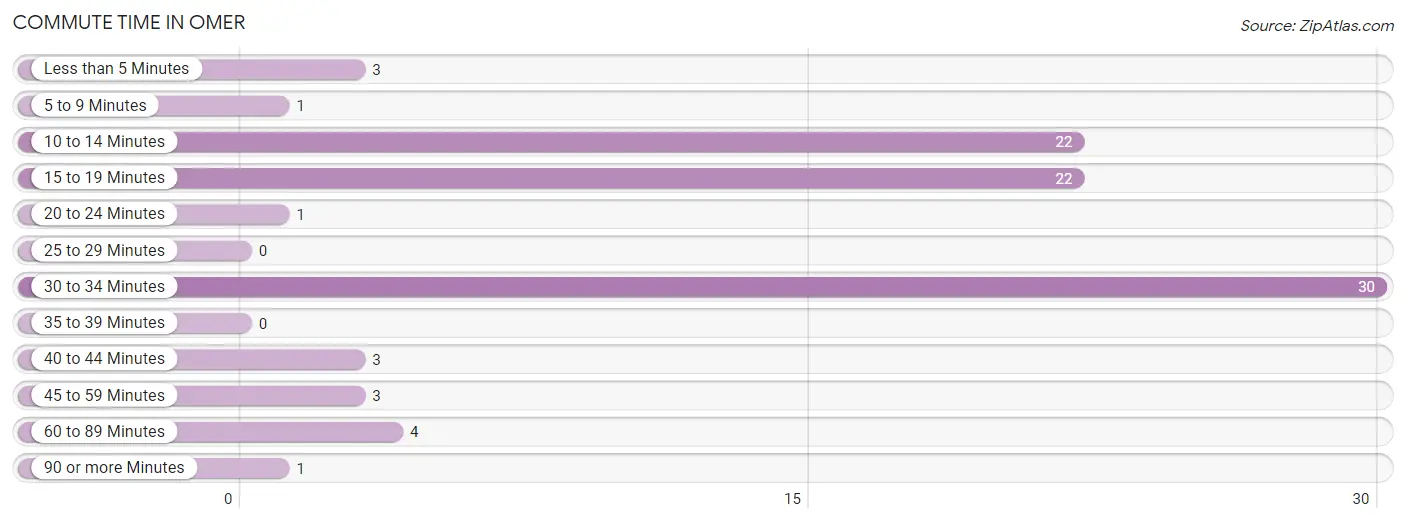
| Commute Time | # Commuters | % Commuters |
| Less than 5 Minutes | 3 | 3.3% |
| 5 to 9 Minutes | 1 | 1.1% |
| 10 to 14 Minutes | 22 | 24.4% |
| 15 to 19 Minutes | 22 | 24.4% |
| 20 to 24 Minutes | 1 | 1.1% |
| 25 to 29 Minutes | 0 | 0.0% |
| 30 to 34 Minutes | 30 | 33.3% |
| 35 to 39 Minutes | 0 | 0.0% |
| 40 to 44 Minutes | 3 | 3.3% |
| 45 to 59 Minutes | 3 | 3.3% |
| 60 to 89 Minutes | 4 | 4.4% |
| 90 or more Minutes | 1 | 1.1% |
Commute Time by Sex in Omer
The most common commute times in Omer are 30 to 34 minutes (16 commuters, 38.1%) for males and 10 to 14 minutes (18 commuters, 37.5%) for females.
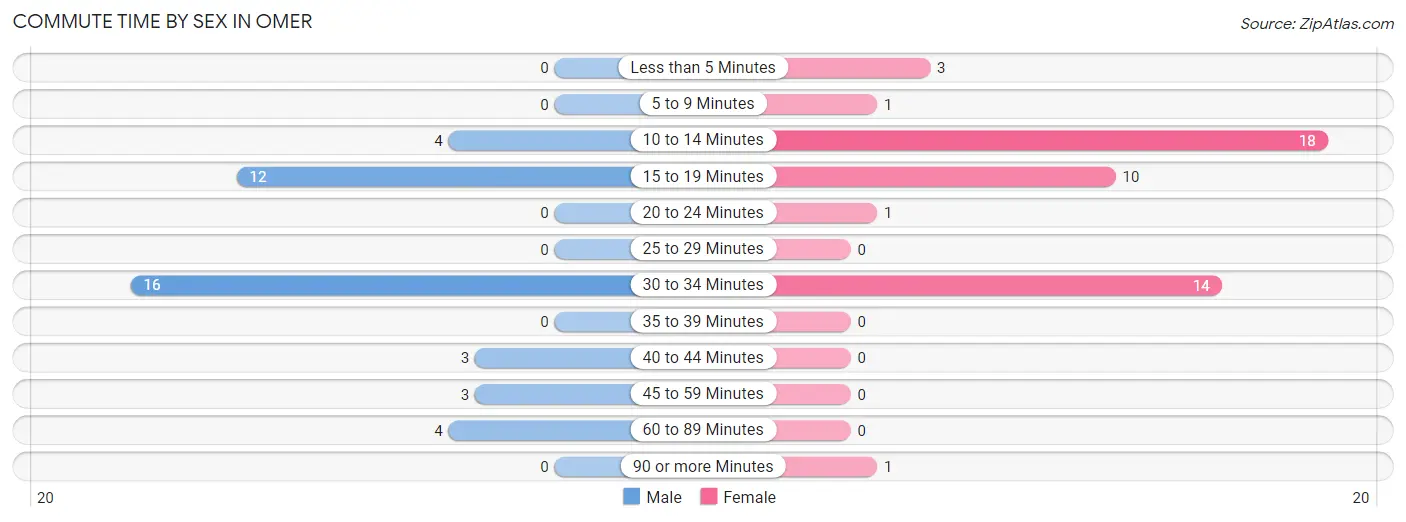
| Commute Time | Male | Female |
| Less than 5 Minutes | 0 (0.0%) | 3 (6.2%) |
| 5 to 9 Minutes | 0 (0.0%) | 1 (2.1%) |
| 10 to 14 Minutes | 4 (9.5%) | 18 (37.5%) |
| 15 to 19 Minutes | 12 (28.6%) | 10 (20.8%) |
| 20 to 24 Minutes | 0 (0.0%) | 1 (2.1%) |
| 25 to 29 Minutes | 0 (0.0%) | 0 (0.0%) |
| 30 to 34 Minutes | 16 (38.1%) | 14 (29.2%) |
| 35 to 39 Minutes | 0 (0.0%) | 0 (0.0%) |
| 40 to 44 Minutes | 3 (7.1%) | 0 (0.0%) |
| 45 to 59 Minutes | 3 (7.1%) | 0 (0.0%) |
| 60 to 89 Minutes | 4 (9.5%) | 0 (0.0%) |
| 90 or more Minutes | 0 (0.0%) | 1 (2.1%) |
Time of Departure to Work by Sex in Omer
The most frequent times of departure to work in Omer are 4:00 PM to 11:59 PM (11, 26.2%) for males and 12:00 PM to 3:59 PM (17, 35.4%) for females.
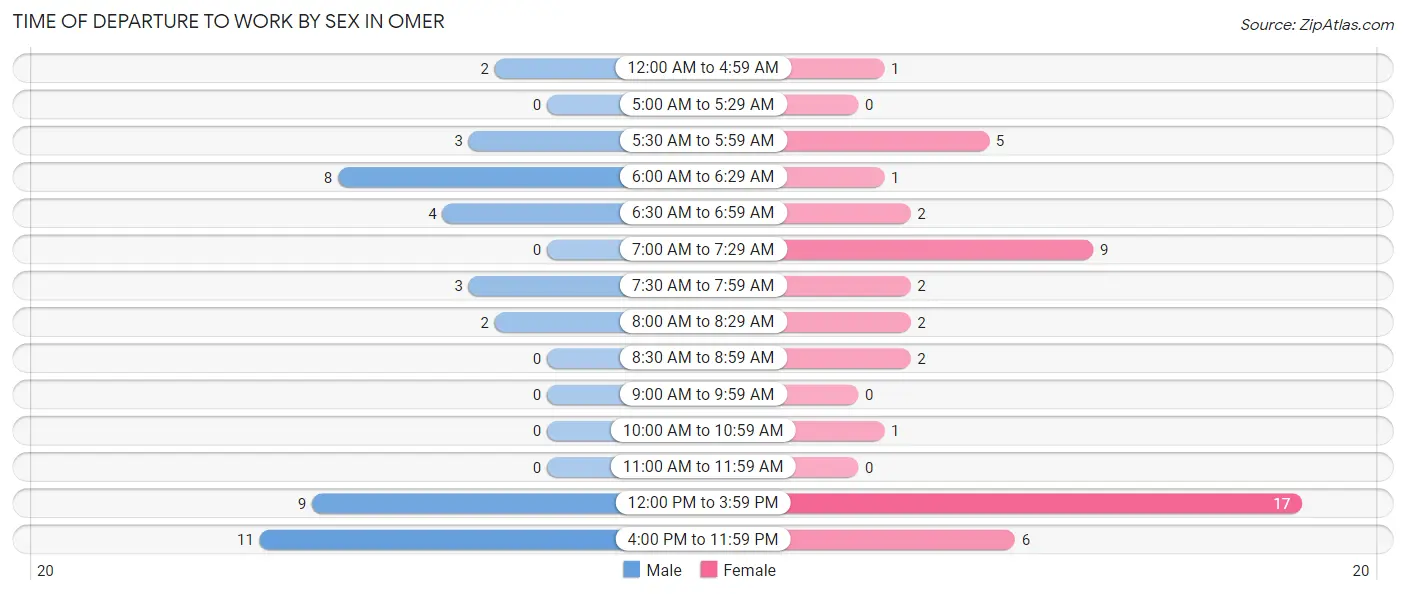
| Time of Departure | Male | Female |
| 12:00 AM to 4:59 AM | 2 (4.8%) | 1 (2.1%) |
| 5:00 AM to 5:29 AM | 0 (0.0%) | 0 (0.0%) |
| 5:30 AM to 5:59 AM | 3 (7.1%) | 5 (10.4%) |
| 6:00 AM to 6:29 AM | 8 (19.1%) | 1 (2.1%) |
| 6:30 AM to 6:59 AM | 4 (9.5%) | 2 (4.2%) |
| 7:00 AM to 7:29 AM | 0 (0.0%) | 9 (18.8%) |
| 7:30 AM to 7:59 AM | 3 (7.1%) | 2 (4.2%) |
| 8:00 AM to 8:29 AM | 2 (4.8%) | 2 (4.2%) |
| 8:30 AM to 8:59 AM | 0 (0.0%) | 2 (4.2%) |
| 9:00 AM to 9:59 AM | 0 (0.0%) | 0 (0.0%) |
| 10:00 AM to 10:59 AM | 0 (0.0%) | 1 (2.1%) |
| 11:00 AM to 11:59 AM | 0 (0.0%) | 0 (0.0%) |
| 12:00 PM to 3:59 PM | 9 (21.4%) | 17 (35.4%) |
| 4:00 PM to 11:59 PM | 11 (26.2%) | 6 (12.5%) |
| Total | 42 (100.0%) | 48 (100.0%) |
Housing Occupancy in Omer
Occupancy by Ownership in Omer
Of the total 100 dwellings in Omer, owner-occupied units account for 85 (85.0%), while renter-occupied units make up 15 (15.0%).
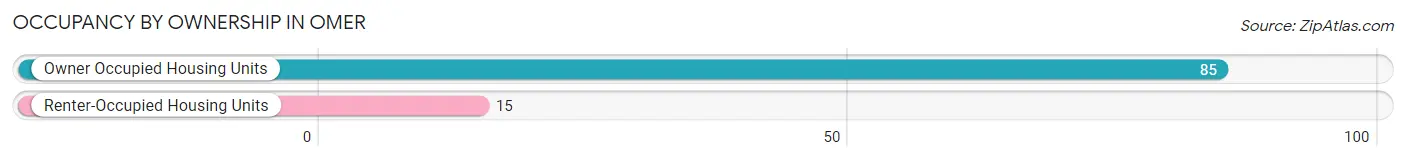
| Occupancy | # Housing Units | % Housing Units |
| Owner Occupied Housing Units | 85 | 85.0% |
| Renter-Occupied Housing Units | 15 | 15.0% |
| Total Occupied Housing Units | 100 | 100.0% |
Occupancy by Household Size in Omer
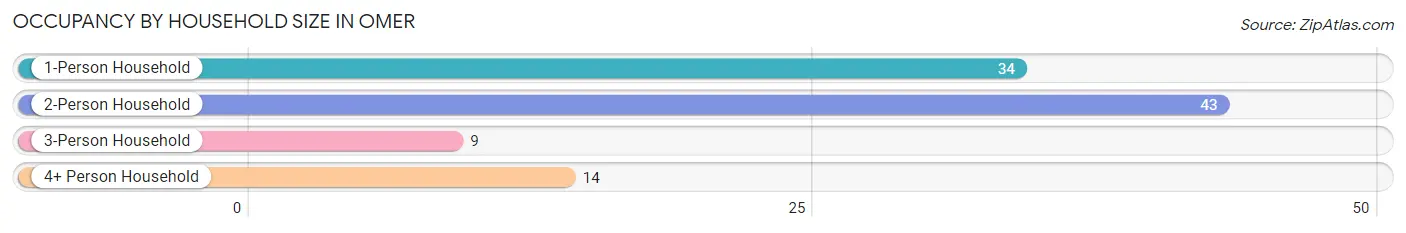
| Household Size | # Housing Units | % Housing Units |
| 1-Person Household | 34 | 34.0% |
| 2-Person Household | 43 | 43.0% |
| 3-Person Household | 9 | 9.0% |
| 4+ Person Household | 14 | 14.0% |
| Total Housing Units | 100 | 100.0% |
Occupancy by Ownership by Household Size in Omer
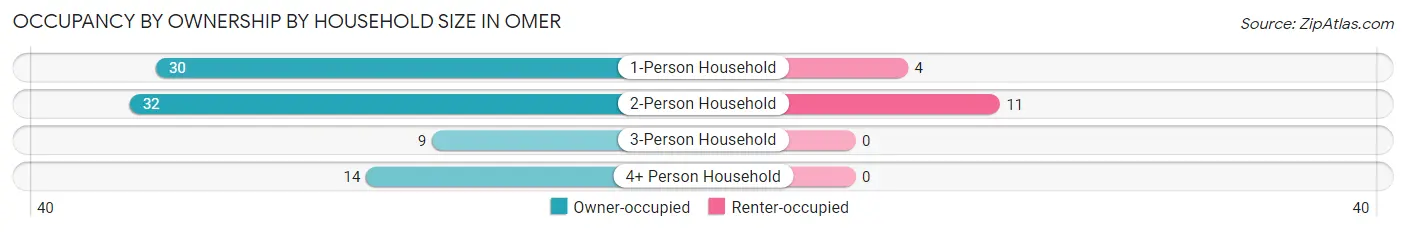
| Household Size | Owner-occupied | Renter-occupied |
| 1-Person Household | 30 (88.2%) | 4 (11.8%) |
| 2-Person Household | 32 (74.4%) | 11 (25.6%) |
| 3-Person Household | 9 (100.0%) | 0 (0.0%) |
| 4+ Person Household | 14 (100.0%) | 0 (0.0%) |
| Total Housing Units | 85 (85.0%) | 15 (15.0%) |
Occupancy by Educational Attainment in Omer
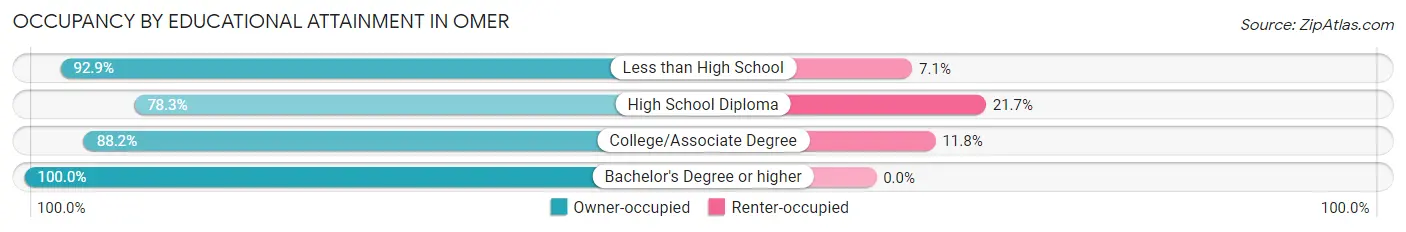
| Household Size | Owner-occupied | Renter-occupied |
| Less than High School | 13 (92.9%) | 1 (7.1%) |
| High School Diploma | 36 (78.3%) | 10 (21.7%) |
| College/Associate Degree | 30 (88.2%) | 4 (11.8%) |
| Bachelor's Degree or higher | 6 (100.0%) | 0 (0.0%) |
Occupancy by Age of Householder in Omer
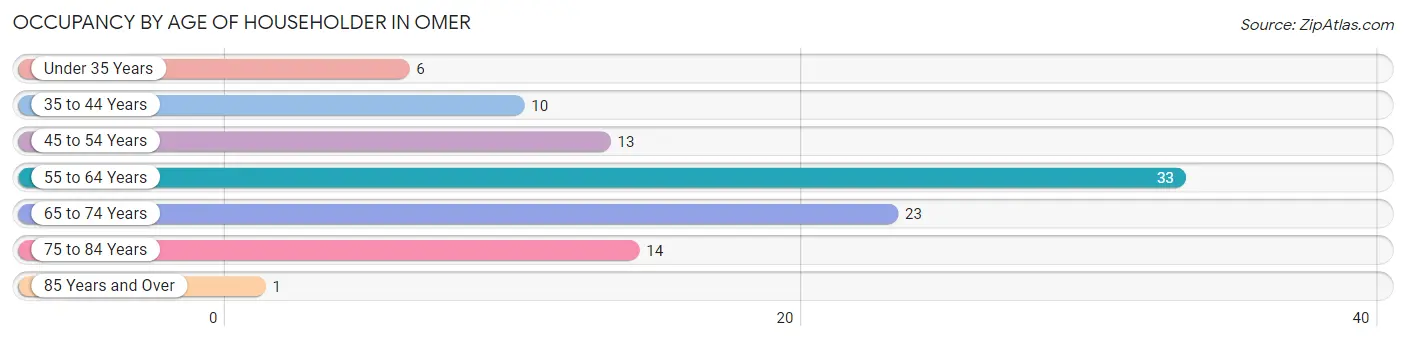
| Age Bracket | # Households | % Households |
| Under 35 Years | 6 | 6.0% |
| 35 to 44 Years | 10 | 10.0% |
| 45 to 54 Years | 13 | 13.0% |
| 55 to 64 Years | 33 | 33.0% |
| 65 to 74 Years | 23 | 23.0% |
| 75 to 84 Years | 14 | 14.0% |
| 85 Years and Over | 1 | 1.0% |
| Total | 100 | 100.0% |
Housing Finances in Omer
Median Income by Occupancy in Omer
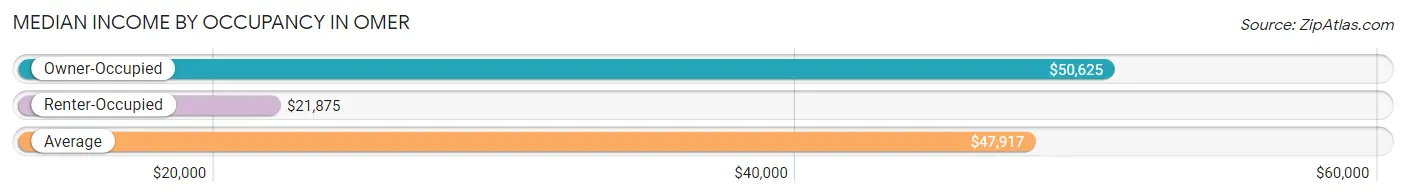
| Occupancy Type | # Households | Median Income |
| Owner-Occupied | 85 (85.0%) | $50,625 |
| Renter-Occupied | 15 (15.0%) | $21,875 |
| Average | 100 (100.0%) | $47,917 |
Occupancy by Householder Income Bracket in Omer
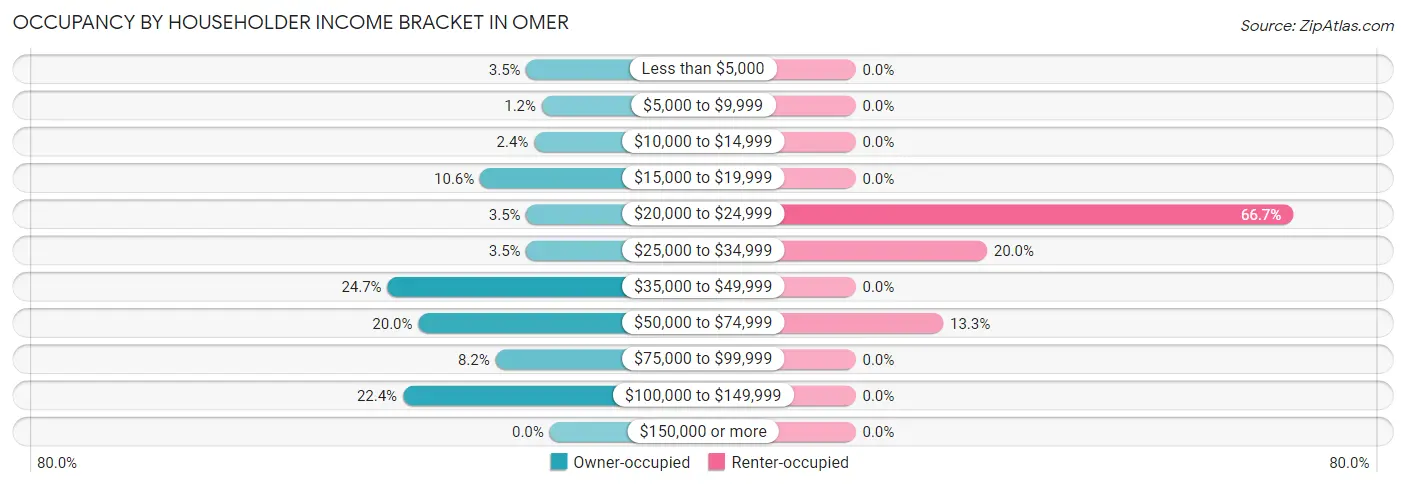
| Income Bracket | Owner-occupied | Renter-occupied |
| Less than $5,000 | 3 (3.5%) | 0 (0.0%) |
| $5,000 to $9,999 | 1 (1.2%) | 0 (0.0%) |
| $10,000 to $14,999 | 2 (2.4%) | 0 (0.0%) |
| $15,000 to $19,999 | 9 (10.6%) | 0 (0.0%) |
| $20,000 to $24,999 | 3 (3.5%) | 10 (66.7%) |
| $25,000 to $34,999 | 3 (3.5%) | 3 (20.0%) |
| $35,000 to $49,999 | 21 (24.7%) | 0 (0.0%) |
| $50,000 to $74,999 | 17 (20.0%) | 2 (13.3%) |
| $75,000 to $99,999 | 7 (8.2%) | 0 (0.0%) |
| $100,000 to $149,999 | 19 (22.4%) | 0 (0.0%) |
| $150,000 or more | 0 (0.0%) | 0 (0.0%) |
| Total | 85 (100.0%) | 15 (100.0%) |
Monthly Housing Cost Tiers in Omer
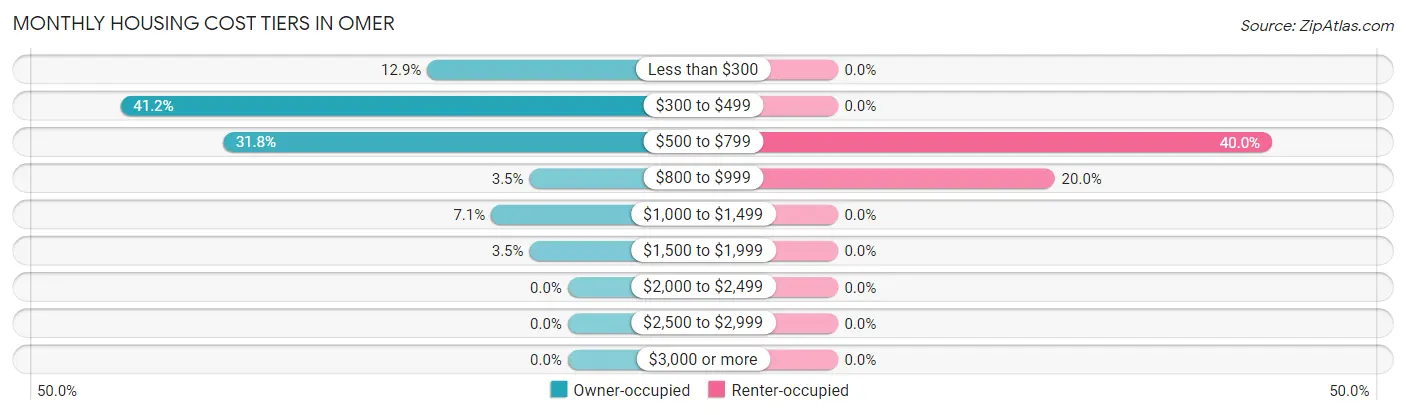
| Monthly Cost | Owner-occupied | Renter-occupied |
| Less than $300 | 11 (12.9%) | 0 (0.0%) |
| $300 to $499 | 35 (41.2%) | 0 (0.0%) |
| $500 to $799 | 27 (31.8%) | 6 (40.0%) |
| $800 to $999 | 3 (3.5%) | 3 (20.0%) |
| $1,000 to $1,499 | 6 (7.1%) | 0 (0.0%) |
| $1,500 to $1,999 | 3 (3.5%) | 0 (0.0%) |
| $2,000 to $2,499 | 0 (0.0%) | 0 (0.0%) |
| $2,500 to $2,999 | 0 (0.0%) | 0 (0.0%) |
| $3,000 or more | 0 (0.0%) | 0 (0.0%) |
| Total | 85 (100.0%) | 15 (100.0%) |
Physical Housing Characteristics in Omer
Housing Structures in Omer
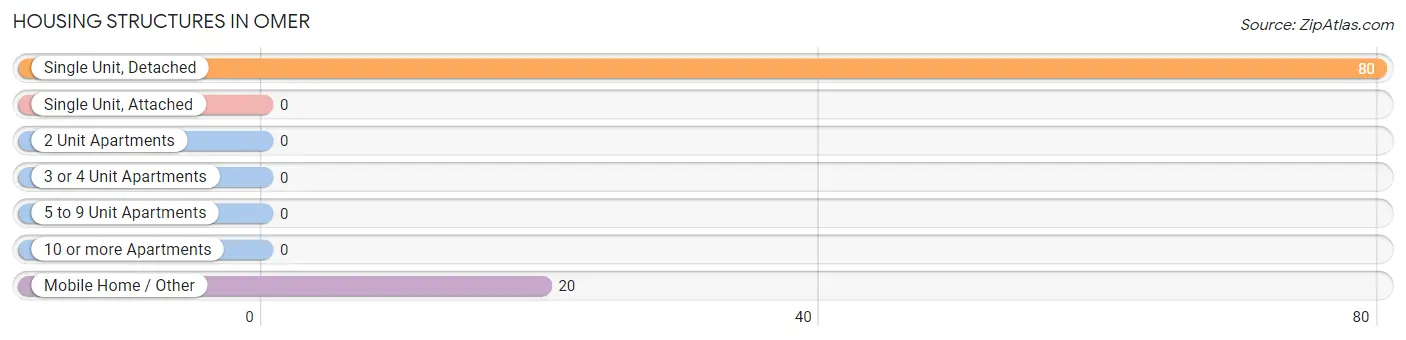
| Structure Type | # Housing Units | % Housing Units |
| Single Unit, Detached | 80 | 80.0% |
| Single Unit, Attached | 0 | 0.0% |
| 2 Unit Apartments | 0 | 0.0% |
| 3 or 4 Unit Apartments | 0 | 0.0% |
| 5 to 9 Unit Apartments | 0 | 0.0% |
| 10 or more Apartments | 0 | 0.0% |
| Mobile Home / Other | 20 | 20.0% |
| Total | 100 | 100.0% |
Housing Structures by Occupancy in Omer
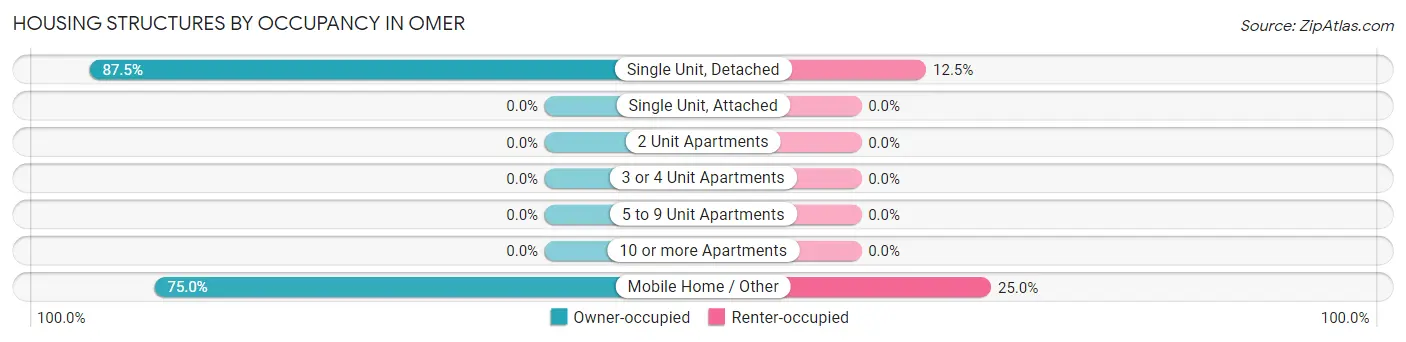
| Structure Type | Owner-occupied | Renter-occupied |
| Single Unit, Detached | 70 (87.5%) | 10 (12.5%) |
| Single Unit, Attached | 0 (0.0%) | 0 (0.0%) |
| 2 Unit Apartments | 0 (0.0%) | 0 (0.0%) |
| 3 or 4 Unit Apartments | 0 (0.0%) | 0 (0.0%) |
| 5 to 9 Unit Apartments | 0 (0.0%) | 0 (0.0%) |
| 10 or more Apartments | 0 (0.0%) | 0 (0.0%) |
| Mobile Home / Other | 15 (75.0%) | 5 (25.0%) |
| Total | 85 (85.0%) | 15 (15.0%) |
Housing Structures by Number of Rooms in Omer
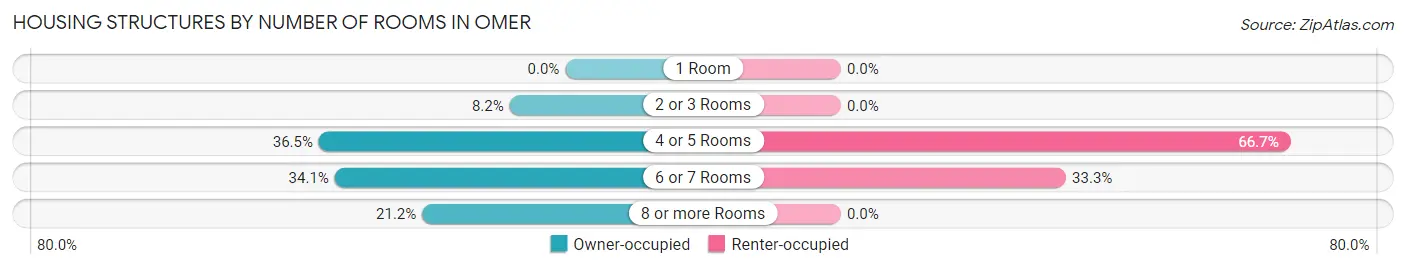
| Number of Rooms | Owner-occupied | Renter-occupied |
| 1 Room | 0 (0.0%) | 0 (0.0%) |
| 2 or 3 Rooms | 7 (8.2%) | 0 (0.0%) |
| 4 or 5 Rooms | 31 (36.5%) | 10 (66.7%) |
| 6 or 7 Rooms | 29 (34.1%) | 5 (33.3%) |
| 8 or more Rooms | 18 (21.2%) | 0 (0.0%) |
| Total | 85 (100.0%) | 15 (100.0%) |
Housing Structure by Heating Type in Omer
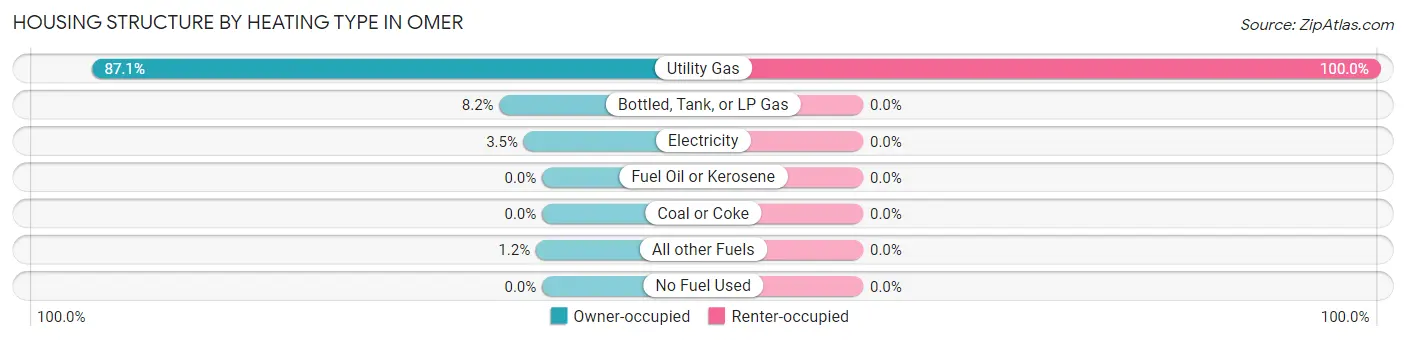
| Heating Type | Owner-occupied | Renter-occupied |
| Utility Gas | 74 (87.1%) | 15 (100.0%) |
| Bottled, Tank, or LP Gas | 7 (8.2%) | 0 (0.0%) |
| Electricity | 3 (3.5%) | 0 (0.0%) |
| Fuel Oil or Kerosene | 0 (0.0%) | 0 (0.0%) |
| Coal or Coke | 0 (0.0%) | 0 (0.0%) |
| All other Fuels | 1 (1.2%) | 0 (0.0%) |
| No Fuel Used | 0 (0.0%) | 0 (0.0%) |
| Total | 85 (100.0%) | 15 (100.0%) |
Household Vehicle Usage in Omer
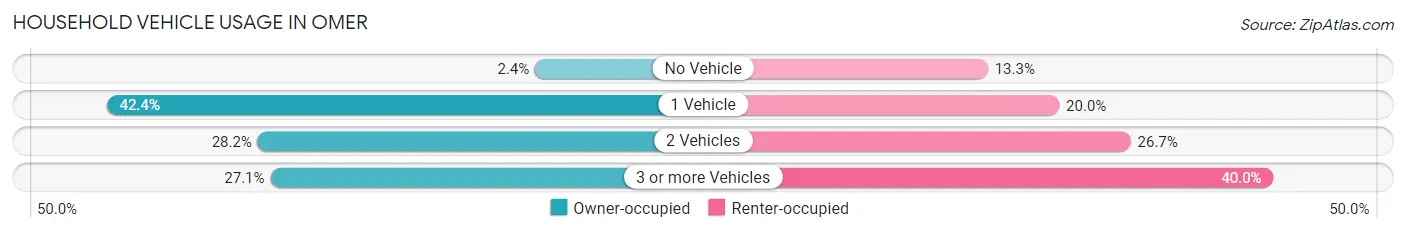
| Vehicles per Household | Owner-occupied | Renter-occupied |
| No Vehicle | 2 (2.4%) | 2 (13.3%) |
| 1 Vehicle | 36 (42.3%) | 3 (20.0%) |
| 2 Vehicles | 24 (28.2%) | 4 (26.7%) |
| 3 or more Vehicles | 23 (27.1%) | 6 (40.0%) |
| Total | 85 (100.0%) | 15 (100.0%) |
Real Estate & Mortgages in Omer
Real Estate and Mortgage Overview in Omer
| Characteristic | Without Mortgage | With Mortgage |
| Housing Units | 59 | 26 |
| Median Property Value | $88,100 | $82,900 |
| Median Household Income | $50,625 | $0 |
| Monthly Housing Costs | $394 | $0 |
| Real Estate Taxes | $1,296 | $0 |
Property Value by Mortgage Status in Omer
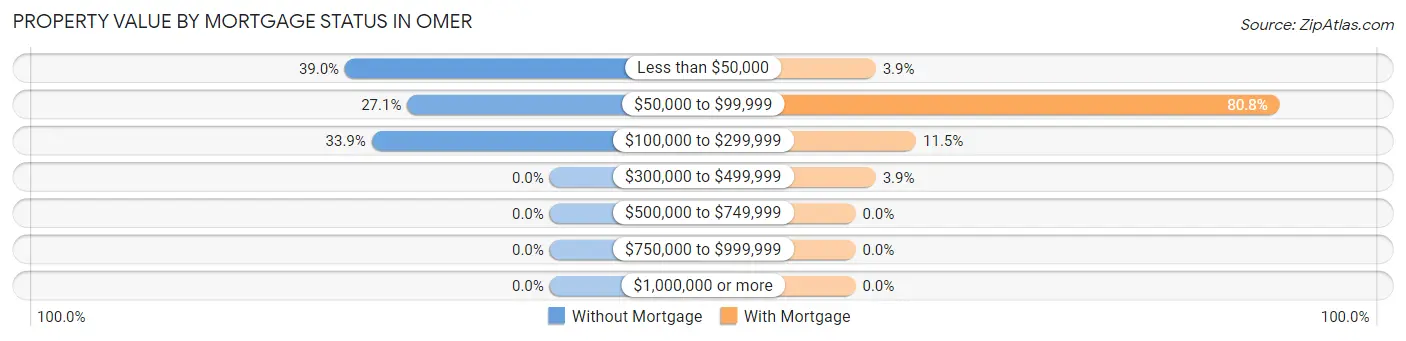
| Property Value | Without Mortgage | With Mortgage |
| Less than $50,000 | 23 (39.0%) | 1 (3.8%) |
| $50,000 to $99,999 | 16 (27.1%) | 21 (80.8%) |
| $100,000 to $299,999 | 20 (33.9%) | 3 (11.5%) |
| $300,000 to $499,999 | 0 (0.0%) | 1 (3.8%) |
| $500,000 to $749,999 | 0 (0.0%) | 0 (0.0%) |
| $750,000 to $999,999 | 0 (0.0%) | 0 (0.0%) |
| $1,000,000 or more | 0 (0.0%) | 0 (0.0%) |
| Total | 59 (100.0%) | 26 (100.0%) |
Household Income by Mortgage Status in Omer
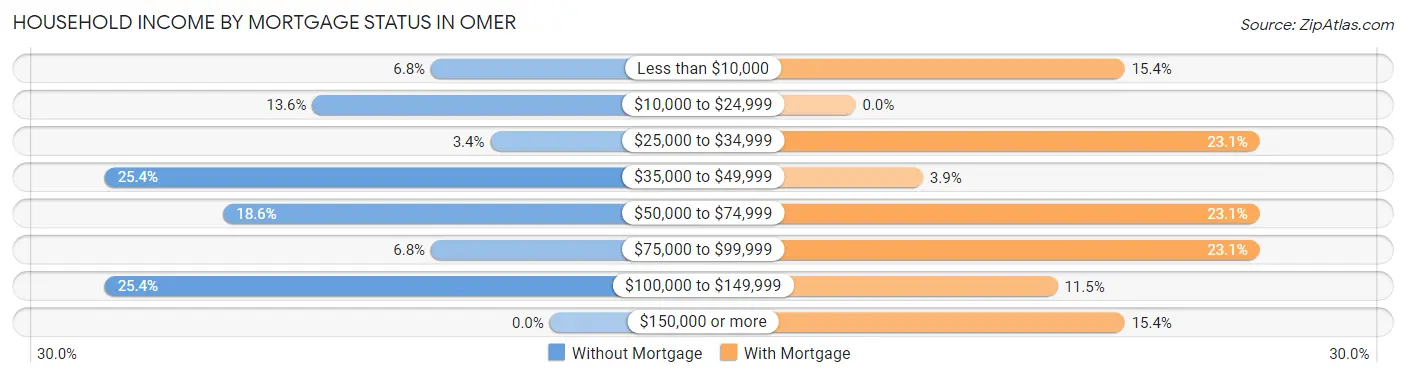
| Household Income | Without Mortgage | With Mortgage |
| Less than $10,000 | 4 (6.8%) | 4 (15.4%) |
| $10,000 to $24,999 | 8 (13.6%) | 0 (0.0%) |
| $25,000 to $34,999 | 2 (3.4%) | 6 (23.1%) |
| $35,000 to $49,999 | 15 (25.4%) | 1 (3.8%) |
| $50,000 to $74,999 | 11 (18.6%) | 6 (23.1%) |
| $75,000 to $99,999 | 4 (6.8%) | 6 (23.1%) |
| $100,000 to $149,999 | 15 (25.4%) | 3 (11.5%) |
| $150,000 or more | 0 (0.0%) | 4 (15.4%) |
| Total | 59 (100.0%) | 26 (100.0%) |
Property Value to Household Income Ratio in Omer
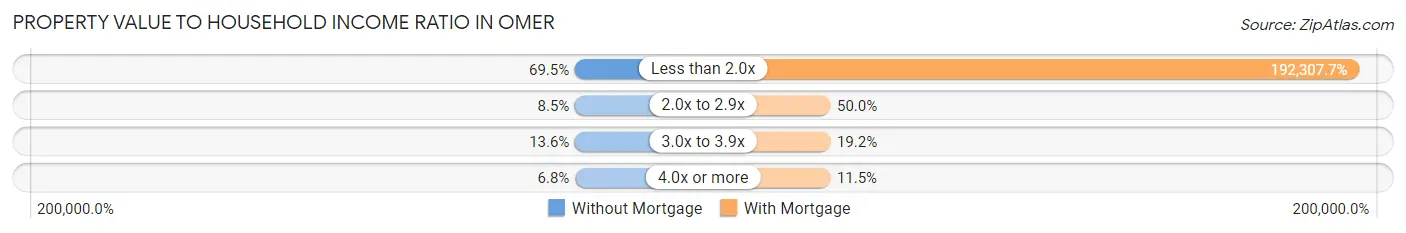
| Value-to-Income Ratio | Without Mortgage | With Mortgage |
| Less than 2.0x | 41 (69.5%) | 50,000 (192,307.7%) |
| 2.0x to 2.9x | 5 (8.5%) | 13 (50.0%) |
| 3.0x to 3.9x | 8 (13.6%) | 5 (19.2%) |
| 4.0x or more | 4 (6.8%) | 3 (11.5%) |
| Total | 59 (100.0%) | 26 (100.0%) |
Real Estate Taxes by Mortgage Status in Omer
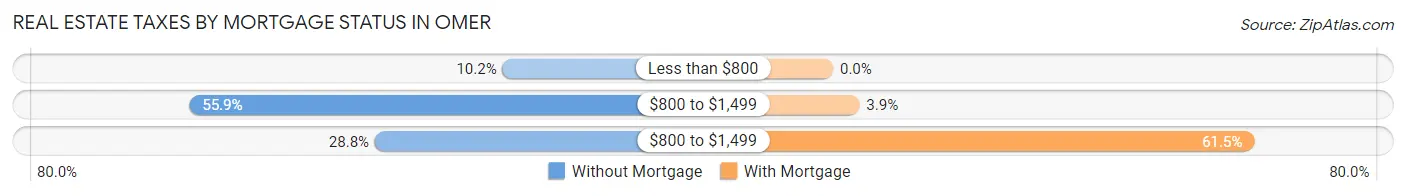
| Property Taxes | Without Mortgage | With Mortgage |
| Less than $800 | 6 (10.2%) | 0 (0.0%) |
| $800 to $1,499 | 33 (55.9%) | 1 (3.8%) |
| $800 to $1,499 | 17 (28.8%) | 16 (61.5%) |
| Total | 59 (100.0%) | 26 (100.0%) |
Health & Disability in Omer
Health Insurance Coverage by Age in Omer
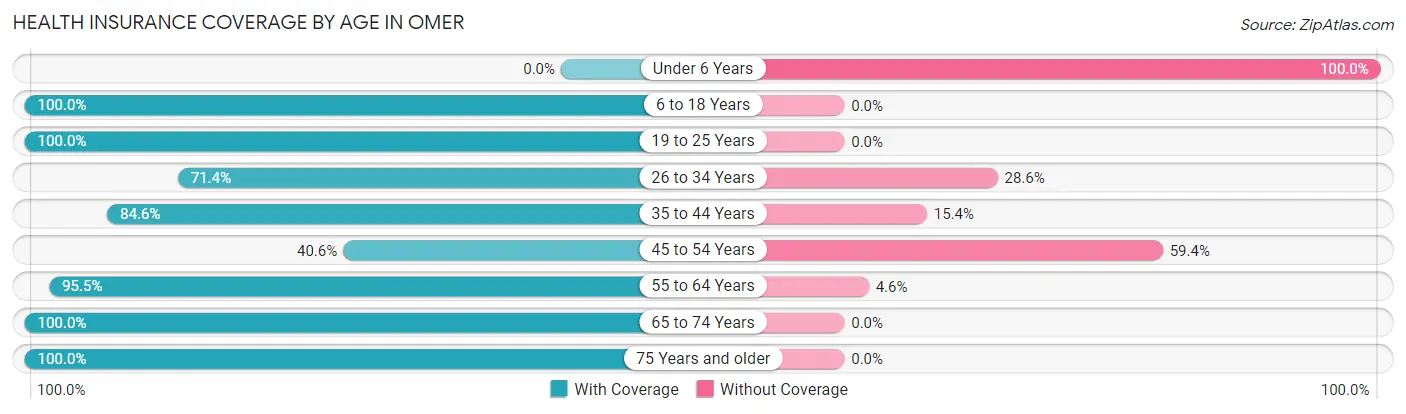
| Age Bracket | With Coverage | Without Coverage |
| Under 6 Years | 0 (0.0%) | 1 (100.0%) |
| 6 to 18 Years | 33 (100.0%) | 0 (0.0%) |
| 19 to 25 Years | 8 (100.0%) | 0 (0.0%) |
| 26 to 34 Years | 15 (71.4%) | 6 (28.6%) |
| 35 to 44 Years | 11 (84.6%) | 2 (15.4%) |
| 45 to 54 Years | 13 (40.6%) | 19 (59.4%) |
| 55 to 64 Years | 63 (95.5%) | 3 (4.5%) |
| 65 to 74 Years | 50 (100.0%) | 0 (0.0%) |
| 75 Years and older | 21 (100.0%) | 0 (0.0%) |
| Total | 214 (87.4%) | 31 (12.7%) |
Health Insurance Coverage by Citizenship Status in Omer
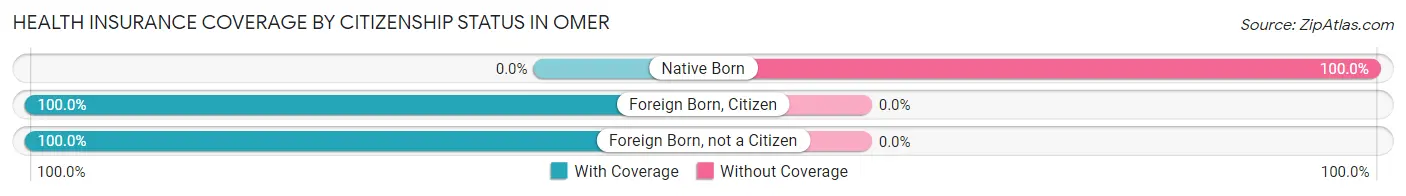
| Citizenship Status | With Coverage | Without Coverage |
| Native Born | 0 (0.0%) | 1 (100.0%) |
| Foreign Born, Citizen | 33 (100.0%) | 0 (0.0%) |
| Foreign Born, not a Citizen | 8 (100.0%) | 0 (0.0%) |
Health Insurance Coverage by Household Income in Omer
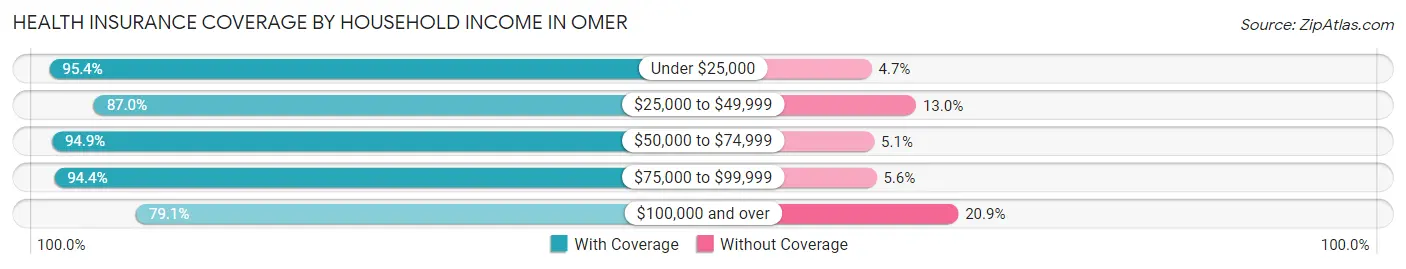
| Household Income | With Coverage | Without Coverage |
| Under $25,000 | 41 (95.4%) | 2 (4.6%) |
| $25,000 to $49,999 | 47 (87.0%) | 7 (13.0%) |
| $50,000 to $74,999 | 37 (94.9%) | 2 (5.1%) |
| $75,000 to $99,999 | 17 (94.4%) | 1 (5.6%) |
| $100,000 and over | 72 (79.1%) | 19 (20.9%) |
Public vs Private Health Insurance Coverage by Age in Omer
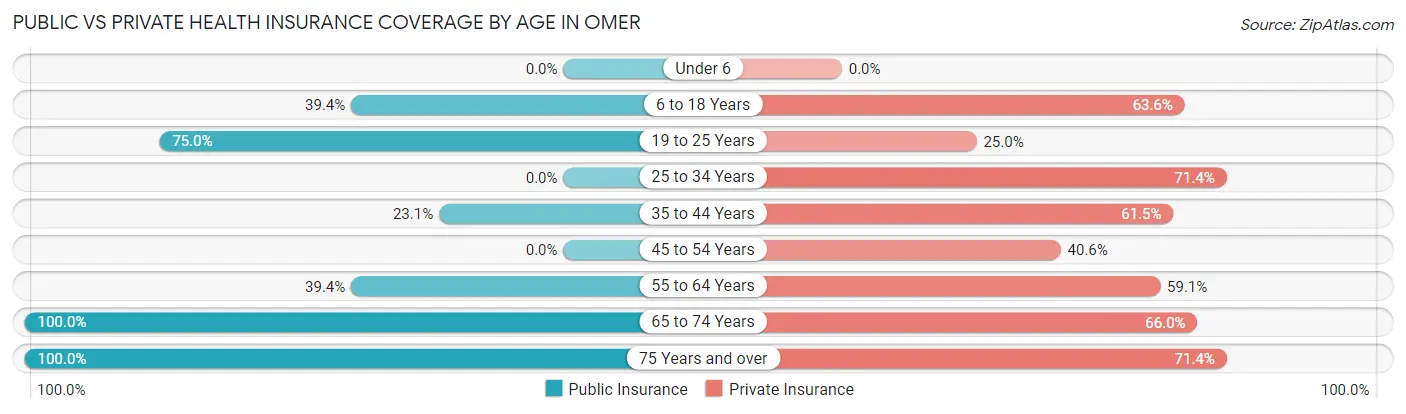
| Age Bracket | Public Insurance | Private Insurance |
| Under 6 | 0 (0.0%) | 0 (0.0%) |
| 6 to 18 Years | 13 (39.4%) | 21 (63.6%) |
| 19 to 25 Years | 6 (75.0%) | 2 (25.0%) |
| 25 to 34 Years | 0 (0.0%) | 15 (71.4%) |
| 35 to 44 Years | 3 (23.1%) | 8 (61.5%) |
| 45 to 54 Years | 0 (0.0%) | 13 (40.6%) |
| 55 to 64 Years | 26 (39.4%) | 39 (59.1%) |
| 65 to 74 Years | 50 (100.0%) | 33 (66.0%) |
| 75 Years and over | 21 (100.0%) | 15 (71.4%) |
| Total | 119 (48.6%) | 146 (59.6%) |
Disability Status by Sex by Age in Omer
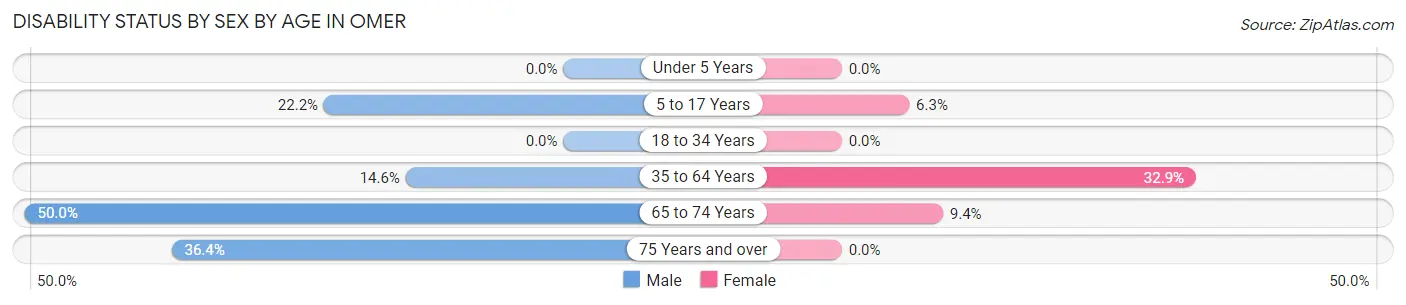
| Age Bracket | Male | Female |
| Under 5 Years | 0 (0.0%) | 0 (0.0%) |
| 5 to 17 Years | 2 (22.2%) | 1 (6.2%) |
| 18 to 34 Years | 0 (0.0%) | 0 (0.0%) |
| 35 to 64 Years | 6 (14.6%) | 23 (32.9%) |
| 65 to 74 Years | 9 (50.0%) | 3 (9.4%) |
| 75 Years and over | 4 (36.4%) | 0 (0.0%) |
Disability Class by Sex by Age in Omer
Disability Class: Hearing Difficulty
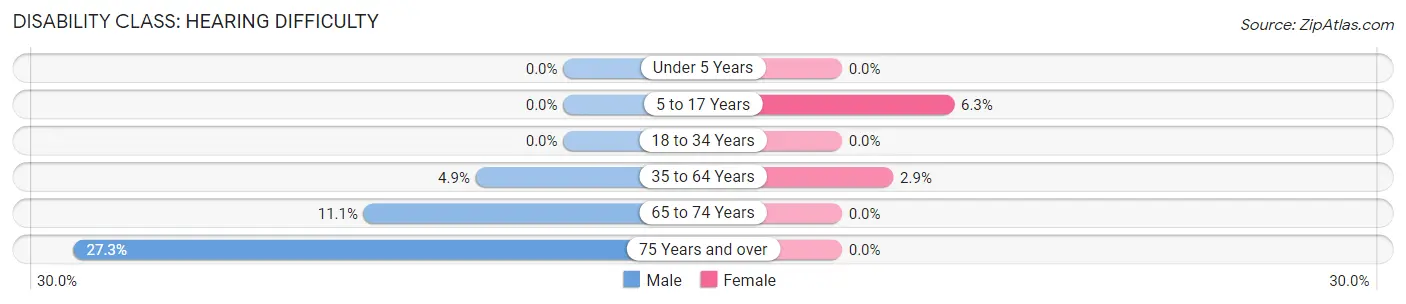
| Age Bracket | Male | Female |
| Under 5 Years | 0 (0.0%) | 0 (0.0%) |
| 5 to 17 Years | 0 (0.0%) | 1 (6.2%) |
| 18 to 34 Years | 0 (0.0%) | 0 (0.0%) |
| 35 to 64 Years | 2 (4.9%) | 2 (2.9%) |
| 65 to 74 Years | 2 (11.1%) | 0 (0.0%) |
| 75 Years and over | 3 (27.3%) | 0 (0.0%) |
Disability Class: Vision Difficulty
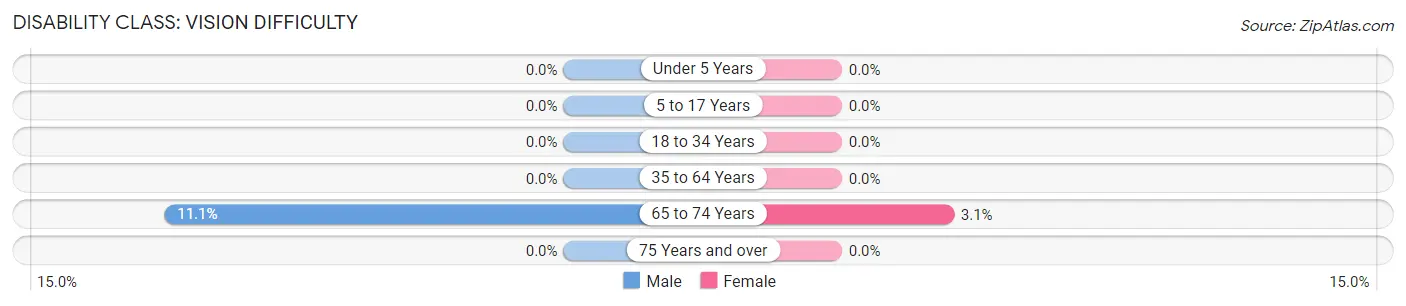
| Age Bracket | Male | Female |
| Under 5 Years | 0 (0.0%) | 0 (0.0%) |
| 5 to 17 Years | 0 (0.0%) | 0 (0.0%) |
| 18 to 34 Years | 0 (0.0%) | 0 (0.0%) |
| 35 to 64 Years | 0 (0.0%) | 0 (0.0%) |
| 65 to 74 Years | 2 (11.1%) | 1 (3.1%) |
| 75 Years and over | 0 (0.0%) | 0 (0.0%) |
Disability Class: Cognitive Difficulty
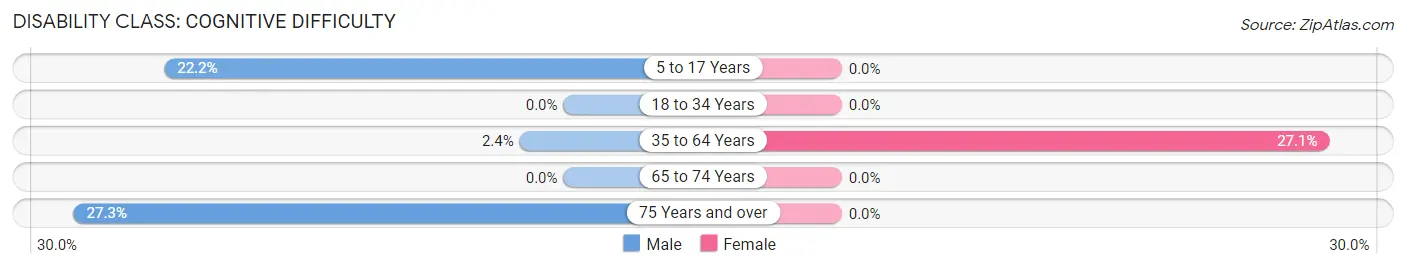
| Age Bracket | Male | Female |
| 5 to 17 Years | 2 (22.2%) | 0 (0.0%) |
| 18 to 34 Years | 0 (0.0%) | 0 (0.0%) |
| 35 to 64 Years | 1 (2.4%) | 19 (27.1%) |
| 65 to 74 Years | 0 (0.0%) | 0 (0.0%) |
| 75 Years and over | 3 (27.3%) | 0 (0.0%) |
Disability Class: Ambulatory Difficulty
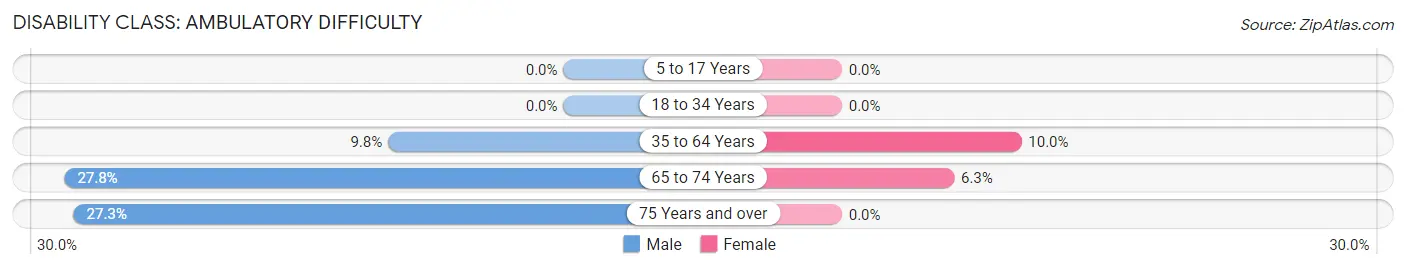
| Age Bracket | Male | Female |
| 5 to 17 Years | 0 (0.0%) | 0 (0.0%) |
| 18 to 34 Years | 0 (0.0%) | 0 (0.0%) |
| 35 to 64 Years | 4 (9.8%) | 7 (10.0%) |
| 65 to 74 Years | 5 (27.8%) | 2 (6.2%) |
| 75 Years and over | 3 (27.3%) | 0 (0.0%) |
Disability Class: Self-Care Difficulty
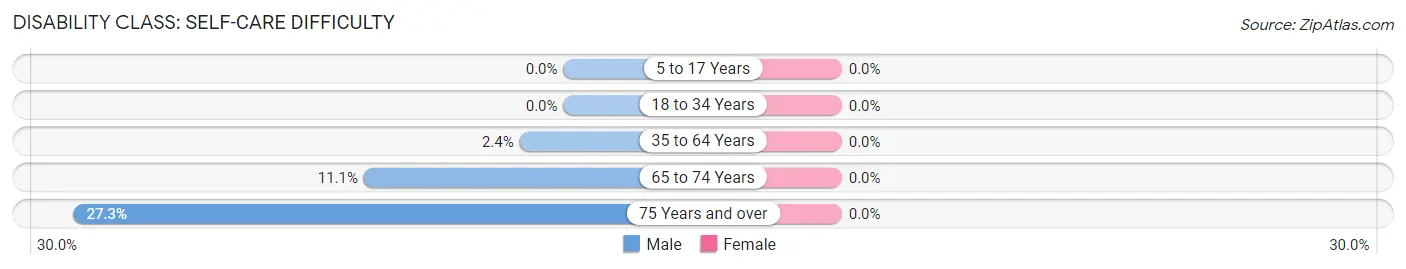
| Age Bracket | Male | Female |
| 5 to 17 Years | 0 (0.0%) | 0 (0.0%) |
| 18 to 34 Years | 0 (0.0%) | 0 (0.0%) |
| 35 to 64 Years | 1 (2.4%) | 0 (0.0%) |
| 65 to 74 Years | 2 (11.1%) | 0 (0.0%) |
| 75 Years and over | 3 (27.3%) | 0 (0.0%) |
Technology Access in Omer
Computing Device Access in Omer
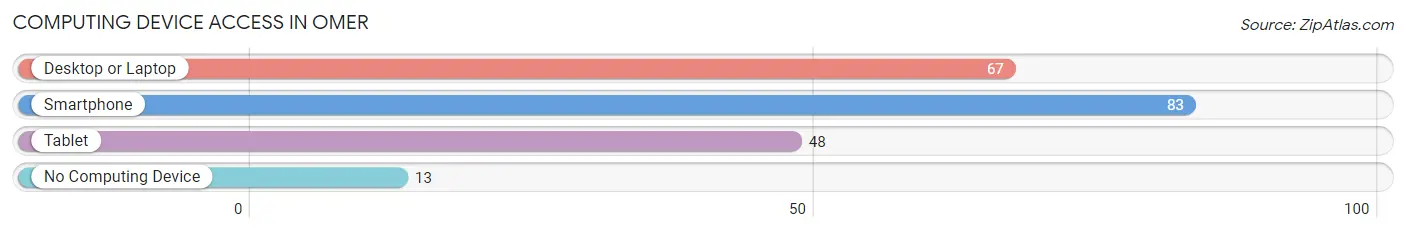
| Device Type | # Households | % Households |
| Desktop or Laptop | 67 | 67.0% |
| Smartphone | 83 | 83.0% |
| Tablet | 48 | 48.0% |
| No Computing Device | 13 | 13.0% |
| Total | 100 | 100.0% |
Internet Access in Omer
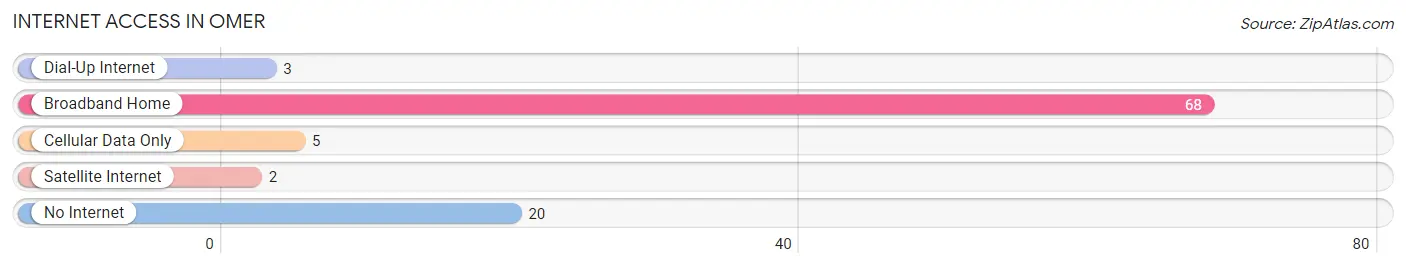
| Internet Type | # Households | % Households |
| Dial-Up Internet | 3 | 3.0% |
| Broadband Home | 68 | 68.0% |
| Cellular Data Only | 5 | 5.0% |
| Satellite Internet | 2 | 2.0% |
| No Internet | 20 | 20.0% |
| Total | 100 | 100.0% |
Omer Summary
Omer is a small city located in Arenac County, Michigan. It is situated in the northeastern part of the state, about 20 miles from the city of Saginaw. The city has a population of approximately 1,000 people and covers an area of 1.2 square miles.
History
Omer was first settled in 1881 by a group of lumberjacks from Canada. The city was named after Omer LaFlamme, one of the original settlers. The city was incorporated in 1887 and quickly became a hub for the lumber industry. The city was also home to a number of sawmills and other businesses related to the lumber industry.
In the early 1900s, the city began to diversify its economy. A number of small businesses opened up, including a general store, a blacksmith shop, and a hotel. The city also became a popular destination for tourists, who came to enjoy the area’s natural beauty.
Geography
Omer is located in the northeastern part of Michigan, about 20 miles from the city of Saginaw. The city is situated on the banks of the Rifle River, which flows through the city. The city is surrounded by a number of small lakes, including Lake Omer, which is located just outside of the city limits. The city is also located near the Au Sable State Forest, which provides a number of recreational opportunities.
Economy
The economy of Omer is largely based on the lumber industry. The city is home to a number of sawmills and other businesses related to the lumber industry. The city also has a number of small businesses, including a general store, a blacksmith shop, and a hotel.
The city is also home to a number of manufacturing businesses, including a furniture factory and a metal fabrication plant. The city is also home to a number of agricultural businesses, including a dairy farm and a number of fruit and vegetable farms.
Demographics
As of the 2010 census, the population of Omer was 1,000 people. The racial makeup of the city was 97.2% White, 0.7% African American, 0.3% Native American, 0.2% Asian, 0.1% Pacific Islander, and 1.5% from other races. The median household income in the city was $37,500, and the median family income was $45,000.
Conclusion
Omer is a small city located in Arenac County, Michigan. It is situated in the northeastern part of the state, about 20 miles from the city of Saginaw. The city has a population of approximately 1,000 people and covers an area of 1.2 square miles. The economy of Omer is largely based on the lumber industry, but the city also has a number of small businesses and manufacturing businesses. The racial makeup of the city is predominantly White, with a small percentage of African American, Native American, Asian, and Pacific Islander residents. The median household income in the city is $37,500, and the median family income is $45,000.
Common Questions
What is Per Capita Income in Omer?
Per Capita income in Omer is $26,605.
What is the Median Family Income in Omer?
Median Family Income in Omer is $62,500.
What is the Median Household income in Omer?
Median Household Income in Omer is $47,917.
What is Income or Wage Gap in Omer?
Income or Wage Gap in Omer is 33.1%.
Women in Omer earn 66.9 cents for every dollar earned by a man.
What is Inequality or Gini Index in Omer?
Inequality or Gini Index in Omer is 0.37.
What is the Total Population of Omer?
Total Population of Omer is 245.
What is the Total Male Population of Omer?
Total Male Population of Omer is 109.
What is the Total Female Population of Omer?
Total Female Population of Omer is 136.
What is the Ratio of Males per 100 Females in Omer?
There are 80.15 Males per 100 Females in Omer.
What is the Ratio of Females per 100 Males in Omer?
There are 124.77 Females per 100 Males in Omer.
What is the Median Population Age in Omer?
Median Population Age in Omer is 56.0 Years.
What is the Average Family Size in Omer
Average Family Size in Omer is 3.3 People.
What is the Average Household Size in Omer
Average Household Size in Omer is 2.5 People.
How Large is the Labor Force in Omer?
There are 111 People in the Labor Forcein in Omer.
What is the Percentage of People in the Labor Force in Omer?
48.9% of People are in the Labor Force in Omer.
What is the Unemployment Rate in Omer?
Unemployment Rate in Omer is 13.5%.