Bad Axe, MI Map & Demographics
Bad Axe Map
Bad Axe Overview
$27,341
PER CAPITA INCOME
$67,955
AVG FAMILY INCOME
$45,833
AVG HOUSEHOLD INCOME
37.3%
WAGE / INCOME GAP [ % ]
62.7¢/ $1
WAGE / INCOME GAP [ $ ]
0.41
INEQUALITY / GINI INDEX
3,025
TOTAL POPULATION
1,377
MALE POPULATION
1,648
FEMALE POPULATION
83.56
MALES / 100 FEMALES
119.68
FEMALES / 100 MALES
43.6
MEDIAN AGE
3.4
AVG FAMILY SIZE
2.2
AVG HOUSEHOLD SIZE
1,295
LABOR FORCE [ PEOPLE ]
52.0%
PERCENT IN LABOR FORCE
6.8%
UNEMPLOYMENT RATE
Bad Axe Zip Codes
Bad Axe Area Codes
Income in Bad Axe
Income Overview in Bad Axe
Per Capita Income in Bad Axe is $27,341, while median incomes of families and households are $67,955 and $45,833 respectively.
| Characteristic | Number | Measure |
| Per Capita Income | 3,025 | $27,341 |
| Median Family Income | 546 | $67,955 |
| Mean Family Income | 546 | $74,831 |
| Median Household Income | 1,298 | $45,833 |
| Mean Household Income | 1,298 | $56,634 |
| Income Deficit | 546 | $0 |
| Wage / Income Gap (%) | 3,025 | 37.27% |
| Wage / Income Gap ($) | 3,025 | 62.73¢ per $1 |
| Gini / Inequality Index | 3,025 | 0.41 |
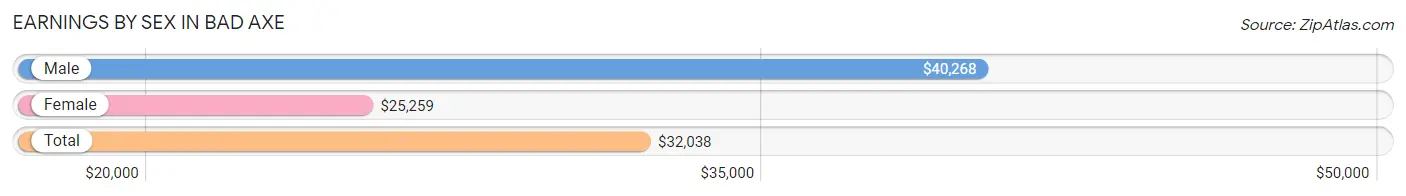
Earnings by Sex in Bad Axe
Average Earnings in Bad Axe are $32,038, $40,268 for men and $25,259 for women, a difference of 37.3%.
| Sex | Number | Average Earnings |
| Male | 734 (51.9%) | $40,268 |
| Female | 680 (48.1%) | $25,259 |
| Total | 1,414 (100.0%) | $32,038 |
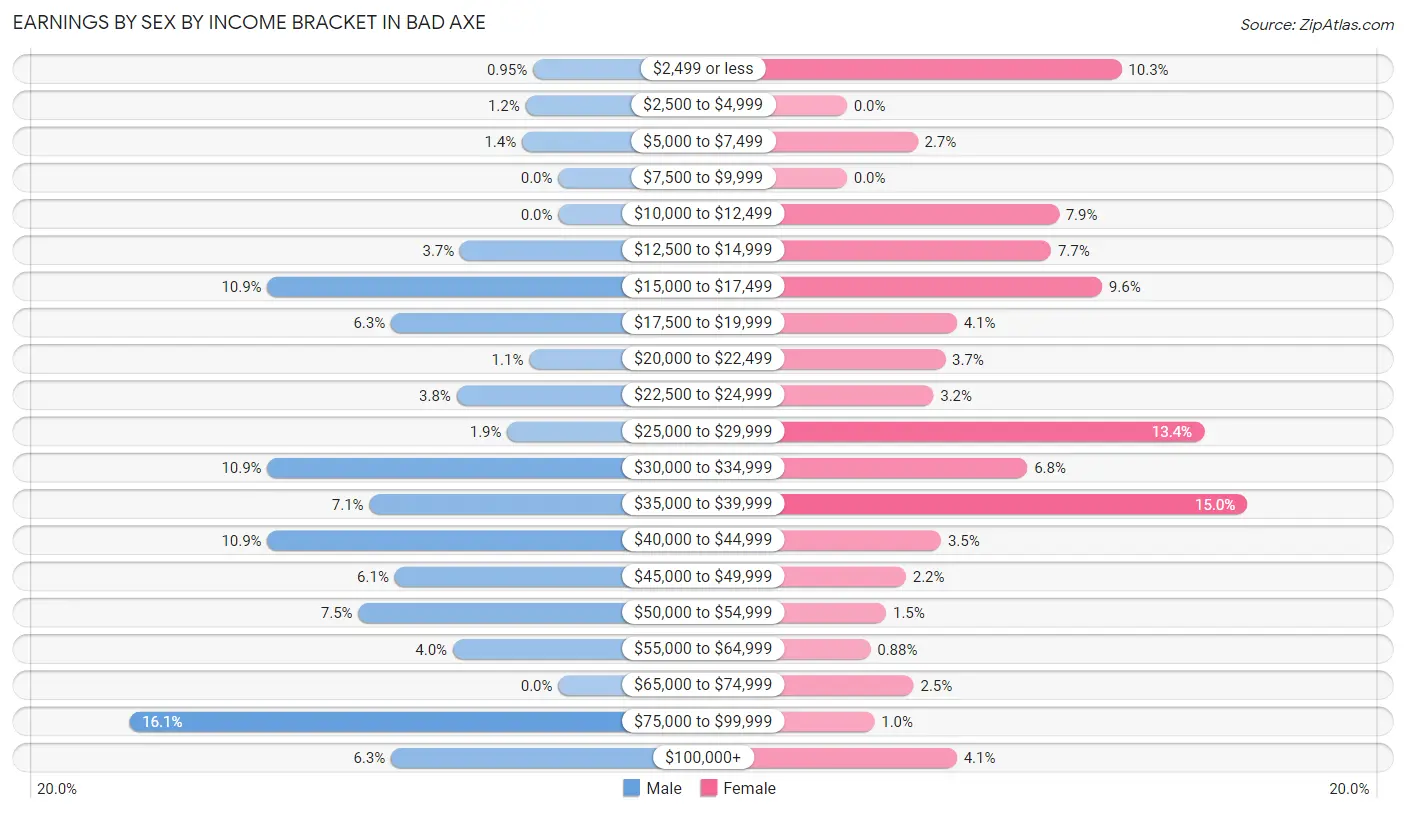
Earnings by Sex by Income Bracket in Bad Axe
The most common earnings brackets in Bad Axe are $75,000 to $99,999 for men (118 | 16.1%) and $35,000 to $39,999 for women (102 | 15.0%).
| Income | Male | Female |
| $2,499 or less | 7 (0.9%) | 70 (10.3%) |
| $2,500 to $4,999 | 9 (1.2%) | 0 (0.0%) |
| $5,000 to $7,499 | 10 (1.4%) | 18 (2.6%) |
| $7,500 to $9,999 | 0 (0.0%) | 0 (0.0%) |
| $10,000 to $12,499 | 0 (0.0%) | 54 (7.9%) |
| $12,500 to $14,999 | 27 (3.7%) | 52 (7.6%) |
| $15,000 to $17,499 | 80 (10.9%) | 65 (9.6%) |
| $17,500 to $19,999 | 46 (6.3%) | 28 (4.1%) |
| $20,000 to $22,499 | 8 (1.1%) | 25 (3.7%) |
| $22,500 to $24,999 | 28 (3.8%) | 22 (3.2%) |
| $25,000 to $29,999 | 14 (1.9%) | 91 (13.4%) |
| $30,000 to $34,999 | 80 (10.9%) | 46 (6.8%) |
| $35,000 to $39,999 | 52 (7.1%) | 102 (15.0%) |
| $40,000 to $44,999 | 80 (10.9%) | 24 (3.5%) |
| $45,000 to $49,999 | 45 (6.1%) | 15 (2.2%) |
| $50,000 to $54,999 | 55 (7.5%) | 10 (1.5%) |
| $55,000 to $64,999 | 29 (4.0%) | 6 (0.9%) |
| $65,000 to $74,999 | 0 (0.0%) | 17 (2.5%) |
| $75,000 to $99,999 | 118 (16.1%) | 7 (1.0%) |
| $100,000+ | 46 (6.3%) | 28 (4.1%) |
| Total | 734 (100.0%) | 680 (100.0%) |
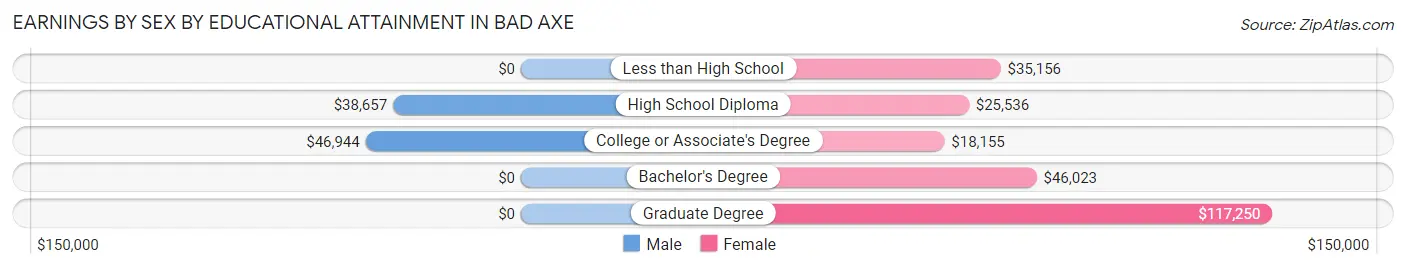
Earnings by Sex by Educational Attainment in Bad Axe
Average earnings in Bad Axe are $41,138 for men and $25,065 for women, a difference of 39.1%. Men with an educational attainment of college or associate's degree enjoy the highest average annual earnings of $46,944, while those with high school diploma education earn the least with $38,657. Women with an educational attainment of graduate degree earn the most with the average annual earnings of $117,250, while those with college or associate's degree education have the smallest earnings of $18,155.
| Educational Attainment | Male Income | Female Income |
| Less than High School | - | - |
| High School Diploma | $38,657 | $25,536 |
| College or Associate's Degree | $46,944 | $18,155 |
| Bachelor's Degree | - | - |
| Graduate Degree | - | - |
| Total | $41,138 | $25,065 |
Family Income in Bad Axe
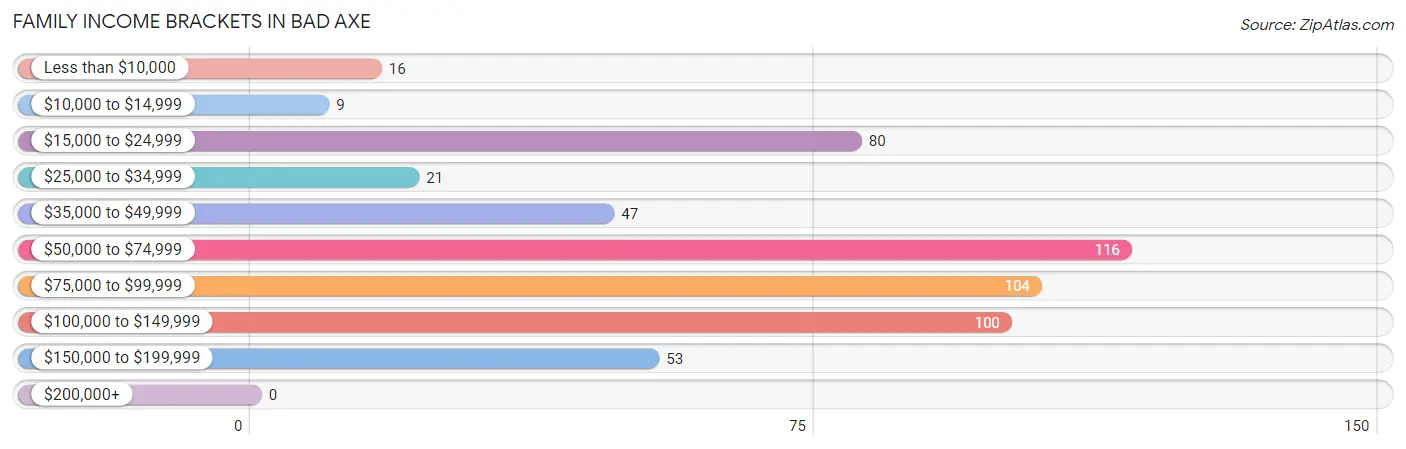
Family Income Brackets in Bad Axe
According to the Bad Axe family income data, there are 116 families falling into the $50,000 to $74,999 income range, which is the most common income bracket and makes up 21.2% of all families.
| Income Bracket | # Families | % Families |
| Less than $10,000 | 16 | 2.9% |
| $10,000 to $14,999 | 9 | 1.6% |
| $15,000 to $24,999 | 80 | 14.7% |
| $25,000 to $34,999 | 21 | 3.8% |
| $35,000 to $49,999 | 47 | 8.6% |
| $50,000 to $74,999 | 116 | 21.2% |
| $75,000 to $99,999 | 104 | 19.0% |
| $100,000 to $149,999 | 100 | 18.3% |
| $150,000 to $199,999 | 53 | 9.7% |
| $200,000+ | 0 | 0.0% |
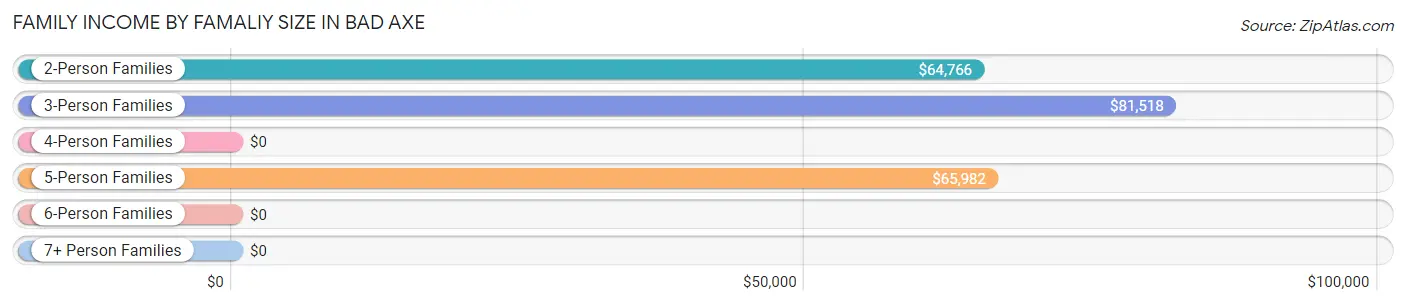
Family Income by Famaliy Size in Bad Axe
3-person families (129 | 23.6%) account for the highest median family income in Bad Axe with $81,518 per family, while 2-person families (317 | 58.1%) have the highest median income of $32,383 per family member.
| Income Bracket | # Families | Median Income |
| 2-Person Families | 317 (58.1%) | $64,766 |
| 3-Person Families | 129 (23.6%) | $81,518 |
| 4-Person Families | 16 (2.9%) | $0 |
| 5-Person Families | 59 (10.8%) | $65,982 |
| 6-Person Families | 16 (2.9%) | $0 |
| 7+ Person Families | 9 (1.7%) | $0 |
| Total | 546 (100.0%) | $67,955 |
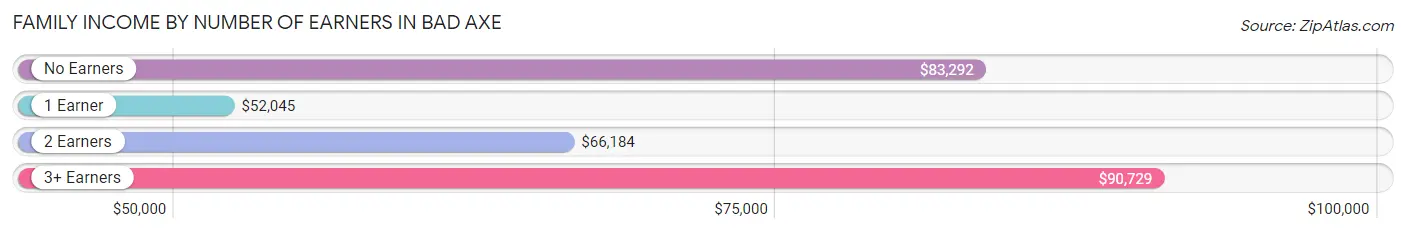
Family Income by Number of Earners in Bad Axe
The median family income in Bad Axe is $67,955, with families comprising 3+ earners (29) having the highest median family income of $90,729, while families with 1 earner (220) have the lowest median family income of $52,045, accounting for 5.3% and 40.3% of families, respectively.
| Number of Earners | # Families | Median Income |
| No Earners | 119 (21.8%) | $83,292 |
| 1 Earner | 220 (40.3%) | $52,045 |
| 2 Earners | 178 (32.6%) | $66,184 |
| 3+ Earners | 29 (5.3%) | $90,729 |
| Total | 546 (100.0%) | $67,955 |
Household Income in Bad Axe
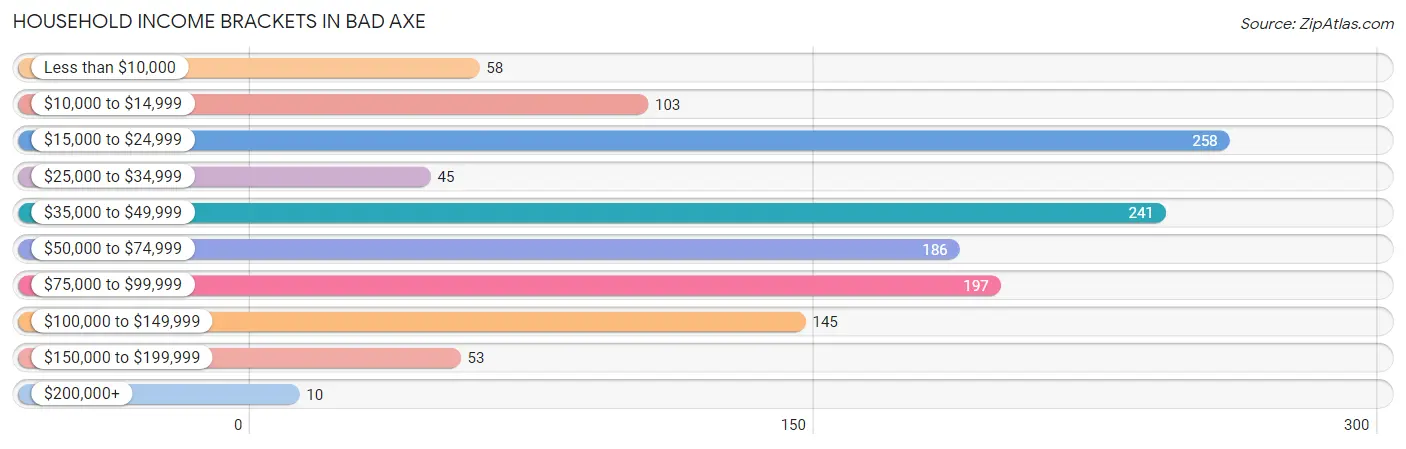
Household Income Brackets in Bad Axe
With 258 households falling in the category, the $15,000 to $24,999 income range is the most frequent in Bad Axe, accounting for 19.9% of all households. In contrast, only 10 households (0.8%) fall into the $200,000+ income bracket, making it the least populous group.
| Income Bracket | # Households | % Households |
| Less than $10,000 | 58 | 4.5% |
| $10,000 to $14,999 | 103 | 7.9% |
| $15,000 to $24,999 | 258 | 19.9% |
| $25,000 to $34,999 | 45 | 3.5% |
| $35,000 to $49,999 | 241 | 18.6% |
| $50,000 to $74,999 | 186 | 14.3% |
| $75,000 to $99,999 | 197 | 15.2% |
| $100,000 to $149,999 | 145 | 11.2% |
| $150,000 to $199,999 | 53 | 4.1% |
| $200,000+ | 10 | 0.8% |
Household Income by Householder Age in Bad Axe
The median household income in Bad Axe is $45,833, with the highest median household income of $77,791 found in the 25 to 44 years age bracket for the primary householder. A total of 458 households (35.3%) fall into this category. Meanwhile, the 15 to 24 years age bracket for the primary householder has the lowest median household income of $0, with 54 households (4.2%) in this group.
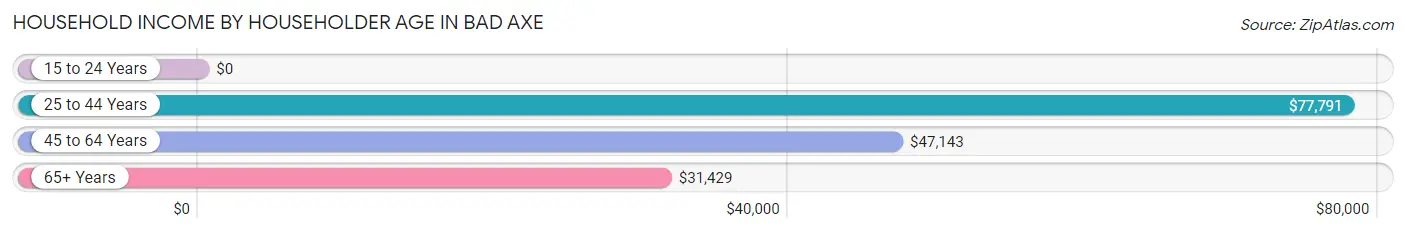
| Income Bracket | # Households | Median Income |
| 15 to 24 Years | 54 (4.2%) | $0 |
| 25 to 44 Years | 458 (35.3%) | $77,791 |
| 45 to 64 Years | 362 (27.9%) | $47,143 |
| 65+ Years | 424 (32.7%) | $31,429 |
| Total | 1,298 (100.0%) | $45,833 |
Poverty in Bad Axe
Income Below Poverty by Sex and Age in Bad Axe
With 11.6% poverty level for males and 15.6% for females among the residents of Bad Axe, 6 to 11 year old males and 12 to 14 year old females are the most vulnerable to poverty, with 71 males (44.1%) and 14 females (100.0%) in their respective age groups living below the poverty level.
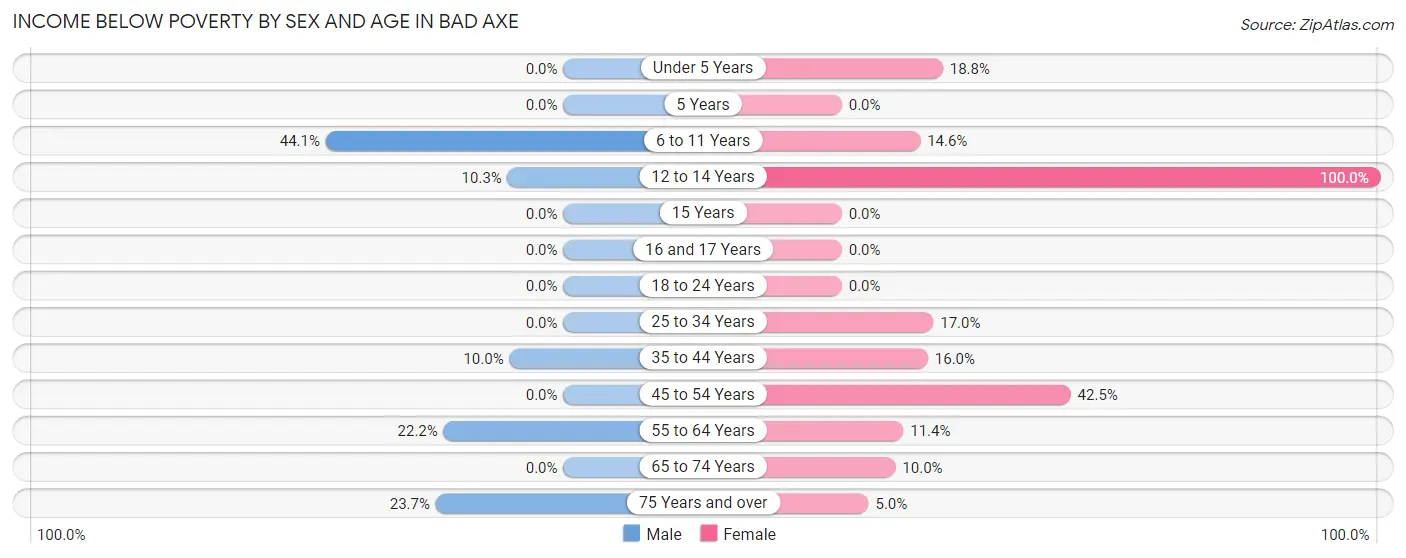
| Age Bracket | Male | Female |
| Under 5 Years | 0 (0.0%) | 15 (18.8%) |
| 5 Years | 0 (0.0%) | 0 (0.0%) |
| 6 to 11 Years | 71 (44.1%) | 24 (14.5%) |
| 12 to 14 Years | 9 (10.3%) | 14 (100.0%) |
| 15 Years | 0 (0.0%) | 0 (0.0%) |
| 16 and 17 Years | 0 (0.0%) | 0 (0.0%) |
| 18 to 24 Years | 0 (0.0%) | 0 (0.0%) |
| 25 to 34 Years | 0 (0.0%) | 44 (17.0%) |
| 35 to 44 Years | 20 (10.0%) | 23 (16.0%) |
| 45 to 54 Years | 0 (0.0%) | 65 (42.5%) |
| 55 to 64 Years | 34 (22.2%) | 30 (11.4%) |
| 65 to 74 Years | 0 (0.0%) | 22 (10.0%) |
| 75 Years and over | 18 (23.7%) | 7 (5.0%) |
| Total | 152 (11.6%) | 244 (15.6%) |
Income Above Poverty by Sex and Age in Bad Axe
According to the poverty statistics in Bad Axe, males aged under 5 years and females aged 16 and 17 years are the age groups that are most secure financially, with 100.0% of males and 100.0% of females in these age groups living above the poverty line.
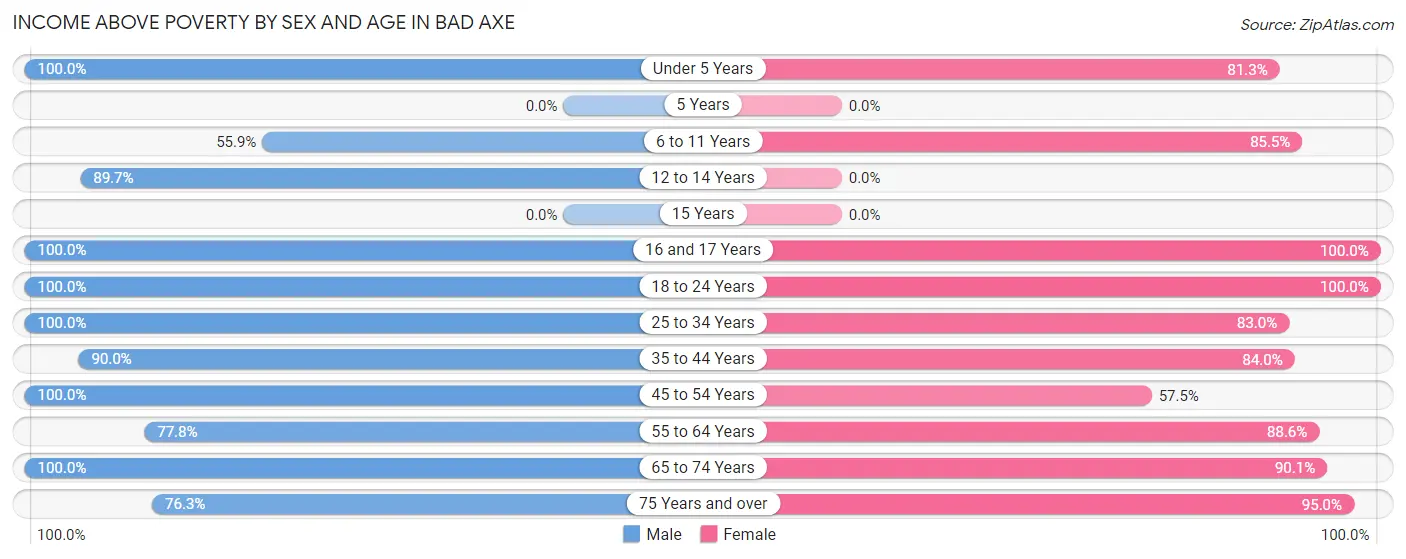
| Age Bracket | Male | Female |
| Under 5 Years | 27 (100.0%) | 65 (81.2%) |
| 5 Years | 0 (0.0%) | 0 (0.0%) |
| 6 to 11 Years | 90 (55.9%) | 141 (85.5%) |
| 12 to 14 Years | 78 (89.7%) | 0 (0.0%) |
| 15 Years | 0 (0.0%) | 0 (0.0%) |
| 16 and 17 Years | 19 (100.0%) | 15 (100.0%) |
| 18 to 24 Years | 39 (100.0%) | 105 (100.0%) |
| 25 to 34 Years | 179 (100.0%) | 215 (83.0%) |
| 35 to 44 Years | 180 (90.0%) | 121 (84.0%) |
| 45 to 54 Years | 172 (100.0%) | 88 (57.5%) |
| 55 to 64 Years | 119 (77.8%) | 233 (88.6%) |
| 65 to 74 Years | 193 (100.0%) | 199 (90.0%) |
| 75 Years and over | 58 (76.3%) | 134 (95.0%) |
| Total | 1,154 (88.4%) | 1,316 (84.4%) |
Income Below Poverty Among Married-Couple Families in Bad Axe
The poverty statistics for married-couple families in Bad Axe show that 2.0% or 7 of the total 347 families live below the poverty line. Families with no children have the highest poverty rate of 3.0%, comprising of 7 families. On the other hand, families with 1 or 2 children have the lowest poverty rate of 0.0%, which includes 0 families.
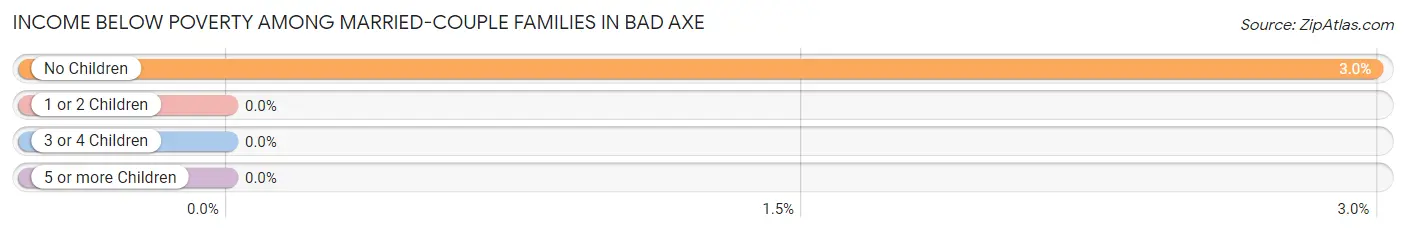
| Children | Above Poverty | Below Poverty |
| No Children | 227 (97.0%) | 7 (3.0%) |
| 1 or 2 Children | 54 (100.0%) | 0 (0.0%) |
| 3 or 4 Children | 50 (100.0%) | 0 (0.0%) |
| 5 or more Children | 9 (100.0%) | 0 (0.0%) |
| Total | 340 (98.0%) | 7 (2.0%) |
Income Below Poverty Among Single-Parent Households in Bad Axe
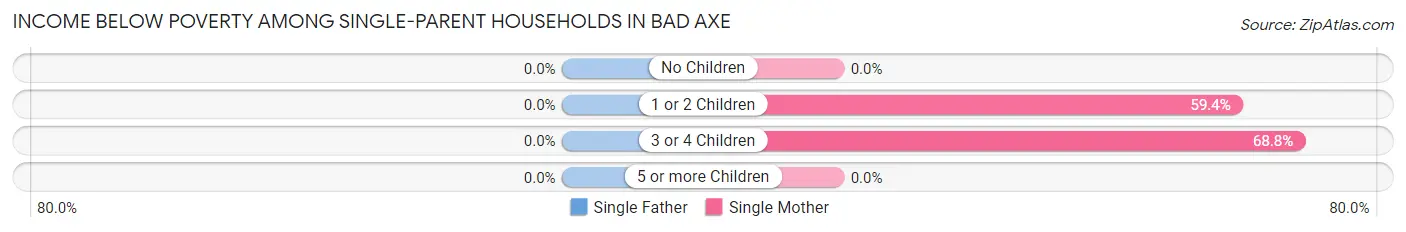
| Children | Single Father | Single Mother |
| No Children | 0 (0.0%) | 0 (0.0%) |
| 1 or 2 Children | 0 (0.0%) | 63 (59.4%) |
| 3 or 4 Children | 0 (0.0%) | 11 (68.8%) |
| 5 or more Children | 0 (0.0%) | 0 (0.0%) |
| Total | 0 (0.0%) | 74 (40.2%) |
Income Below Poverty Among Married-Couple vs Single-Parent Households in Bad Axe
The poverty data for Bad Axe shows that 7 of the married-couple family households (2.0%) and 74 of the single-parent households (37.2%) are living below the poverty level. Within the married-couple family households, those with no children have the highest poverty rate, with 7 households (3.0%) falling below the poverty line. Among the single-parent households, those with 3 or 4 children have the highest poverty rate, with 11 household (68.8%) living below poverty.
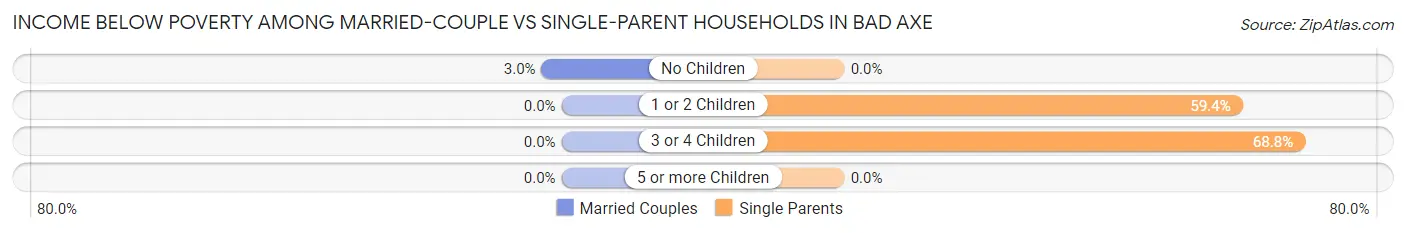
| Children | Married-Couple Families | Single-Parent Households |
| No Children | 7 (3.0%) | 0 (0.0%) |
| 1 or 2 Children | 0 (0.0%) | 63 (59.4%) |
| 3 or 4 Children | 0 (0.0%) | 11 (68.8%) |
| 5 or more Children | 0 (0.0%) | 0 (0.0%) |
| Total | 7 (2.0%) | 74 (37.2%) |
Race in Bad Axe
The most populous races in Bad Axe are White / Caucasian (2,599 | 85.9%), Hispanic or Latino (331 | 10.9%), and Two or more Races (231 | 7.6%).
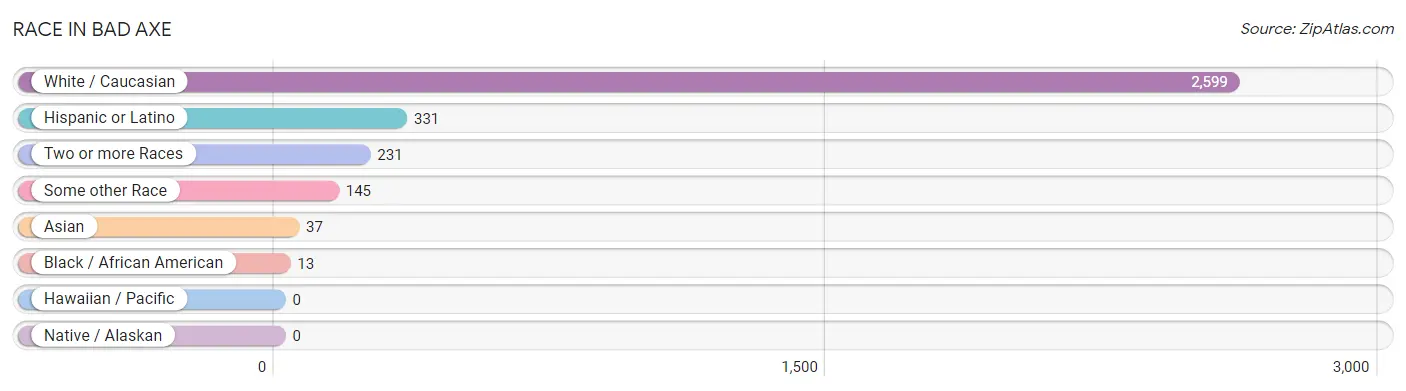
| Race | # Population | % Population |
| Asian | 37 | 1.2% |
| Black / African American | 13 | 0.4% |
| Hawaiian / Pacific | 0 | 0.0% |
| Hispanic or Latino | 331 | 10.9% |
| Native / Alaskan | 0 | 0.0% |
| White / Caucasian | 2,599 | 85.9% |
| Two or more Races | 231 | 7.6% |
| Some other Race | 145 | 4.8% |
| Total | 3,025 | 100.0% |
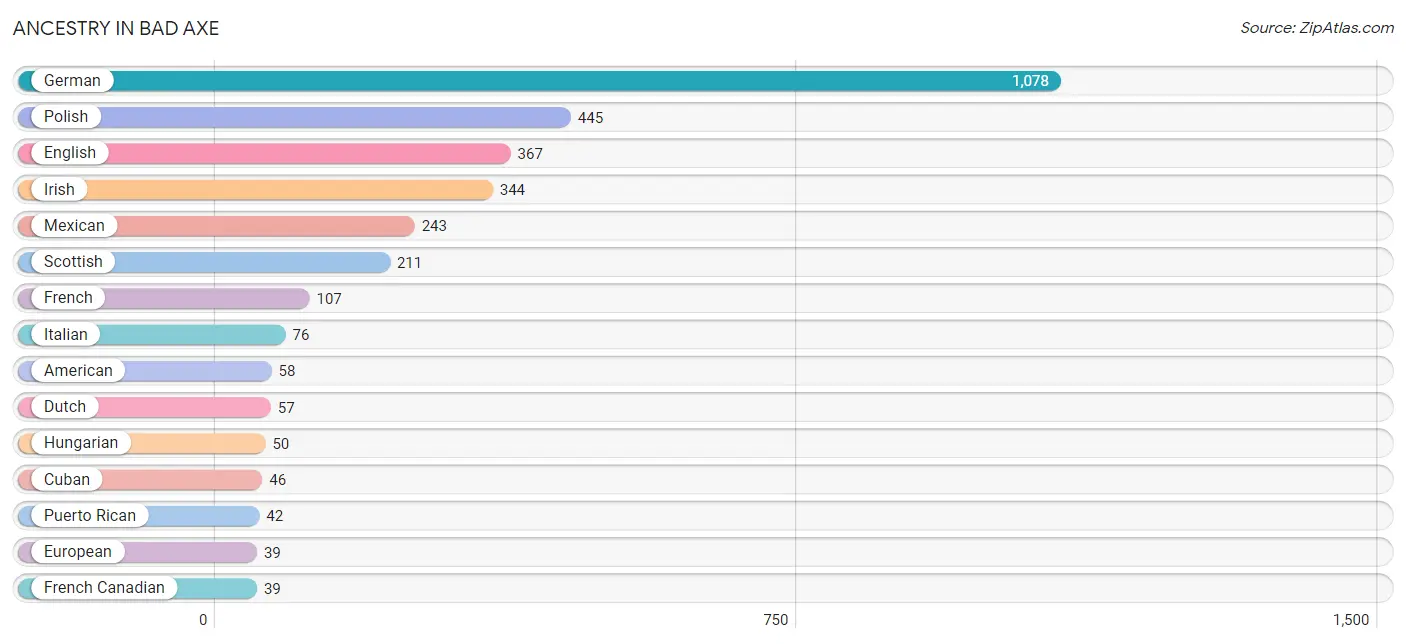
Ancestry in Bad Axe
The most populous ancestries reported in Bad Axe are German (1,078 | 35.6%), Polish (445 | 14.7%), English (367 | 12.1%), Irish (344 | 11.4%), and Mexican (243 | 8.0%), together accounting for 81.9% of all Bad Axe residents.
| Ancestry | # Population | % Population |
| American | 58 | 1.9% |
| Arab | 10 | 0.3% |
| Belgian | 16 | 0.5% |
| British | 15 | 0.5% |
| Cuban | 46 | 1.5% |
| Czech | 5 | 0.2% |
| Dutch | 57 | 1.9% |
| Eastern European | 5 | 0.2% |
| English | 367 | 12.1% |
| European | 39 | 1.3% |
| Finnish | 7 | 0.2% |
| French | 107 | 3.5% |
| French Canadian | 39 | 1.3% |
| German | 1,078 | 35.6% |
| Hungarian | 50 | 1.7% |
| Irish | 344 | 11.4% |
| Italian | 76 | 2.5% |
| Korean | 1 | 0.0% |
| Lebanese | 10 | 0.3% |
| Lithuanian | 17 | 0.6% |
| Mexican | 243 | 8.0% |
| Polish | 445 | 14.7% |
| Puerto Rican | 42 | 1.4% |
| Scotch-Irish | 12 | 0.4% |
| Scottish | 211 | 7.0% |
| Slavic | 11 | 0.4% |
| Sri Lankan | 36 | 1.2% |
| Swedish | 7 | 0.2% |
| Welsh | 8 | 0.3% | View All 29 Rows |
Immigrants in Bad Axe
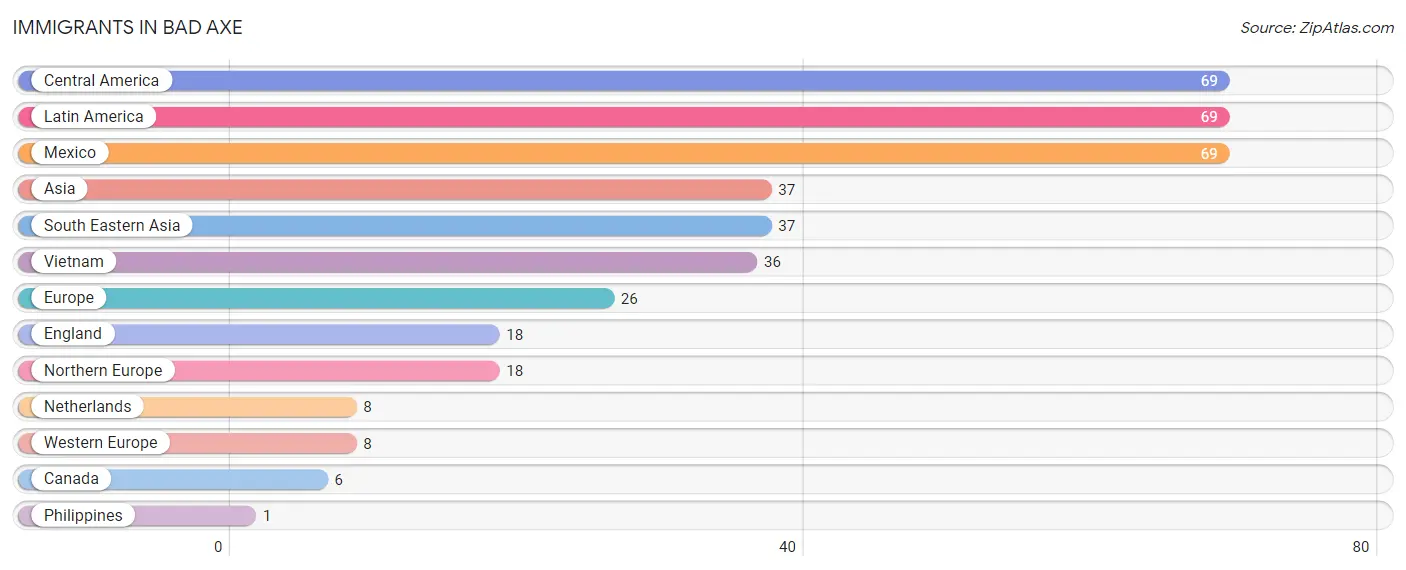
The most numerous immigrant groups reported in Bad Axe came from Central America (69 | 2.3%), Latin America (69 | 2.3%), Mexico (69 | 2.3%), Asia (37 | 1.2%), and South Eastern Asia (37 | 1.2%), together accounting for 9.3% of all Bad Axe residents.
| Immigration Origin | # Population | % Population |
| Asia | 37 | 1.2% |
| Canada | 6 | 0.2% |
| Central America | 69 | 2.3% |
| England | 18 | 0.6% |
| Europe | 26 | 0.9% |
| Latin America | 69 | 2.3% |
| Mexico | 69 | 2.3% |
| Netherlands | 8 | 0.3% |
| Northern Europe | 18 | 0.6% |
| Philippines | 1 | 0.0% |
| South Eastern Asia | 37 | 1.2% |
| Vietnam | 36 | 1.2% |
| Western Europe | 8 | 0.3% | View All 13 Rows |
Sex and Age in Bad Axe
Sex and Age in Bad Axe
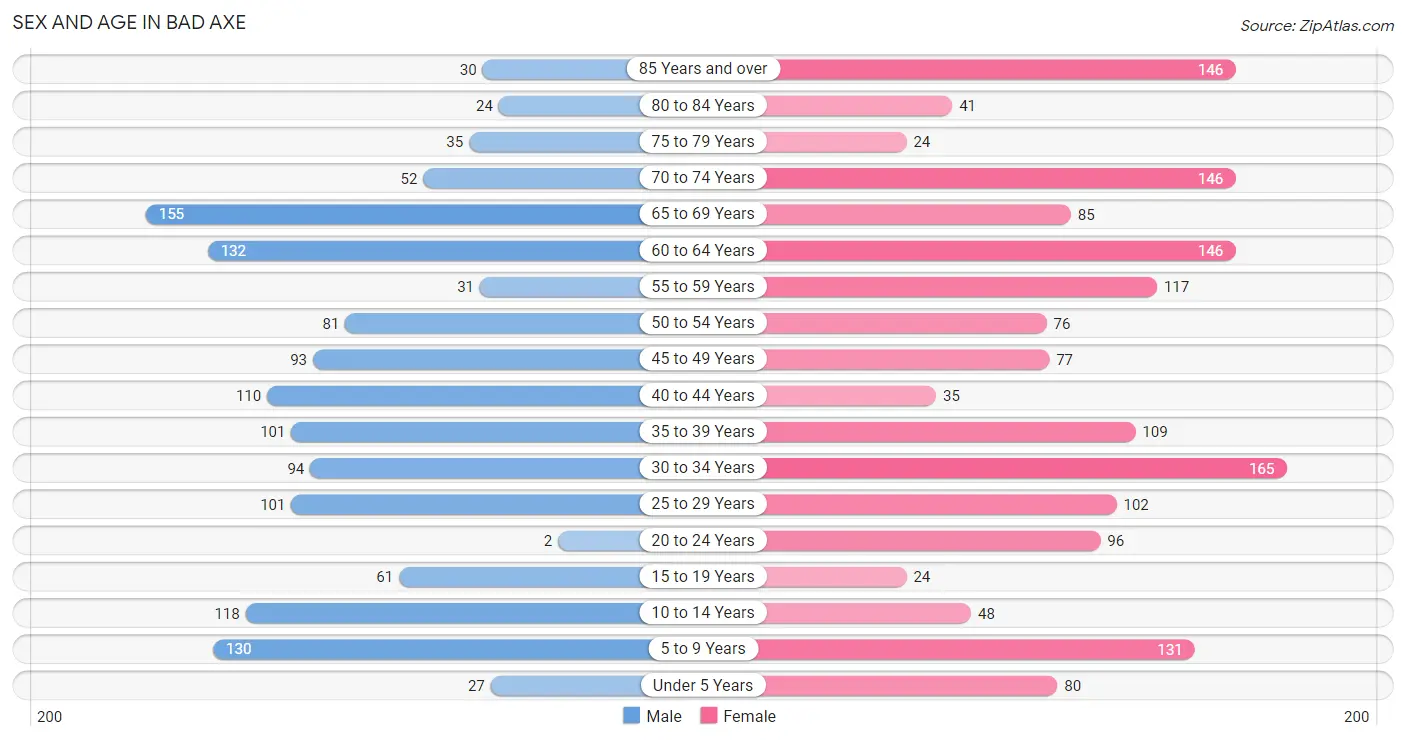
The most populous age groups in Bad Axe are 65 to 69 Years (155 | 11.3%) for men and 30 to 34 Years (165 | 10.0%) for women.
| Age Bracket | Male | Female |
| Under 5 Years | 27 (2.0%) | 80 (4.9%) |
| 5 to 9 Years | 130 (9.4%) | 131 (8.0%) |
| 10 to 14 Years | 118 (8.6%) | 48 (2.9%) |
| 15 to 19 Years | 61 (4.4%) | 24 (1.5%) |
| 20 to 24 Years | 2 (0.2%) | 96 (5.8%) |
| 25 to 29 Years | 101 (7.3%) | 102 (6.2%) |
| 30 to 34 Years | 94 (6.8%) | 165 (10.0%) |
| 35 to 39 Years | 101 (7.3%) | 109 (6.6%) |
| 40 to 44 Years | 110 (8.0%) | 35 (2.1%) |
| 45 to 49 Years | 93 (6.8%) | 77 (4.7%) |
| 50 to 54 Years | 81 (5.9%) | 76 (4.6%) |
| 55 to 59 Years | 31 (2.2%) | 117 (7.1%) |
| 60 to 64 Years | 132 (9.6%) | 146 (8.9%) |
| 65 to 69 Years | 155 (11.3%) | 85 (5.2%) |
| 70 to 74 Years | 52 (3.8%) | 146 (8.9%) |
| 75 to 79 Years | 35 (2.5%) | 24 (1.5%) |
| 80 to 84 Years | 24 (1.7%) | 41 (2.5%) |
| 85 Years and over | 30 (2.2%) | 146 (8.9%) |
| Total | 1,377 (100.0%) | 1,648 (100.0%) |
Families and Households in Bad Axe
Median Family Size in Bad Axe
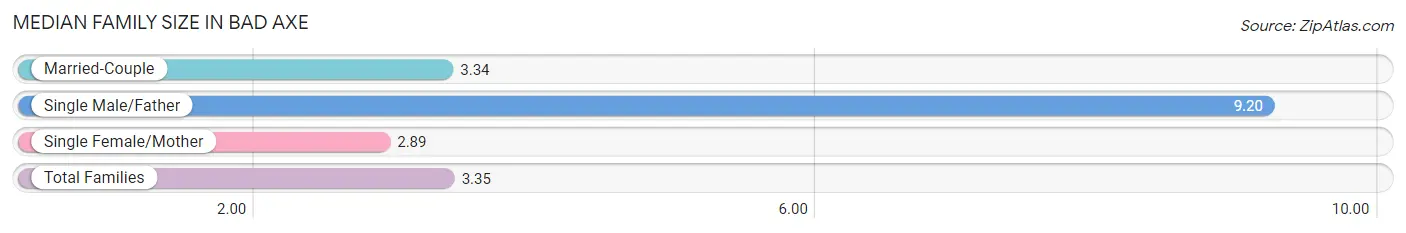
The median family size in Bad Axe is 3.35 persons per family, with single male/father families (15 | 2.8%) accounting for the largest median family size of 9.2 persons per family. On the other hand, single female/mother families (184 | 33.7%) represent the smallest median family size with 2.89 persons per family.
| Family Type | # Families | Family Size |
| Married-Couple | 347 (63.5%) | 3.34 |
| Single Male/Father | 15 (2.8%) | 9.20 |
| Single Female/Mother | 184 (33.7%) | 2.89 |
| Total Families | 546 (100.0%) | 3.35 |
Median Household Size in Bad Axe
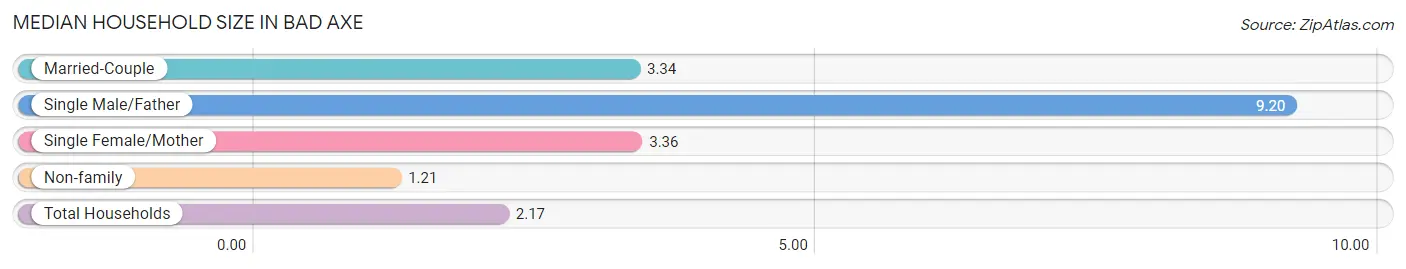
The median household size in Bad Axe is 2.17 persons per household, with single male/father households (15 | 1.2%) accounting for the largest median household size of 9.2 persons per household. non-family households (752 | 57.9%) represent the smallest median household size with 1.21 persons per household.
| Household Type | # Households | Household Size |
| Married-Couple | 347 (26.7%) | 3.34 |
| Single Male/Father | 15 (1.2%) | 9.20 |
| Single Female/Mother | 184 (14.2%) | 3.36 |
| Non-family | 752 (57.9%) | 1.21 |
| Total Households | 1,298 (100.0%) | 2.17 |
Household Size by Marriage Status in Bad Axe
Out of a total of 1,298 households in Bad Axe, 546 (42.1%) are family households, while 752 (57.9%) are nonfamily households. The most numerous type of family households are 2-person households, comprising 277, and the most common type of nonfamily households are 1-person households, comprising 595.
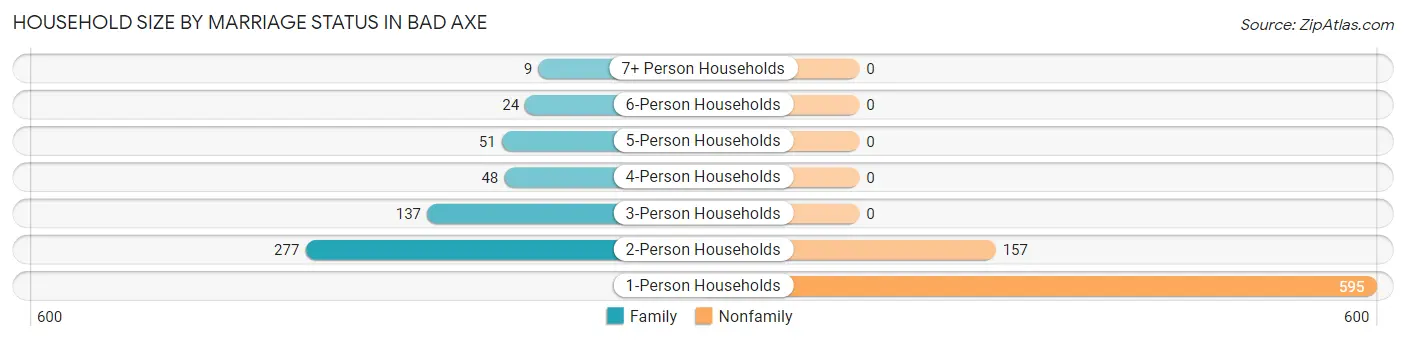
| Household Size | Family Households | Nonfamily Households |
| 1-Person Households | - | 595 (45.8%) |
| 2-Person Households | 277 (21.3%) | 157 (12.1%) |
| 3-Person Households | 137 (10.5%) | 0 (0.0%) |
| 4-Person Households | 48 (3.7%) | 0 (0.0%) |
| 5-Person Households | 51 (3.9%) | 0 (0.0%) |
| 6-Person Households | 24 (1.8%) | 0 (0.0%) |
| 7+ Person Households | 9 (0.7%) | 0 (0.0%) |
| Total | 546 (42.1%) | 752 (57.9%) |
Female Fertility in Bad Axe
Fertility by Age in Bad Axe
Average fertility rate in Bad Axe is 36.0 births per 1,000 women. Women in the age bracket of 20 to 34 years have the highest fertility rate with 63.0 births per 1,000 women. Women in the age bracket of 20 to 34 years acount for 100.0% of all women with births.
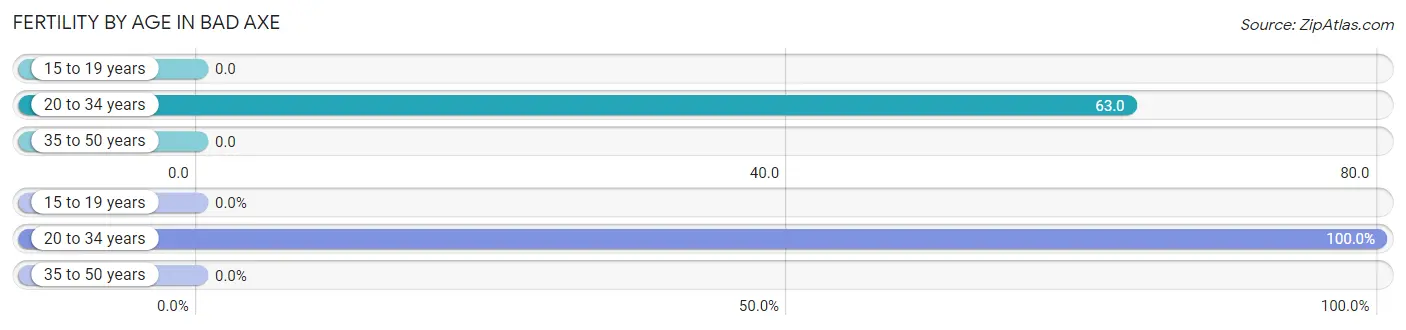
| Age Bracket | Women with Births | Births / 1,000 Women |
| 15 to 19 years | 0 (0.0%) | 0.0 |
| 20 to 34 years | 23 (100.0%) | 63.0 |
| 35 to 50 years | 0 (0.0%) | 0.0 |
| Total | 23 (100.0%) | 36.0 |
Fertility by Age by Marriage Status in Bad Axe
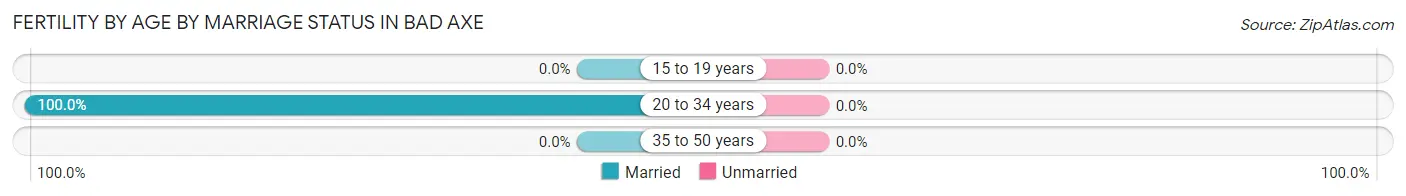
| Age Bracket | Married | Unmarried |
| 15 to 19 years | 0 (0.0%) | 0 (0.0%) |
| 20 to 34 years | 23 (100.0%) | 0 (0.0%) |
| 35 to 50 years | 0 (0.0%) | 0 (0.0%) |
| Total | 23 (100.0%) | 0 (0.0%) |
Fertility by Education in Bad Axe
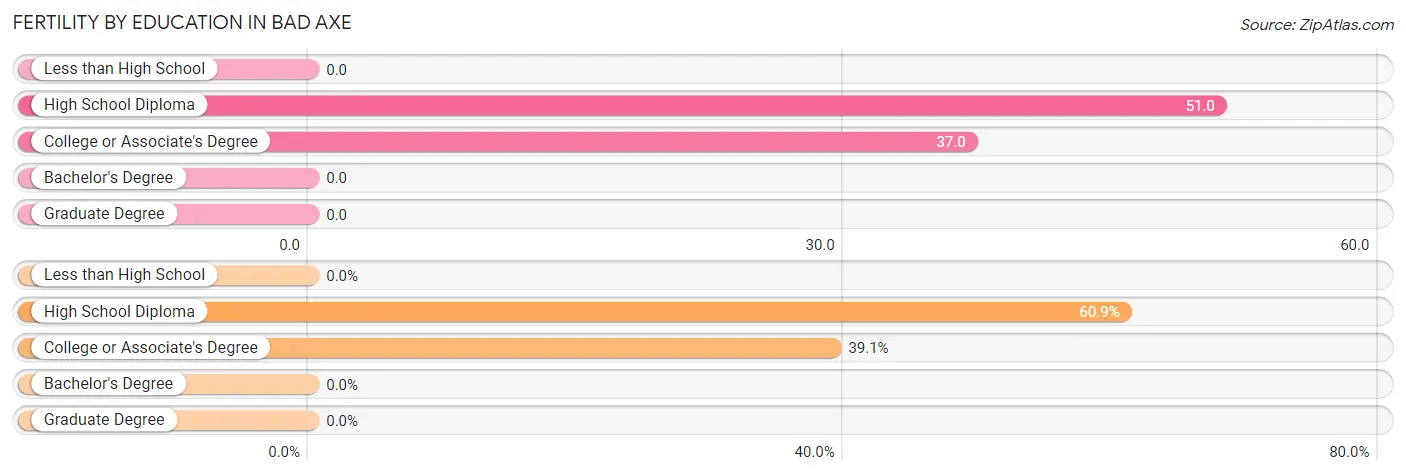
| Educational Attainment | Women with Births | Births / 1,000 Women |
| Less than High School | 0 (0.0%) | 0.0 |
| High School Diploma | 14 (60.9%) | 51.0 |
| College or Associate's Degree | 9 (39.1%) | 37.0 |
| Bachelor's Degree | 0 (0.0%) | 0.0 |
| Graduate Degree | 0 (0.0%) | 0.0 |
| Total | 23 (100.0%) | 36.0 |
Fertility by Education by Marriage Status in Bad Axe
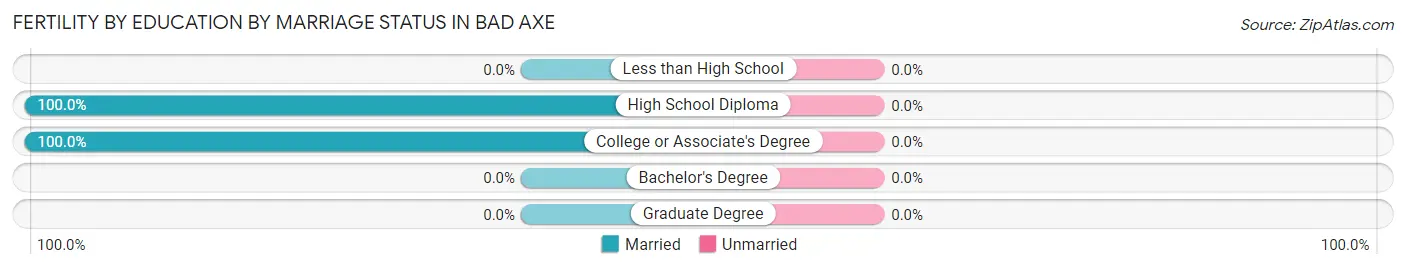
| Educational Attainment | Married | Unmarried |
| Less than High School | 0 (0.0%) | 0 (0.0%) |
| High School Diploma | 14 (100.0%) | 0 (0.0%) |
| College or Associate's Degree | 9 (100.0%) | 0 (0.0%) |
| Bachelor's Degree | 0 (0.0%) | 0 (0.0%) |
| Graduate Degree | 0 (0.0%) | 0 (0.0%) |
| Total | 23 (100.0%) | 0 (0.0%) |
Employment Characteristics in Bad Axe
Employment by Class of Employer in Bad Axe
Among the 1,183 employed individuals in Bad Axe, private company employees (943 | 79.7%), state government employees (55 | 4.6%), and not-for-profit organizations (53 | 4.5%) make up the most common classes of employment.
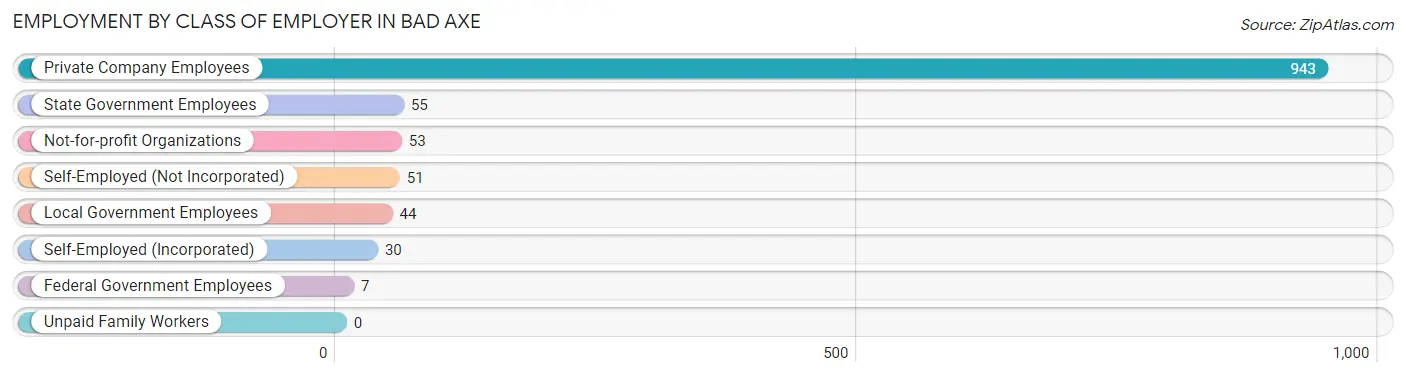
| Employer Class | # Employees | % Employees |
| Private Company Employees | 943 | 79.7% |
| Self-Employed (Incorporated) | 30 | 2.5% |
| Self-Employed (Not Incorporated) | 51 | 4.3% |
| Not-for-profit Organizations | 53 | 4.5% |
| Local Government Employees | 44 | 3.7% |
| State Government Employees | 55 | 4.6% |
| Federal Government Employees | 7 | 0.6% |
| Unpaid Family Workers | 0 | 0.0% |
| Total | 1,183 | 100.0% |
Employment Status by Age in Bad Axe
According to the labor force statistics for Bad Axe, out of the total population over 16 years of age (2,491), 52.0% or 1,295 individuals are in the labor force, with 6.8% or 88 of them unemployed. The age group with the highest labor force participation rate is 30 to 34 years, with 95.0% or 246 individuals in the labor force. Within the labor force, the 45 to 54 years age range has the highest percentage of unemployed individuals, with 20.1% or 46 of them being unemployed.
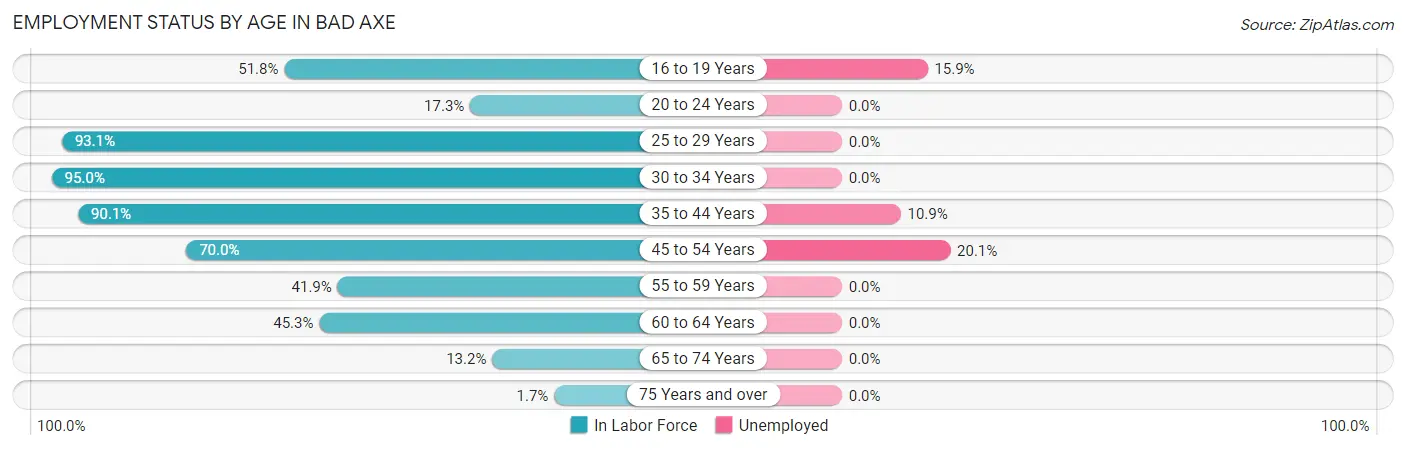
| Age Bracket | In Labor Force | Unemployed |
| 16 to 19 Years | 44 (51.8%) | 7 (15.9%) |
| 20 to 24 Years | 17 (17.3%) | 0 (0.0%) |
| 25 to 29 Years | 189 (93.1%) | 0 (0.0%) |
| 30 to 34 Years | 246 (95.0%) | 0 (0.0%) |
| 35 to 44 Years | 320 (90.1%) | 35 (10.9%) |
| 45 to 54 Years | 229 (70.0%) | 46 (20.1%) |
| 55 to 59 Years | 62 (41.9%) | 0 (0.0%) |
| 60 to 64 Years | 126 (45.3%) | 0 (0.0%) |
| 65 to 74 Years | 58 (13.2%) | 0 (0.0%) |
| 75 Years and over | 5 (1.7%) | 0 (0.0%) |
| Total | 1,295 (52.0%) | 88 (6.8%) |
Employment Status by Educational Attainment in Bad Axe
According to labor force statistics for Bad Axe, 74.6% of individuals (1,171) out of the total population between 25 and 64 years of age (1,570) are in the labor force, with 6.9% or 81 of them being unemployed. The group with the highest labor force participation rate are those with the educational attainment of bachelor's degree or higher, with 84.0% or 147 individuals in the labor force. Within the labor force, individuals with bachelor's degree or higher education have the highest percentage of unemployment, with 12.9% or 19 of them being unemployed.
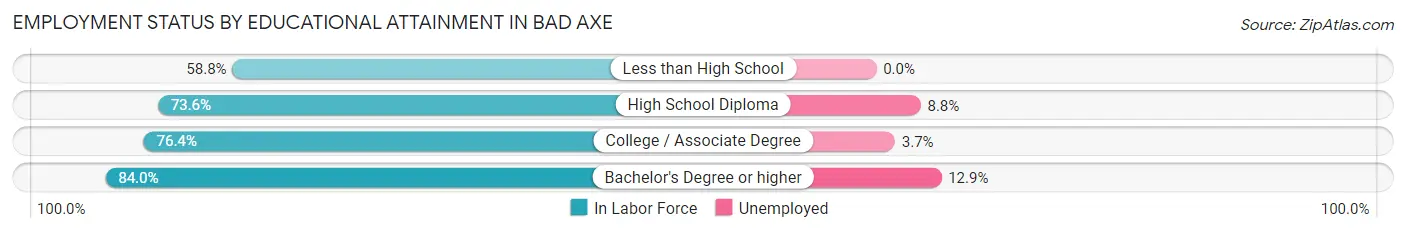
| Educational Attainment | In Labor Force | Unemployed |
| Less than High School | 70 (58.8%) | 0 (0.0%) |
| High School Diploma | 525 (73.6%) | 63 (8.8%) |
| College / Associate Degree | 430 (76.4%) | 21 (3.7%) |
| Bachelor's Degree or higher | 147 (84.0%) | 23 (12.9%) |
| Total | 1,171 (74.6%) | 108 (6.9%) |
Employment Occupations by Sex in Bad Axe
Management, Business, Science and Arts Occupations
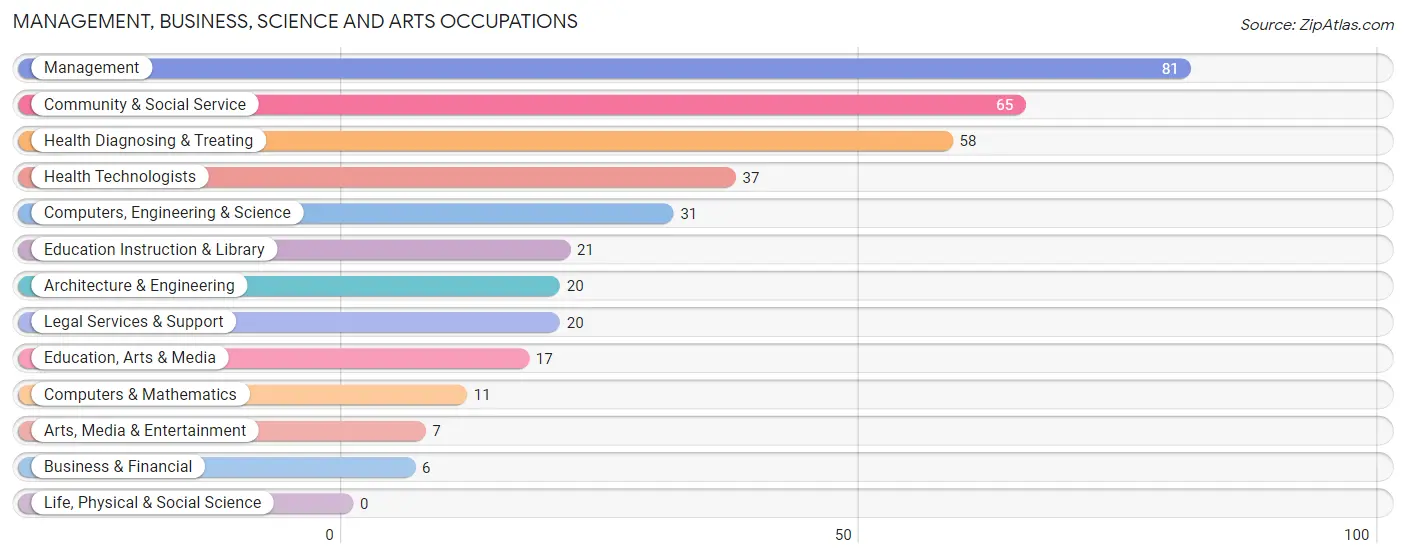
The most common Management, Business, Science and Arts occupations in Bad Axe are Management (81 | 6.7%), Community & Social Service (65 | 5.4%), Health Diagnosing & Treating (58 | 4.8%), Health Technologists (37 | 3.1%), and Computers, Engineering & Science (31 | 2.6%).
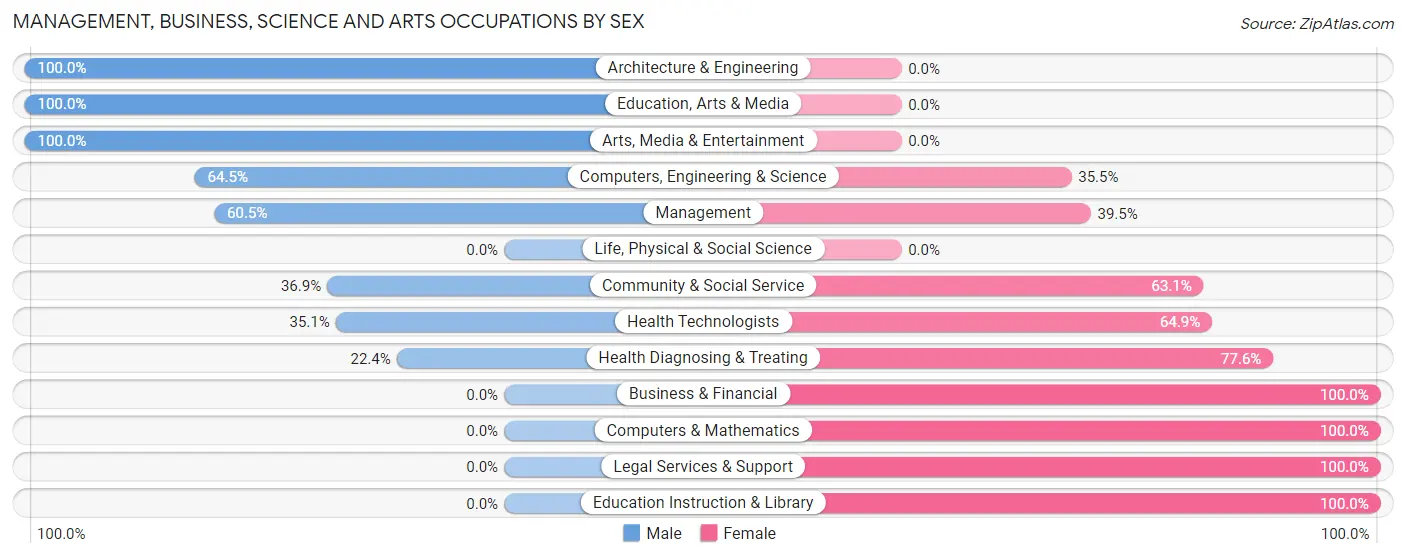
Management, Business, Science and Arts Occupations by Sex
Within the Management, Business, Science and Arts occupations in Bad Axe, the most male-oriented occupations are Architecture & Engineering (100.0%), Education, Arts & Media (100.0%), and Arts, Media & Entertainment (100.0%), while the most female-oriented occupations are Business & Financial (100.0%), Computers & Mathematics (100.0%), and Legal Services & Support (100.0%).
| Occupation | Male | Female |
| Management | 49 (60.5%) | 32 (39.5%) |
| Business & Financial | 0 (0.0%) | 6 (100.0%) |
| Computers, Engineering & Science | 20 (64.5%) | 11 (35.5%) |
| Computers & Mathematics | 0 (0.0%) | 11 (100.0%) |
| Architecture & Engineering | 20 (100.0%) | 0 (0.0%) |
| Life, Physical & Social Science | 0 (0.0%) | 0 (0.0%) |
| Community & Social Service | 24 (36.9%) | 41 (63.1%) |
| Education, Arts & Media | 17 (100.0%) | 0 (0.0%) |
| Legal Services & Support | 0 (0.0%) | 20 (100.0%) |
| Education Instruction & Library | 0 (0.0%) | 21 (100.0%) |
| Arts, Media & Entertainment | 7 (100.0%) | 0 (0.0%) |
| Health Diagnosing & Treating | 13 (22.4%) | 45 (77.6%) |
| Health Technologists | 13 (35.1%) | 24 (64.9%) |
| Total (Category) | 106 (44.0%) | 135 (56.0%) |
| Total (Overall) | 634 (52.5%) | 574 (47.5%) |
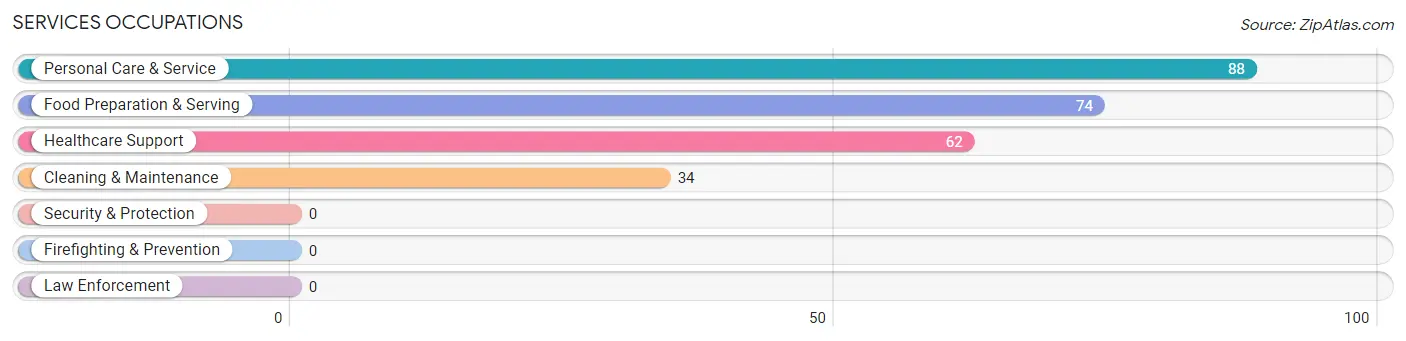
Services Occupations
The most common Services occupations in Bad Axe are Personal Care & Service (88 | 7.3%), Food Preparation & Serving (74 | 6.1%), Healthcare Support (62 | 5.1%), and Cleaning & Maintenance (34 | 2.8%).
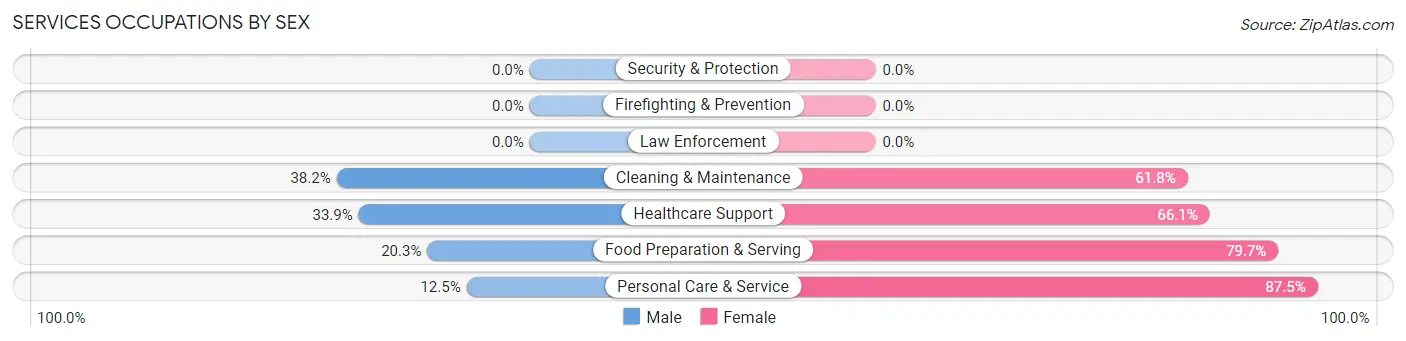
Services Occupations by Sex
Within the Services occupations in Bad Axe, the most male-oriented occupations are Cleaning & Maintenance (38.2%), Healthcare Support (33.9%), and Food Preparation & Serving (20.3%), while the most female-oriented occupations are Personal Care & Service (87.5%), Food Preparation & Serving (79.7%), and Healthcare Support (66.1%).
| Occupation | Male | Female |
| Healthcare Support | 21 (33.9%) | 41 (66.1%) |
| Security & Protection | 0 (0.0%) | 0 (0.0%) |
| Firefighting & Prevention | 0 (0.0%) | 0 (0.0%) |
| Law Enforcement | 0 (0.0%) | 0 (0.0%) |
| Food Preparation & Serving | 15 (20.3%) | 59 (79.7%) |
| Cleaning & Maintenance | 13 (38.2%) | 21 (61.8%) |
| Personal Care & Service | 11 (12.5%) | 77 (87.5%) |
| Total (Category) | 60 (23.3%) | 198 (76.7%) |
| Total (Overall) | 634 (52.5%) | 574 (47.5%) |
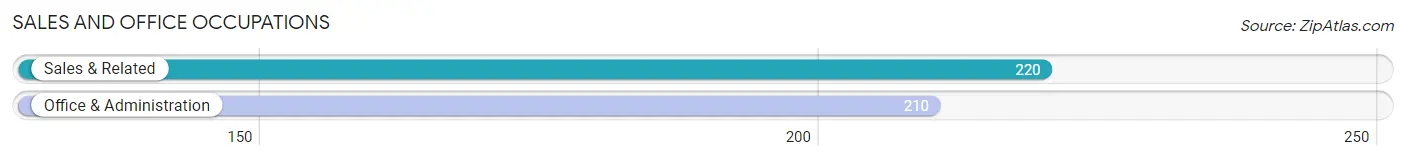
Sales and Office Occupations
The most common Sales and Office occupations in Bad Axe are Sales & Related (220 | 18.2%), and Office & Administration (210 | 17.4%).
Sales and Office Occupations by Sex
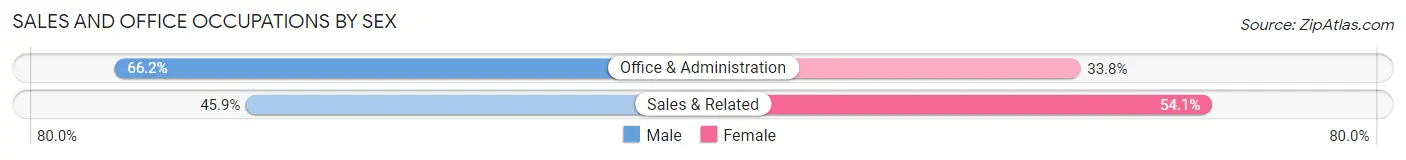
| Occupation | Male | Female |
| Sales & Related | 101 (45.9%) | 119 (54.1%) |
| Office & Administration | 139 (66.2%) | 71 (33.8%) |
| Total (Category) | 240 (55.8%) | 190 (44.2%) |
| Total (Overall) | 634 (52.5%) | 574 (47.5%) |
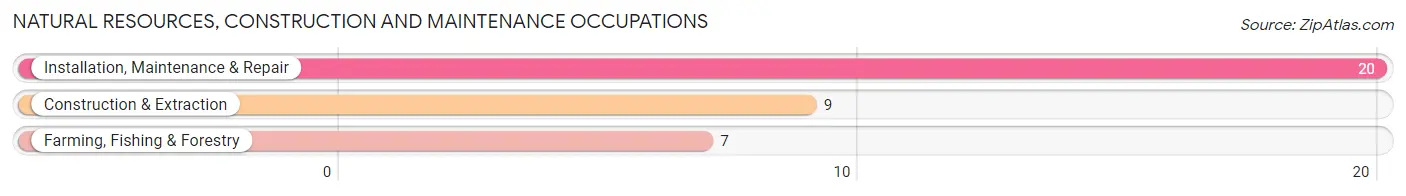
Natural Resources, Construction and Maintenance Occupations
The most common Natural Resources, Construction and Maintenance occupations in Bad Axe are Installation, Maintenance & Repair (20 | 1.7%), Construction & Extraction (9 | 0.7%), and Farming, Fishing & Forestry (7 | 0.6%).
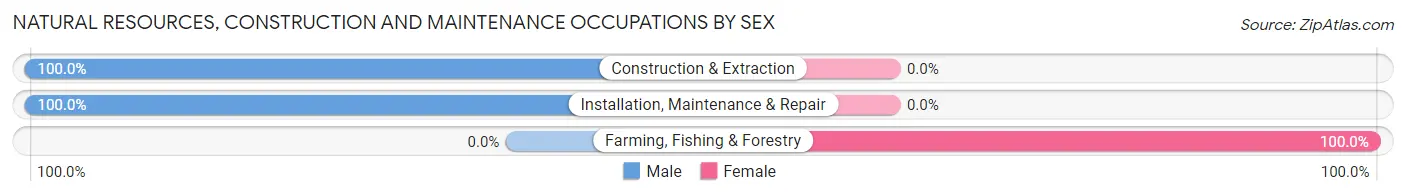
Natural Resources, Construction and Maintenance Occupations by Sex
| Occupation | Male | Female |
| Farming, Fishing & Forestry | 0 (0.0%) | 7 (100.0%) |
| Construction & Extraction | 9 (100.0%) | 0 (0.0%) |
| Installation, Maintenance & Repair | 20 (100.0%) | 0 (0.0%) |
| Total (Category) | 29 (80.6%) | 7 (19.4%) |
| Total (Overall) | 634 (52.5%) | 574 (47.5%) |
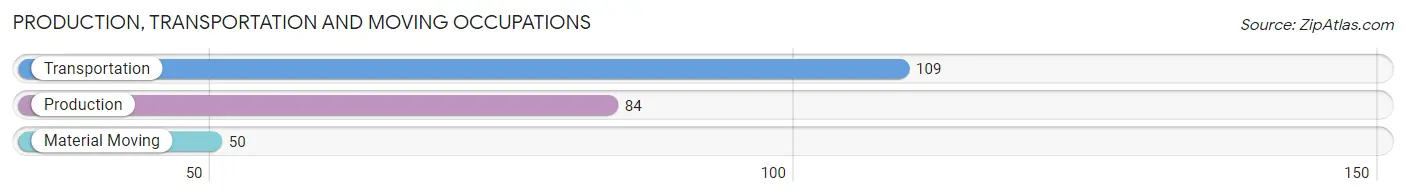
Production, Transportation and Moving Occupations
The most common Production, Transportation and Moving occupations in Bad Axe are Transportation (109 | 9.0%), Production (84 | 7.0%), and Material Moving (50 | 4.1%).
Production, Transportation and Moving Occupations by Sex
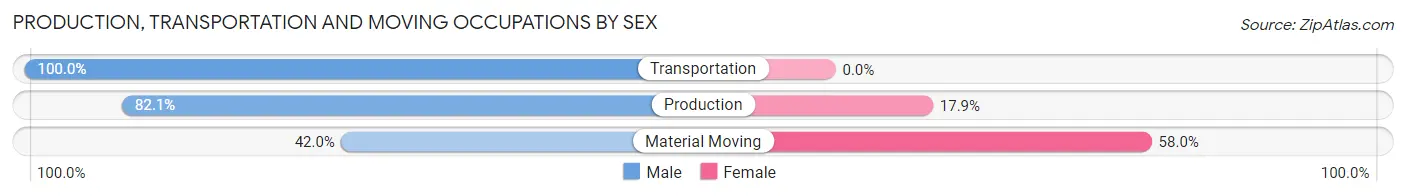
| Occupation | Male | Female |
| Production | 69 (82.1%) | 15 (17.9%) |
| Transportation | 109 (100.0%) | 0 (0.0%) |
| Material Moving | 21 (42.0%) | 29 (58.0%) |
| Total (Category) | 199 (81.9%) | 44 (18.1%) |
| Total (Overall) | 634 (52.5%) | 574 (47.5%) |
Employment Industries by Sex in Bad Axe
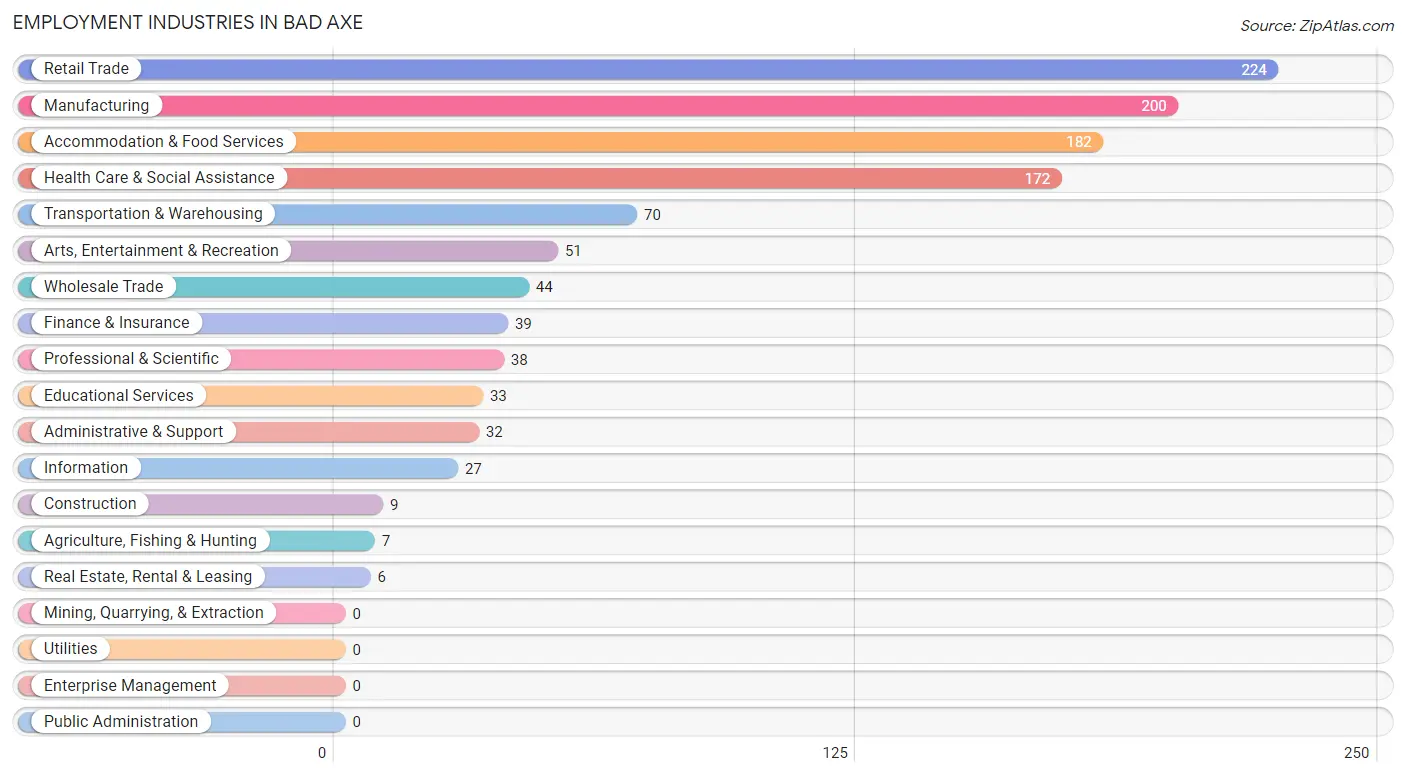
Employment Industries in Bad Axe
The major employment industries in Bad Axe include Retail Trade (224 | 18.5%), Manufacturing (200 | 16.6%), Accommodation & Food Services (182 | 15.1%), Health Care & Social Assistance (172 | 14.2%), and Transportation & Warehousing (70 | 5.8%).
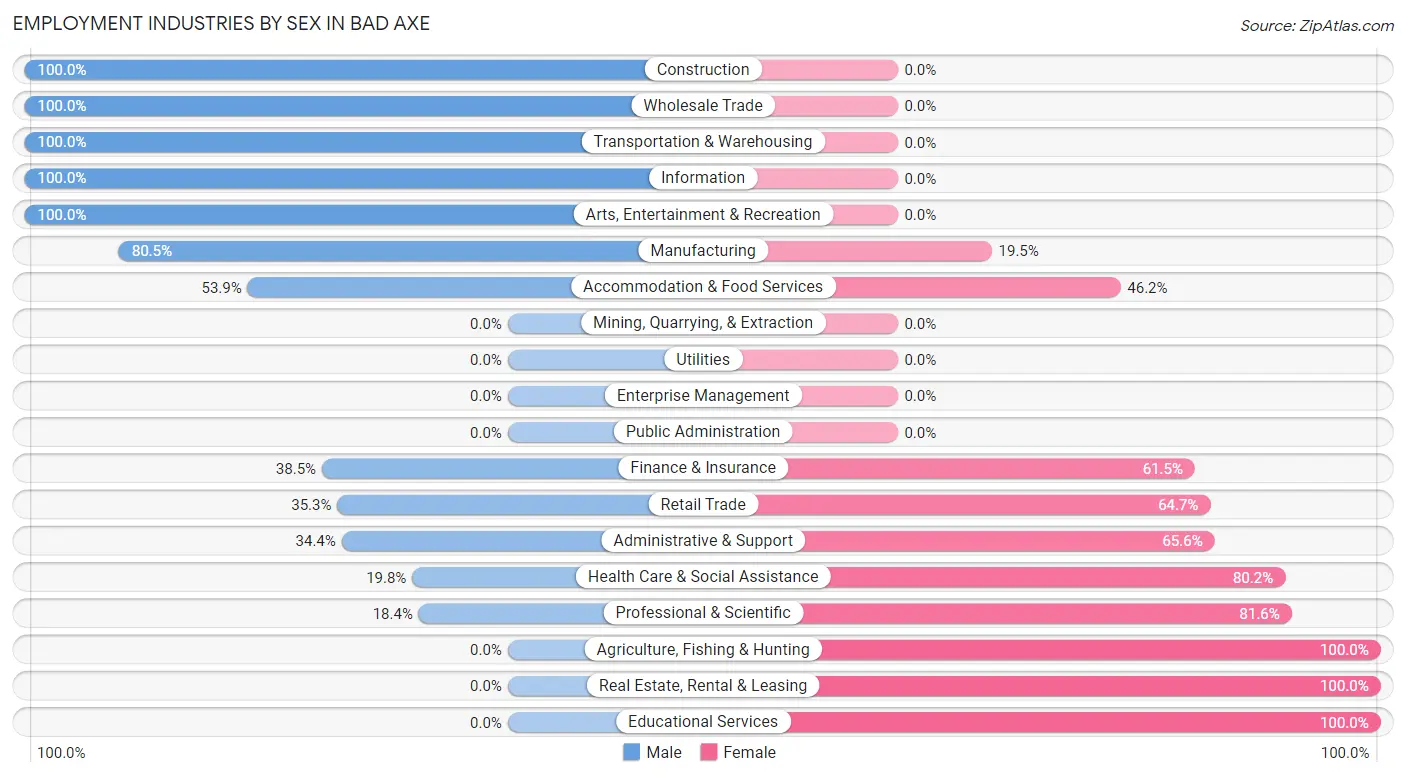
Employment Industries by Sex in Bad Axe
The Bad Axe industries that see more men than women are Construction (100.0%), Wholesale Trade (100.0%), and Transportation & Warehousing (100.0%), whereas the industries that tend to have a higher number of women are Agriculture, Fishing & Hunting (100.0%), Real Estate, Rental & Leasing (100.0%), and Educational Services (100.0%).
| Industry | Male | Female |
| Agriculture, Fishing & Hunting | 0 (0.0%) | 7 (100.0%) |
| Mining, Quarrying, & Extraction | 0 (0.0%) | 0 (0.0%) |
| Construction | 9 (100.0%) | 0 (0.0%) |
| Manufacturing | 161 (80.5%) | 39 (19.5%) |
| Wholesale Trade | 44 (100.0%) | 0 (0.0%) |
| Retail Trade | 79 (35.3%) | 145 (64.7%) |
| Transportation & Warehousing | 70 (100.0%) | 0 (0.0%) |
| Utilities | 0 (0.0%) | 0 (0.0%) |
| Information | 27 (100.0%) | 0 (0.0%) |
| Finance & Insurance | 15 (38.5%) | 24 (61.5%) |
| Real Estate, Rental & Leasing | 0 (0.0%) | 6 (100.0%) |
| Professional & Scientific | 7 (18.4%) | 31 (81.6%) |
| Enterprise Management | 0 (0.0%) | 0 (0.0%) |
| Administrative & Support | 11 (34.4%) | 21 (65.6%) |
| Educational Services | 0 (0.0%) | 33 (100.0%) |
| Health Care & Social Assistance | 34 (19.8%) | 138 (80.2%) |
| Arts, Entertainment & Recreation | 51 (100.0%) | 0 (0.0%) |
| Accommodation & Food Services | 98 (53.8%) | 84 (46.2%) |
| Public Administration | 0 (0.0%) | 0 (0.0%) |
| Total | 634 (52.5%) | 574 (47.5%) |
Education in Bad Axe
School Enrollment in Bad Axe
The most common levels of schooling among the 490 students in Bad Axe are elementary school (269 | 54.9%), middle school (101 | 20.6%), and high school (84 | 17.1%).
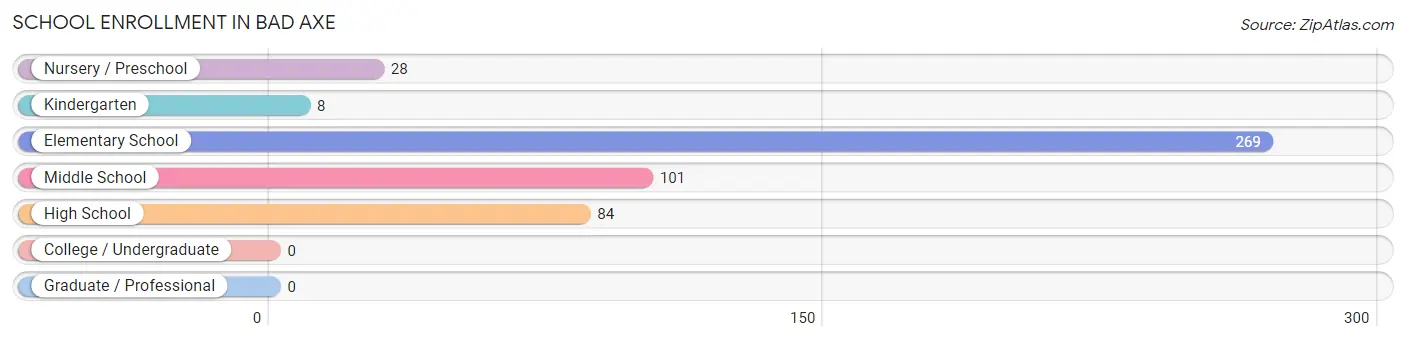
| School Level | # Students | % Students |
| Nursery / Preschool | 28 | 5.7% |
| Kindergarten | 8 | 1.6% |
| Elementary School | 269 | 54.9% |
| Middle School | 101 | 20.6% |
| High School | 84 | 17.1% |
| College / Undergraduate | 0 | 0.0% |
| Graduate / Professional | 0 | 0.0% |
| Total | 490 | 100.0% |
School Enrollment by Age by Funding Source in Bad Axe
Out of a total of 490 students who are enrolled in schools in Bad Axe, 29 (5.9%) attend a private institution, while the remaining 461 (94.1%) are enrolled in public schools. The age group of 3 to 4 year olds has the highest likelihood of being enrolled in private schools, with 9 (32.1% in the age bracket) enrolled. Conversely, the age group of 15 to 17 year olds has the lowest likelihood of being enrolled in a private school, with 34 (100.0% in the age bracket) attending a public institution.
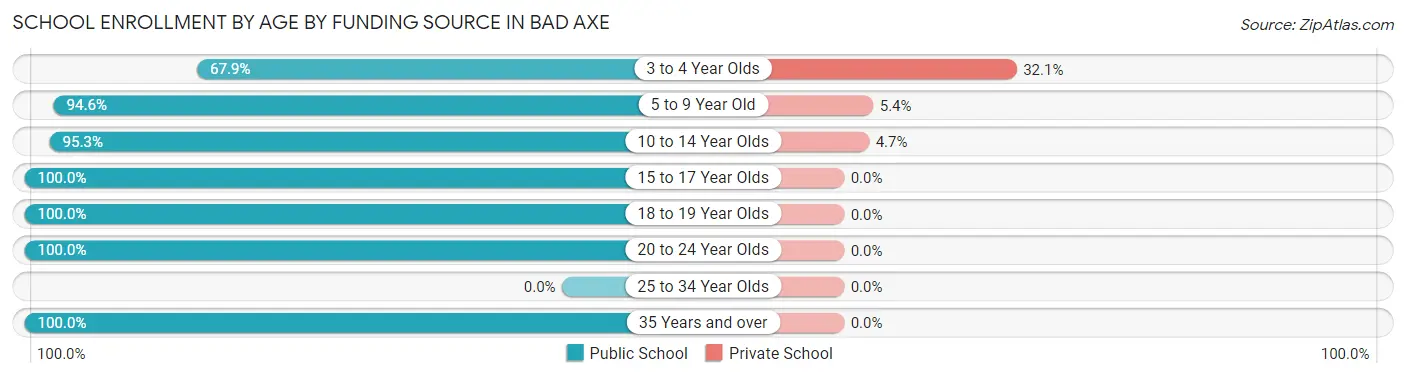
| Age Bracket | Public School | Private School |
| 3 to 4 Year Olds | 19 (67.9%) | 9 (32.1%) |
| 5 to 9 Year Old | 227 (94.6%) | 13 (5.4%) |
| 10 to 14 Year Olds | 143 (95.3%) | 7 (4.7%) |
| 15 to 17 Year Olds | 34 (100.0%) | 0 (0.0%) |
| 18 to 19 Year Olds | 16 (100.0%) | 0 (0.0%) |
| 20 to 24 Year Olds | 17 (100.0%) | 0 (0.0%) |
| 25 to 34 Year Olds | 0 (0.0%) | 0 (0.0%) |
| 35 Years and over | 5 (100.0%) | 0 (0.0%) |
| Total | 461 (94.1%) | 29 (5.9%) |
Educational Attainment by Field of Study in Bad Axe
Education (87 | 20.7%), science & technology (54 | 12.9%), business (46 | 11.0%), bio, nature & agricultural (40 | 9.5%), and liberal arts & history (37 | 8.8%) are the most common fields of study among 420 individuals in Bad Axe who have obtained a bachelor's degree or higher.
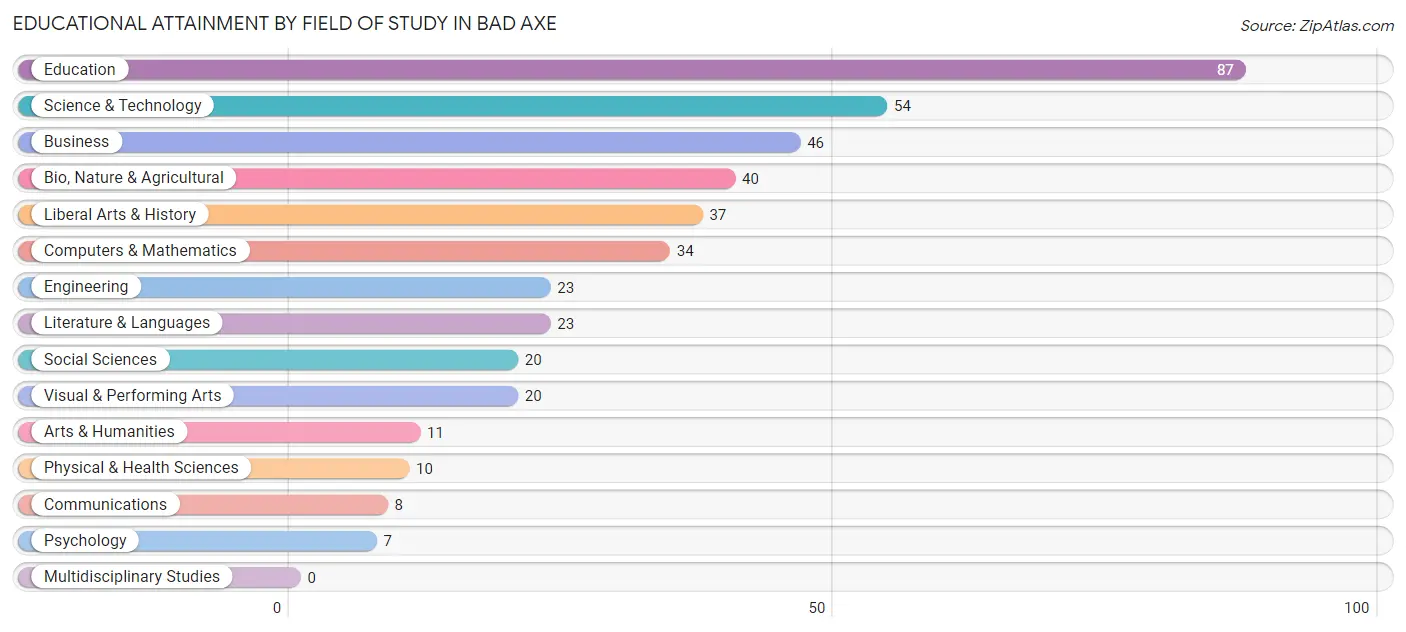
| Field of Study | # Graduates | % Graduates |
| Computers & Mathematics | 34 | 8.1% |
| Bio, Nature & Agricultural | 40 | 9.5% |
| Physical & Health Sciences | 10 | 2.4% |
| Psychology | 7 | 1.7% |
| Social Sciences | 20 | 4.8% |
| Engineering | 23 | 5.5% |
| Multidisciplinary Studies | 0 | 0.0% |
| Science & Technology | 54 | 12.9% |
| Business | 46 | 11.0% |
| Education | 87 | 20.7% |
| Literature & Languages | 23 | 5.5% |
| Liberal Arts & History | 37 | 8.8% |
| Visual & Performing Arts | 20 | 4.8% |
| Communications | 8 | 1.9% |
| Arts & Humanities | 11 | 2.6% |
| Total | 420 | 100.0% |
Transportation & Commute in Bad Axe
Vehicle Availability by Sex in Bad Axe
The most prevalent vehicle ownership categories in Bad Axe are males with 2 vehicles (314, accounting for 49.5%) and females with 2 vehicles (220, making up 57.2%).
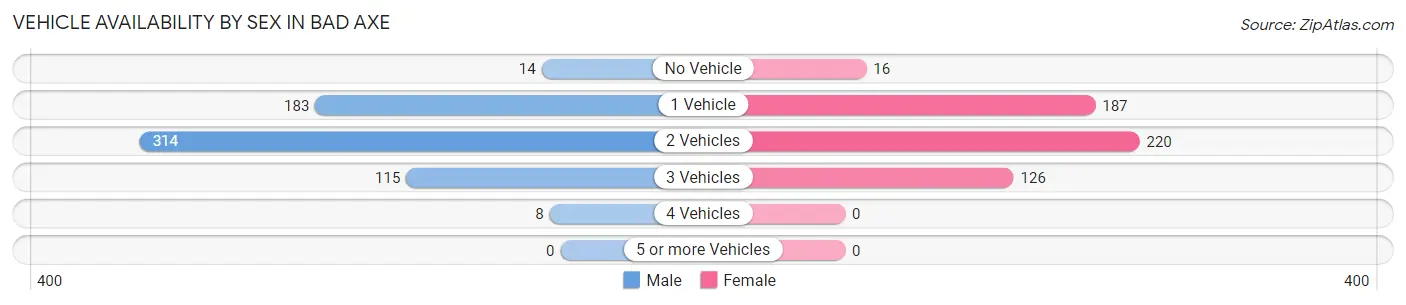
| Vehicles Available | Male | Female |
| No Vehicle | 14 (2.2%) | 16 (2.9%) |
| 1 Vehicle | 183 (28.9%) | 187 (34.1%) |
| 2 Vehicles | 314 (49.5%) | 220 (40.1%) |
| 3 Vehicles | 115 (18.1%) | 126 (23.0%) |
| 4 Vehicles | 8 (1.3%) | 0 (0.0%) |
| 5 or more Vehicles | 0 (0.0%) | 0 (0.0%) |
| Total | 634 (100.0%) | 549 (100.0%) |
Commute Time in Bad Axe
The most frequently occuring commute durations in Bad Axe are less than 5 minutes (270 commuters, 23.8%), 5 to 9 minutes (251 commuters, 22.2%), and 15 to 19 minutes (224 commuters, 19.8%).
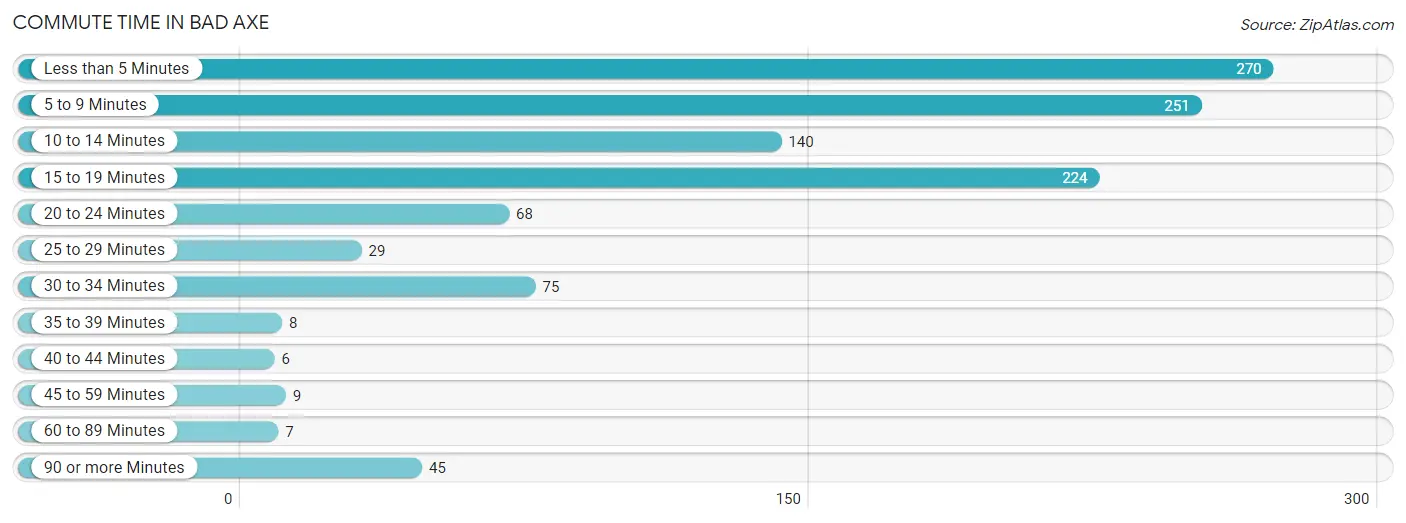
| Commute Time | # Commuters | % Commuters |
| Less than 5 Minutes | 270 | 23.8% |
| 5 to 9 Minutes | 251 | 22.2% |
| 10 to 14 Minutes | 140 | 12.4% |
| 15 to 19 Minutes | 224 | 19.8% |
| 20 to 24 Minutes | 68 | 6.0% |
| 25 to 29 Minutes | 29 | 2.6% |
| 30 to 34 Minutes | 75 | 6.6% |
| 35 to 39 Minutes | 8 | 0.7% |
| 40 to 44 Minutes | 6 | 0.5% |
| 45 to 59 Minutes | 9 | 0.8% |
| 60 to 89 Minutes | 7 | 0.6% |
| 90 or more Minutes | 45 | 4.0% |
Commute Time by Sex in Bad Axe
The most common commute times in Bad Axe are less than 5 minutes (199 commuters, 32.1%) for males and 5 to 9 minutes (141 commuters, 27.5%) for females.
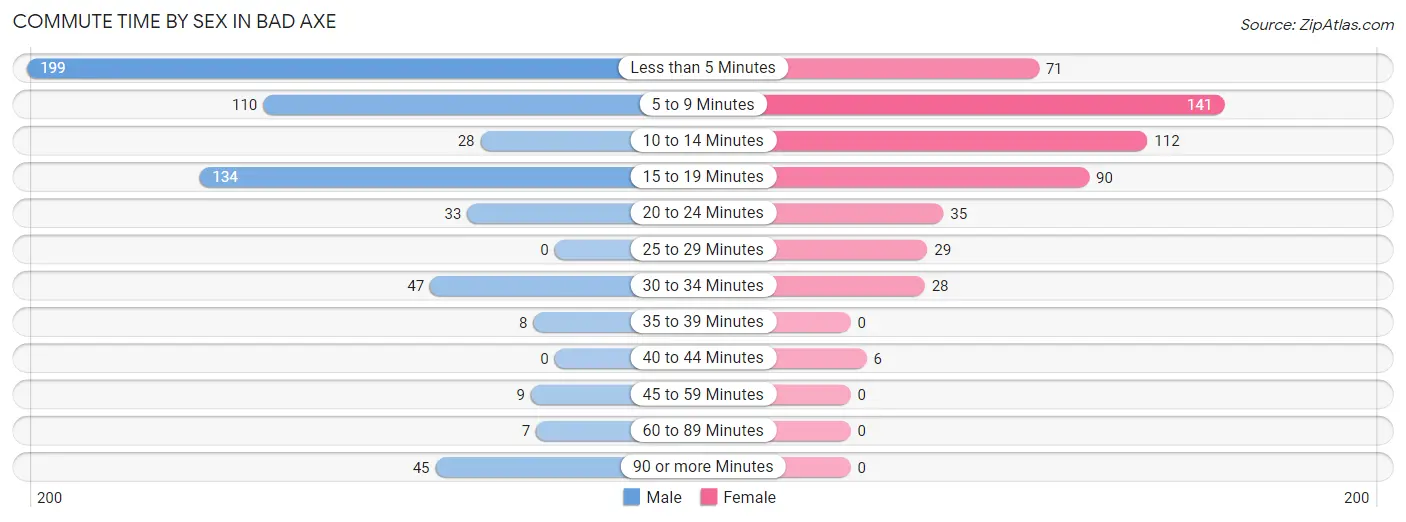
| Commute Time | Male | Female |
| Less than 5 Minutes | 199 (32.1%) | 71 (13.9%) |
| 5 to 9 Minutes | 110 (17.7%) | 141 (27.5%) |
| 10 to 14 Minutes | 28 (4.5%) | 112 (21.9%) |
| 15 to 19 Minutes | 134 (21.6%) | 90 (17.6%) |
| 20 to 24 Minutes | 33 (5.3%) | 35 (6.8%) |
| 25 to 29 Minutes | 0 (0.0%) | 29 (5.7%) |
| 30 to 34 Minutes | 47 (7.6%) | 28 (5.5%) |
| 35 to 39 Minutes | 8 (1.3%) | 0 (0.0%) |
| 40 to 44 Minutes | 0 (0.0%) | 6 (1.2%) |
| 45 to 59 Minutes | 9 (1.5%) | 0 (0.0%) |
| 60 to 89 Minutes | 7 (1.1%) | 0 (0.0%) |
| 90 or more Minutes | 45 (7.3%) | 0 (0.0%) |
Time of Departure to Work by Sex in Bad Axe
The most frequent times of departure to work in Bad Axe are 4:00 PM to 11:59 PM (135, 21.8%) for males and 12:00 PM to 3:59 PM (111, 21.7%) for females.
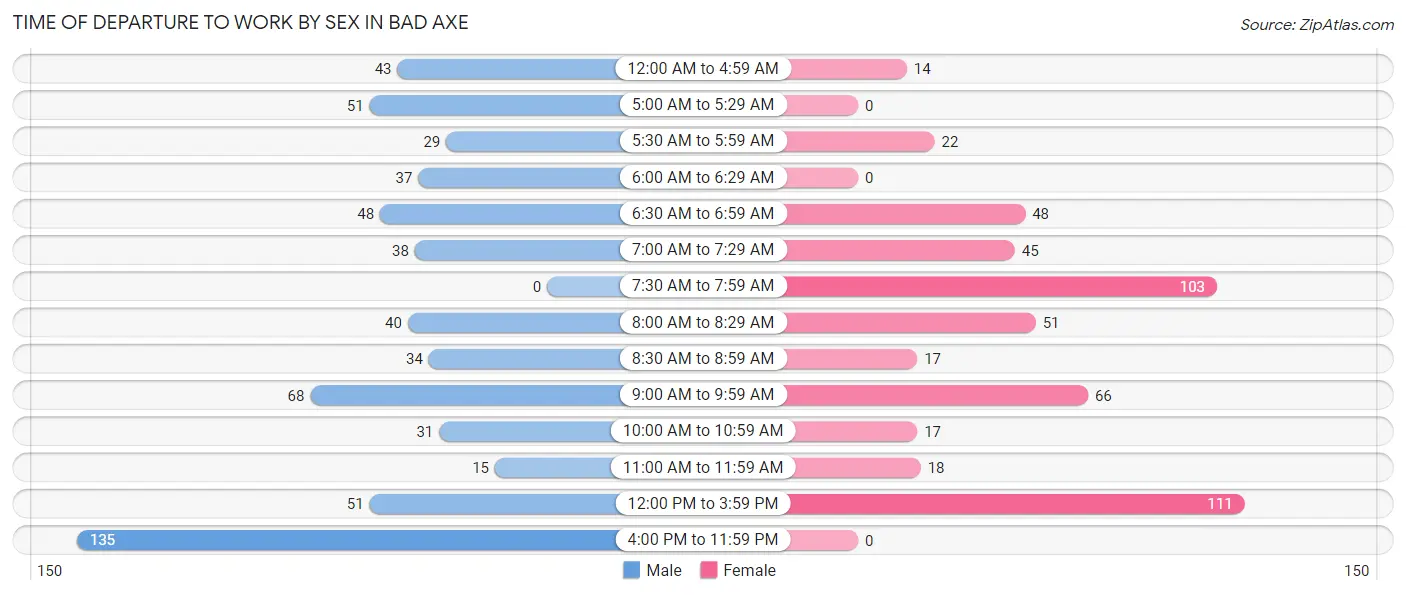
| Time of Departure | Male | Female |
| 12:00 AM to 4:59 AM | 43 (6.9%) | 14 (2.7%) |
| 5:00 AM to 5:29 AM | 51 (8.2%) | 0 (0.0%) |
| 5:30 AM to 5:59 AM | 29 (4.7%) | 22 (4.3%) |
| 6:00 AM to 6:29 AM | 37 (6.0%) | 0 (0.0%) |
| 6:30 AM to 6:59 AM | 48 (7.7%) | 48 (9.4%) |
| 7:00 AM to 7:29 AM | 38 (6.1%) | 45 (8.8%) |
| 7:30 AM to 7:59 AM | 0 (0.0%) | 103 (20.1%) |
| 8:00 AM to 8:29 AM | 40 (6.5%) | 51 (10.0%) |
| 8:30 AM to 8:59 AM | 34 (5.5%) | 17 (3.3%) |
| 9:00 AM to 9:59 AM | 68 (11.0%) | 66 (12.9%) |
| 10:00 AM to 10:59 AM | 31 (5.0%) | 17 (3.3%) |
| 11:00 AM to 11:59 AM | 15 (2.4%) | 18 (3.5%) |
| 12:00 PM to 3:59 PM | 51 (8.2%) | 111 (21.7%) |
| 4:00 PM to 11:59 PM | 135 (21.8%) | 0 (0.0%) |
| Total | 620 (100.0%) | 512 (100.0%) |
Housing Occupancy in Bad Axe
Occupancy by Ownership in Bad Axe
Of the total 1,298 dwellings in Bad Axe, owner-occupied units account for 714 (55.0%), while renter-occupied units make up 584 (45.0%).
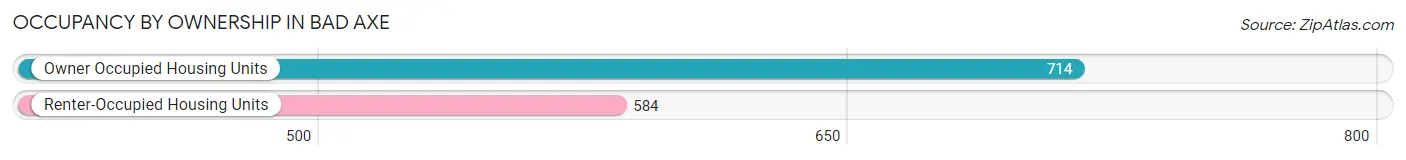
| Occupancy | # Housing Units | % Housing Units |
| Owner Occupied Housing Units | 714 | 55.0% |
| Renter-Occupied Housing Units | 584 | 45.0% |
| Total Occupied Housing Units | 1,298 | 100.0% |
Occupancy by Household Size in Bad Axe
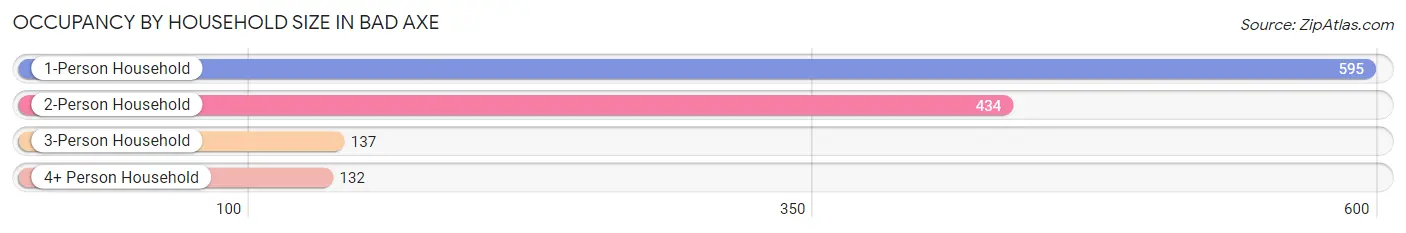
| Household Size | # Housing Units | % Housing Units |
| 1-Person Household | 595 | 45.8% |
| 2-Person Household | 434 | 33.4% |
| 3-Person Household | 137 | 10.5% |
| 4+ Person Household | 132 | 10.2% |
| Total Housing Units | 1,298 | 100.0% |
Occupancy by Ownership by Household Size in Bad Axe
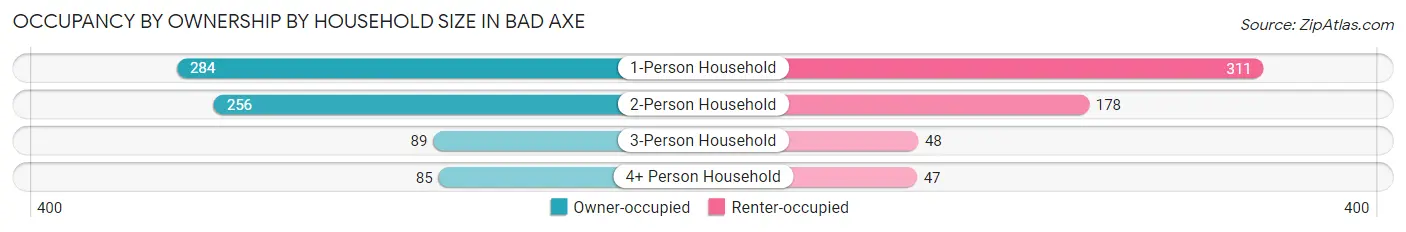
| Household Size | Owner-occupied | Renter-occupied |
| 1-Person Household | 284 (47.7%) | 311 (52.3%) |
| 2-Person Household | 256 (59.0%) | 178 (41.0%) |
| 3-Person Household | 89 (65.0%) | 48 (35.0%) |
| 4+ Person Household | 85 (64.4%) | 47 (35.6%) |
| Total Housing Units | 714 (55.0%) | 584 (45.0%) |
Occupancy by Educational Attainment in Bad Axe
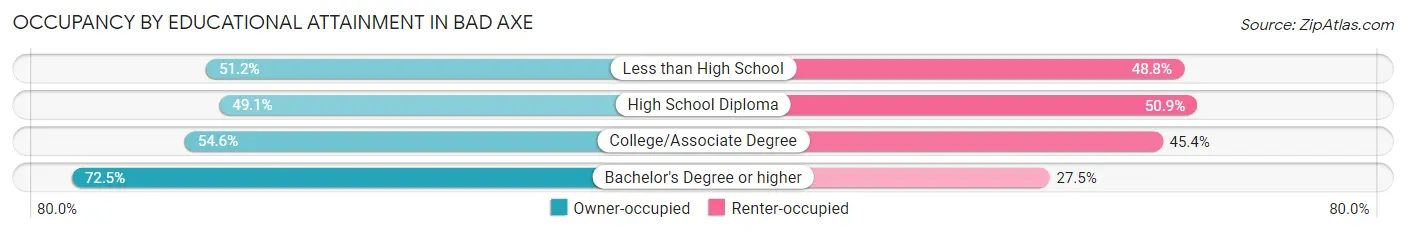
| Household Size | Owner-occupied | Renter-occupied |
| Less than High School | 85 (51.2%) | 81 (48.8%) |
| High School Diploma | 222 (49.1%) | 230 (50.9%) |
| College/Associate Degree | 262 (54.6%) | 218 (45.4%) |
| Bachelor's Degree or higher | 145 (72.5%) | 55 (27.5%) |
Occupancy by Age of Householder in Bad Axe
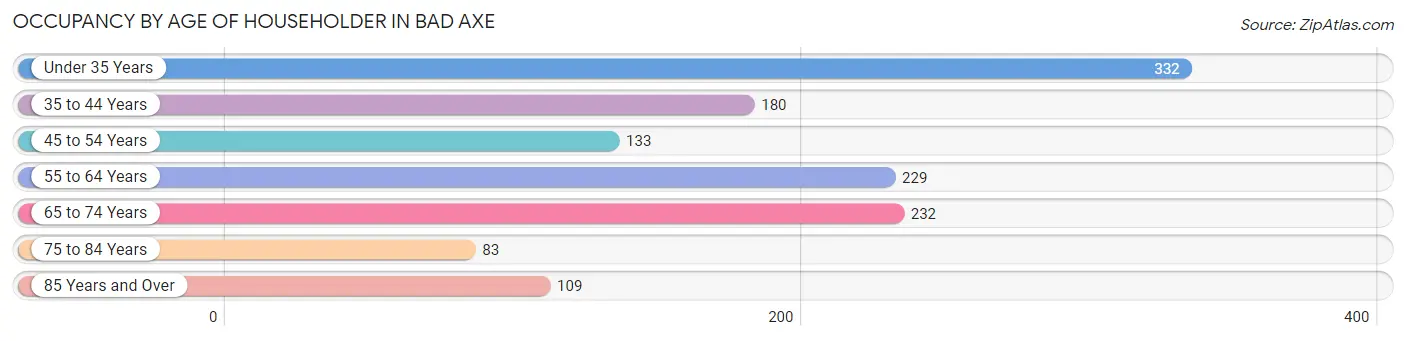
| Age Bracket | # Households | % Households |
| Under 35 Years | 332 | 25.6% |
| 35 to 44 Years | 180 | 13.9% |
| 45 to 54 Years | 133 | 10.2% |
| 55 to 64 Years | 229 | 17.6% |
| 65 to 74 Years | 232 | 17.9% |
| 75 to 84 Years | 83 | 6.4% |
| 85 Years and Over | 109 | 8.4% |
| Total | 1,298 | 100.0% |
Housing Finances in Bad Axe
Median Income by Occupancy in Bad Axe
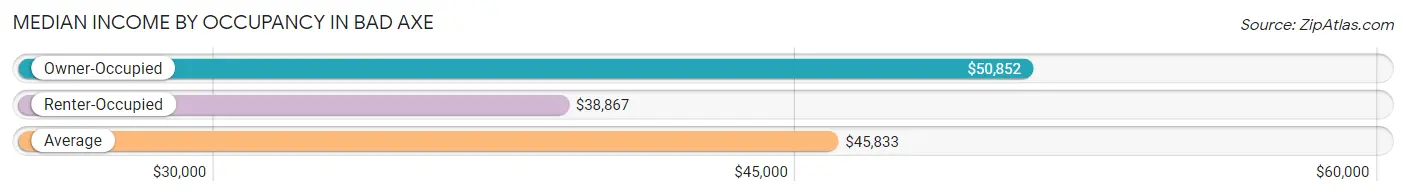
| Occupancy Type | # Households | Median Income |
| Owner-Occupied | 714 (55.0%) | $50,852 |
| Renter-Occupied | 584 (45.0%) | $38,867 |
| Average | 1,298 (100.0%) | $45,833 |
Occupancy by Householder Income Bracket in Bad Axe
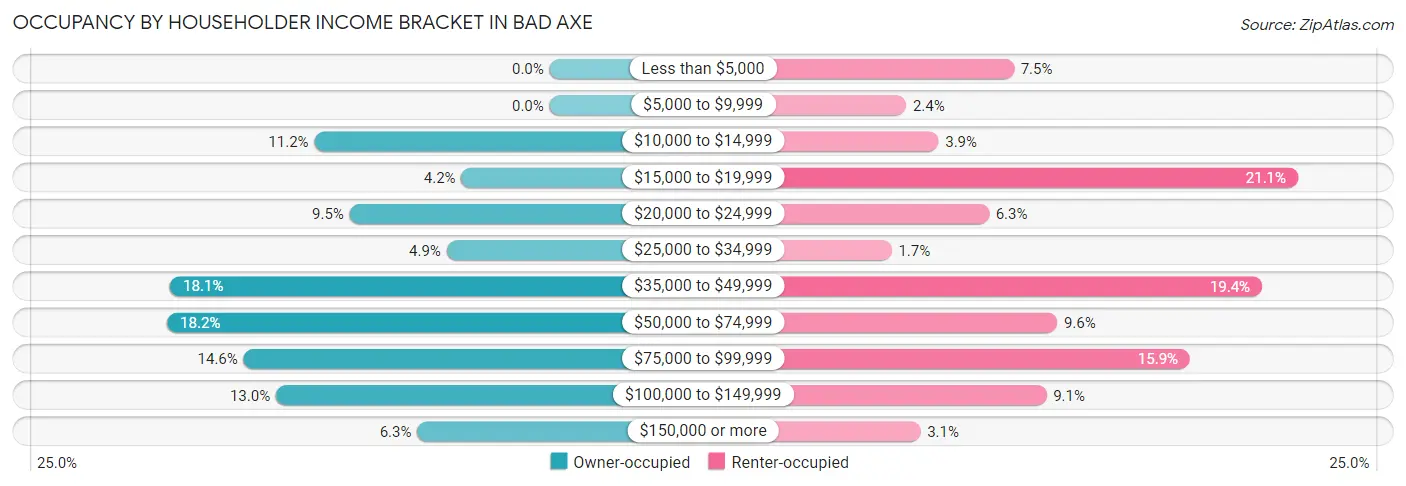
| Income Bracket | Owner-occupied | Renter-occupied |
| Less than $5,000 | 0 (0.0%) | 44 (7.5%) |
| $5,000 to $9,999 | 0 (0.0%) | 14 (2.4%) |
| $10,000 to $14,999 | 80 (11.2%) | 23 (3.9%) |
| $15,000 to $19,999 | 30 (4.2%) | 123 (21.1%) |
| $20,000 to $24,999 | 68 (9.5%) | 37 (6.3%) |
| $25,000 to $34,999 | 35 (4.9%) | 10 (1.7%) |
| $35,000 to $49,999 | 129 (18.1%) | 113 (19.4%) |
| $50,000 to $74,999 | 130 (18.2%) | 56 (9.6%) |
| $75,000 to $99,999 | 104 (14.6%) | 93 (15.9%) |
| $100,000 to $149,999 | 93 (13.0%) | 53 (9.1%) |
| $150,000 or more | 45 (6.3%) | 18 (3.1%) |
| Total | 714 (100.0%) | 584 (100.0%) |
Monthly Housing Cost Tiers in Bad Axe
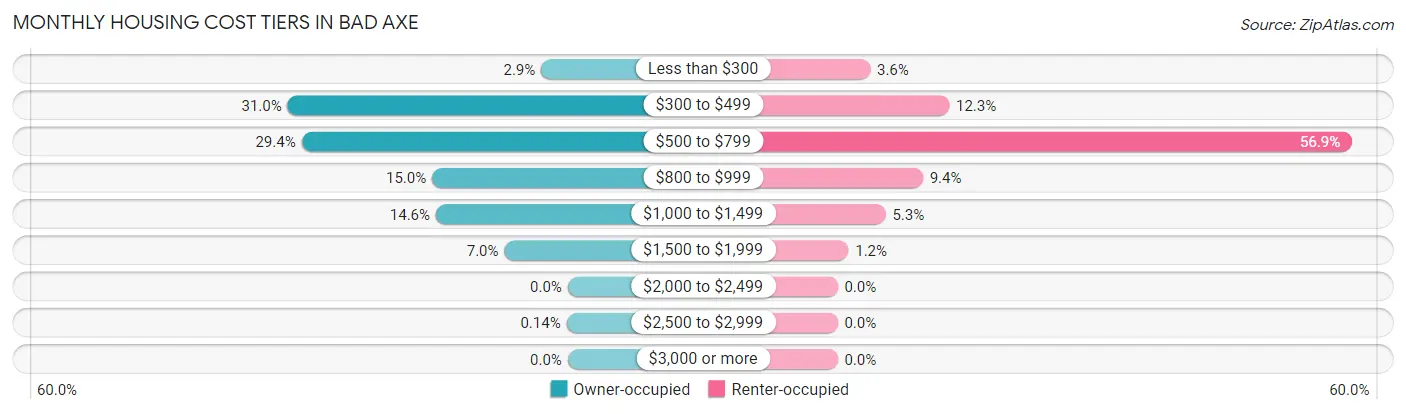
| Monthly Cost | Owner-occupied | Renter-occupied |
| Less than $300 | 21 (2.9%) | 21 (3.6%) |
| $300 to $499 | 221 (30.9%) | 72 (12.3%) |
| $500 to $799 | 210 (29.4%) | 332 (56.9%) |
| $800 to $999 | 107 (15.0%) | 55 (9.4%) |
| $1,000 to $1,499 | 104 (14.6%) | 31 (5.3%) |
| $1,500 to $1,999 | 50 (7.0%) | 7 (1.2%) |
| $2,000 to $2,499 | 0 (0.0%) | 0 (0.0%) |
| $2,500 to $2,999 | 1 (0.1%) | 0 (0.0%) |
| $3,000 or more | 0 (0.0%) | 0 (0.0%) |
| Total | 714 (100.0%) | 584 (100.0%) |
Physical Housing Characteristics in Bad Axe
Housing Structures in Bad Axe
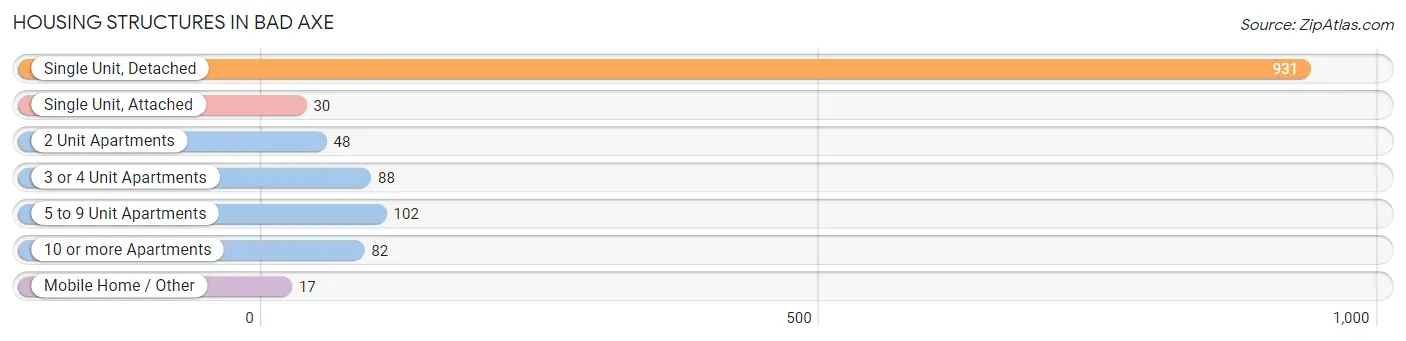
| Structure Type | # Housing Units | % Housing Units |
| Single Unit, Detached | 931 | 71.7% |
| Single Unit, Attached | 30 | 2.3% |
| 2 Unit Apartments | 48 | 3.7% |
| 3 or 4 Unit Apartments | 88 | 6.8% |
| 5 to 9 Unit Apartments | 102 | 7.9% |
| 10 or more Apartments | 82 | 6.3% |
| Mobile Home / Other | 17 | 1.3% |
| Total | 1,298 | 100.0% |
Housing Structures by Occupancy in Bad Axe
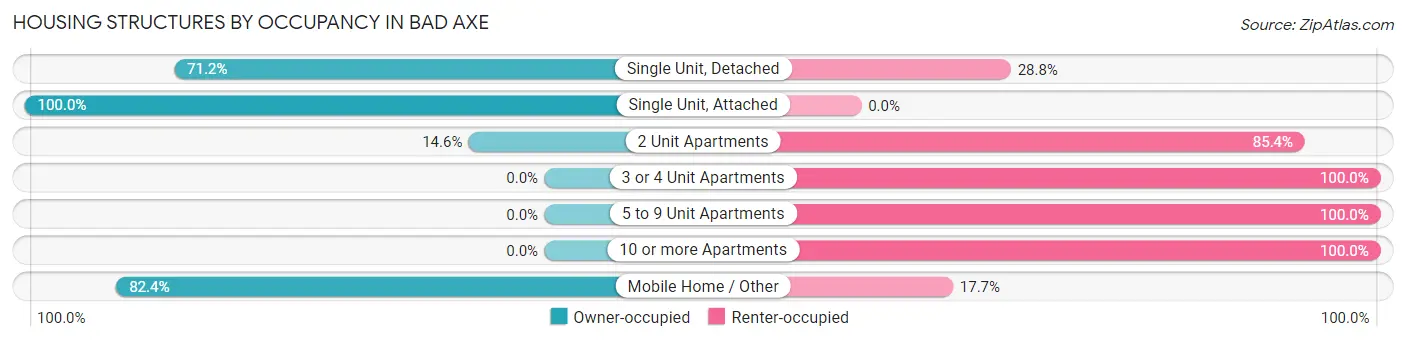
| Structure Type | Owner-occupied | Renter-occupied |
| Single Unit, Detached | 663 (71.2%) | 268 (28.8%) |
| Single Unit, Attached | 30 (100.0%) | 0 (0.0%) |
| 2 Unit Apartments | 7 (14.6%) | 41 (85.4%) |
| 3 or 4 Unit Apartments | 0 (0.0%) | 88 (100.0%) |
| 5 to 9 Unit Apartments | 0 (0.0%) | 102 (100.0%) |
| 10 or more Apartments | 0 (0.0%) | 82 (100.0%) |
| Mobile Home / Other | 14 (82.4%) | 3 (17.6%) |
| Total | 714 (55.0%) | 584 (45.0%) |
Housing Structures by Number of Rooms in Bad Axe
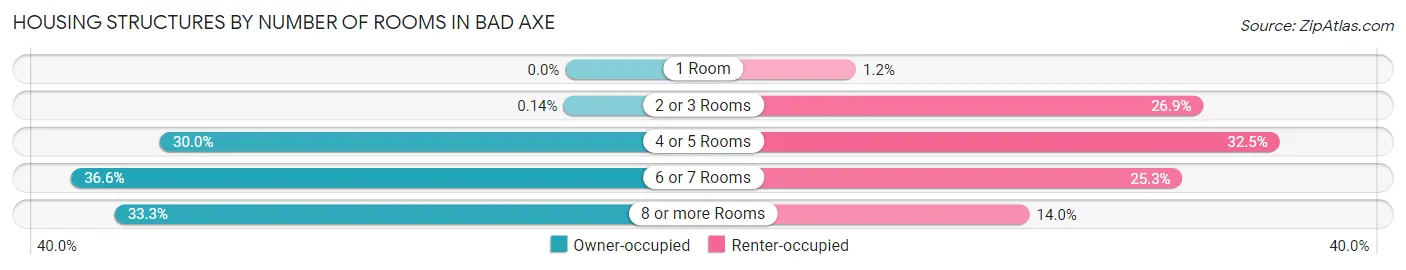
| Number of Rooms | Owner-occupied | Renter-occupied |
| 1 Room | 0 (0.0%) | 7 (1.2%) |
| 2 or 3 Rooms | 1 (0.1%) | 157 (26.9%) |
| 4 or 5 Rooms | 214 (30.0%) | 190 (32.5%) |
| 6 or 7 Rooms | 261 (36.5%) | 148 (25.3%) |
| 8 or more Rooms | 238 (33.3%) | 82 (14.0%) |
| Total | 714 (100.0%) | 584 (100.0%) |
Housing Structure by Heating Type in Bad Axe
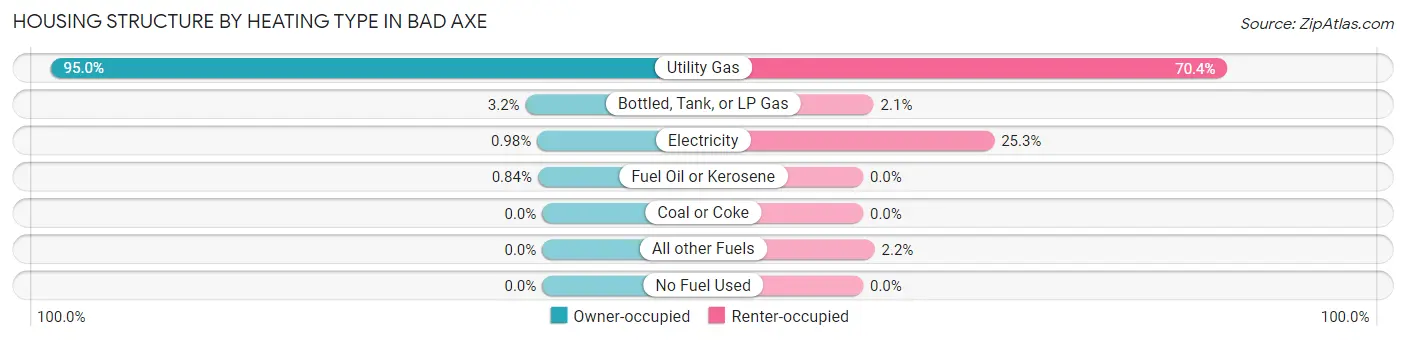
| Heating Type | Owner-occupied | Renter-occupied |
| Utility Gas | 678 (95.0%) | 411 (70.4%) |
| Bottled, Tank, or LP Gas | 23 (3.2%) | 12 (2.1%) |
| Electricity | 7 (1.0%) | 148 (25.3%) |
| Fuel Oil or Kerosene | 6 (0.8%) | 0 (0.0%) |
| Coal or Coke | 0 (0.0%) | 0 (0.0%) |
| All other Fuels | 0 (0.0%) | 13 (2.2%) |
| No Fuel Used | 0 (0.0%) | 0 (0.0%) |
| Total | 714 (100.0%) | 584 (100.0%) |
Household Vehicle Usage in Bad Axe
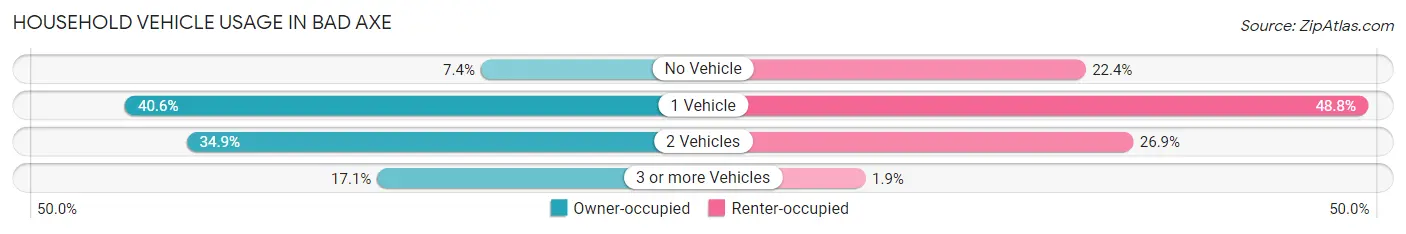
| Vehicles per Household | Owner-occupied | Renter-occupied |
| No Vehicle | 53 (7.4%) | 131 (22.4%) |
| 1 Vehicle | 290 (40.6%) | 285 (48.8%) |
| 2 Vehicles | 249 (34.9%) | 157 (26.9%) |
| 3 or more Vehicles | 122 (17.1%) | 11 (1.9%) |
| Total | 714 (100.0%) | 584 (100.0%) |
Real Estate & Mortgages in Bad Axe
Real Estate and Mortgage Overview in Bad Axe
| Characteristic | Without Mortgage | With Mortgage |
| Housing Units | 397 | 317 |
| Median Property Value | $86,700 | $111,700 |
| Median Household Income | $47,292 | $30 |
| Monthly Housing Costs | $458 | $0 |
| Real Estate Taxes | $1,590 | $29 |
Property Value by Mortgage Status in Bad Axe
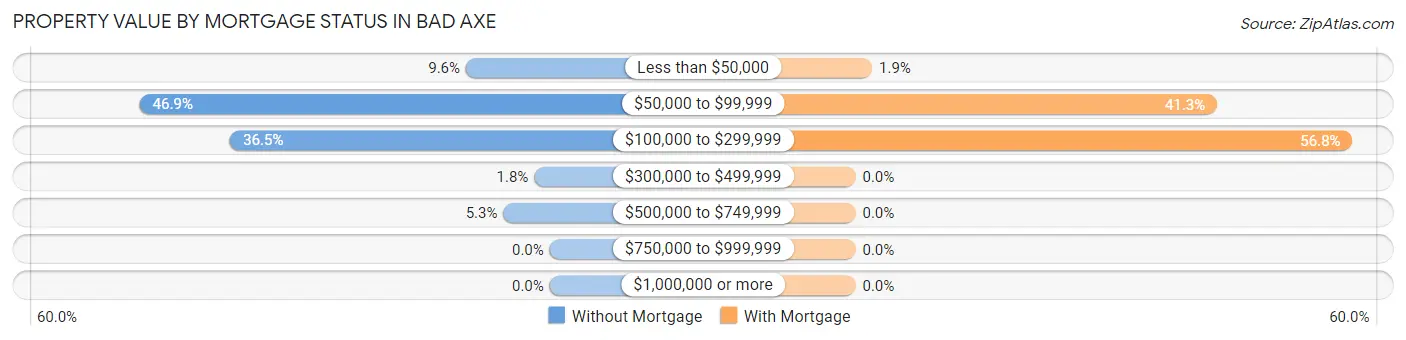
| Property Value | Without Mortgage | With Mortgage |
| Less than $50,000 | 38 (9.6%) | 6 (1.9%) |
| $50,000 to $99,999 | 186 (46.9%) | 131 (41.3%) |
| $100,000 to $299,999 | 145 (36.5%) | 180 (56.8%) |
| $300,000 to $499,999 | 7 (1.8%) | 0 (0.0%) |
| $500,000 to $749,999 | 21 (5.3%) | 0 (0.0%) |
| $750,000 to $999,999 | 0 (0.0%) | 0 (0.0%) |
| $1,000,000 or more | 0 (0.0%) | 0 (0.0%) |
| Total | 397 (100.0%) | 317 (100.0%) |
Household Income by Mortgage Status in Bad Axe
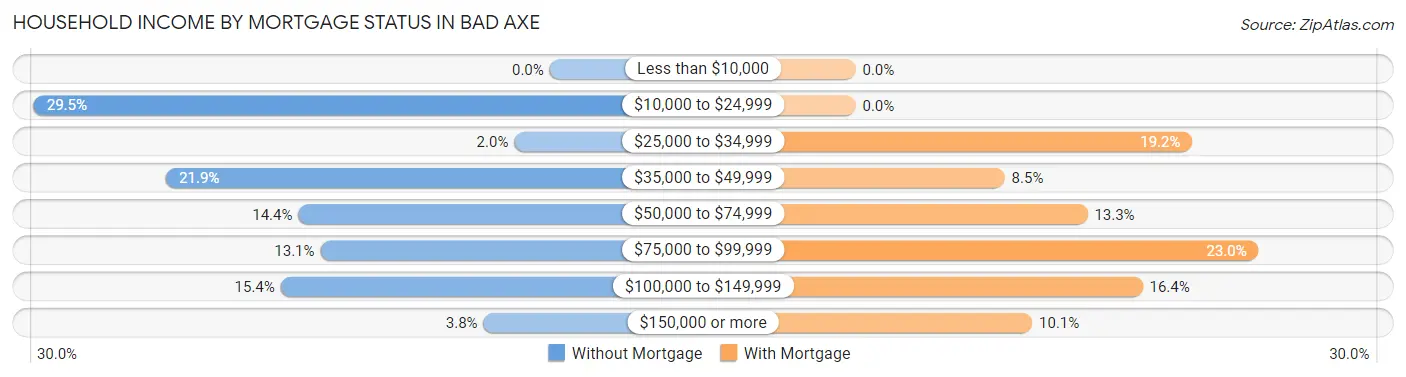
| Household Income | Without Mortgage | With Mortgage |
| Less than $10,000 | 0 (0.0%) | 0 (0.0%) |
| $10,000 to $24,999 | 117 (29.5%) | 0 (0.0%) |
| $25,000 to $34,999 | 8 (2.0%) | 61 (19.2%) |
| $35,000 to $49,999 | 87 (21.9%) | 27 (8.5%) |
| $50,000 to $74,999 | 57 (14.4%) | 42 (13.3%) |
| $75,000 to $99,999 | 52 (13.1%) | 73 (23.0%) |
| $100,000 to $149,999 | 61 (15.4%) | 52 (16.4%) |
| $150,000 or more | 15 (3.8%) | 32 (10.1%) |
| Total | 397 (100.0%) | 317 (100.0%) |
Property Value to Household Income Ratio in Bad Axe
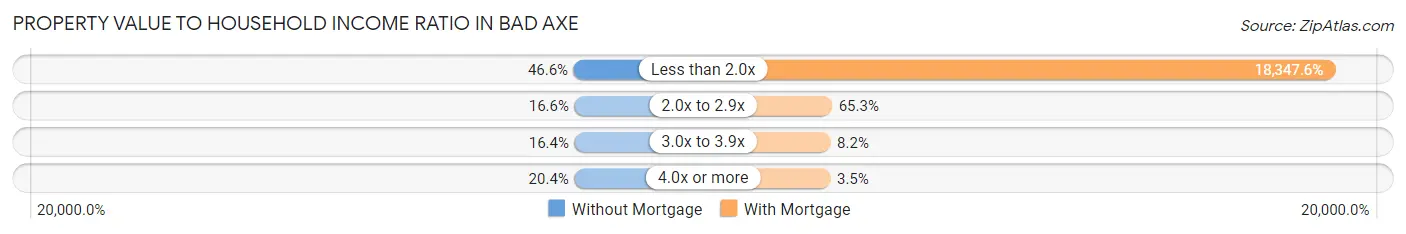
| Value-to-Income Ratio | Without Mortgage | With Mortgage |
| Less than 2.0x | 185 (46.6%) | 58,162 (18,347.6%) |
| 2.0x to 2.9x | 66 (16.6%) | 207 (65.3%) |
| 3.0x to 3.9x | 65 (16.4%) | 26 (8.2%) |
| 4.0x or more | 81 (20.4%) | 11 (3.5%) |
| Total | 397 (100.0%) | 317 (100.0%) |
Real Estate Taxes by Mortgage Status in Bad Axe
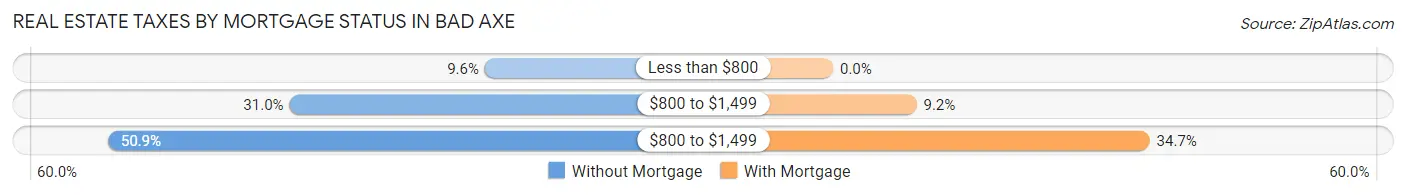
| Property Taxes | Without Mortgage | With Mortgage |
| Less than $800 | 38 (9.6%) | 0 (0.0%) |
| $800 to $1,499 | 123 (31.0%) | 29 (9.1%) |
| $800 to $1,499 | 202 (50.9%) | 110 (34.7%) |
| Total | 397 (100.0%) | 317 (100.0%) |
Health & Disability in Bad Axe
Health Insurance Coverage by Age in Bad Axe
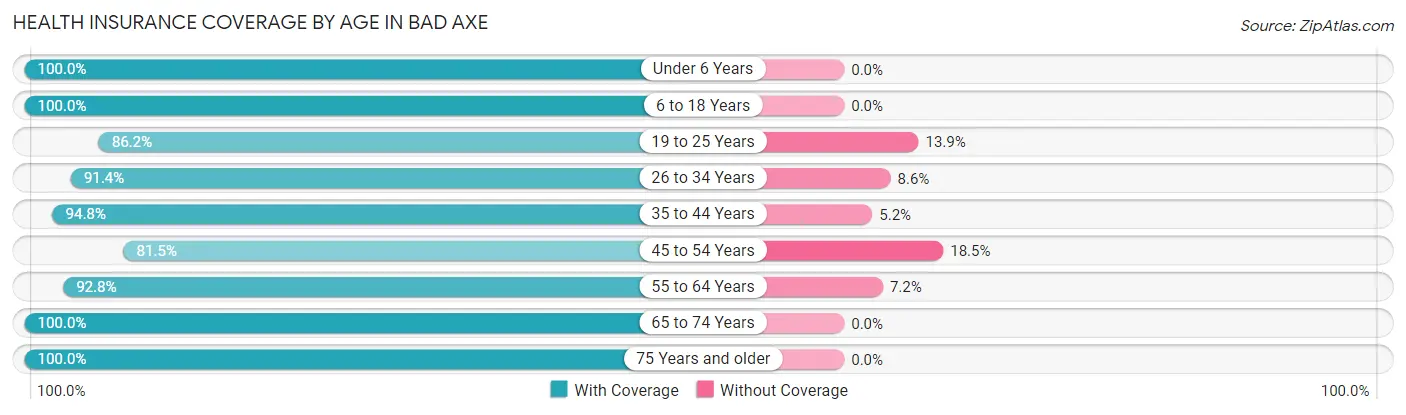
| Age Bracket | With Coverage | Without Coverage |
| Under 6 Years | 107 (100.0%) | 0 (0.0%) |
| 6 to 18 Years | 477 (100.0%) | 0 (0.0%) |
| 19 to 25 Years | 168 (86.2%) | 27 (13.9%) |
| 26 to 34 Years | 339 (91.4%) | 32 (8.6%) |
| 35 to 44 Years | 326 (94.8%) | 18 (5.2%) |
| 45 to 54 Years | 265 (81.5%) | 60 (18.5%) |
| 55 to 64 Years | 386 (92.8%) | 30 (7.2%) |
| 65 to 74 Years | 414 (100.0%) | 0 (0.0%) |
| 75 Years and older | 217 (100.0%) | 0 (0.0%) |
| Total | 2,699 (94.2%) | 167 (5.8%) |
Health Insurance Coverage by Citizenship Status in Bad Axe
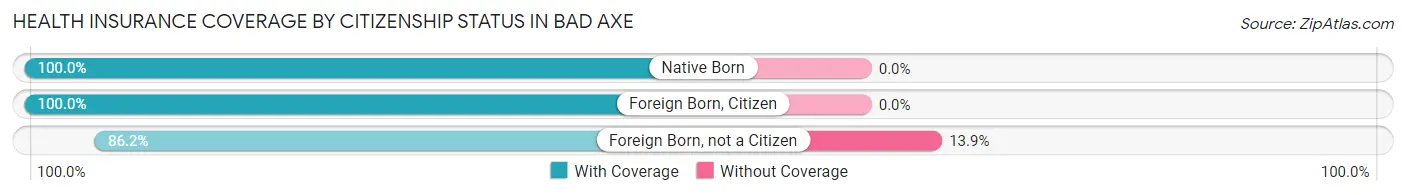
| Citizenship Status | With Coverage | Without Coverage |
| Native Born | 107 (100.0%) | 0 (0.0%) |
| Foreign Born, Citizen | 477 (100.0%) | 0 (0.0%) |
| Foreign Born, not a Citizen | 168 (86.2%) | 27 (13.9%) |
Health Insurance Coverage by Household Income in Bad Axe
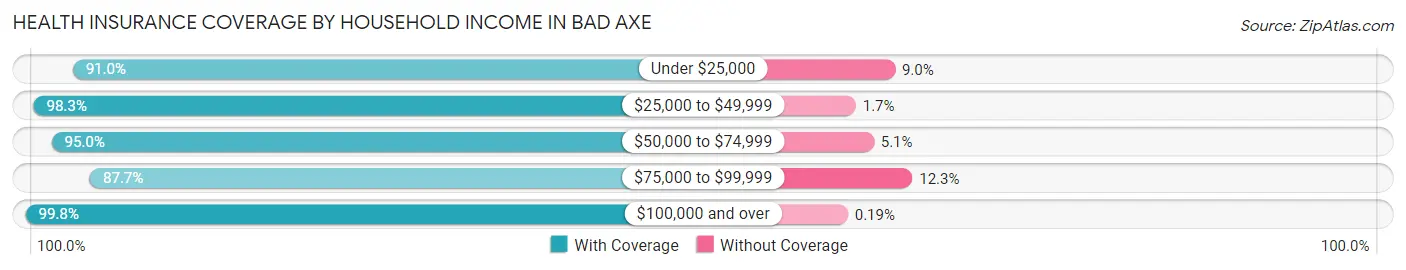
| Household Income | With Coverage | Without Coverage |
| Under $25,000 | 454 (91.0%) | 45 (9.0%) |
| $25,000 to $49,999 | 523 (98.3%) | 9 (1.7%) |
| $50,000 to $74,999 | 564 (95.0%) | 30 (5.1%) |
| $75,000 to $99,999 | 586 (87.7%) | 82 (12.3%) |
| $100,000 and over | 527 (99.8%) | 1 (0.2%) |
Public vs Private Health Insurance Coverage by Age in Bad Axe
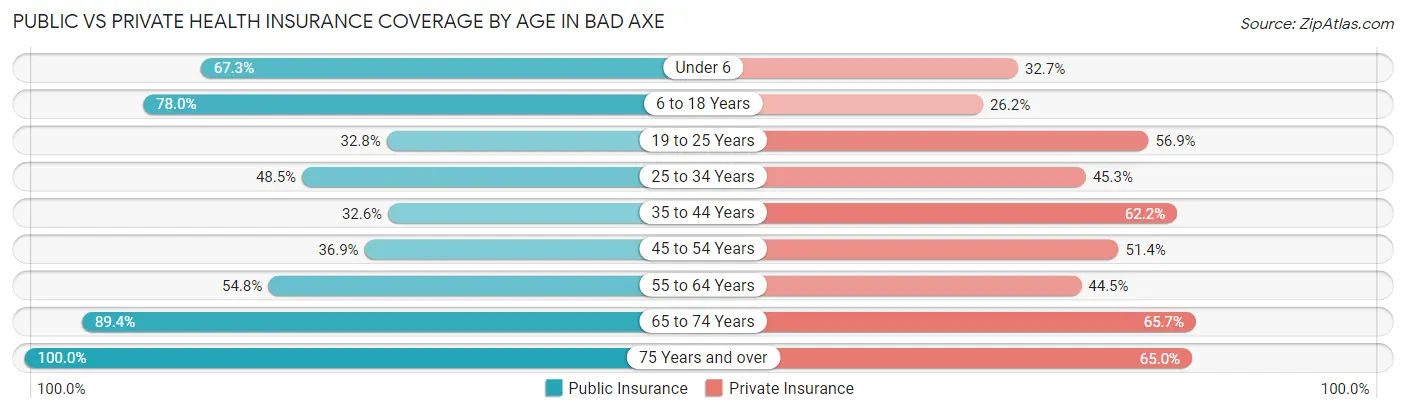
| Age Bracket | Public Insurance | Private Insurance |
| Under 6 | 72 (67.3%) | 35 (32.7%) |
| 6 to 18 Years | 372 (78.0%) | 125 (26.2%) |
| 19 to 25 Years | 64 (32.8%) | 111 (56.9%) |
| 25 to 34 Years | 180 (48.5%) | 168 (45.3%) |
| 35 to 44 Years | 112 (32.6%) | 214 (62.2%) |
| 45 to 54 Years | 120 (36.9%) | 167 (51.4%) |
| 55 to 64 Years | 228 (54.8%) | 185 (44.5%) |
| 65 to 74 Years | 370 (89.4%) | 272 (65.7%) |
| 75 Years and over | 217 (100.0%) | 141 (65.0%) |
| Total | 1,735 (60.5%) | 1,418 (49.5%) |
Disability Status by Sex by Age in Bad Axe
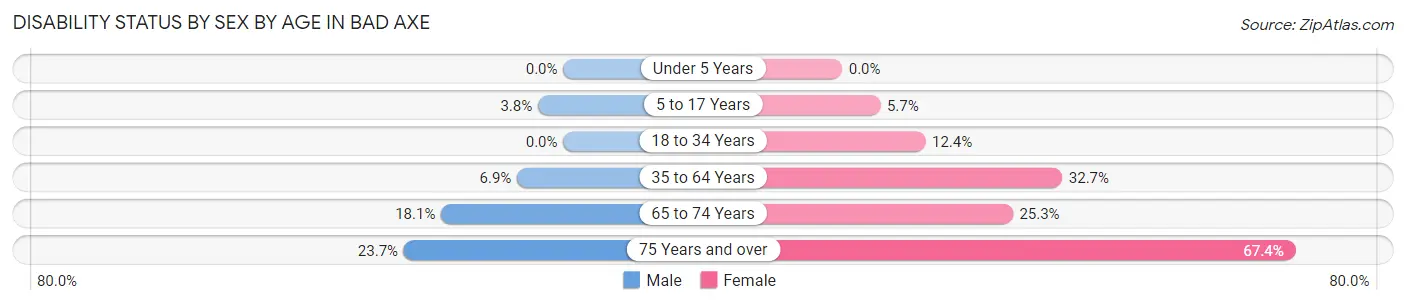
| Age Bracket | Male | Female |
| Under 5 Years | 0 (0.0%) | 0 (0.0%) |
| 5 to 17 Years | 10 (3.7%) | 11 (5.7%) |
| 18 to 34 Years | 0 (0.0%) | 45 (12.4%) |
| 35 to 64 Years | 36 (6.9%) | 183 (32.7%) |
| 65 to 74 Years | 35 (18.1%) | 56 (25.3%) |
| 75 Years and over | 18 (23.7%) | 95 (67.4%) |
Disability Class by Sex by Age in Bad Axe
Disability Class: Hearing Difficulty
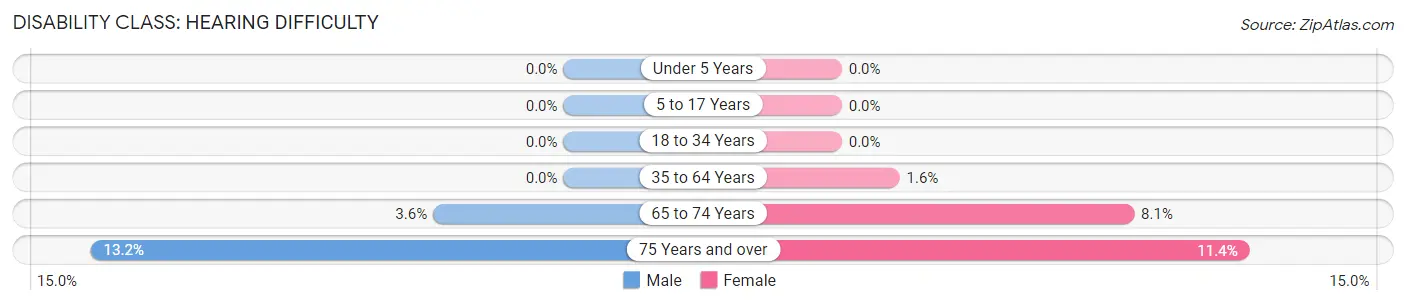
| Age Bracket | Male | Female |
| Under 5 Years | 0 (0.0%) | 0 (0.0%) |
| 5 to 17 Years | 0 (0.0%) | 0 (0.0%) |
| 18 to 34 Years | 0 (0.0%) | 0 (0.0%) |
| 35 to 64 Years | 0 (0.0%) | 9 (1.6%) |
| 65 to 74 Years | 7 (3.6%) | 18 (8.1%) |
| 75 Years and over | 10 (13.2%) | 16 (11.4%) |
Disability Class: Vision Difficulty
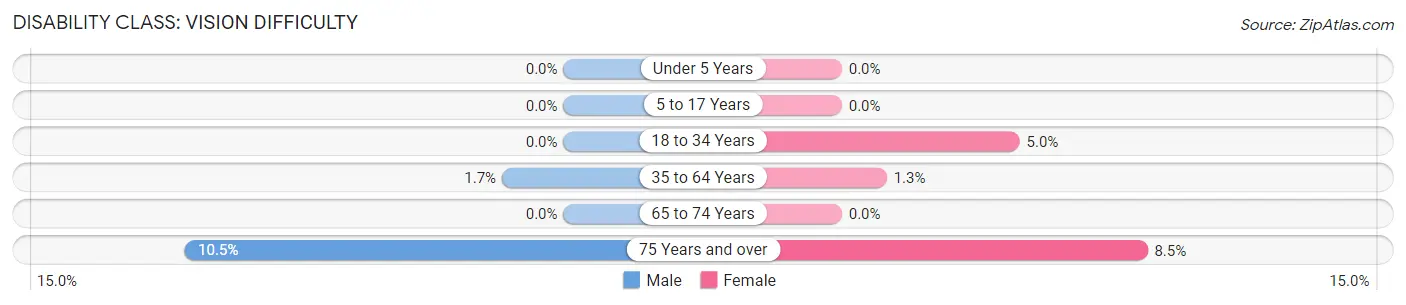
| Age Bracket | Male | Female |
| Under 5 Years | 0 (0.0%) | 0 (0.0%) |
| 5 to 17 Years | 0 (0.0%) | 0 (0.0%) |
| 18 to 34 Years | 0 (0.0%) | 18 (5.0%) |
| 35 to 64 Years | 9 (1.7%) | 7 (1.3%) |
| 65 to 74 Years | 0 (0.0%) | 0 (0.0%) |
| 75 Years and over | 8 (10.5%) | 12 (8.5%) |
Disability Class: Cognitive Difficulty
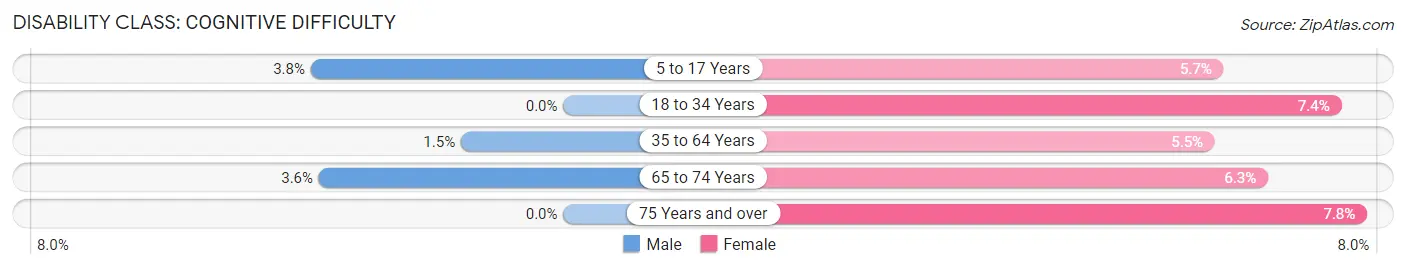
| Age Bracket | Male | Female |
| 5 to 17 Years | 10 (3.7%) | 11 (5.7%) |
| 18 to 34 Years | 0 (0.0%) | 27 (7.4%) |
| 35 to 64 Years | 8 (1.5%) | 31 (5.5%) |
| 65 to 74 Years | 7 (3.6%) | 14 (6.3%) |
| 75 Years and over | 0 (0.0%) | 11 (7.8%) |
Disability Class: Ambulatory Difficulty
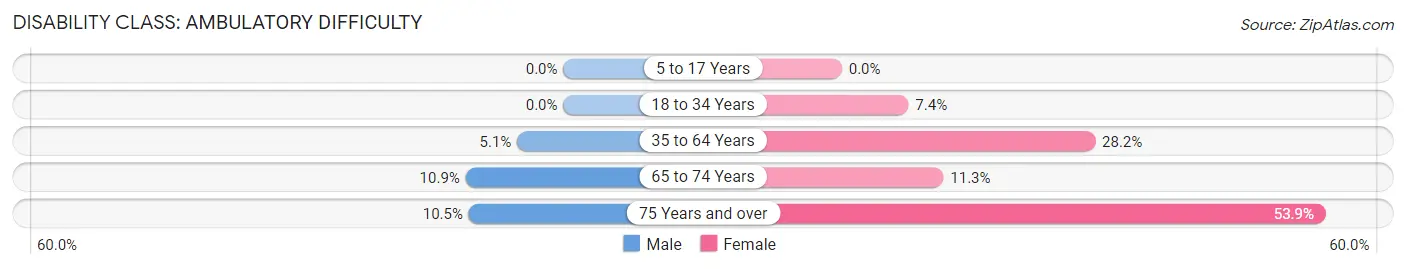
| Age Bracket | Male | Female |
| 5 to 17 Years | 0 (0.0%) | 0 (0.0%) |
| 18 to 34 Years | 0 (0.0%) | 27 (7.4%) |
| 35 to 64 Years | 27 (5.1%) | 158 (28.2%) |
| 65 to 74 Years | 21 (10.9%) | 25 (11.3%) |
| 75 Years and over | 8 (10.5%) | 76 (53.9%) |
Disability Class: Self-Care Difficulty
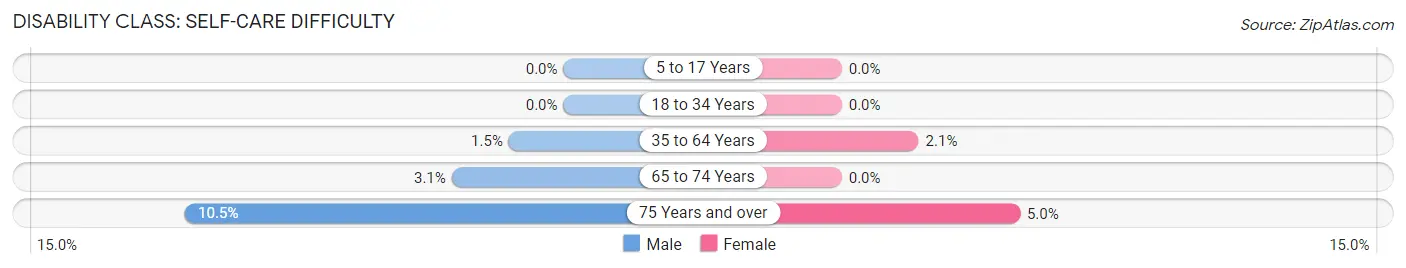
| Age Bracket | Male | Female |
| 5 to 17 Years | 0 (0.0%) | 0 (0.0%) |
| 18 to 34 Years | 0 (0.0%) | 0 (0.0%) |
| 35 to 64 Years | 8 (1.5%) | 12 (2.1%) |
| 65 to 74 Years | 6 (3.1%) | 0 (0.0%) |
| 75 Years and over | 8 (10.5%) | 7 (5.0%) |
Technology Access in Bad Axe
Computing Device Access in Bad Axe
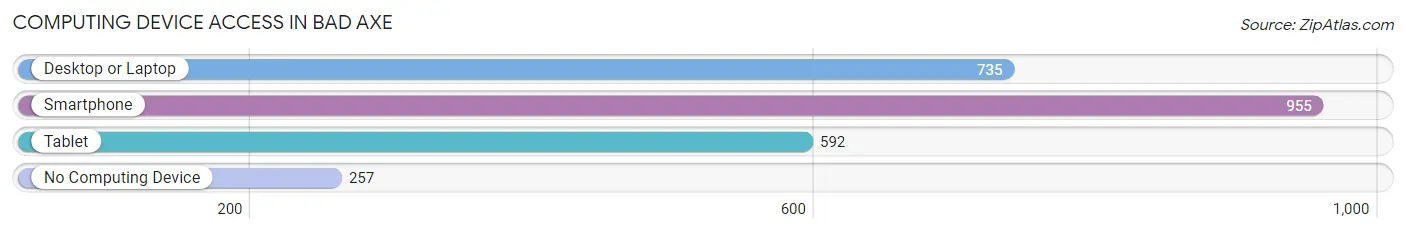
| Device Type | # Households | % Households |
| Desktop or Laptop | 735 | 56.6% |
| Smartphone | 955 | 73.6% |
| Tablet | 592 | 45.6% |
| No Computing Device | 257 | 19.8% |
| Total | 1,298 | 100.0% |
Internet Access in Bad Axe
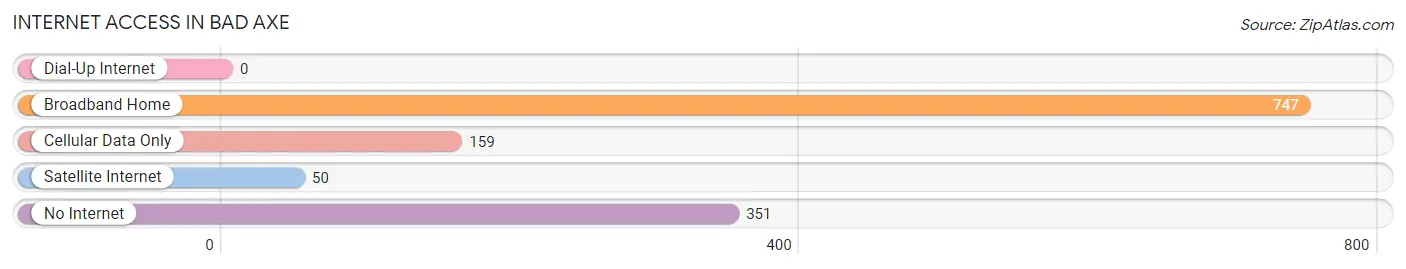
| Internet Type | # Households | % Households |
| Dial-Up Internet | 0 | 0.0% |
| Broadband Home | 747 | 57.6% |
| Cellular Data Only | 159 | 12.2% |
| Satellite Internet | 50 | 3.8% |
| No Internet | 351 | 27.0% |
| Total | 1,298 | 100.0% |
Bad Axe Summary
Introduction
Bad Axe is a city located in the state of Michigan in the United States. It is the county seat of Huron County and is located in the Thumb region of the state. The city has a population of 3,129 as of the 2010 census. The city is known for its rich history, diverse geography, strong economy, and unique demographics.
History
Bad Axe was founded in 1854 by a group of settlers from New York. The city was named after a nearby creek, which was named after a large axe that was found in the creek. The city was incorporated in 1859 and has been the county seat of Huron County since 1859.
The city has a rich history of industry and agriculture. In the late 19th century, the city was home to several sawmills, gristmills, and a woolen mill. The city also had a thriving agricultural industry, with many farmers growing wheat, corn, and other crops.
The city was also home to several important historical figures. One of the most notable was William A. Fletcher, who served as the mayor of Bad Axe from 1876 to 1878. He was also a prominent lawyer and served as a state senator from 1881 to 1883.
Geography
Bad Axe is located in the Thumb region of Michigan, which is located in the southeastern part of the state. The city is situated on the banks of the Bad Axe River, which is a tributary of the Saginaw River. The city is surrounded by farmland and is located near several lakes, including Lake Huron, Lake St. Clair, and Lake Erie.
The city has a total area of 3.2 square miles, all of which is land. The city has a humid continental climate, with cold winters and hot, humid summers.
Economy
Bad Axe has a strong economy that is based on agriculture, manufacturing, and tourism. The city is home to several manufacturing companies, including a plastics manufacturer, a metal fabricator, and a food processor. The city is also home to several agricultural businesses, including a dairy farm, a vegetable farm, and a fruit farm.
The city is also a popular tourist destination, with many visitors coming to the city to enjoy its natural beauty and historical sites. The city is home to several museums, including the Huron County Historical Museum and the Bad Axe Historical Museum.
Demographics
As of the 2010 census, the city had a population of 3,129. The population is predominantly white, with 92.3% of the population identifying as white. The city also has a small Hispanic population, with 4.2% of the population identifying as Hispanic or Latino.
The median household income in the city is $37,917, and the median family income is $45,938. The city has a poverty rate of 17.3%, which is higher than the national average.
Conclusion
Bad Axe is a city located in the state of Michigan in the United States. It is the county seat of Huron County and is located in the Thumb region of the state. The city has a rich history, diverse geography, strong economy, and unique demographics. The city is home to several manufacturing companies, agricultural businesses, and tourist attractions. The city has a predominantly white population, with a small Hispanic population. The city has a median household income of $37,917 and a poverty rate of 17.3%.
Common Questions
What is Per Capita Income in Bad Axe?
Per Capita income in Bad Axe is $27,341.
What is the Median Family Income in Bad Axe?
Median Family Income in Bad Axe is $67,955.
What is the Median Household income in Bad Axe?
Median Household Income in Bad Axe is $45,833.
What is Income or Wage Gap in Bad Axe?
Income or Wage Gap in Bad Axe is 37.3%.
Women in Bad Axe earn 62.7 cents for every dollar earned by a man.
What is Inequality or Gini Index in Bad Axe?
Inequality or Gini Index in Bad Axe is 0.41.
What is the Total Population of Bad Axe?
Total Population of Bad Axe is 3,025.
What is the Total Male Population of Bad Axe?
Total Male Population of Bad Axe is 1,377.
What is the Total Female Population of Bad Axe?
Total Female Population of Bad Axe is 1,648.
What is the Ratio of Males per 100 Females in Bad Axe?
There are 83.56 Males per 100 Females in Bad Axe.
What is the Ratio of Females per 100 Males in Bad Axe?
There are 119.68 Females per 100 Males in Bad Axe.
What is the Median Population Age in Bad Axe?
Median Population Age in Bad Axe is 43.6 Years.
What is the Average Family Size in Bad Axe
Average Family Size in Bad Axe is 3.4 People.
What is the Average Household Size in Bad Axe
Average Household Size in Bad Axe is 2.2 People.
How Large is the Labor Force in Bad Axe?
There are 1,295 People in the Labor Forcein in Bad Axe.
What is the Percentage of People in the Labor Force in Bad Axe?
52.0% of People are in the Labor Force in Bad Axe.
What is the Unemployment Rate in Bad Axe?
Unemployment Rate in Bad Axe is 6.8%.