Zip Codes with the Highest Percentage of Population Employed in Accommodation & Food Services in Rochester, MI
RELATED REPORTS & OPTIONS
Accommodation & Food Services
Rochester
Compare Zip Codes
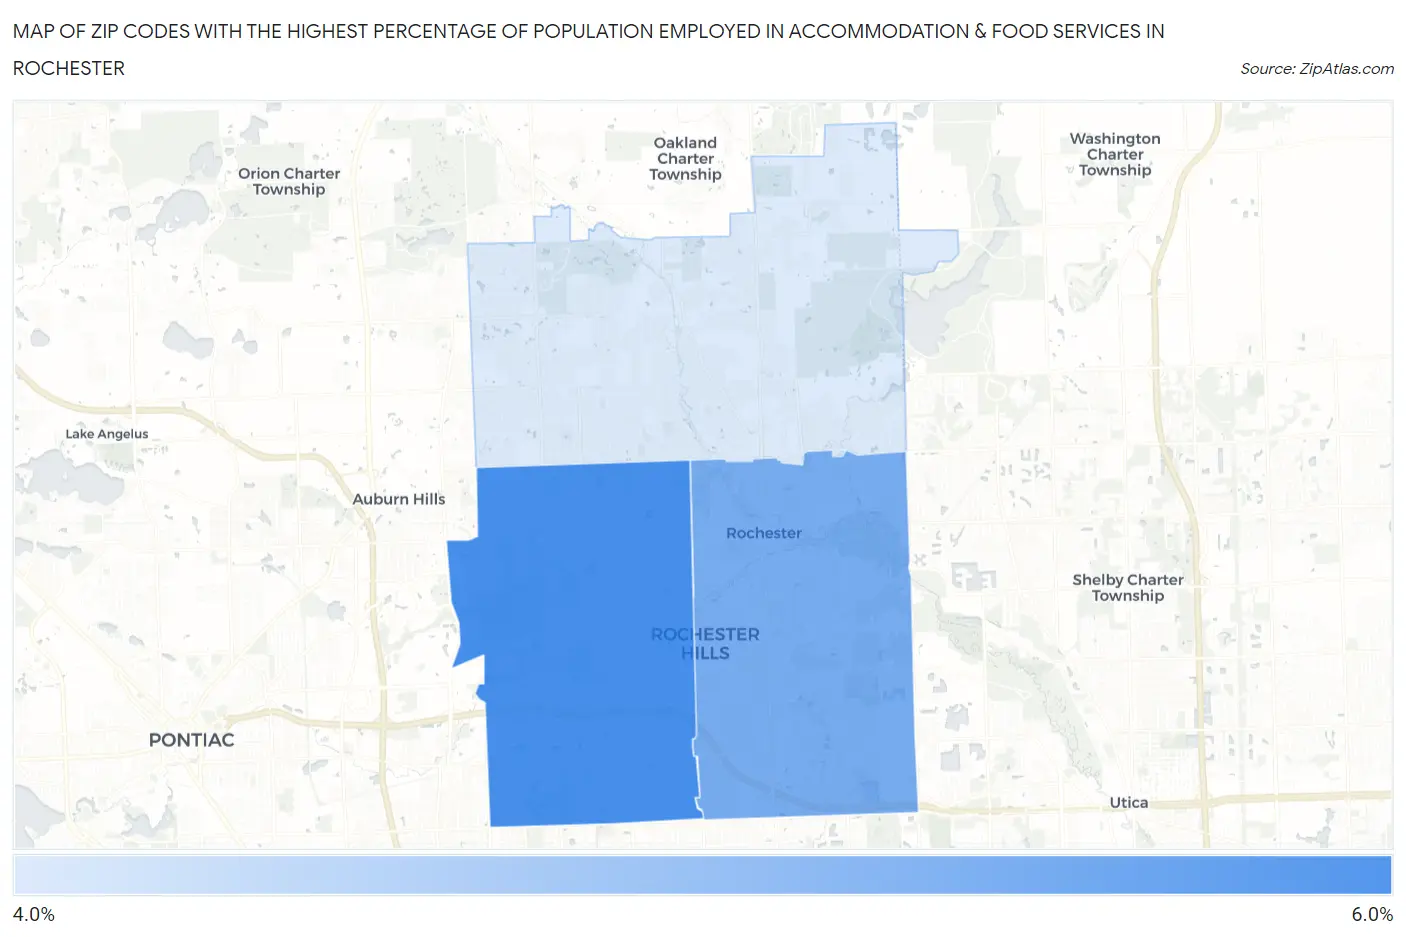
Map of Zip Codes with the Highest Percentage of Population Employed in Accommodation & Food Services in Rochester
4.7%
5.8%
Zip Codes with the Highest Percentage of Population Employed in Accommodation & Food Services in Rochester, MI
| Zip Code | % Employed | vs State | vs National | |
| 1. | 48309 | 5.8% | 7.1%(-1.30)#562 | 6.9%(-1.10)#14,127 |
| 2. | 48307 | 5.4% | 7.1%(-1.65)#606 | 6.9%(-1.44)#15,270 |
| 3. | 48306 | 4.7% | 7.1%(-2.37)#693 | 6.9%(-2.17)#17,775 |
1
Common Questions
What are the Top Zip Codes with the Highest Percentage of Population Employed in Accommodation & Food Services in Rochester, MI?
Top Zip Codes with the Highest Percentage of Population Employed in Accommodation & Food Services in Rochester, MI are:
What zip code has the Highest Percentage of Population Employed in Accommodation & Food Services in Rochester, MI?
48309 has the Highest Percentage of Population Employed in Accommodation & Food Services in Rochester, MI with 5.8%.
What is the Percentage of Population Employed in Accommodation & Food Services in Rochester, MI?
Percentage of Population Employed in Accommodation & Food Services in Rochester is 5.5%.
What is the Percentage of Population Employed in Accommodation & Food Services in Michigan?
Percentage of Population Employed in Accommodation & Food Services in Michigan is 7.1%.
What is the Percentage of Population Employed in Accommodation & Food Services in the United States?
Percentage of Population Employed in Accommodation & Food Services in the United States is 6.9%.