Zip Codes with the Highest Percentage of Population Employed in Accommodation & Food Services in Livonia, MI
RELATED REPORTS & OPTIONS
Accommodation & Food Services
Livonia
Compare Zip Codes
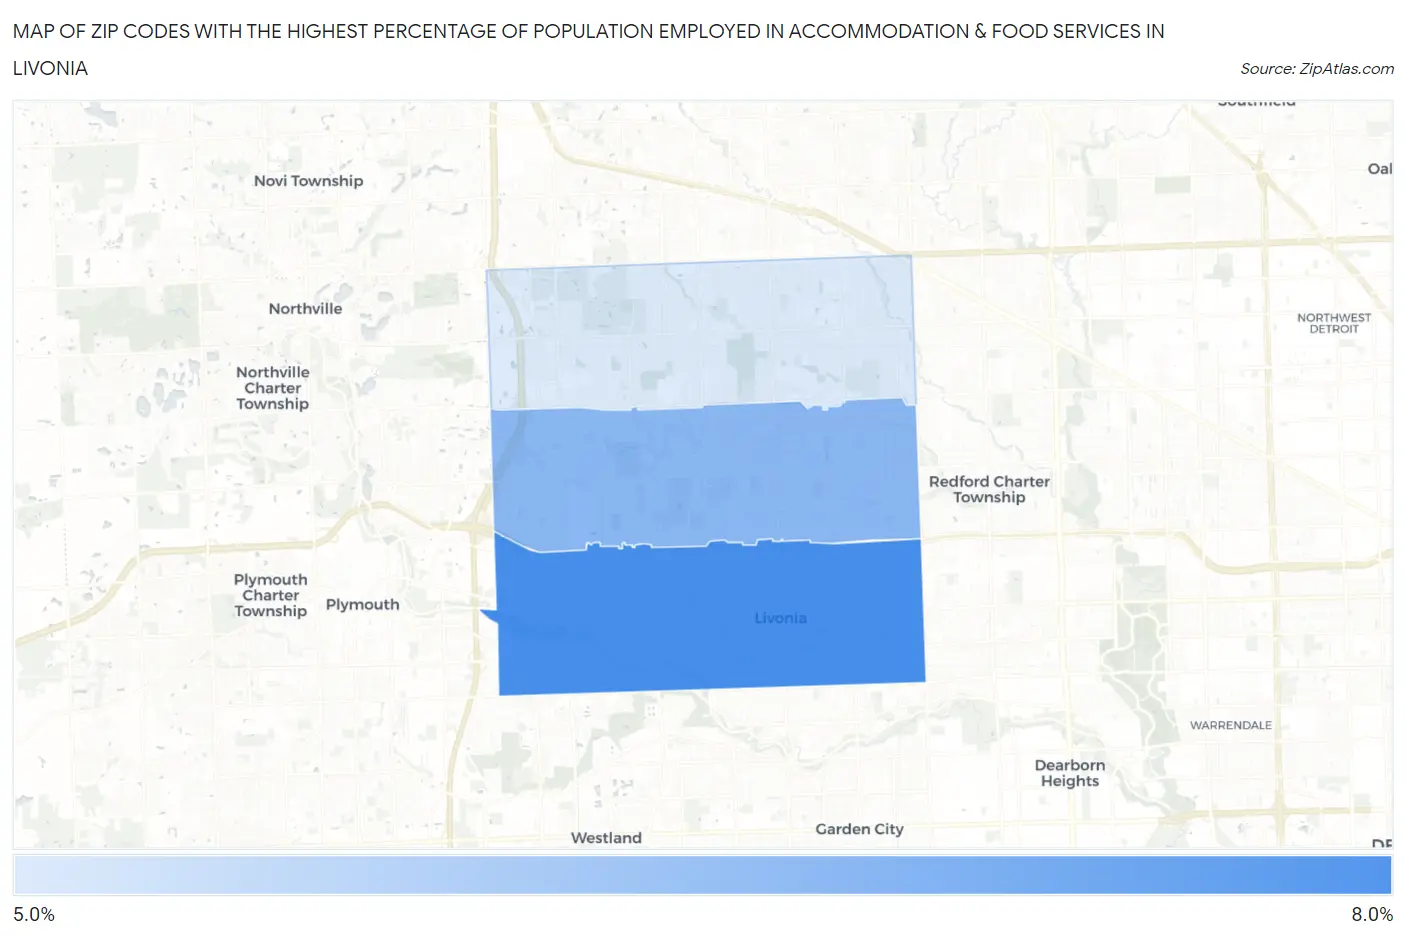
Map of Zip Codes with the Highest Percentage of Population Employed in Accommodation & Food Services in Livonia
5.4%
7.4%
Zip Codes with the Highest Percentage of Population Employed in Accommodation & Food Services in Livonia, MI
| Zip Code | % Employed | vs State | vs National | |
| 1. | 48150 | 7.4% | 7.1%(+0.336)#342 | 6.9%(+0.539)#9,200 |
| 2. | 48154 | 6.5% | 7.1%(-0.560)#455 | 6.9%(-0.357)#11,767 |
| 3. | 48152 | 5.4% | 7.1%(-1.64)#605 | 6.9%(-1.44)#15,253 |
1
Common Questions
What are the Top Zip Codes with the Highest Percentage of Population Employed in Accommodation & Food Services in Livonia, MI?
Top Zip Codes with the Highest Percentage of Population Employed in Accommodation & Food Services in Livonia, MI are:
What zip code has the Highest Percentage of Population Employed in Accommodation & Food Services in Livonia, MI?
48150 has the Highest Percentage of Population Employed in Accommodation & Food Services in Livonia, MI with 7.4%.
What is the Percentage of Population Employed in Accommodation & Food Services in Livonia, MI?
Percentage of Population Employed in Accommodation & Food Services in Livonia is 6.5%.
What is the Percentage of Population Employed in Accommodation & Food Services in Michigan?
Percentage of Population Employed in Accommodation & Food Services in Michigan is 7.1%.
What is the Percentage of Population Employed in Accommodation & Food Services in the United States?
Percentage of Population Employed in Accommodation & Food Services in the United States is 6.9%.