Zip Codes with the Highest Percentage of Population Employed in Accommodation & Food Services in Lansing, MI
RELATED REPORTS & OPTIONS
Accommodation & Food Services
Lansing
Compare Zip Codes
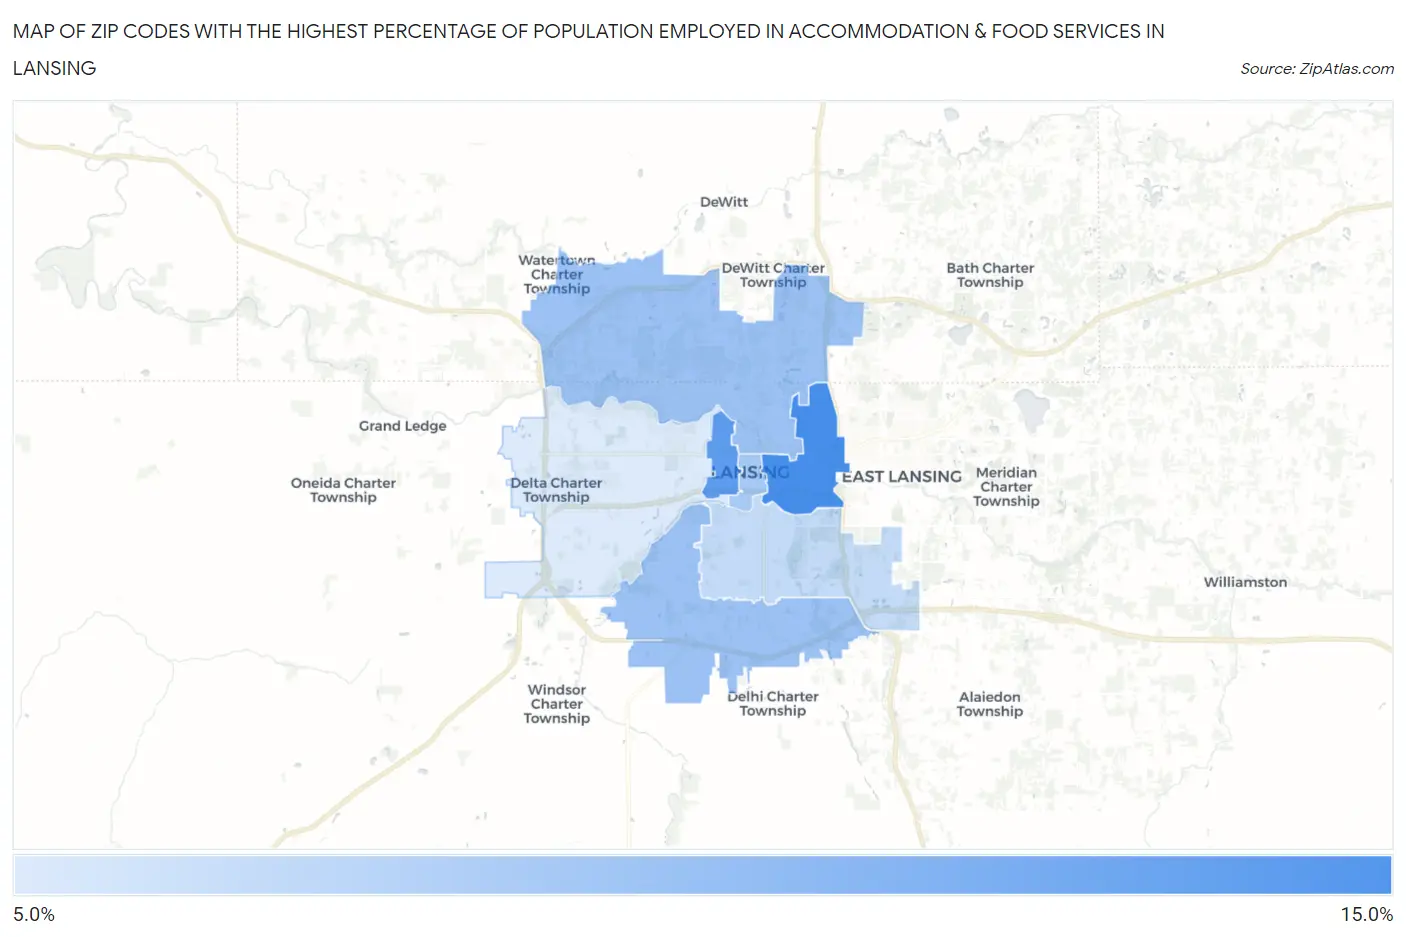
Map of Zip Codes with the Highest Percentage of Population Employed in Accommodation & Food Services in Lansing
5.8%
10.6%
Zip Codes with the Highest Percentage of Population Employed in Accommodation & Food Services in Lansing, MI
| Zip Code | % Employed | vs State | vs National | |
| 1. | 48912 | 10.6% | 7.1%(+3.50)#114 | 6.9%(+3.70)#3,909 |
| 2. | 48915 | 9.8% | 7.1%(+2.75)#158 | 6.9%(+2.95)#4,743 |
| 3. | 48911 | 7.9% | 7.1%(+0.831)#285 | 6.9%(+1.03)#7,996 |
| 4. | 48906 | 7.9% | 7.1%(+0.817)#288 | 6.9%(+1.02)#8,023 |
| 5. | 48933 | 7.4% | 7.1%(+0.320)#344 | 6.9%(+0.522)#9,249 |
| 6. | 48910 | 6.5% | 7.1%(-0.547)#452 | 6.9%(-0.344)#11,722 |
| 7. | 48917 | 5.8% | 7.1%(-1.33)#566 | 6.9%(-1.12)#14,204 |
1
Common Questions
What are the Top 5 Zip Codes with the Highest Percentage of Population Employed in Accommodation & Food Services in Lansing, MI?
Top 5 Zip Codes with the Highest Percentage of Population Employed in Accommodation & Food Services in Lansing, MI are:
What zip code has the Highest Percentage of Population Employed in Accommodation & Food Services in Lansing, MI?
48912 has the Highest Percentage of Population Employed in Accommodation & Food Services in Lansing, MI with 10.6%.
What is the Percentage of Population Employed in Accommodation & Food Services in Lansing, MI?
Percentage of Population Employed in Accommodation & Food Services in Lansing is 8.4%.
What is the Percentage of Population Employed in Accommodation & Food Services in Michigan?
Percentage of Population Employed in Accommodation & Food Services in Michigan is 7.1%.
What is the Percentage of Population Employed in Accommodation & Food Services in the United States?
Percentage of Population Employed in Accommodation & Food Services in the United States is 6.9%.