Zip Codes with the Highest Percentage of Population Employed in Accommodation & Food Services in Bay City, MI
RELATED REPORTS & OPTIONS
Accommodation & Food Services
Bay City
Compare Zip Codes
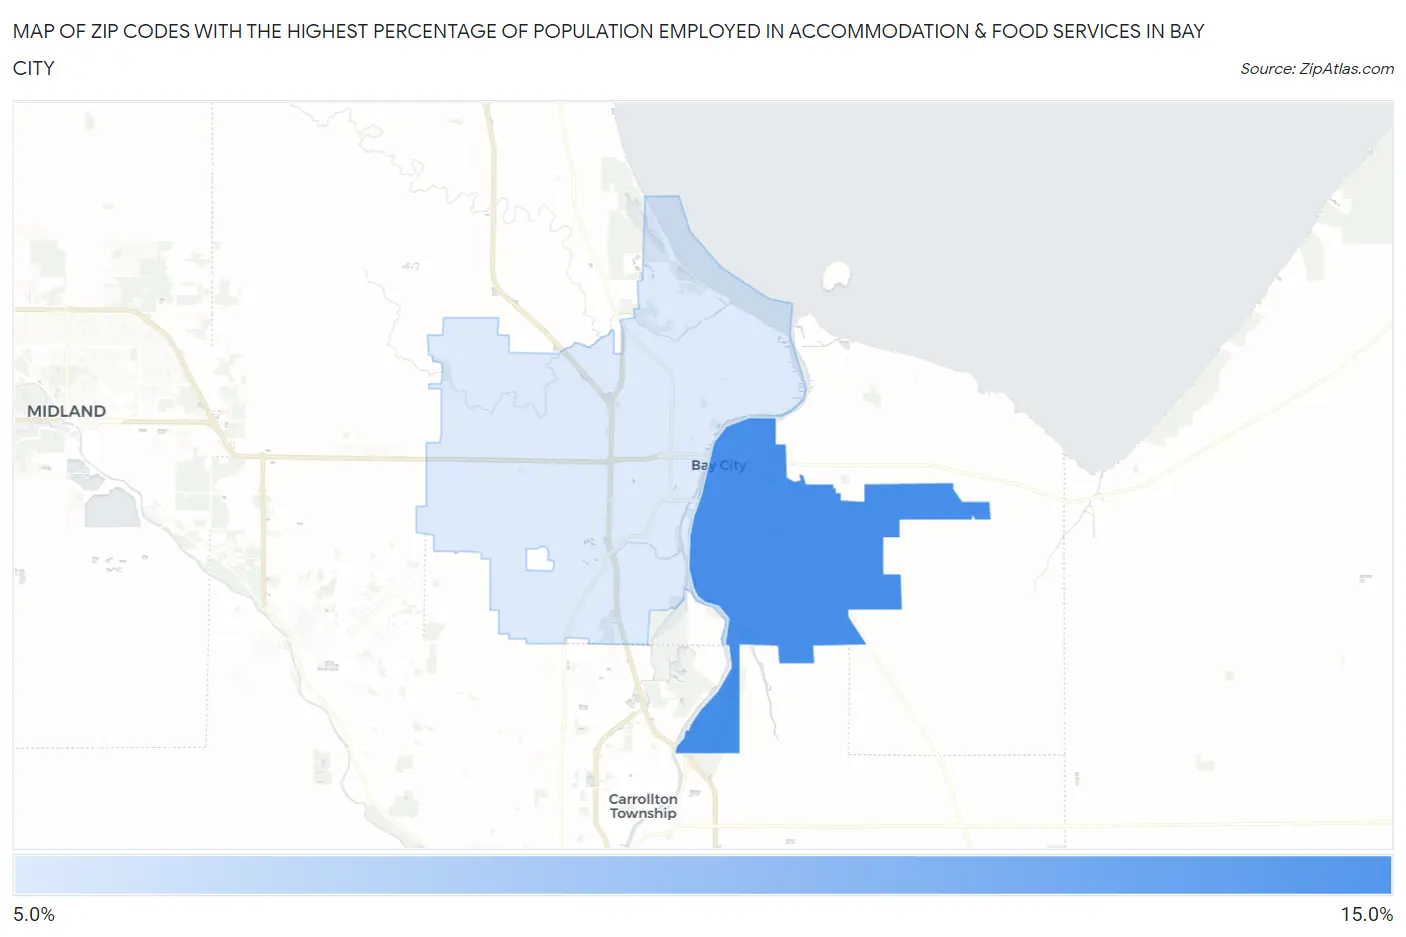
Map of Zip Codes with the Highest Percentage of Population Employed in Accommodation & Food Services in Bay City
7.1%
11.9%
Zip Codes with the Highest Percentage of Population Employed in Accommodation & Food Services in Bay City, MI
| Zip Code | % Employed | vs State | vs National | |
| 1. | 48708 | 11.9% | 7.1%(+4.80)#80 | 6.9%(+5.00)#2,915 |
| 2. | 48706 | 7.1% | 7.1%(+0.001)#383 | 6.9%(+0.204)#10,088 |
1
Common Questions
What are the Top Zip Codes with the Highest Percentage of Population Employed in Accommodation & Food Services in Bay City, MI?
Top Zip Codes with the Highest Percentage of Population Employed in Accommodation & Food Services in Bay City, MI are:
What zip code has the Highest Percentage of Population Employed in Accommodation & Food Services in Bay City, MI?
48708 has the Highest Percentage of Population Employed in Accommodation & Food Services in Bay City, MI with 11.9%.
What is the Percentage of Population Employed in Accommodation & Food Services in Bay City, MI?
Percentage of Population Employed in Accommodation & Food Services in Bay City is 12.7%.
What is the Percentage of Population Employed in Accommodation & Food Services in Michigan?
Percentage of Population Employed in Accommodation & Food Services in Michigan is 7.1%.
What is the Percentage of Population Employed in Accommodation & Food Services in the United States?
Percentage of Population Employed in Accommodation & Food Services in the United States is 6.9%.