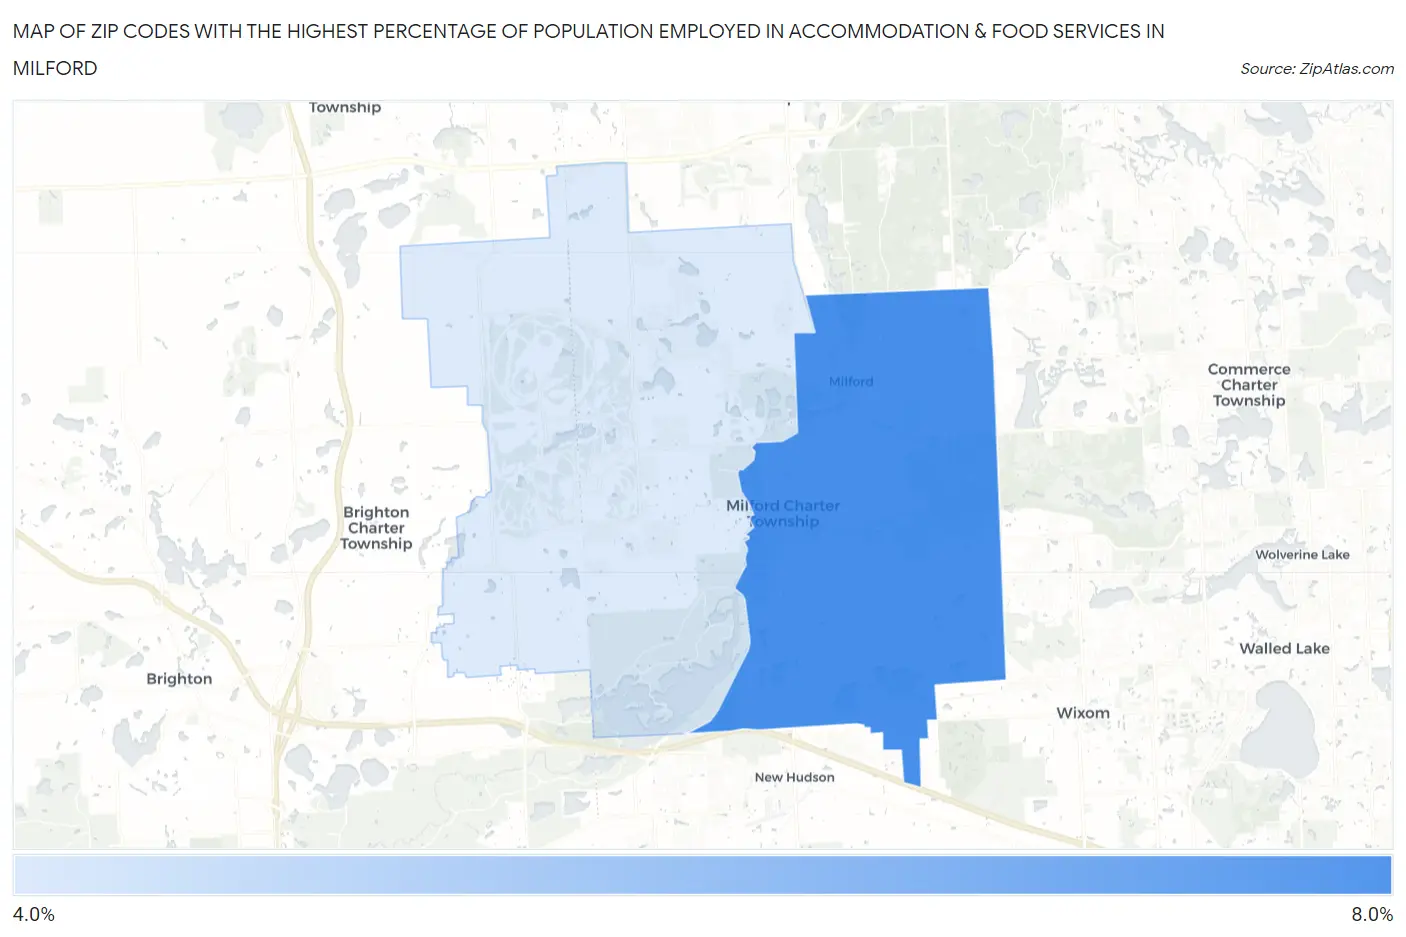
Zip Codes with the Highest Percentage of Population Employed in Accommodation & Food Services in Milford, MI
RELATED REPORTS & OPTIONS
Accommodation & Food Services
Milford
Compare Zip Codes
Map of Zip Codes with the Highest Percentage of Population Employed in Accommodation & Food Services in Milford
5.0%
7.5%
Zip Codes with the Highest Percentage of Population Employed in Accommodation & Food Services in Milford, MI
| Zip Code | % Employed | vs State | vs National | |
| 1. | 48381 | 7.5% | 7.1%(+0.368)#334 | 6.9%(+0.571)#9,099 |
| 2. | 48380 | 5.0% | 7.1%(-2.10)#671 | 6.9%(-1.90)#16,887 |
1
Common Questions
What are the Top Zip Codes with the Highest Percentage of Population Employed in Accommodation & Food Services in Milford, MI?
Top Zip Codes with the Highest Percentage of Population Employed in Accommodation & Food Services in Milford, MI are:
What zip code has the Highest Percentage of Population Employed in Accommodation & Food Services in Milford, MI?
48381 has the Highest Percentage of Population Employed in Accommodation & Food Services in Milford, MI with 7.5%.
What is the Percentage of Population Employed in Accommodation & Food Services in Milford, MI?
Percentage of Population Employed in Accommodation & Food Services in Milford is 5.3%.
What is the Percentage of Population Employed in Accommodation & Food Services in Michigan?
Percentage of Population Employed in Accommodation & Food Services in Michigan is 7.1%.
What is the Percentage of Population Employed in Accommodation & Food Services in the United States?
Percentage of Population Employed in Accommodation & Food Services in the United States is 6.9%.