Copper City, MI Map & Demographics
Copper City Map
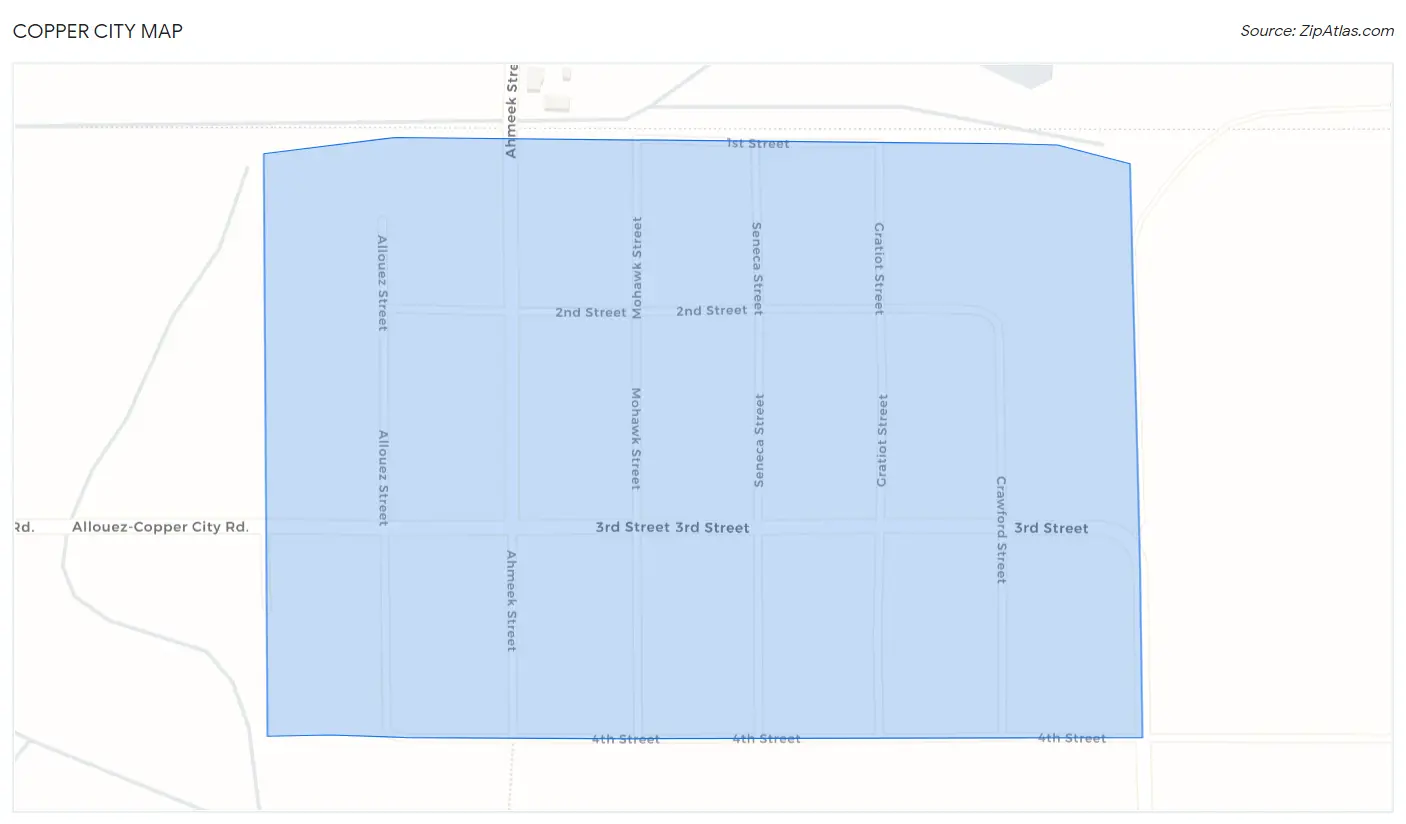
Copper City Overview
$21,892
PER CAPITA INCOME
$53,750
AVG FAMILY INCOME
$48,333
AVG HOUSEHOLD INCOME
1.8%
WAGE / INCOME GAP [ % ]
98.2¢/ $1
WAGE / INCOME GAP [ $ ]
0.31
INEQUALITY / GINI INDEX
229
TOTAL POPULATION
154
MALE POPULATION
75
FEMALE POPULATION
205.33
MALES / 100 FEMALES
48.70
FEMALES / 100 MALES
47.1
MEDIAN AGE
3.4
AVG FAMILY SIZE
2.9
AVG HOUSEHOLD SIZE
97
LABOR FORCE [ PEOPLE ]
57.1%
PERCENT IN LABOR FORCE
33.0%
UNEMPLOYMENT RATE
Copper City Zip Codes
Copper City Area Codes
Income in Copper City
Income Overview in Copper City
Per Capita Income in Copper City is $21,892, while median incomes of families and households are $53,750 and $48,333 respectively.
| Characteristic | Number | Measure |
| Per Capita Income | 229 | $21,892 |
| Median Family Income | 58 | $53,750 |
| Mean Family Income | 58 | $56,362 |
| Median Household Income | 78 | $48,333 |
| Mean Household Income | 78 | $53,591 |
| Income Deficit | 58 | $0 |
| Wage / Income Gap (%) | 229 | 1.75% |
| Wage / Income Gap ($) | 229 | 98.25¢ per $1 |
| Gini / Inequality Index | 229 | 0.31 |
Earnings by Sex in Copper City
Average Earnings in Copper City are $40,039, $40,078 for men and $39,375 for women, a difference of 1.8%.
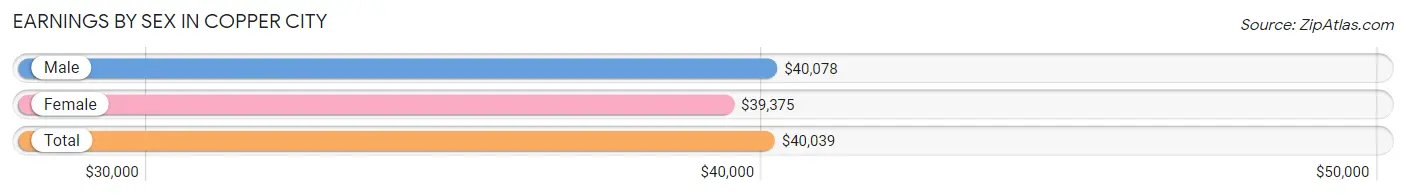
| Sex | Number | Average Earnings |
| Male | 64 (66.0%) | $40,078 |
| Female | 33 (34.0%) | $39,375 |
| Total | 97 (100.0%) | $40,039 |
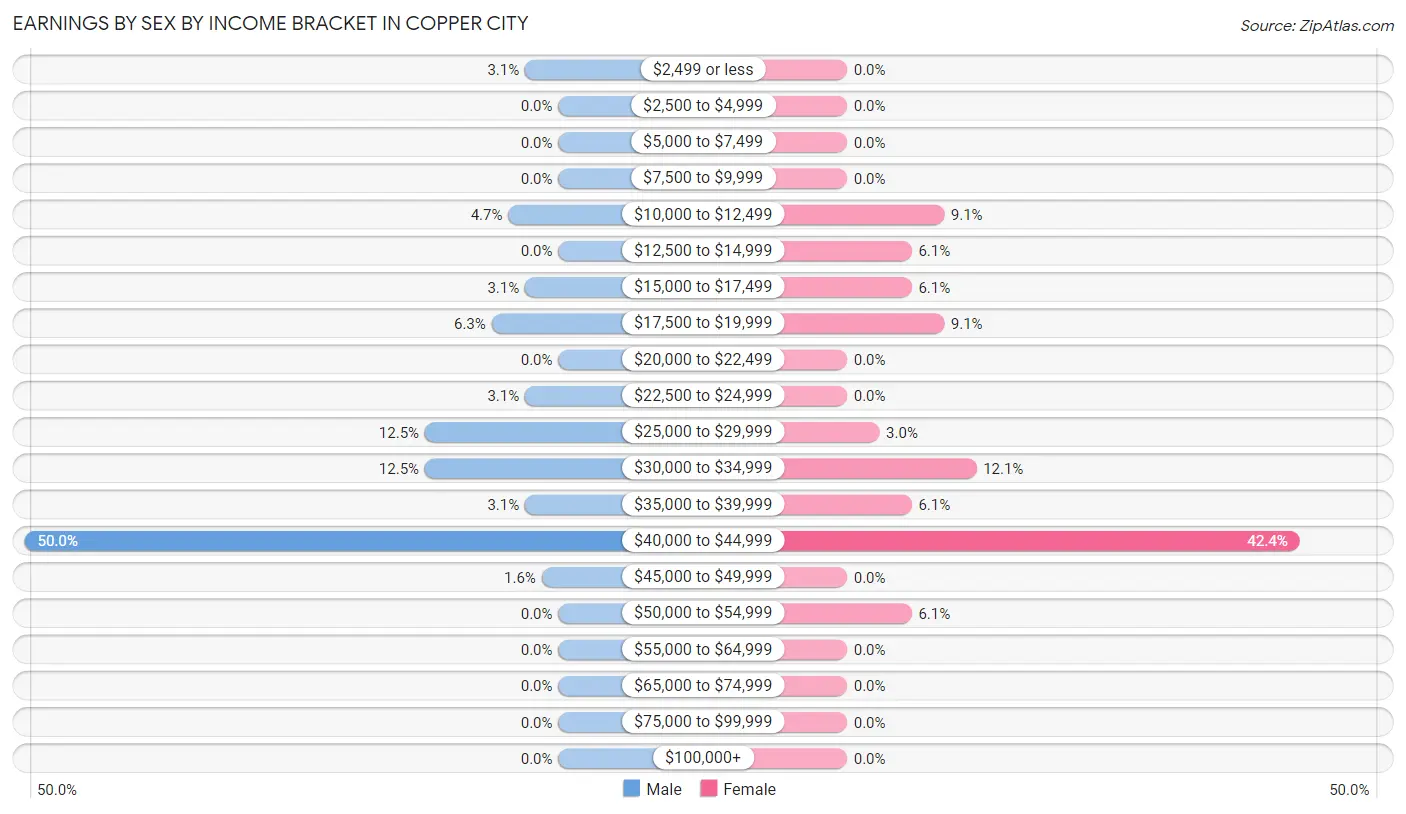
Earnings by Sex by Income Bracket in Copper City
The most common earnings brackets in Copper City are $40,000 to $44,999 for men (32 | 50.0%) and $40,000 to $44,999 for women (14 | 42.4%).
| Income | Male | Female |
| $2,499 or less | 2 (3.1%) | 0 (0.0%) |
| $2,500 to $4,999 | 0 (0.0%) | 0 (0.0%) |
| $5,000 to $7,499 | 0 (0.0%) | 0 (0.0%) |
| $7,500 to $9,999 | 0 (0.0%) | 0 (0.0%) |
| $10,000 to $12,499 | 3 (4.7%) | 3 (9.1%) |
| $12,500 to $14,999 | 0 (0.0%) | 2 (6.1%) |
| $15,000 to $17,499 | 2 (3.1%) | 2 (6.1%) |
| $17,500 to $19,999 | 4 (6.2%) | 3 (9.1%) |
| $20,000 to $22,499 | 0 (0.0%) | 0 (0.0%) |
| $22,500 to $24,999 | 2 (3.1%) | 0 (0.0%) |
| $25,000 to $29,999 | 8 (12.5%) | 1 (3.0%) |
| $30,000 to $34,999 | 8 (12.5%) | 4 (12.1%) |
| $35,000 to $39,999 | 2 (3.1%) | 2 (6.1%) |
| $40,000 to $44,999 | 32 (50.0%) | 14 (42.4%) |
| $45,000 to $49,999 | 1 (1.6%) | 0 (0.0%) |
| $50,000 to $54,999 | 0 (0.0%) | 2 (6.1%) |
| $55,000 to $64,999 | 0 (0.0%) | 0 (0.0%) |
| $65,000 to $74,999 | 0 (0.0%) | 0 (0.0%) |
| $75,000 to $99,999 | 0 (0.0%) | 0 (0.0%) |
| $100,000+ | 0 (0.0%) | 0 (0.0%) |
| Total | 64 (100.0%) | 33 (100.0%) |
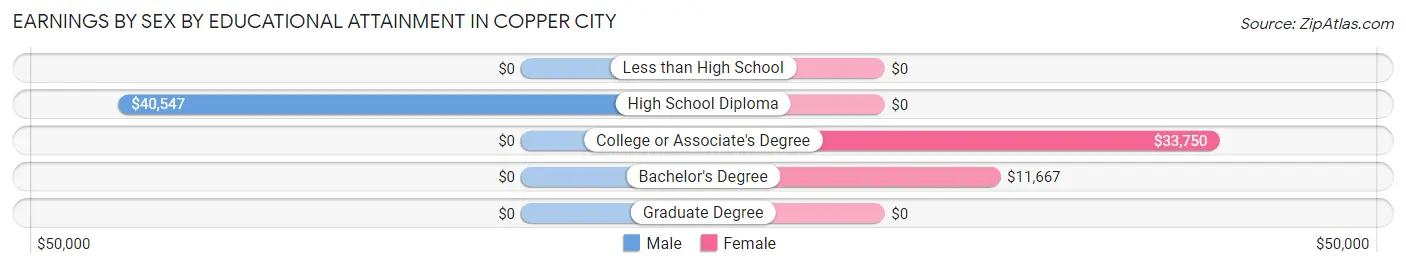
Earnings by Sex by Educational Attainment in Copper City
Average earnings in Copper City are $40,273 for men and $42,679 for women, a difference of 5.6%. Men with an educational attainment of high school diploma enjoy the highest average annual earnings of $40,547, while those with high school diploma education earn the least with $40,547. Women with an educational attainment of college or associate's degree earn the most with the average annual earnings of $33,750, while those with bachelor's degree education have the smallest earnings of $11,667.
| Educational Attainment | Male Income | Female Income |
| Less than High School | - | - |
| High School Diploma | $40,547 | $0 |
| College or Associate's Degree | - | - |
| Bachelor's Degree | - | - |
| Graduate Degree | - | - |
| Total | $40,273 | $42,679 |
Family Income in Copper City
Family Income Brackets in Copper City
According to the Copper City family income data, there are 16 families falling into the $75,000 to $99,999 income range, which is the most common income bracket and makes up 27.6% of all families.
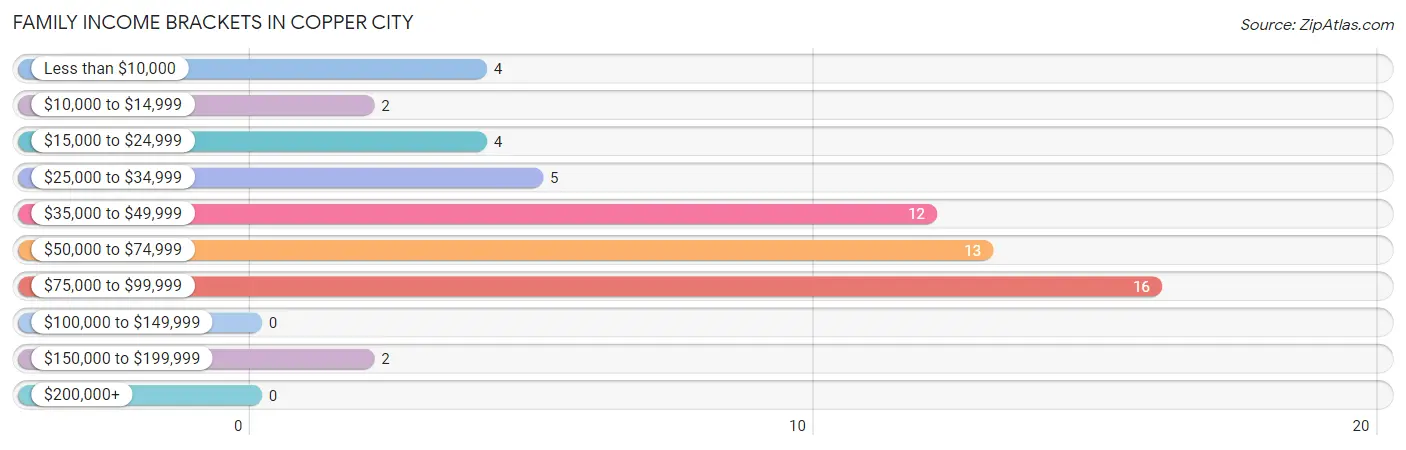
| Income Bracket | # Families | % Families |
| Less than $10,000 | 4 | 6.9% |
| $10,000 to $14,999 | 2 | 3.4% |
| $15,000 to $24,999 | 4 | 6.9% |
| $25,000 to $34,999 | 5 | 8.6% |
| $35,000 to $49,999 | 12 | 20.7% |
| $50,000 to $74,999 | 13 | 22.4% |
| $75,000 to $99,999 | 16 | 27.6% |
| $100,000 to $149,999 | 0 | 0.0% |
| $150,000 to $199,999 | 2 | 3.4% |
| $200,000+ | 0 | 0.0% |
Family Income by Famaliy Size in Copper City
2-person families (26 | 44.8%) account for the highest median family income in Copper City with $45,000 per family, while 2-person families (26 | 44.8%) have the highest median income of $22,500 per family member.
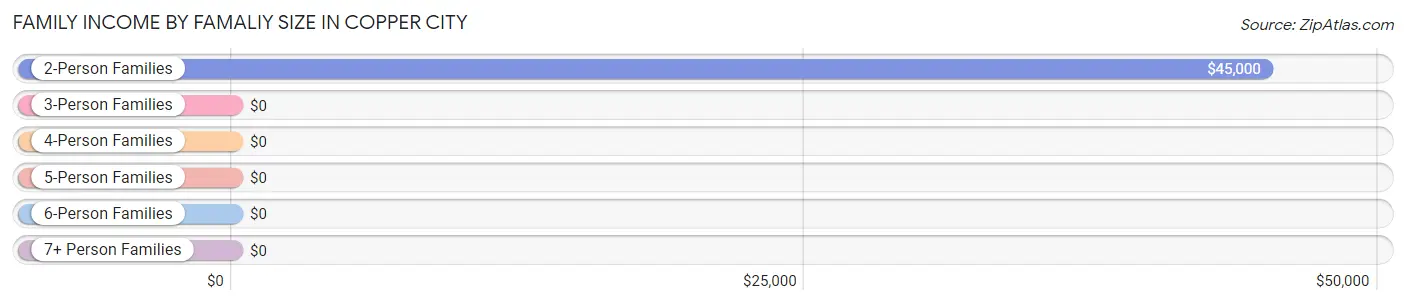
| Income Bracket | # Families | Median Income |
| 2-Person Families | 26 (44.8%) | $45,000 |
| 3-Person Families | 24 (41.4%) | $0 |
| 4-Person Families | 4 (6.9%) | $0 |
| 5-Person Families | 4 (6.9%) | $0 |
| 6-Person Families | 0 (0.0%) | $0 |
| 7+ Person Families | 0 (0.0%) | $0 |
| Total | 58 (100.0%) | $53,750 |
Family Income by Number of Earners in Copper City
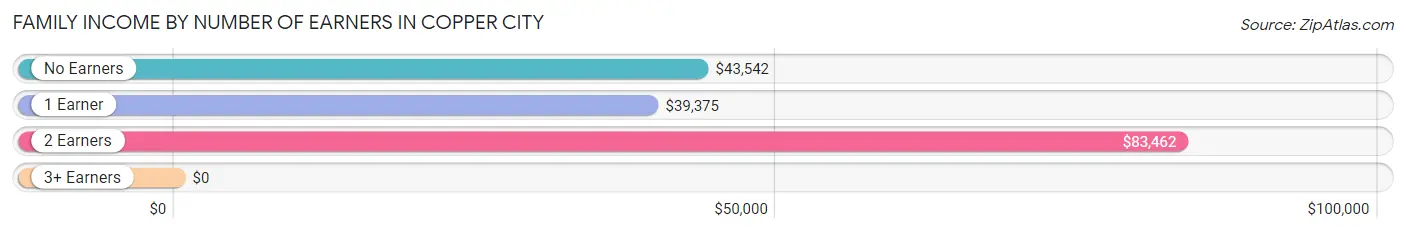
| Number of Earners | # Families | Median Income |
| No Earners | 25 (43.1%) | $43,542 |
| 1 Earner | 13 (22.4%) | $39,375 |
| 2 Earners | 18 (31.0%) | $83,462 |
| 3+ Earners | 2 (3.5%) | $0 |
| Total | 58 (100.0%) | $53,750 |
Household Income in Copper City
Household Income Brackets in Copper City
With 18 households falling in the category, the $50,000 to $74,999 income range is the most frequent in Copper City, accounting for 23.1% of all households.
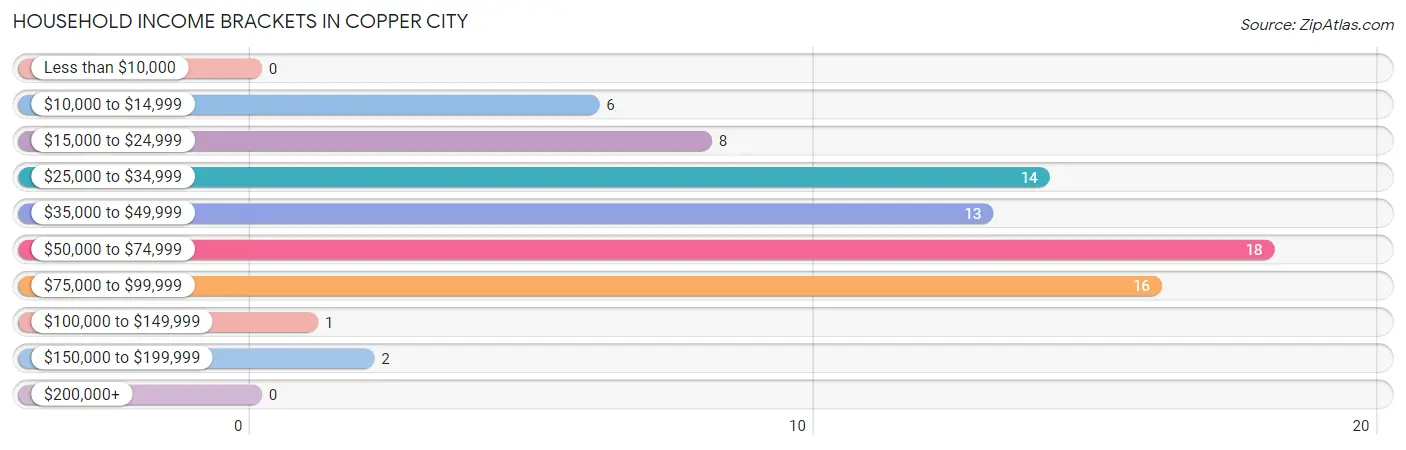
| Income Bracket | # Households | % Households |
| Less than $10,000 | 0 | 0.0% |
| $10,000 to $14,999 | 6 | 7.7% |
| $15,000 to $24,999 | 8 | 10.3% |
| $25,000 to $34,999 | 14 | 17.9% |
| $35,000 to $49,999 | 13 | 16.7% |
| $50,000 to $74,999 | 18 | 23.1% |
| $75,000 to $99,999 | 16 | 20.5% |
| $100,000 to $149,999 | 1 | 1.3% |
| $150,000 to $199,999 | 2 | 2.6% |
| $200,000+ | 0 | 0.0% |
Household Income by Householder Age in Copper City
The median household income in Copper City is $48,333, with the highest median household income of $82,788 found in the 45 to 64 years age bracket for the primary householder. A total of 31 households (39.7%) fall into this category. Meanwhile, the 15 to 24 years age bracket for the primary householder has the lowest median household income of $0, with 2 households (2.6%) in this group.
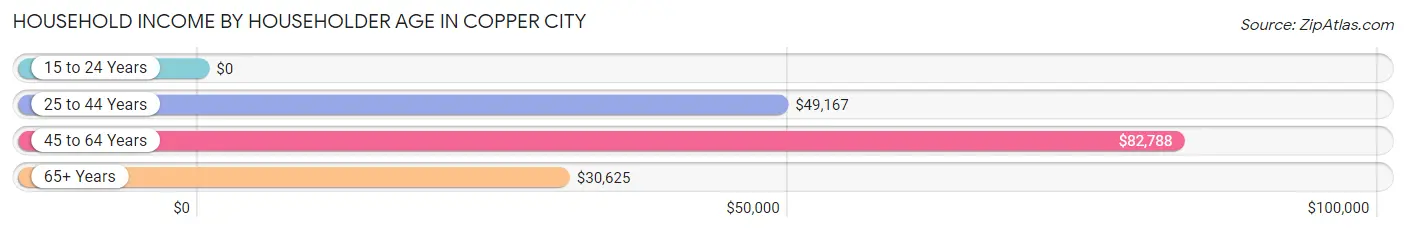
| Income Bracket | # Households | Median Income |
| 15 to 24 Years | 2 (2.6%) | $0 |
| 25 to 44 Years | 20 (25.6%) | $49,167 |
| 45 to 64 Years | 31 (39.7%) | $82,788 |
| 65+ Years | 25 (32.1%) | $30,625 |
| Total | 78 (100.0%) | $48,333 |
Poverty in Copper City
Income Below Poverty by Sex and Age in Copper City
With 10.4% poverty level for males and 18.7% for females among the residents of Copper City, 6 to 11 year old males and 16 and 17 year old females are the most vulnerable to poverty, with 5 males (100.0%) and 2 females (100.0%) in their respective age groups living below the poverty level.
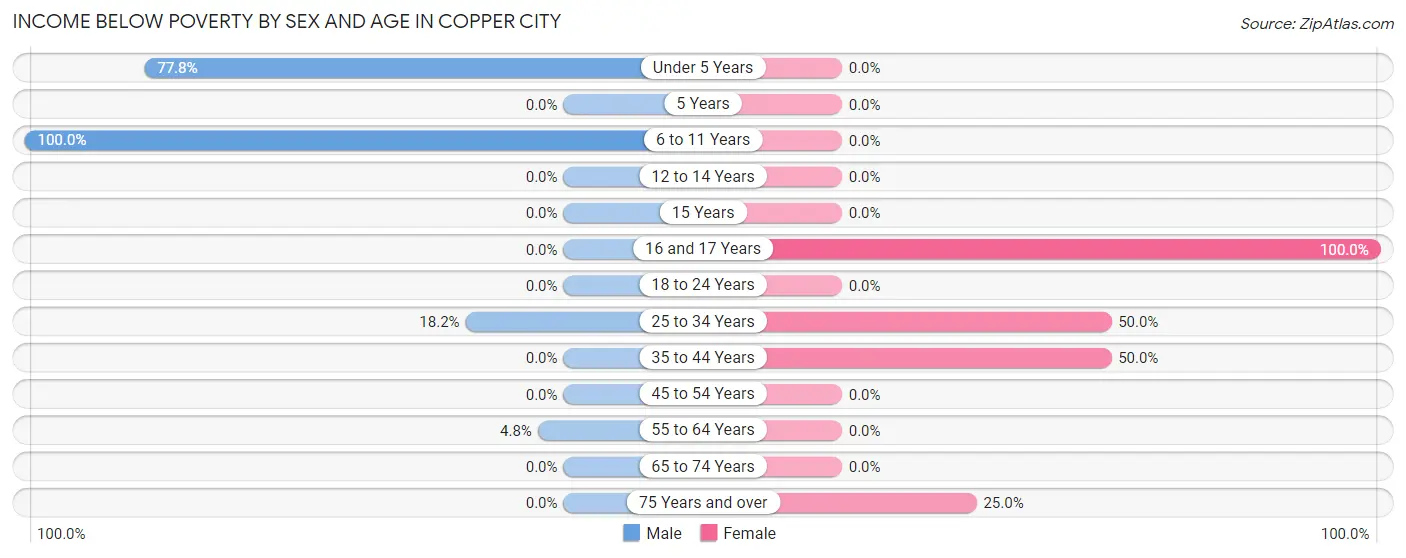
| Age Bracket | Male | Female |
| Under 5 Years | 7 (77.8%) | 0 (0.0%) |
| 5 Years | 0 (0.0%) | 0 (0.0%) |
| 6 to 11 Years | 5 (100.0%) | 0 (0.0%) |
| 12 to 14 Years | 0 (0.0%) | 0 (0.0%) |
| 15 Years | 0 (0.0%) | 0 (0.0%) |
| 16 and 17 Years | 0 (0.0%) | 2 (100.0%) |
| 18 to 24 Years | 0 (0.0%) | 0 (0.0%) |
| 25 to 34 Years | 2 (18.2%) | 6 (50.0%) |
| 35 to 44 Years | 0 (0.0%) | 4 (50.0%) |
| 45 to 54 Years | 0 (0.0%) | 0 (0.0%) |
| 55 to 64 Years | 2 (4.8%) | 0 (0.0%) |
| 65 to 74 Years | 0 (0.0%) | 0 (0.0%) |
| 75 Years and over | 0 (0.0%) | 2 (25.0%) |
| Total | 16 (10.4%) | 14 (18.7%) |
Income Above Poverty by Sex and Age in Copper City
According to the poverty statistics in Copper City, males aged 12 to 14 years and females aged under 5 years are the age groups that are most secure financially, with 100.0% of males and 100.0% of females in these age groups living above the poverty line.
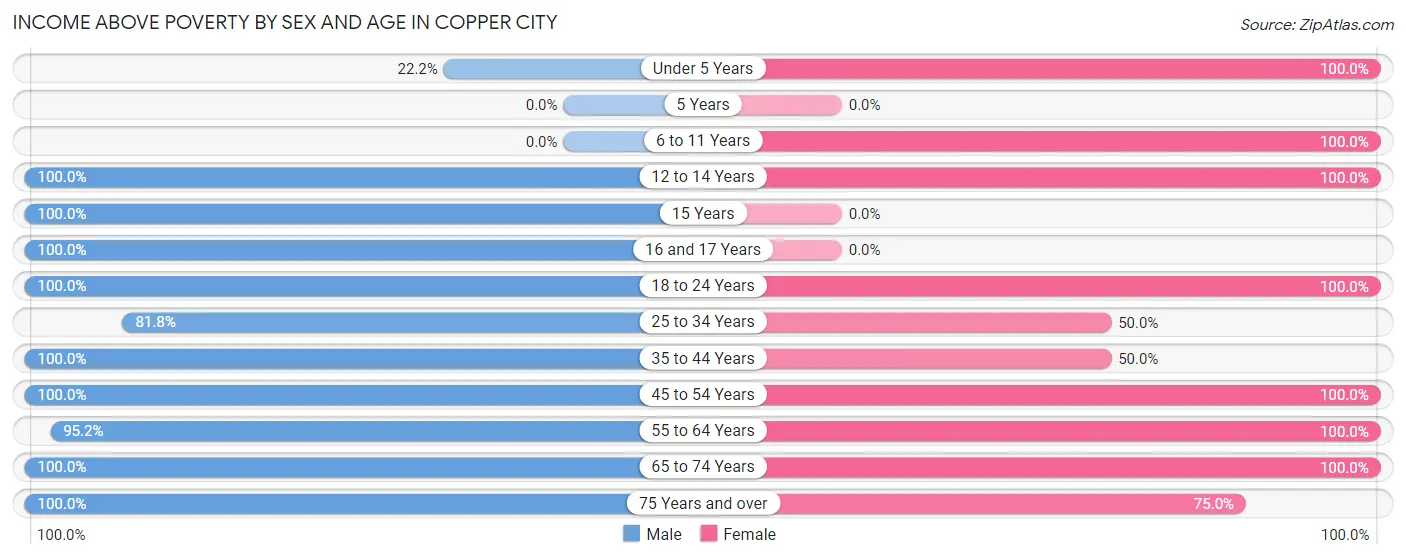
| Age Bracket | Male | Female |
| Under 5 Years | 2 (22.2%) | 2 (100.0%) |
| 5 Years | 0 (0.0%) | 0 (0.0%) |
| 6 to 11 Years | 0 (0.0%) | 3 (100.0%) |
| 12 to 14 Years | 33 (100.0%) | 3 (100.0%) |
| 15 Years | 4 (100.0%) | 0 (0.0%) |
| 16 and 17 Years | 3 (100.0%) | 0 (0.0%) |
| 18 to 24 Years | 8 (100.0%) | 3 (100.0%) |
| 25 to 34 Years | 9 (81.8%) | 6 (50.0%) |
| 35 to 44 Years | 7 (100.0%) | 4 (50.0%) |
| 45 to 54 Years | 5 (100.0%) | 15 (100.0%) |
| 55 to 64 Years | 40 (95.2%) | 12 (100.0%) |
| 65 to 74 Years | 21 (100.0%) | 7 (100.0%) |
| 75 Years and over | 6 (100.0%) | 6 (75.0%) |
| Total | 138 (89.6%) | 61 (81.3%) |
Income Below Poverty Among Married-Couple Families in Copper City
The poverty statistics for married-couple families in Copper City show that 5.3% or 2 of the total 38 families live below the poverty line. Families with 1 or 2 children have the highest poverty rate of 10.5%, comprising of 2 families. On the other hand, families with no children have the lowest poverty rate of 0.0%, which includes 0 families.
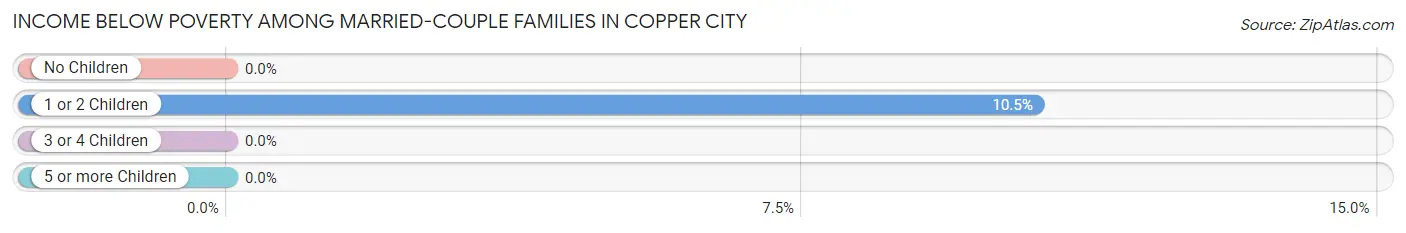
| Children | Above Poverty | Below Poverty |
| No Children | 17 (100.0%) | 0 (0.0%) |
| 1 or 2 Children | 17 (89.5%) | 2 (10.5%) |
| 3 or 4 Children | 2 (100.0%) | 0 (0.0%) |
| 5 or more Children | 0 (0.0%) | 0 (0.0%) |
| Total | 36 (94.7%) | 2 (5.3%) |
Income Below Poverty Among Single-Parent Households in Copper City
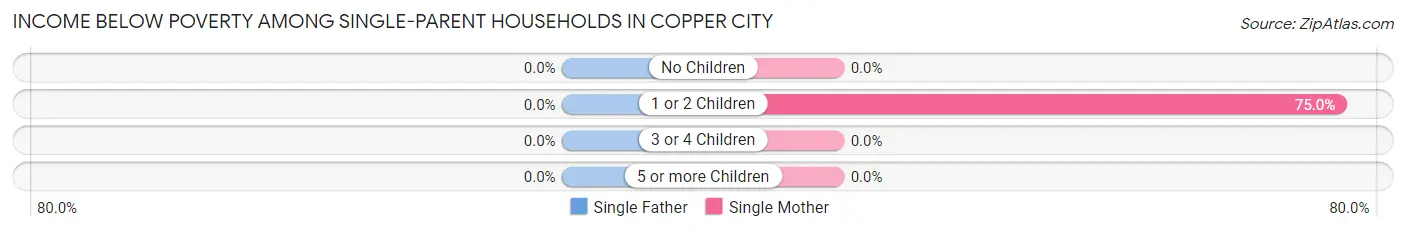
| Children | Single Father | Single Mother |
| No Children | 0 (0.0%) | 0 (0.0%) |
| 1 or 2 Children | 0 (0.0%) | 6 (75.0%) |
| 3 or 4 Children | 0 (0.0%) | 0 (0.0%) |
| 5 or more Children | 0 (0.0%) | 0 (0.0%) |
| Total | 0 (0.0%) | 6 (50.0%) |
Income Below Poverty Among Married-Couple vs Single-Parent Households in Copper City
The poverty data for Copper City shows that 2 of the married-couple family households (5.3%) and 6 of the single-parent households (30.0%) are living below the poverty level. Within the married-couple family households, those with 1 or 2 children have the highest poverty rate, with 2 households (10.5%) falling below the poverty line. Among the single-parent households, those with 1 or 2 children have the highest poverty rate, with 6 household (54.5%) living below poverty.
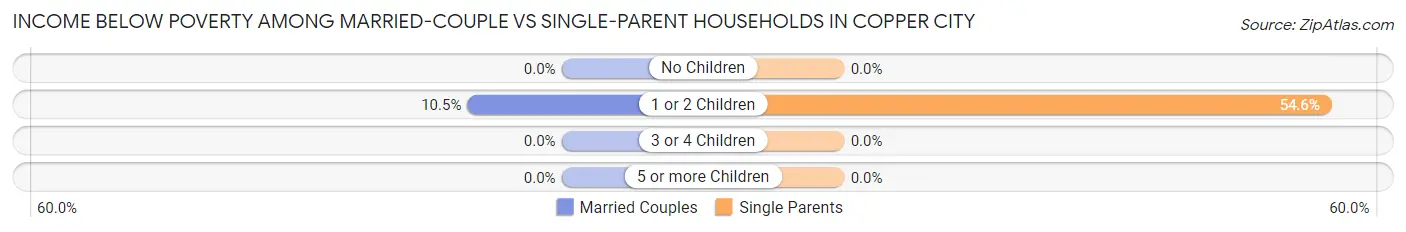
| Children | Married-Couple Families | Single-Parent Households |
| No Children | 0 (0.0%) | 0 (0.0%) |
| 1 or 2 Children | 2 (10.5%) | 6 (54.5%) |
| 3 or 4 Children | 0 (0.0%) | 0 (0.0%) |
| 5 or more Children | 0 (0.0%) | 0 (0.0%) |
| Total | 2 (5.3%) | 6 (30.0%) |
Race in Copper City
The most populous races in Copper City are White / Caucasian (221 | 96.5%), Two or more Races (6 | 2.6%), and Asian (2 | 0.9%).
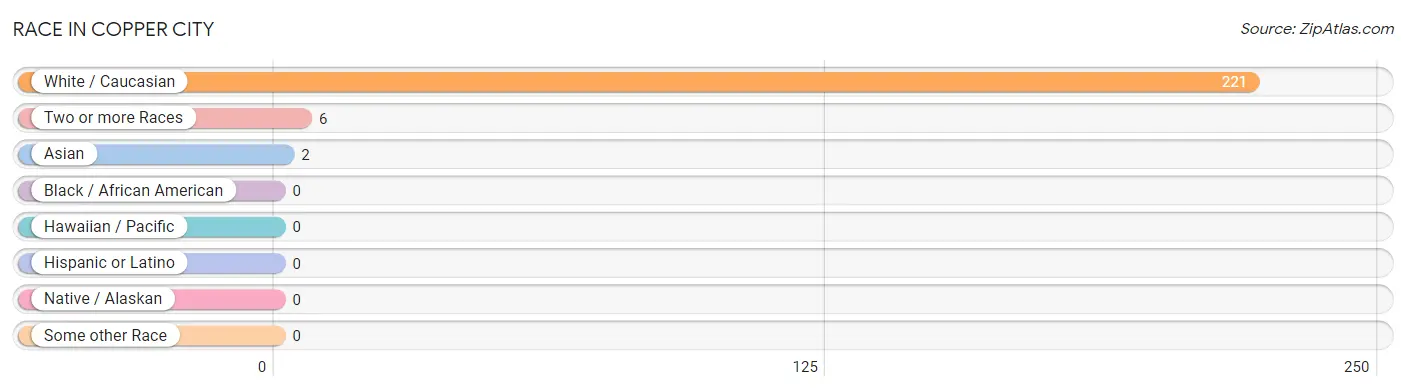
| Race | # Population | % Population |
| Asian | 2 | 0.9% |
| Black / African American | 0 | 0.0% |
| Hawaiian / Pacific | 0 | 0.0% |
| Hispanic or Latino | 0 | 0.0% |
| Native / Alaskan | 0 | 0.0% |
| White / Caucasian | 221 | 96.5% |
| Two or more Races | 6 | 2.6% |
| Some other Race | 0 | 0.0% |
| Total | 229 | 100.0% |
Ancestry in Copper City
The most populous ancestries reported in Copper City are German (100 | 43.7%), Croatian (76 | 33.2%), Finnish (55 | 24.0%), French (33 | 14.4%), and English (20 | 8.7%), together accounting for 124.0% of all Copper City residents.
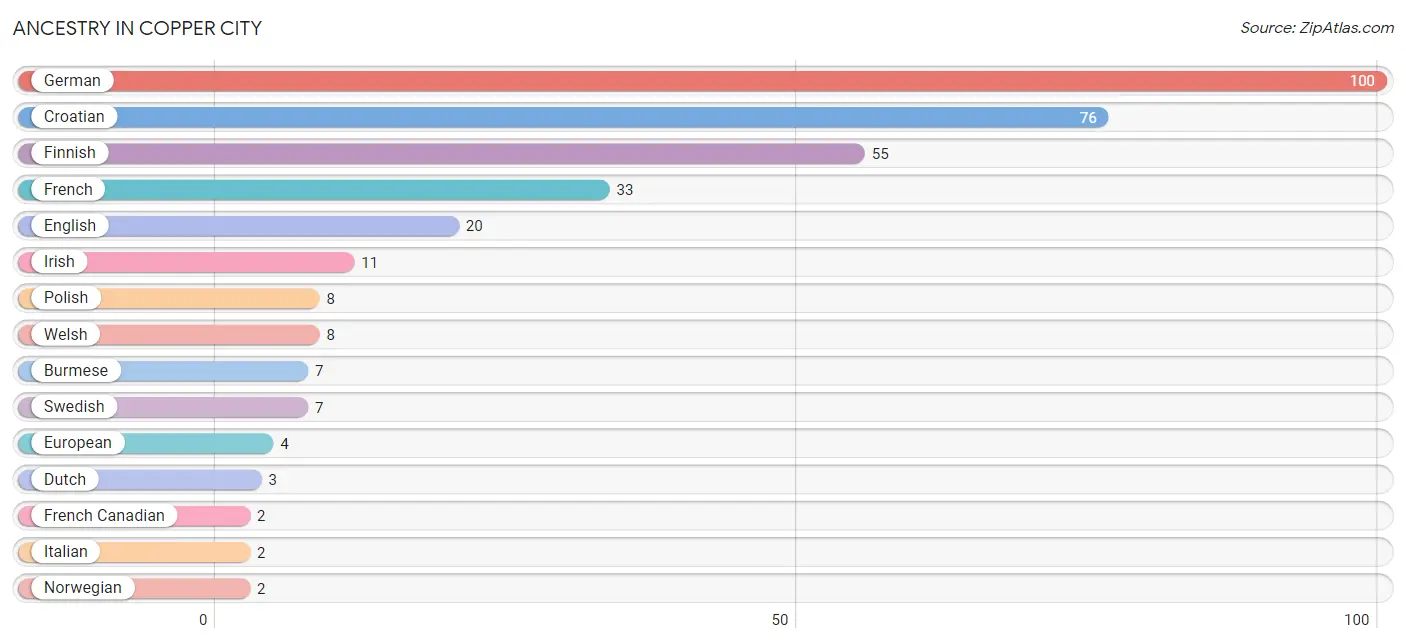
| Ancestry | # Population | % Population |
| Burmese | 7 | 3.1% |
| Croatian | 76 | 33.2% |
| Dutch | 3 | 1.3% |
| English | 20 | 8.7% |
| European | 4 | 1.8% |
| Finnish | 55 | 24.0% |
| French | 33 | 14.4% |
| French Canadian | 2 | 0.9% |
| German | 100 | 43.7% |
| Irish | 11 | 4.8% |
| Italian | 2 | 0.9% |
| Norwegian | 2 | 0.9% |
| Polish | 8 | 3.5% |
| Swedish | 7 | 3.1% |
| Welsh | 8 | 3.5% | View All 15 Rows |
Immigrants in Copper City
The most numerous immigrant groups reported in Copper City came from Asia (2 | 0.9%), Eastern Asia (2 | 0.9%), and Korea (2 | 0.9%), together accounting for 2.6% of all Copper City residents.
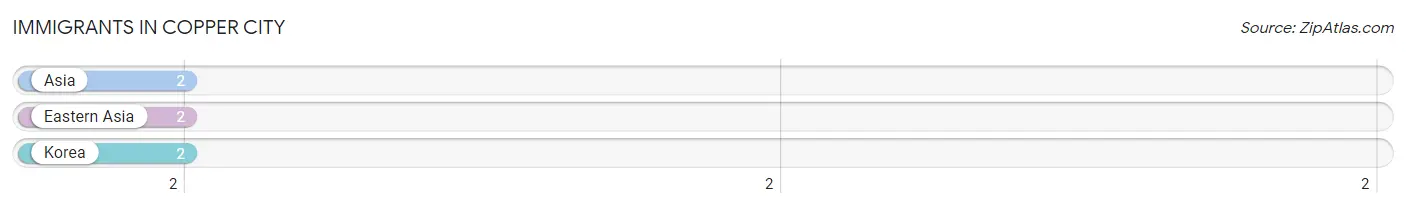
| Immigration Origin | # Population | % Population |
| Asia | 2 | 0.9% |
| Eastern Asia | 2 | 0.9% |
| Korea | 2 | 0.9% | View All 3 Rows |
Sex and Age in Copper City
Sex and Age in Copper City
The most populous age groups in Copper City are 55 to 59 Years (38 | 24.7%) for men and 45 to 49 Years (13 | 17.3%) for women.
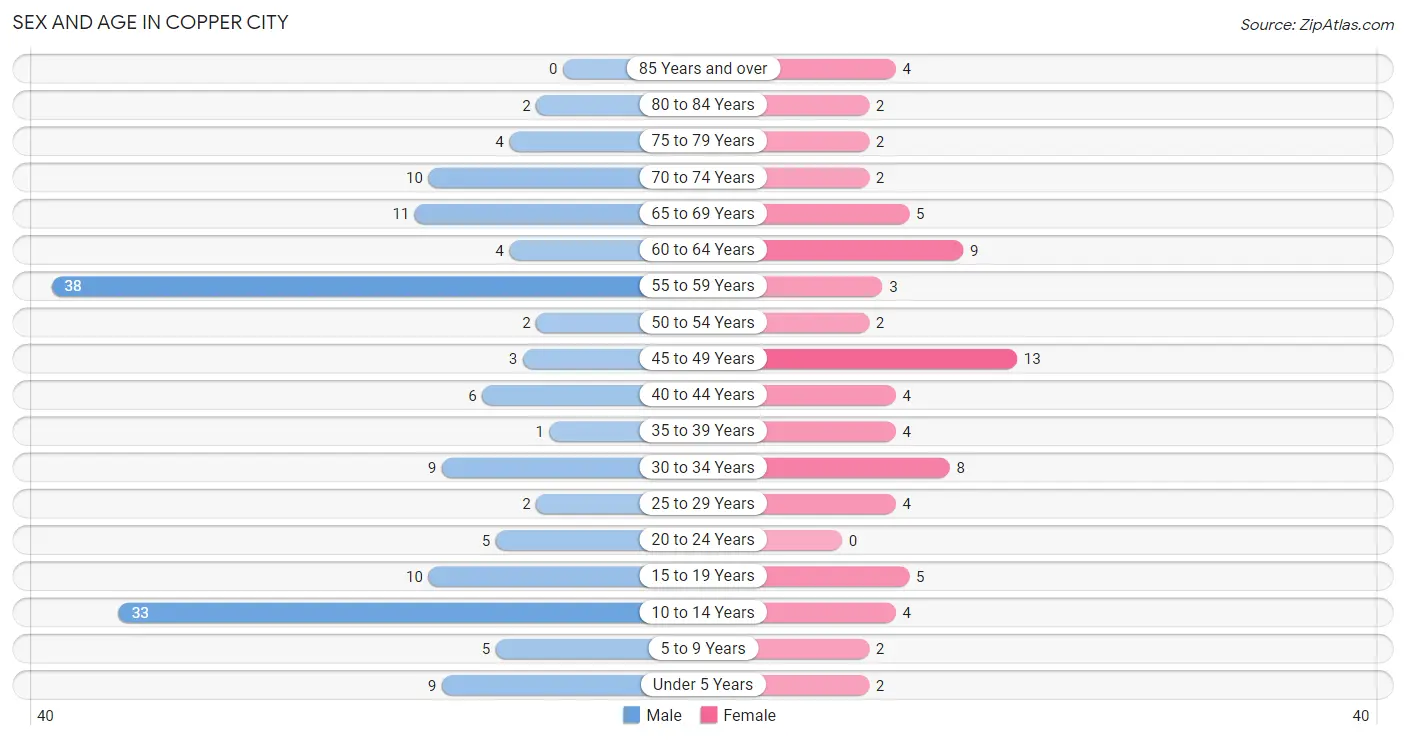
| Age Bracket | Male | Female |
| Under 5 Years | 9 (5.8%) | 2 (2.7%) |
| 5 to 9 Years | 5 (3.3%) | 2 (2.7%) |
| 10 to 14 Years | 33 (21.4%) | 4 (5.3%) |
| 15 to 19 Years | 10 (6.5%) | 5 (6.7%) |
| 20 to 24 Years | 5 (3.3%) | 0 (0.0%) |
| 25 to 29 Years | 2 (1.3%) | 4 (5.3%) |
| 30 to 34 Years | 9 (5.8%) | 8 (10.7%) |
| 35 to 39 Years | 1 (0.6%) | 4 (5.3%) |
| 40 to 44 Years | 6 (3.9%) | 4 (5.3%) |
| 45 to 49 Years | 3 (1.9%) | 13 (17.3%) |
| 50 to 54 Years | 2 (1.3%) | 2 (2.7%) |
| 55 to 59 Years | 38 (24.7%) | 3 (4.0%) |
| 60 to 64 Years | 4 (2.6%) | 9 (12.0%) |
| 65 to 69 Years | 11 (7.1%) | 5 (6.7%) |
| 70 to 74 Years | 10 (6.5%) | 2 (2.7%) |
| 75 to 79 Years | 4 (2.6%) | 2 (2.7%) |
| 80 to 84 Years | 2 (1.3%) | 2 (2.7%) |
| 85 Years and over | 0 (0.0%) | 4 (5.3%) |
| Total | 154 (100.0%) | 75 (100.0%) |
Families and Households in Copper City
Median Family Size in Copper City
The median family size in Copper City is 3.41 persons per family, with married-couple families (38 | 65.5%) accounting for the largest median family size of 3.84 persons per family. On the other hand, single male/father families (8 | 13.8%) represent the smallest median family size with 2.50 persons per family.
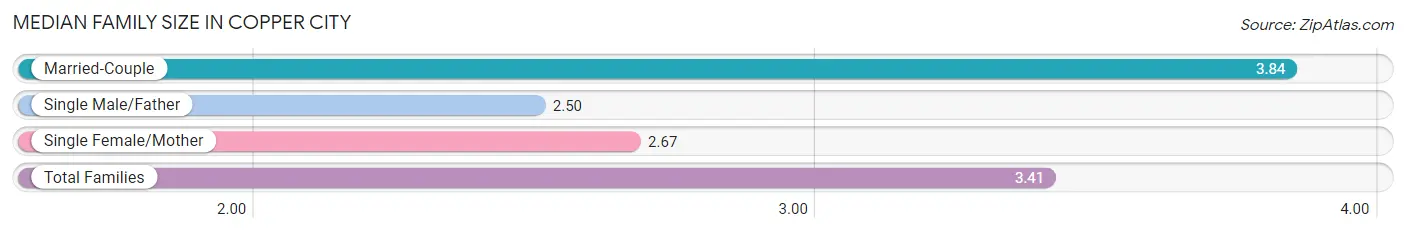
| Family Type | # Families | Family Size |
| Married-Couple | 38 (65.5%) | 3.84 |
| Single Male/Father | 8 (13.8%) | 2.50 |
| Single Female/Mother | 12 (20.7%) | 2.67 |
| Total Families | 58 (100.0%) | 3.41 |
Median Household Size in Copper City
The median household size in Copper City is 2.94 persons per household, with married-couple households (38 | 48.7%) accounting for the largest median household size of 3.84 persons per household. non-family households (20 | 25.6%) represent the smallest median household size with 1.15 persons per household.
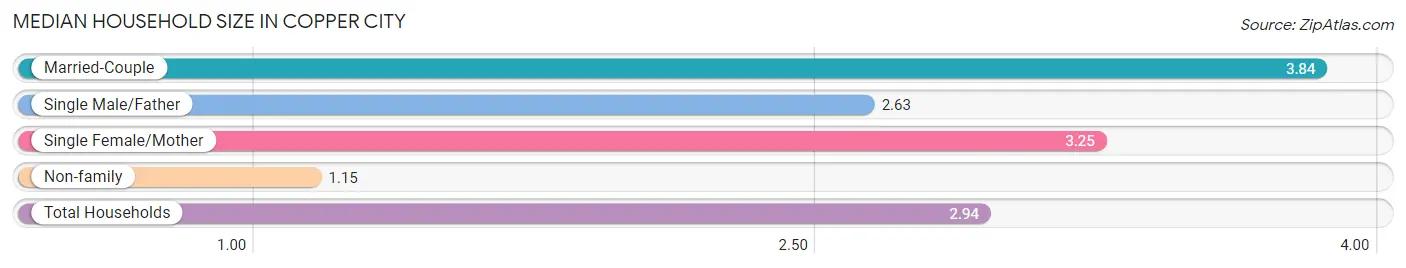
| Household Type | # Households | Household Size |
| Married-Couple | 38 (48.7%) | 3.84 |
| Single Male/Father | 8 (10.3%) | 2.63 |
| Single Female/Mother | 12 (15.4%) | 3.25 |
| Non-family | 20 (25.6%) | 1.15 |
| Total Households | 78 (100.0%) | 2.94 |
Household Size by Marriage Status in Copper City
Out of a total of 78 households in Copper City, 58 (74.4%) are family households, while 20 (25.6%) are nonfamily households. The most numerous type of family households are 2-person households, comprising 26, and the most common type of nonfamily households are 1-person households, comprising 16.
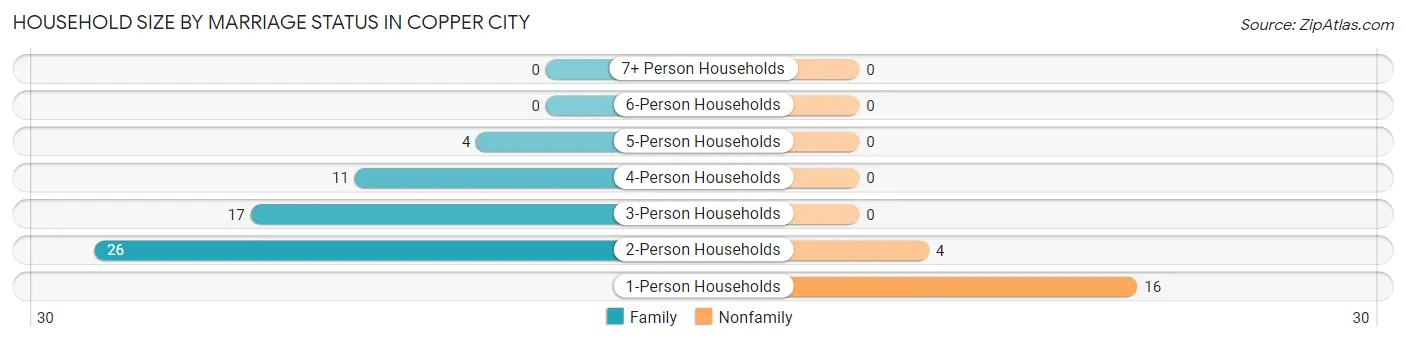
| Household Size | Family Households | Nonfamily Households |
| 1-Person Households | - | 16 (20.5%) |
| 2-Person Households | 26 (33.3%) | 4 (5.1%) |
| 3-Person Households | 17 (21.8%) | 0 (0.0%) |
| 4-Person Households | 11 (14.1%) | 0 (0.0%) |
| 5-Person Households | 4 (5.1%) | 0 (0.0%) |
| 6-Person Households | 0 (0.0%) | 0 (0.0%) |
| 7+ Person Households | 0 (0.0%) | 0 (0.0%) |
| Total | 58 (74.4%) | 20 (25.6%) |
Female Fertility in Copper City
Fertility by Age in Copper City
| Age Bracket | Women with Births | Births / 1,000 Women |
| 15 to 19 years | 0 (0.0%) | 0.0 |
| 20 to 34 years | 0 (0.0%) | 0.0 |
| 35 to 50 years | 0 (0.0%) | 0.0 |
| Total | 0 (0.0%) | 0.0 |
Fertility by Age by Marriage Status in Copper City
| Age Bracket | Married | Unmarried |
| 15 to 19 years | 0 (0.0%) | 0 (0.0%) |
| 20 to 34 years | 0 (0.0%) | 0 (0.0%) |
| 35 to 50 years | 0 (0.0%) | 0 (0.0%) |
| Total | 0 (0.0%) | 0 (0.0%) |
Fertility by Education in Copper City
| Educational Attainment | Women with Births | Births / 1,000 Women |
| Less than High School | 0 (0.0%) | 0.0 |
| High School Diploma | 0 (0.0%) | 0.0 |
| College or Associate's Degree | 0 (0.0%) | 0.0 |
| Bachelor's Degree | 0 (0.0%) | 0.0 |
| Graduate Degree | 0 (0.0%) | 0.0 |
| Total | 0 (0.0%) | 0.0 |
Fertility by Education by Marriage Status in Copper City
| Educational Attainment | Married | Unmarried |
| Less than High School | 0 (0.0%) | 0 (0.0%) |
| High School Diploma | 0 (0.0%) | 0 (0.0%) |
| College or Associate's Degree | 0 (0.0%) | 0 (0.0%) |
| Bachelor's Degree | 0 (0.0%) | 0 (0.0%) |
| Graduate Degree | 0 (0.0%) | 0 (0.0%) |
| Total | 0 (0.0%) | 0 (0.0%) |
Employment Characteristics in Copper City
Employment by Class of Employer in Copper City
Among the 62 employed individuals in Copper City, private company employees (43 | 69.4%), not-for-profit organizations (9 | 14.5%), and self-employed (incorporated) (5 | 8.1%) make up the most common classes of employment.
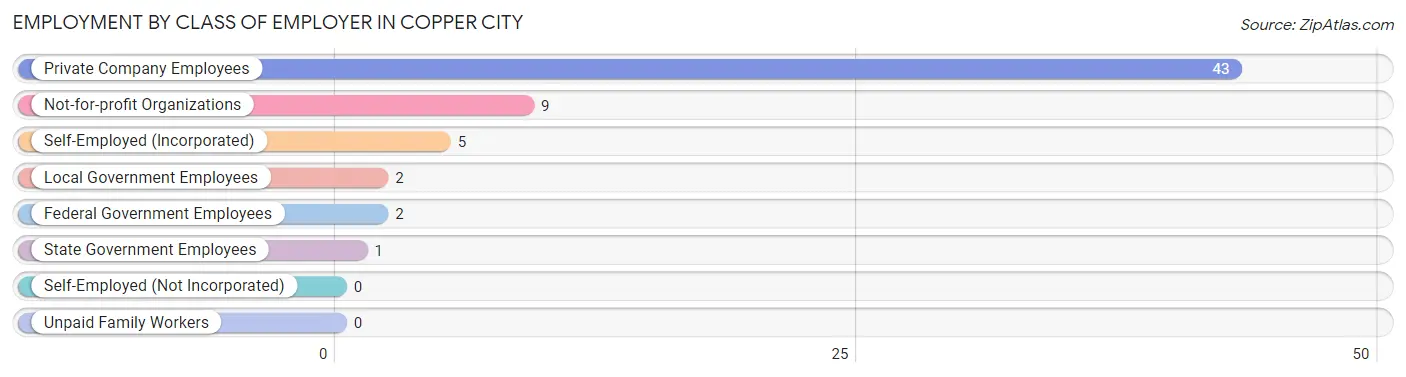
| Employer Class | # Employees | % Employees |
| Private Company Employees | 43 | 69.4% |
| Self-Employed (Incorporated) | 5 | 8.1% |
| Self-Employed (Not Incorporated) | 0 | 0.0% |
| Not-for-profit Organizations | 9 | 14.5% |
| Local Government Employees | 2 | 3.2% |
| State Government Employees | 1 | 1.6% |
| Federal Government Employees | 2 | 3.2% |
| Unpaid Family Workers | 0 | 0.0% |
| Total | 62 | 100.0% |
Employment Status by Age in Copper City
According to the labor force statistics for Copper City, out of the total population over 16 years of age (170), 57.1% or 97 individuals are in the labor force, with 33.0% or 32 of them unemployed. The age group with the highest labor force participation rate is 20 to 24 years, with 100.0% or 5 individuals in the labor force. Within the labor force, the 55 to 59 years age range has the highest percentage of unemployed individuals, with 94.1% or 32 of them being unemployed.
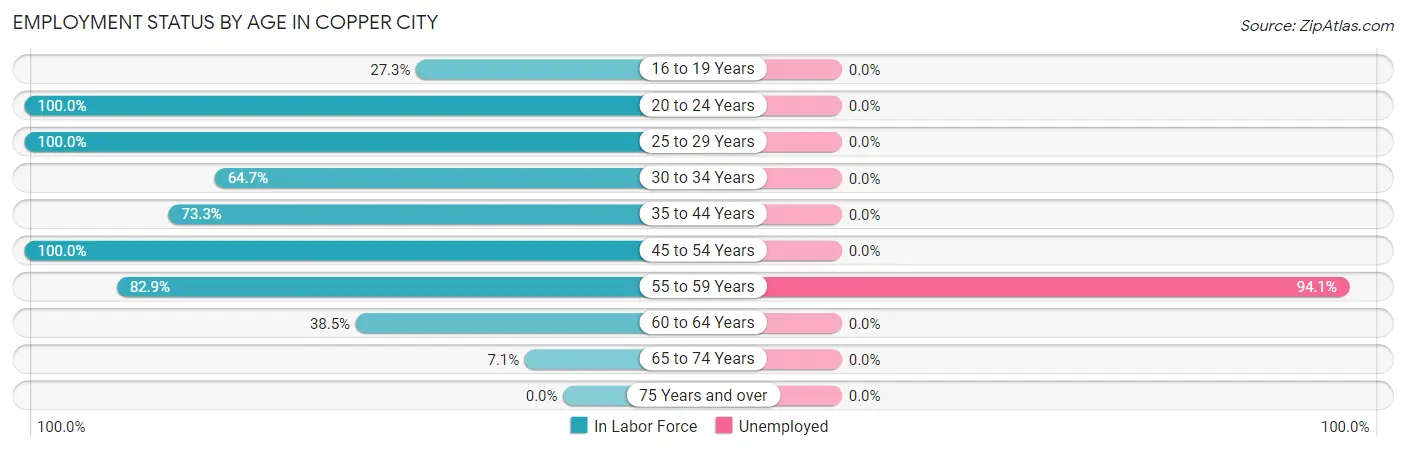
| Age Bracket | In Labor Force | Unemployed |
| 16 to 19 Years | 3 (27.3%) | 0 (0.0%) |
| 20 to 24 Years | 5 (100.0%) | 0 (0.0%) |
| 25 to 29 Years | 6 (100.0%) | 0 (0.0%) |
| 30 to 34 Years | 11 (64.7%) | 0 (0.0%) |
| 35 to 44 Years | 11 (73.3%) | 0 (0.0%) |
| 45 to 54 Years | 20 (100.0%) | 0 (0.0%) |
| 55 to 59 Years | 34 (82.9%) | 32 (94.1%) |
| 60 to 64 Years | 5 (38.5%) | 0 (0.0%) |
| 65 to 74 Years | 2 (7.1%) | 0 (0.0%) |
| 75 Years and over | 0 (0.0%) | 0 (0.0%) |
| Total | 97 (57.1%) | 32 (33.0%) |
Employment Status by Educational Attainment in Copper City
According to labor force statistics for Copper City, 77.7% of individuals (87) out of the total population between 25 and 64 years of age (112) are in the labor force, with 36.8% or 32 of them being unemployed. The group with the highest labor force participation rate are those with the educational attainment of bachelor's degree or higher, with 100.0% or 6 individuals in the labor force. Within the labor force, individuals with high school diploma education have the highest percentage of unemployment, with 60.4% or 32 of them being unemployed.
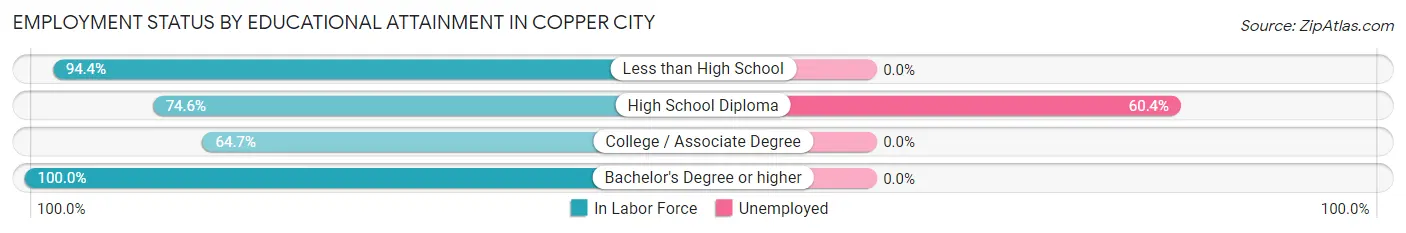
| Educational Attainment | In Labor Force | Unemployed |
| Less than High School | 17 (94.4%) | 0 (0.0%) |
| High School Diploma | 53 (74.6%) | 43 (60.4%) |
| College / Associate Degree | 11 (64.7%) | 0 (0.0%) |
| Bachelor's Degree or higher | 6 (100.0%) | 0 (0.0%) |
| Total | 87 (77.7%) | 41 (36.8%) |
Employment Occupations by Sex in Copper City
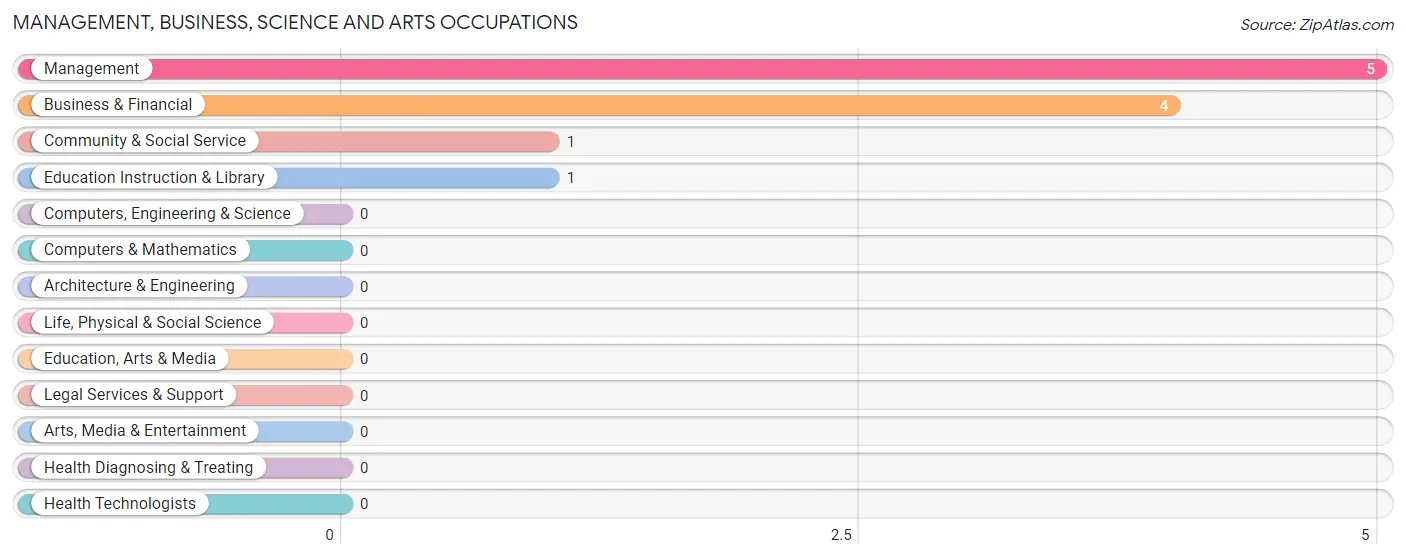
Management, Business, Science and Arts Occupations
The most common Management, Business, Science and Arts occupations in Copper City are Management (5 | 7.7%), Business & Financial (4 | 6.1%), Community & Social Service (1 | 1.5%), and Education Instruction & Library (1 | 1.5%).
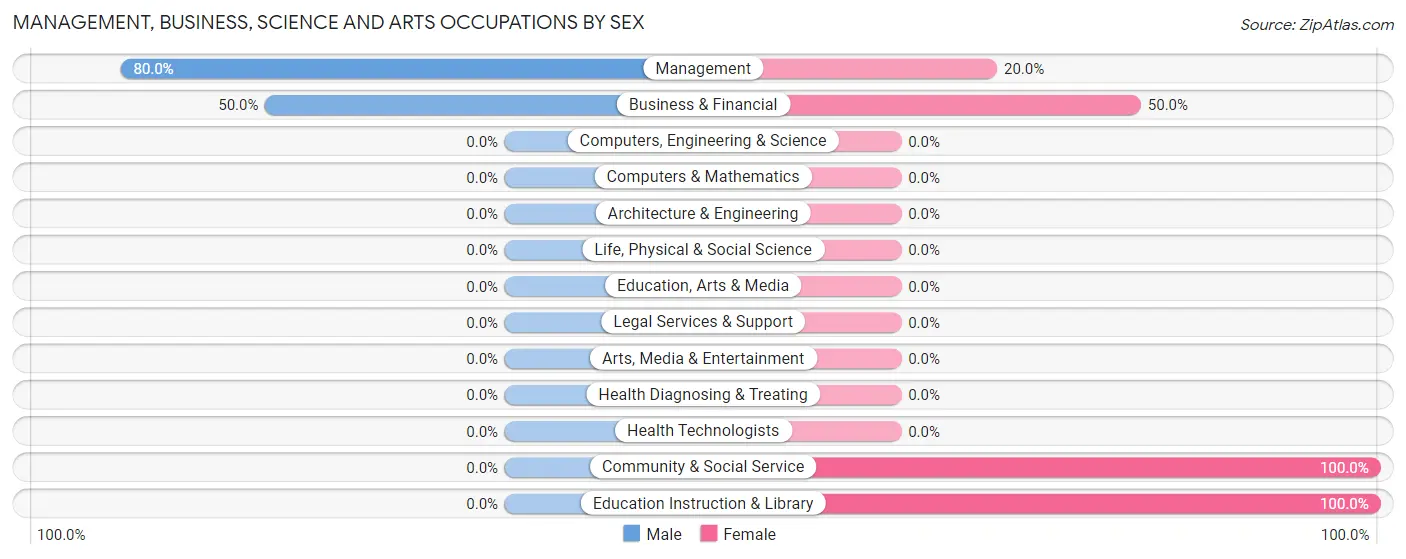
Management, Business, Science and Arts Occupations by Sex
Within the Management, Business, Science and Arts occupations in Copper City, the most male-oriented occupations are Management (80.0%), and Business & Financial (50.0%), while the most female-oriented occupations are Community & Social Service (100.0%), Education Instruction & Library (100.0%), and Business & Financial (50.0%).
| Occupation | Male | Female |
| Management | 4 (80.0%) | 1 (20.0%) |
| Business & Financial | 2 (50.0%) | 2 (50.0%) |
| Computers, Engineering & Science | 0 (0.0%) | 0 (0.0%) |
| Computers & Mathematics | 0 (0.0%) | 0 (0.0%) |
| Architecture & Engineering | 0 (0.0%) | 0 (0.0%) |
| Life, Physical & Social Science | 0 (0.0%) | 0 (0.0%) |
| Community & Social Service | 0 (0.0%) | 1 (100.0%) |
| Education, Arts & Media | 0 (0.0%) | 0 (0.0%) |
| Legal Services & Support | 0 (0.0%) | 0 (0.0%) |
| Education Instruction & Library | 0 (0.0%) | 1 (100.0%) |
| Arts, Media & Entertainment | 0 (0.0%) | 0 (0.0%) |
| Health Diagnosing & Treating | 0 (0.0%) | 0 (0.0%) |
| Health Technologists | 0 (0.0%) | 0 (0.0%) |
| Total (Category) | 6 (60.0%) | 4 (40.0%) |
| Total (Overall) | 32 (49.2%) | 33 (50.8%) |
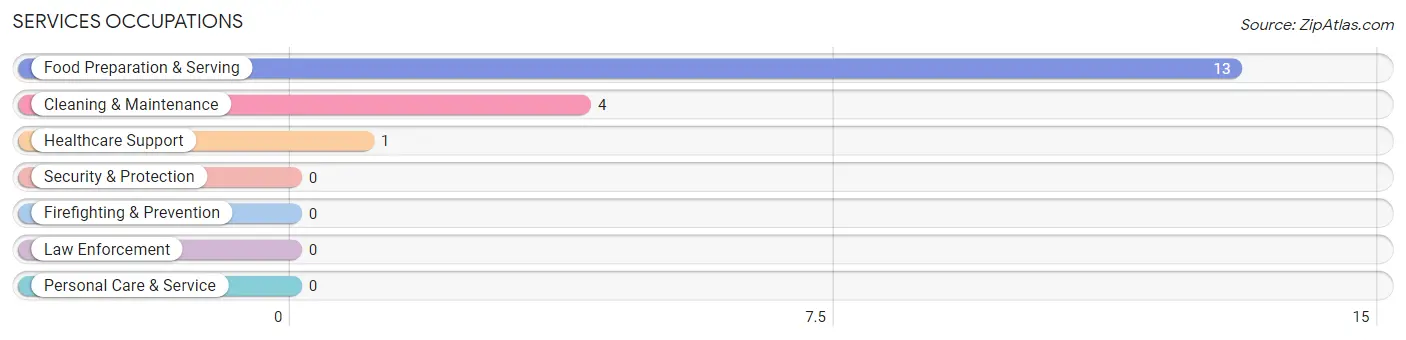
Services Occupations
The most common Services occupations in Copper City are Food Preparation & Serving (13 | 20.0%), Cleaning & Maintenance (4 | 6.1%), and Healthcare Support (1 | 1.5%).
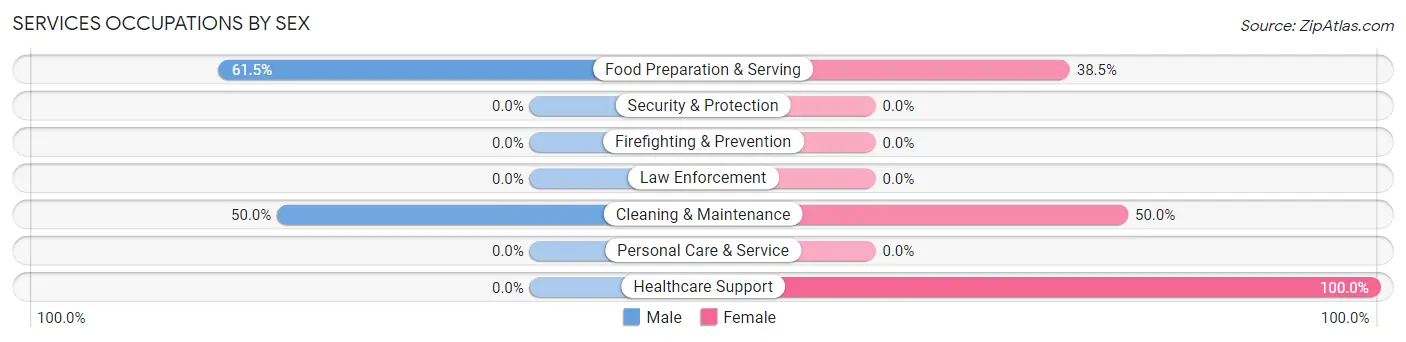
Services Occupations by Sex
Within the Services occupations in Copper City, the most male-oriented occupations are Food Preparation & Serving (61.5%), and Cleaning & Maintenance (50.0%), while the most female-oriented occupations are Healthcare Support (100.0%), Cleaning & Maintenance (50.0%), and Food Preparation & Serving (38.5%).
| Occupation | Male | Female |
| Healthcare Support | 0 (0.0%) | 1 (100.0%) |
| Security & Protection | 0 (0.0%) | 0 (0.0%) |
| Firefighting & Prevention | 0 (0.0%) | 0 (0.0%) |
| Law Enforcement | 0 (0.0%) | 0 (0.0%) |
| Food Preparation & Serving | 8 (61.5%) | 5 (38.5%) |
| Cleaning & Maintenance | 2 (50.0%) | 2 (50.0%) |
| Personal Care & Service | 0 (0.0%) | 0 (0.0%) |
| Total (Category) | 10 (55.6%) | 8 (44.4%) |
| Total (Overall) | 32 (49.2%) | 33 (50.8%) |
Sales and Office Occupations
The most common Sales and Office occupations in Copper City are Sales & Related (18 | 27.7%), and Office & Administration (4 | 6.1%).
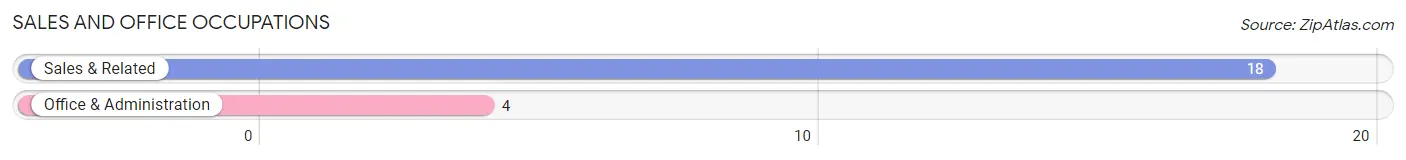
Sales and Office Occupations by Sex
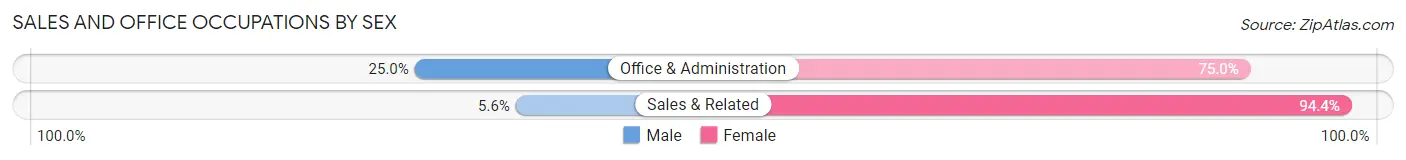
| Occupation | Male | Female |
| Sales & Related | 1 (5.6%) | 17 (94.4%) |
| Office & Administration | 1 (25.0%) | 3 (75.0%) |
| Total (Category) | 2 (9.1%) | 20 (90.9%) |
| Total (Overall) | 32 (49.2%) | 33 (50.8%) |
Natural Resources, Construction and Maintenance Occupations
The most common Natural Resources, Construction and Maintenance occupations in Copper City are Construction & Extraction (5 | 7.7%), and Farming, Fishing & Forestry (3 | 4.6%).
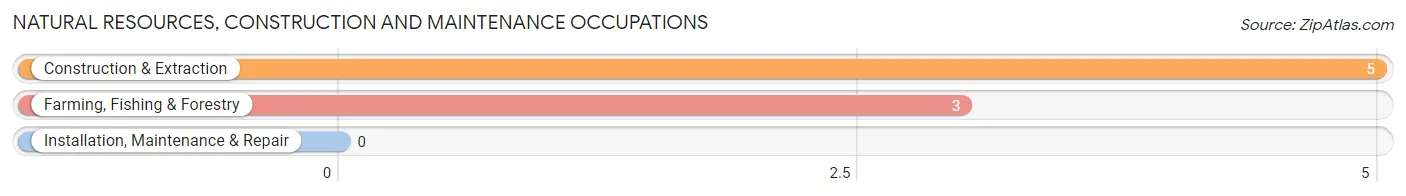
Natural Resources, Construction and Maintenance Occupations by Sex
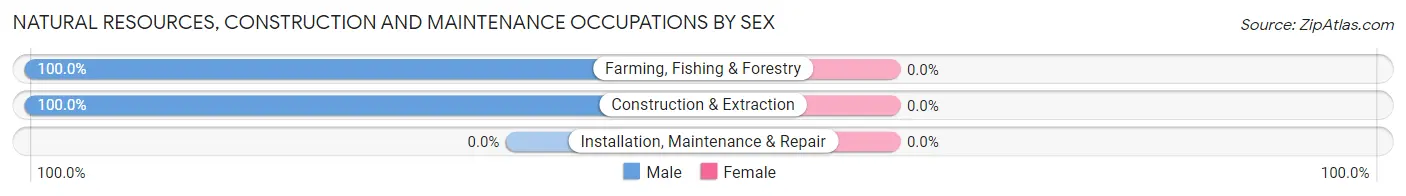
| Occupation | Male | Female |
| Farming, Fishing & Forestry | 3 (100.0%) | 0 (0.0%) |
| Construction & Extraction | 5 (100.0%) | 0 (0.0%) |
| Installation, Maintenance & Repair | 0 (0.0%) | 0 (0.0%) |
| Total (Category) | 8 (100.0%) | 0 (0.0%) |
| Total (Overall) | 32 (49.2%) | 33 (50.8%) |
Production, Transportation and Moving Occupations
The most common Production, Transportation and Moving occupations in Copper City are Material Moving (4 | 6.1%), Production (2 | 3.1%), and Transportation (1 | 1.5%).
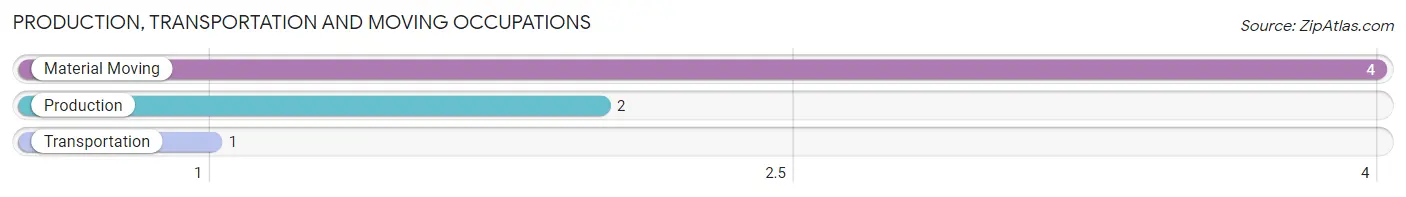
Production, Transportation and Moving Occupations by Sex
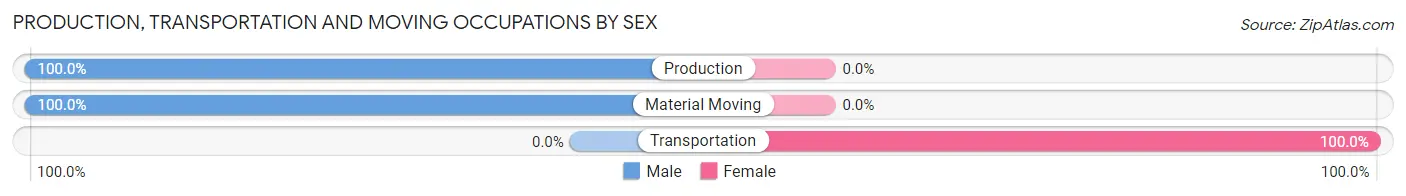
| Occupation | Male | Female |
| Production | 2 (100.0%) | 0 (0.0%) |
| Transportation | 0 (0.0%) | 1 (100.0%) |
| Material Moving | 4 (100.0%) | 0 (0.0%) |
| Total (Category) | 6 (85.7%) | 1 (14.3%) |
| Total (Overall) | 32 (49.2%) | 33 (50.8%) |
Employment Industries by Sex in Copper City
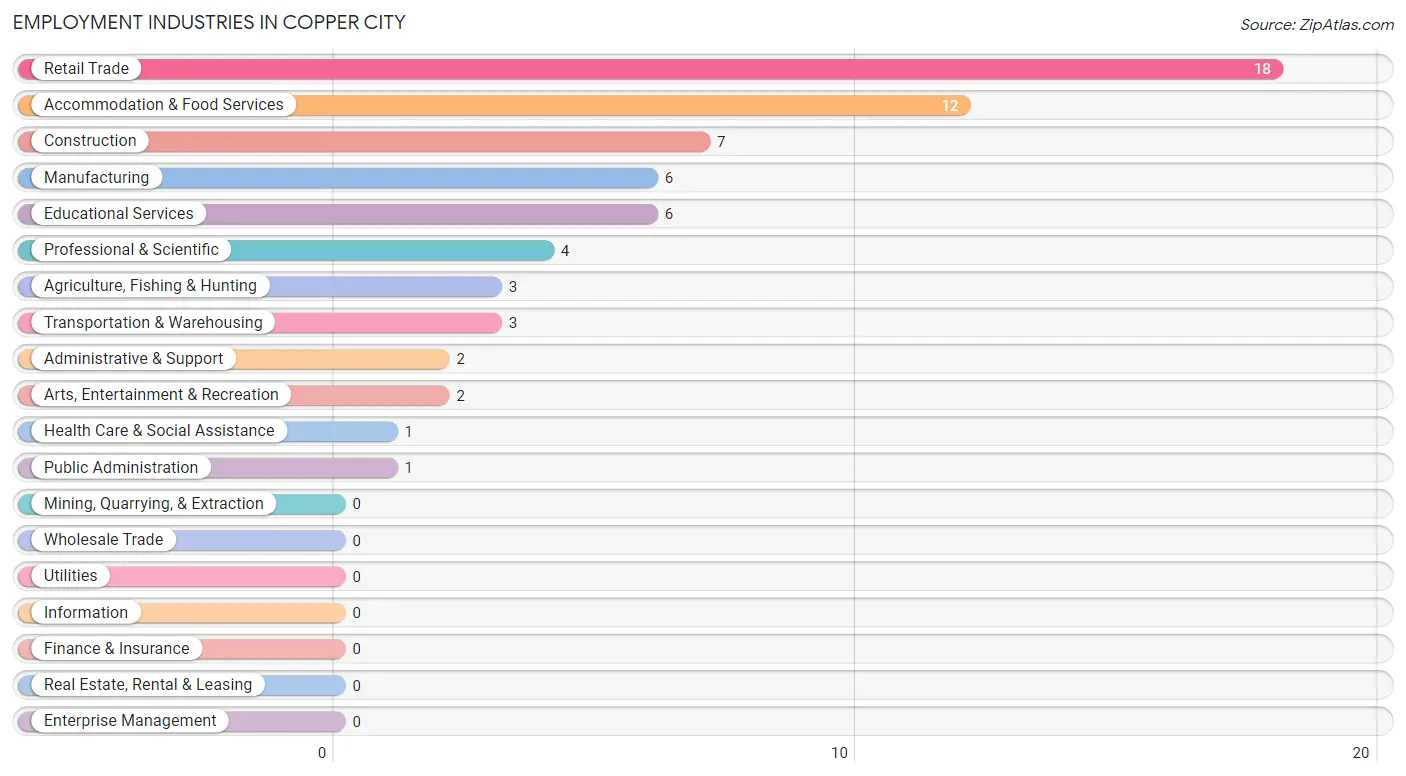
Employment Industries in Copper City
The major employment industries in Copper City include Retail Trade (18 | 27.7%), Accommodation & Food Services (12 | 18.5%), Construction (7 | 10.8%), Manufacturing (6 | 9.2%), and Educational Services (6 | 9.2%).
Employment Industries by Sex in Copper City
The Copper City industries that see more men than women are Agriculture, Fishing & Hunting (100.0%), Construction (100.0%), and Manufacturing (100.0%), whereas the industries that tend to have a higher number of women are Retail Trade (100.0%), Health Care & Social Assistance (100.0%), and Educational Services (83.3%).
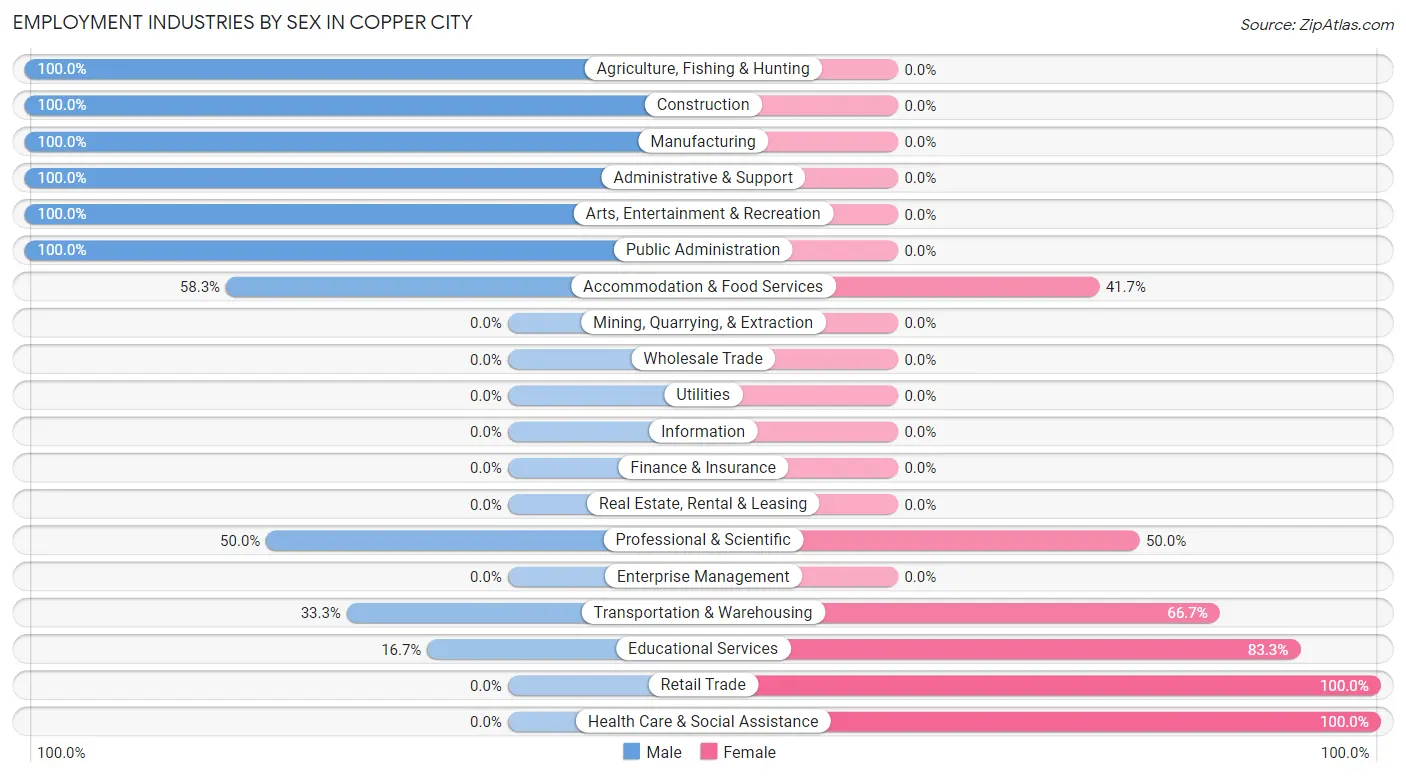
| Industry | Male | Female |
| Agriculture, Fishing & Hunting | 3 (100.0%) | 0 (0.0%) |
| Mining, Quarrying, & Extraction | 0 (0.0%) | 0 (0.0%) |
| Construction | 7 (100.0%) | 0 (0.0%) |
| Manufacturing | 6 (100.0%) | 0 (0.0%) |
| Wholesale Trade | 0 (0.0%) | 0 (0.0%) |
| Retail Trade | 0 (0.0%) | 18 (100.0%) |
| Transportation & Warehousing | 1 (33.3%) | 2 (66.7%) |
| Utilities | 0 (0.0%) | 0 (0.0%) |
| Information | 0 (0.0%) | 0 (0.0%) |
| Finance & Insurance | 0 (0.0%) | 0 (0.0%) |
| Real Estate, Rental & Leasing | 0 (0.0%) | 0 (0.0%) |
| Professional & Scientific | 2 (50.0%) | 2 (50.0%) |
| Enterprise Management | 0 (0.0%) | 0 (0.0%) |
| Administrative & Support | 2 (100.0%) | 0 (0.0%) |
| Educational Services | 1 (16.7%) | 5 (83.3%) |
| Health Care & Social Assistance | 0 (0.0%) | 1 (100.0%) |
| Arts, Entertainment & Recreation | 2 (100.0%) | 0 (0.0%) |
| Accommodation & Food Services | 7 (58.3%) | 5 (41.7%) |
| Public Administration | 1 (100.0%) | 0 (0.0%) |
| Total | 32 (49.2%) | 33 (50.8%) |
Education in Copper City
School Enrollment in Copper City
The most common levels of schooling among the 64 students in Copper City are middle school (36 | 56.2%), high school (10 | 15.6%), and college / undergraduate (10 | 15.6%).
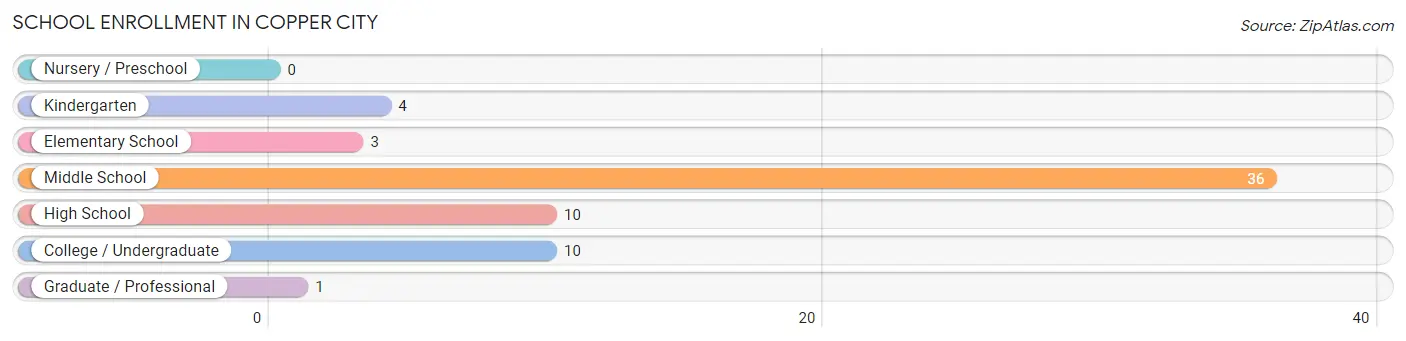
| School Level | # Students | % Students |
| Nursery / Preschool | 0 | 0.0% |
| Kindergarten | 4 | 6.2% |
| Elementary School | 3 | 4.7% |
| Middle School | 36 | 56.2% |
| High School | 10 | 15.6% |
| College / Undergraduate | 10 | 15.6% |
| Graduate / Professional | 1 | 1.6% |
| Total | 64 | 100.0% |
School Enrollment by Age by Funding Source in Copper City
Out of a total of 64 students who are enrolled in schools in Copper City, 3 (4.7%) attend a private institution, while the remaining 61 (95.3%) are enrolled in public schools. The age group of 20 to 24 year olds has the highest likelihood of being enrolled in private schools, with 1 (100.0% in the age bracket) enrolled. Conversely, the age group of 5 to 9 year old has the lowest likelihood of being enrolled in a private school, with 7 (100.0% in the age bracket) attending a public institution.
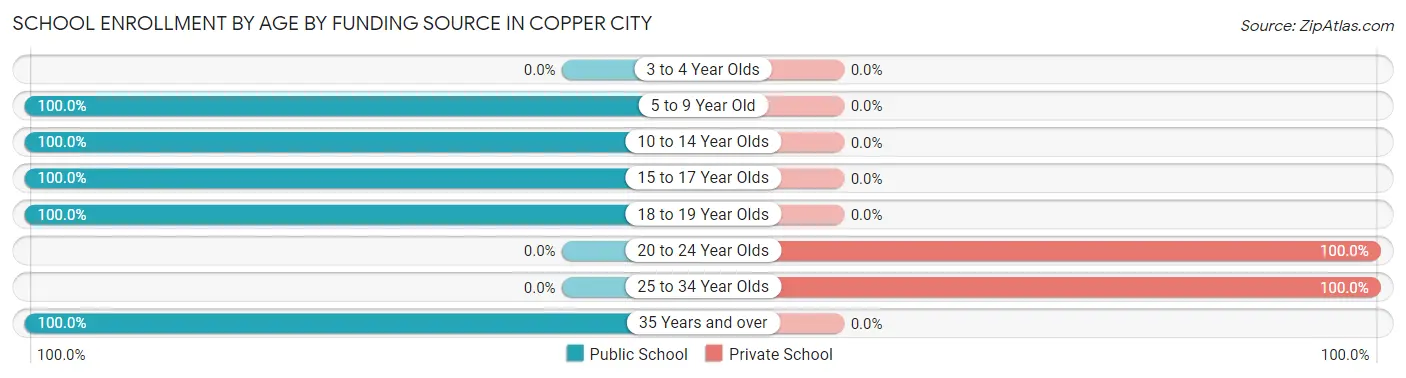
| Age Bracket | Public School | Private School |
| 3 to 4 Year Olds | 0 (0.0%) | 0 (0.0%) |
| 5 to 9 Year Old | 7 (100.0%) | 0 (0.0%) |
| 10 to 14 Year Olds | 37 (100.0%) | 0 (0.0%) |
| 15 to 17 Year Olds | 9 (100.0%) | 0 (0.0%) |
| 18 to 19 Year Olds | 6 (100.0%) | 0 (0.0%) |
| 20 to 24 Year Olds | 0 (0.0%) | 1 (100.0%) |
| 25 to 34 Year Olds | 0 (0.0%) | 2 (100.0%) |
| 35 Years and over | 2 (100.0%) | 0 (0.0%) |
| Total | 61 (95.3%) | 3 (4.7%) |
Educational Attainment by Field of Study in Copper City
Physical & health sciences (4 | 26.7%), business (4 | 26.7%), bio, nature & agricultural (2 | 13.3%), education (2 | 13.3%), and literature & languages (2 | 13.3%) are the most common fields of study among 15 individuals in Copper City who have obtained a bachelor's degree or higher.
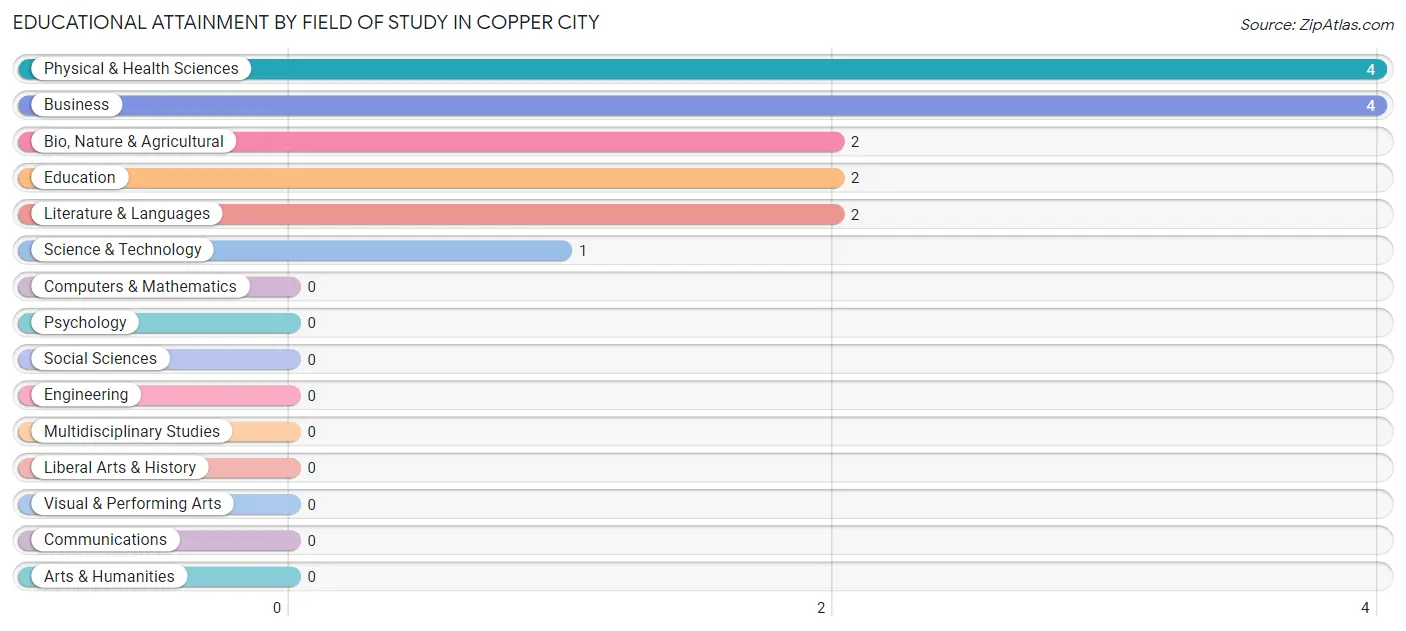
| Field of Study | # Graduates | % Graduates |
| Computers & Mathematics | 0 | 0.0% |
| Bio, Nature & Agricultural | 2 | 13.3% |
| Physical & Health Sciences | 4 | 26.7% |
| Psychology | 0 | 0.0% |
| Social Sciences | 0 | 0.0% |
| Engineering | 0 | 0.0% |
| Multidisciplinary Studies | 0 | 0.0% |
| Science & Technology | 1 | 6.7% |
| Business | 4 | 26.7% |
| Education | 2 | 13.3% |
| Literature & Languages | 2 | 13.3% |
| Liberal Arts & History | 0 | 0.0% |
| Visual & Performing Arts | 0 | 0.0% |
| Communications | 0 | 0.0% |
| Arts & Humanities | 0 | 0.0% |
| Total | 15 | 100.0% |
Transportation & Commute in Copper City
Vehicle Availability by Sex in Copper City
The most prevalent vehicle ownership categories in Copper City are males with 2 vehicles (12, accounting for 40.0%) and females with 2 vehicles (13, making up 37.5%).
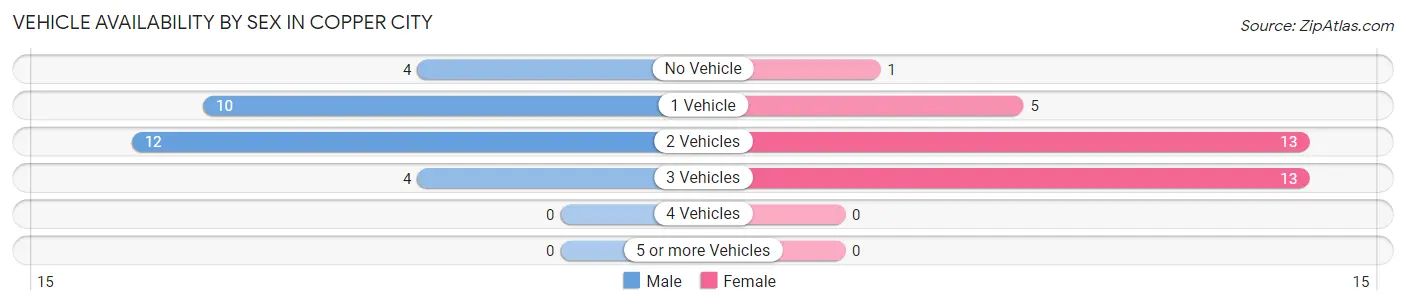
| Vehicles Available | Male | Female |
| No Vehicle | 4 (13.3%) | 1 (3.1%) |
| 1 Vehicle | 10 (33.3%) | 5 (15.6%) |
| 2 Vehicles | 12 (40.0%) | 13 (40.6%) |
| 3 Vehicles | 4 (13.3%) | 13 (40.6%) |
| 4 Vehicles | 0 (0.0%) | 0 (0.0%) |
| 5 or more Vehicles | 0 (0.0%) | 0 (0.0%) |
| Total | 30 (100.0%) | 32 (100.0%) |
Commute Time in Copper City
The most frequently occuring commute durations in Copper City are 15 to 19 minutes (14 commuters, 25.5%), 30 to 34 minutes (14 commuters, 25.5%), and 5 to 9 minutes (13 commuters, 23.6%).
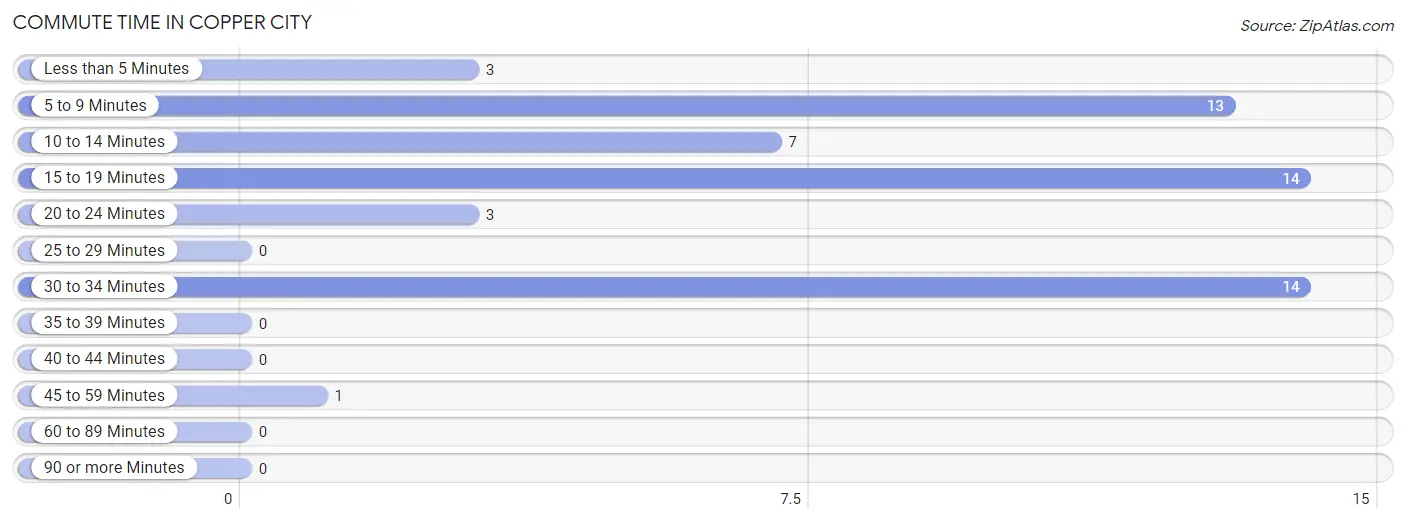
| Commute Time | # Commuters | % Commuters |
| Less than 5 Minutes | 3 | 5.4% |
| 5 to 9 Minutes | 13 | 23.6% |
| 10 to 14 Minutes | 7 | 12.7% |
| 15 to 19 Minutes | 14 | 25.5% |
| 20 to 24 Minutes | 3 | 5.4% |
| 25 to 29 Minutes | 0 | 0.0% |
| 30 to 34 Minutes | 14 | 25.5% |
| 35 to 39 Minutes | 0 | 0.0% |
| 40 to 44 Minutes | 0 | 0.0% |
| 45 to 59 Minutes | 1 | 1.8% |
| 60 to 89 Minutes | 0 | 0.0% |
| 90 or more Minutes | 0 | 0.0% |
Commute Time by Sex in Copper City
The most common commute times in Copper City are 30 to 34 minutes (8 commuters, 32.0%) for males and 15 to 19 minutes (13 commuters, 43.3%) for females.
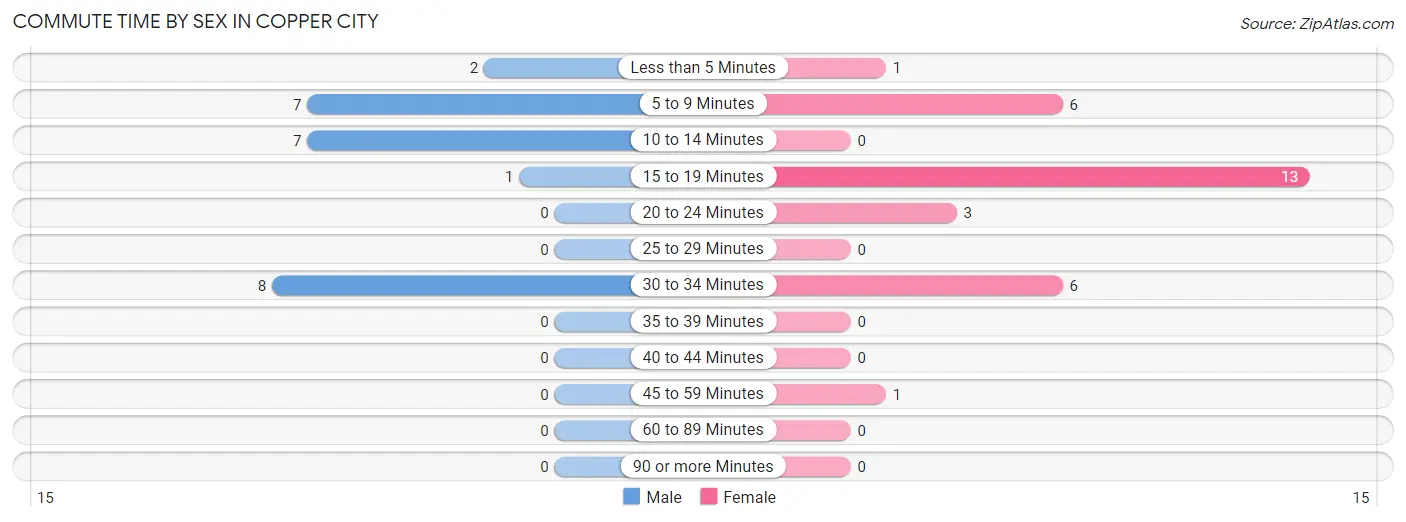
| Commute Time | Male | Female |
| Less than 5 Minutes | 2 (8.0%) | 1 (3.3%) |
| 5 to 9 Minutes | 7 (28.0%) | 6 (20.0%) |
| 10 to 14 Minutes | 7 (28.0%) | 0 (0.0%) |
| 15 to 19 Minutes | 1 (4.0%) | 13 (43.3%) |
| 20 to 24 Minutes | 0 (0.0%) | 3 (10.0%) |
| 25 to 29 Minutes | 0 (0.0%) | 0 (0.0%) |
| 30 to 34 Minutes | 8 (32.0%) | 6 (20.0%) |
| 35 to 39 Minutes | 0 (0.0%) | 0 (0.0%) |
| 40 to 44 Minutes | 0 (0.0%) | 0 (0.0%) |
| 45 to 59 Minutes | 0 (0.0%) | 1 (3.3%) |
| 60 to 89 Minutes | 0 (0.0%) | 0 (0.0%) |
| 90 or more Minutes | 0 (0.0%) | 0 (0.0%) |
Time of Departure to Work by Sex in Copper City
The most frequent times of departure to work in Copper City are 7:00 AM to 7:29 AM (7, 28.0%) for males and 5:00 AM to 5:29 AM (13, 43.3%) for females.
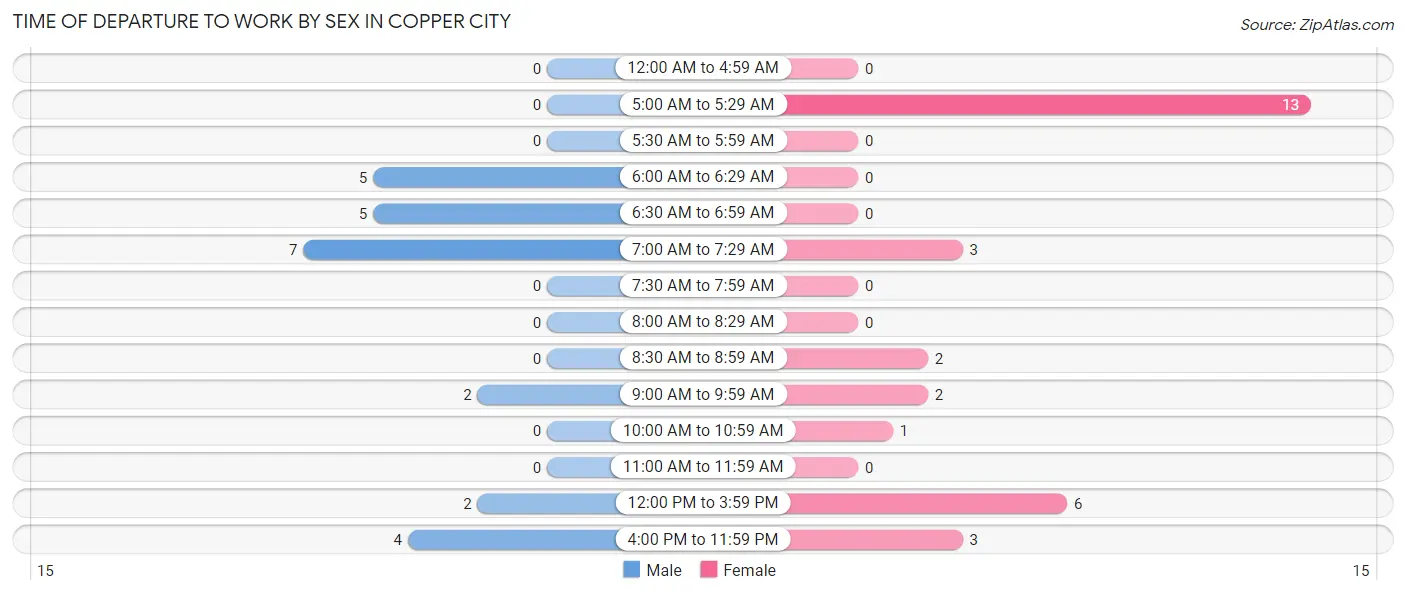
| Time of Departure | Male | Female |
| 12:00 AM to 4:59 AM | 0 (0.0%) | 0 (0.0%) |
| 5:00 AM to 5:29 AM | 0 (0.0%) | 13 (43.3%) |
| 5:30 AM to 5:59 AM | 0 (0.0%) | 0 (0.0%) |
| 6:00 AM to 6:29 AM | 5 (20.0%) | 0 (0.0%) |
| 6:30 AM to 6:59 AM | 5 (20.0%) | 0 (0.0%) |
| 7:00 AM to 7:29 AM | 7 (28.0%) | 3 (10.0%) |
| 7:30 AM to 7:59 AM | 0 (0.0%) | 0 (0.0%) |
| 8:00 AM to 8:29 AM | 0 (0.0%) | 0 (0.0%) |
| 8:30 AM to 8:59 AM | 0 (0.0%) | 2 (6.7%) |
| 9:00 AM to 9:59 AM | 2 (8.0%) | 2 (6.7%) |
| 10:00 AM to 10:59 AM | 0 (0.0%) | 1 (3.3%) |
| 11:00 AM to 11:59 AM | 0 (0.0%) | 0 (0.0%) |
| 12:00 PM to 3:59 PM | 2 (8.0%) | 6 (20.0%) |
| 4:00 PM to 11:59 PM | 4 (16.0%) | 3 (10.0%) |
| Total | 25 (100.0%) | 30 (100.0%) |
Housing Occupancy in Copper City
Occupancy by Ownership in Copper City
Of the total 78 dwellings in Copper City, owner-occupied units account for 68 (87.2%), while renter-occupied units make up 10 (12.8%).
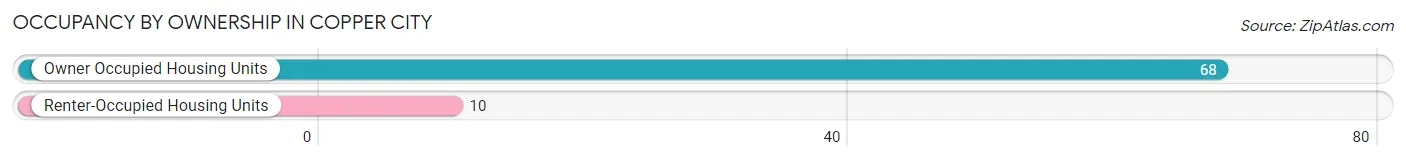
| Occupancy | # Housing Units | % Housing Units |
| Owner Occupied Housing Units | 68 | 87.2% |
| Renter-Occupied Housing Units | 10 | 12.8% |
| Total Occupied Housing Units | 78 | 100.0% |
Occupancy by Household Size in Copper City
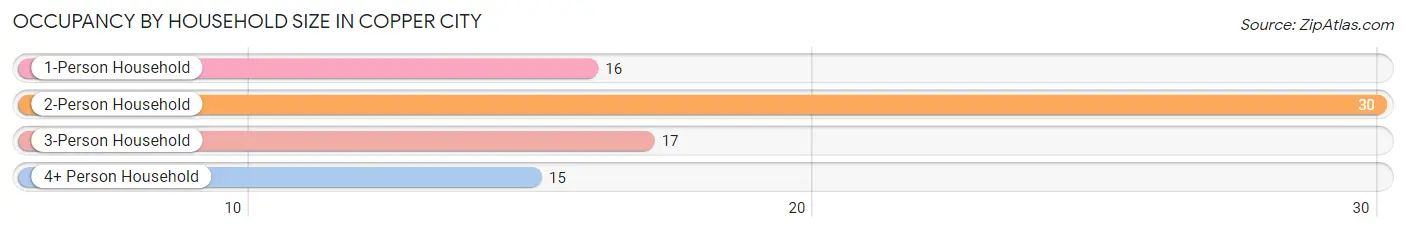
| Household Size | # Housing Units | % Housing Units |
| 1-Person Household | 16 | 20.5% |
| 2-Person Household | 30 | 38.5% |
| 3-Person Household | 17 | 21.8% |
| 4+ Person Household | 15 | 19.2% |
| Total Housing Units | 78 | 100.0% |
Occupancy by Ownership by Household Size in Copper City
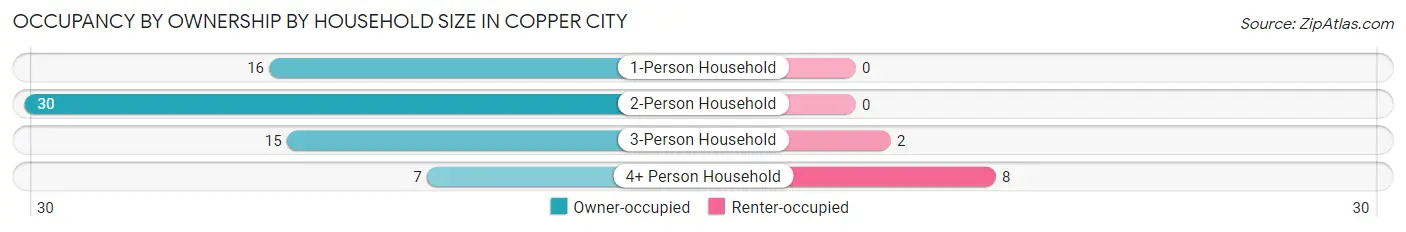
| Household Size | Owner-occupied | Renter-occupied |
| 1-Person Household | 16 (100.0%) | 0 (0.0%) |
| 2-Person Household | 30 (100.0%) | 0 (0.0%) |
| 3-Person Household | 15 (88.2%) | 2 (11.8%) |
| 4+ Person Household | 7 (46.7%) | 8 (53.3%) |
| Total Housing Units | 68 (87.2%) | 10 (12.8%) |
Occupancy by Educational Attainment in Copper City
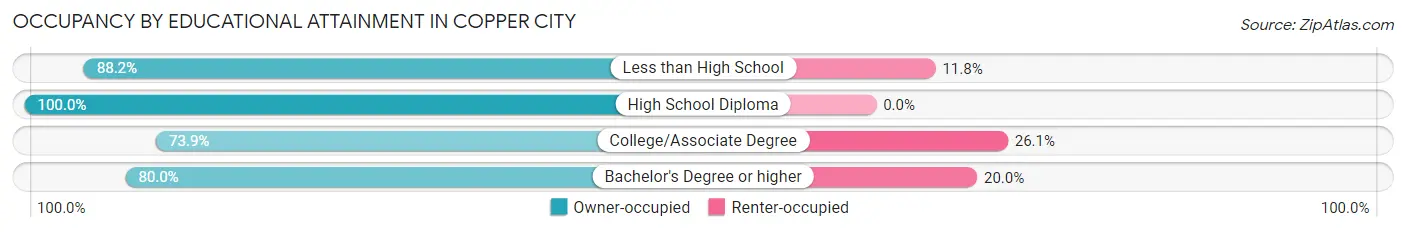
| Household Size | Owner-occupied | Renter-occupied |
| Less than High School | 15 (88.2%) | 2 (11.8%) |
| High School Diploma | 28 (100.0%) | 0 (0.0%) |
| College/Associate Degree | 17 (73.9%) | 6 (26.1%) |
| Bachelor's Degree or higher | 8 (80.0%) | 2 (20.0%) |
Occupancy by Age of Householder in Copper City
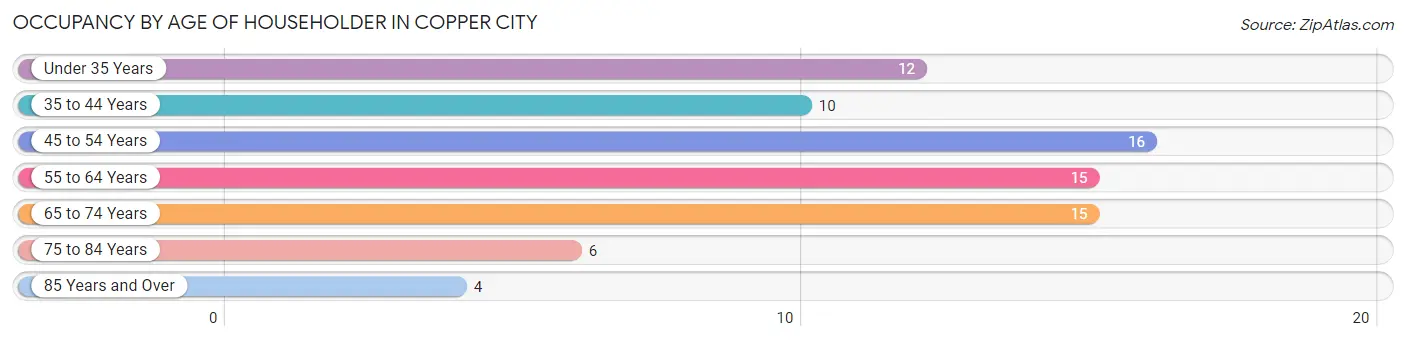
| Age Bracket | # Households | % Households |
| Under 35 Years | 12 | 15.4% |
| 35 to 44 Years | 10 | 12.8% |
| 45 to 54 Years | 16 | 20.5% |
| 55 to 64 Years | 15 | 19.2% |
| 65 to 74 Years | 15 | 19.2% |
| 75 to 84 Years | 6 | 7.7% |
| 85 Years and Over | 4 | 5.1% |
| Total | 78 | 100.0% |
Housing Finances in Copper City
Median Income by Occupancy in Copper City
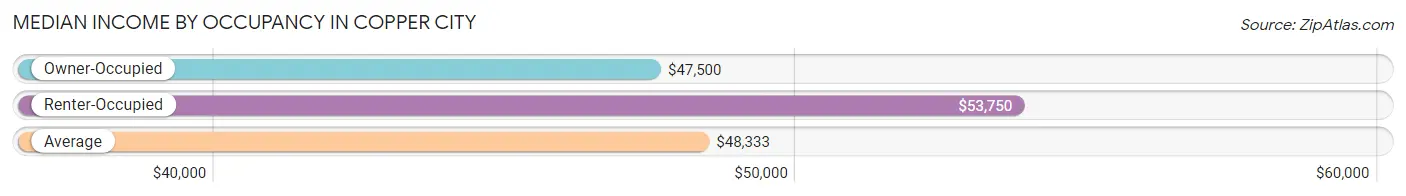
| Occupancy Type | # Households | Median Income |
| Owner-Occupied | 68 (87.2%) | $47,500 |
| Renter-Occupied | 10 (12.8%) | $53,750 |
| Average | 78 (100.0%) | $48,333 |
Occupancy by Householder Income Bracket in Copper City
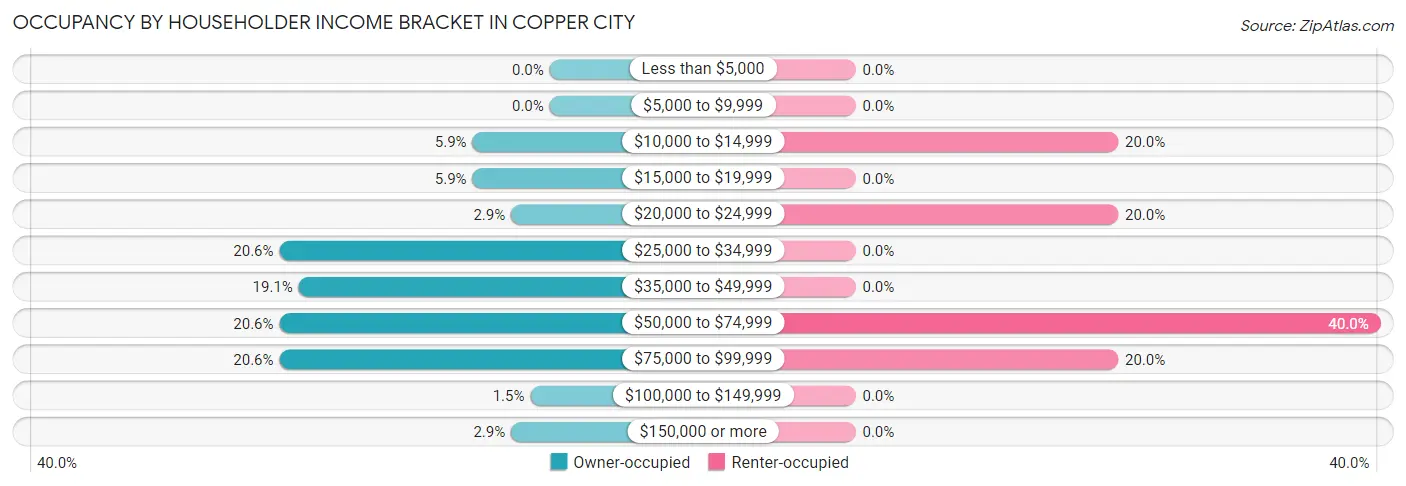
| Income Bracket | Owner-occupied | Renter-occupied |
| Less than $5,000 | 0 (0.0%) | 0 (0.0%) |
| $5,000 to $9,999 | 0 (0.0%) | 0 (0.0%) |
| $10,000 to $14,999 | 4 (5.9%) | 2 (20.0%) |
| $15,000 to $19,999 | 4 (5.9%) | 0 (0.0%) |
| $20,000 to $24,999 | 2 (2.9%) | 2 (20.0%) |
| $25,000 to $34,999 | 14 (20.6%) | 0 (0.0%) |
| $35,000 to $49,999 | 13 (19.1%) | 0 (0.0%) |
| $50,000 to $74,999 | 14 (20.6%) | 4 (40.0%) |
| $75,000 to $99,999 | 14 (20.6%) | 2 (20.0%) |
| $100,000 to $149,999 | 1 (1.5%) | 0 (0.0%) |
| $150,000 or more | 2 (2.9%) | 0 (0.0%) |
| Total | 68 (100.0%) | 10 (100.0%) |
Monthly Housing Cost Tiers in Copper City
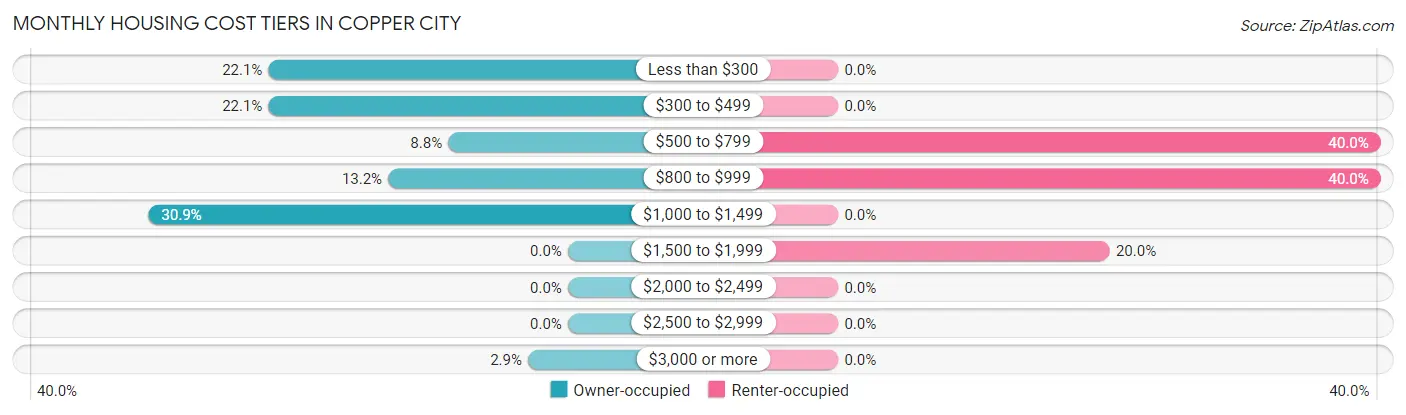
| Monthly Cost | Owner-occupied | Renter-occupied |
| Less than $300 | 15 (22.1%) | 0 (0.0%) |
| $300 to $499 | 15 (22.1%) | 0 (0.0%) |
| $500 to $799 | 6 (8.8%) | 4 (40.0%) |
| $800 to $999 | 9 (13.2%) | 4 (40.0%) |
| $1,000 to $1,499 | 21 (30.9%) | 0 (0.0%) |
| $1,500 to $1,999 | 0 (0.0%) | 2 (20.0%) |
| $2,000 to $2,499 | 0 (0.0%) | 0 (0.0%) |
| $2,500 to $2,999 | 0 (0.0%) | 0 (0.0%) |
| $3,000 or more | 2 (2.9%) | 0 (0.0%) |
| Total | 68 (100.0%) | 10 (100.0%) |
Physical Housing Characteristics in Copper City
Housing Structures in Copper City
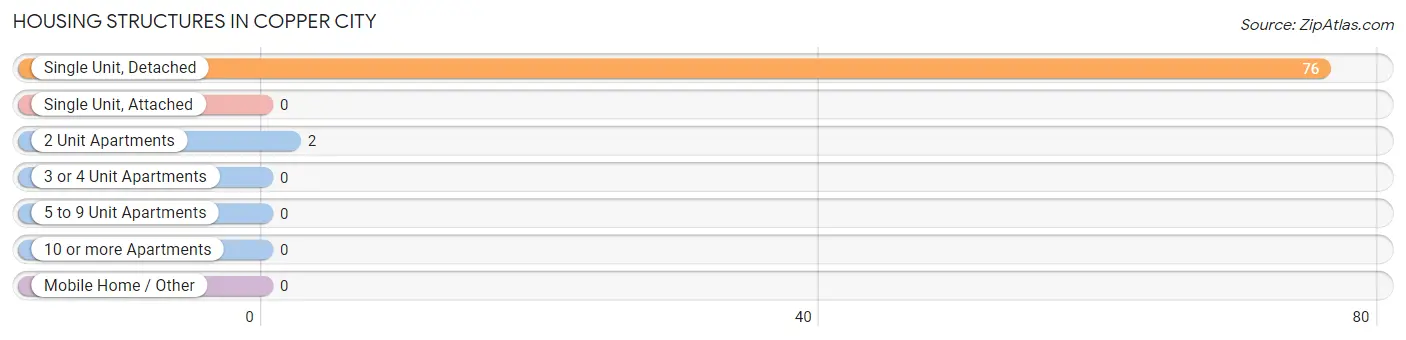
| Structure Type | # Housing Units | % Housing Units |
| Single Unit, Detached | 76 | 97.4% |
| Single Unit, Attached | 0 | 0.0% |
| 2 Unit Apartments | 2 | 2.6% |
| 3 or 4 Unit Apartments | 0 | 0.0% |
| 5 to 9 Unit Apartments | 0 | 0.0% |
| 10 or more Apartments | 0 | 0.0% |
| Mobile Home / Other | 0 | 0.0% |
| Total | 78 | 100.0% |
Housing Structures by Occupancy in Copper City
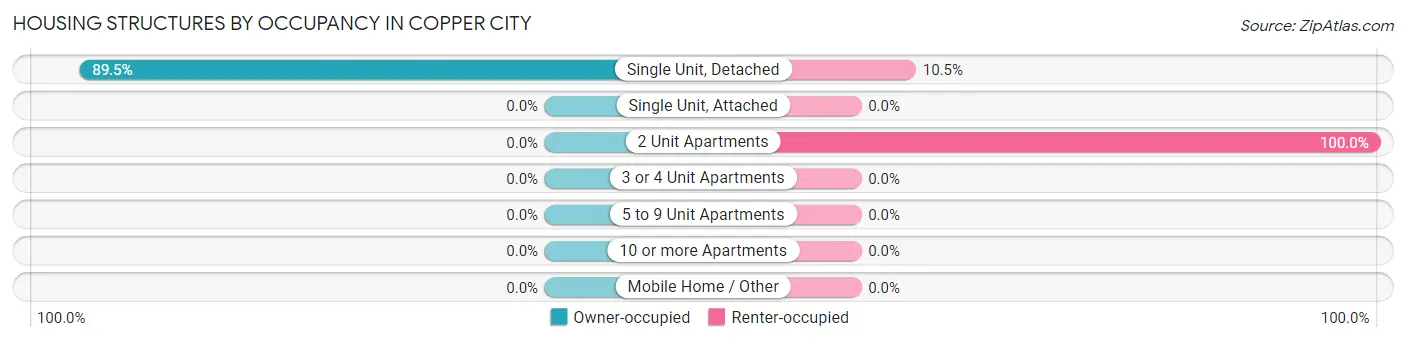
| Structure Type | Owner-occupied | Renter-occupied |
| Single Unit, Detached | 68 (89.5%) | 8 (10.5%) |
| Single Unit, Attached | 0 (0.0%) | 0 (0.0%) |
| 2 Unit Apartments | 0 (0.0%) | 2 (100.0%) |
| 3 or 4 Unit Apartments | 0 (0.0%) | 0 (0.0%) |
| 5 to 9 Unit Apartments | 0 (0.0%) | 0 (0.0%) |
| 10 or more Apartments | 0 (0.0%) | 0 (0.0%) |
| Mobile Home / Other | 0 (0.0%) | 0 (0.0%) |
| Total | 68 (87.2%) | 10 (12.8%) |
Housing Structures by Number of Rooms in Copper City
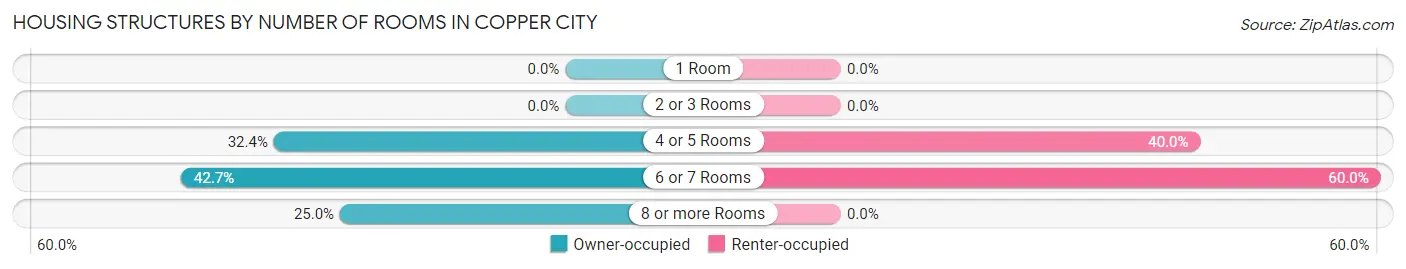
| Number of Rooms | Owner-occupied | Renter-occupied |
| 1 Room | 0 (0.0%) | 0 (0.0%) |
| 2 or 3 Rooms | 0 (0.0%) | 0 (0.0%) |
| 4 or 5 Rooms | 22 (32.4%) | 4 (40.0%) |
| 6 or 7 Rooms | 29 (42.6%) | 6 (60.0%) |
| 8 or more Rooms | 17 (25.0%) | 0 (0.0%) |
| Total | 68 (100.0%) | 10 (100.0%) |
Housing Structure by Heating Type in Copper City
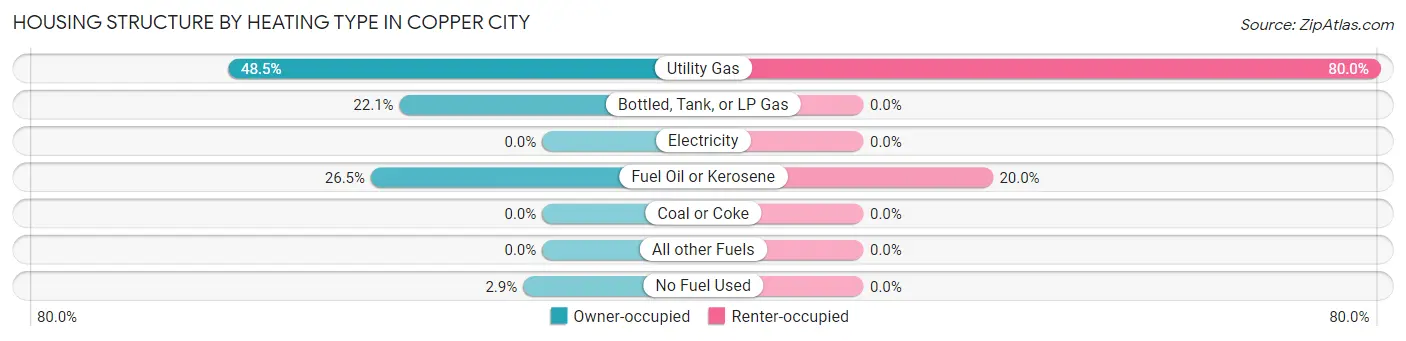
| Heating Type | Owner-occupied | Renter-occupied |
| Utility Gas | 33 (48.5%) | 8 (80.0%) |
| Bottled, Tank, or LP Gas | 15 (22.1%) | 0 (0.0%) |
| Electricity | 0 (0.0%) | 0 (0.0%) |
| Fuel Oil or Kerosene | 18 (26.5%) | 2 (20.0%) |
| Coal or Coke | 0 (0.0%) | 0 (0.0%) |
| All other Fuels | 0 (0.0%) | 0 (0.0%) |
| No Fuel Used | 2 (2.9%) | 0 (0.0%) |
| Total | 68 (100.0%) | 10 (100.0%) |
Household Vehicle Usage in Copper City
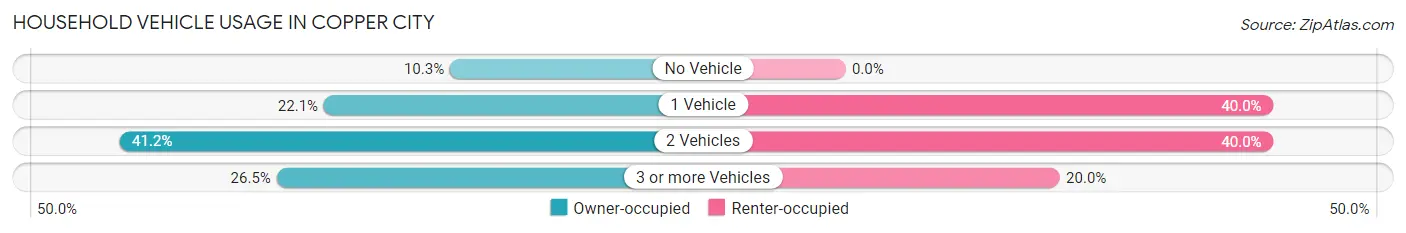
| Vehicles per Household | Owner-occupied | Renter-occupied |
| No Vehicle | 7 (10.3%) | 0 (0.0%) |
| 1 Vehicle | 15 (22.1%) | 4 (40.0%) |
| 2 Vehicles | 28 (41.2%) | 4 (40.0%) |
| 3 or more Vehicles | 18 (26.5%) | 2 (20.0%) |
| Total | 68 (100.0%) | 10 (100.0%) |
Real Estate & Mortgages in Copper City
Real Estate and Mortgage Overview in Copper City
| Characteristic | Without Mortgage | With Mortgage |
| Housing Units | 32 | 36 |
| Median Property Value | $32,500 | $103,100 |
| Median Household Income | $44,167 | $2 |
| Monthly Housing Costs | $310 | $2 |
| Real Estate Taxes | $875 | $1 |
Property Value by Mortgage Status in Copper City
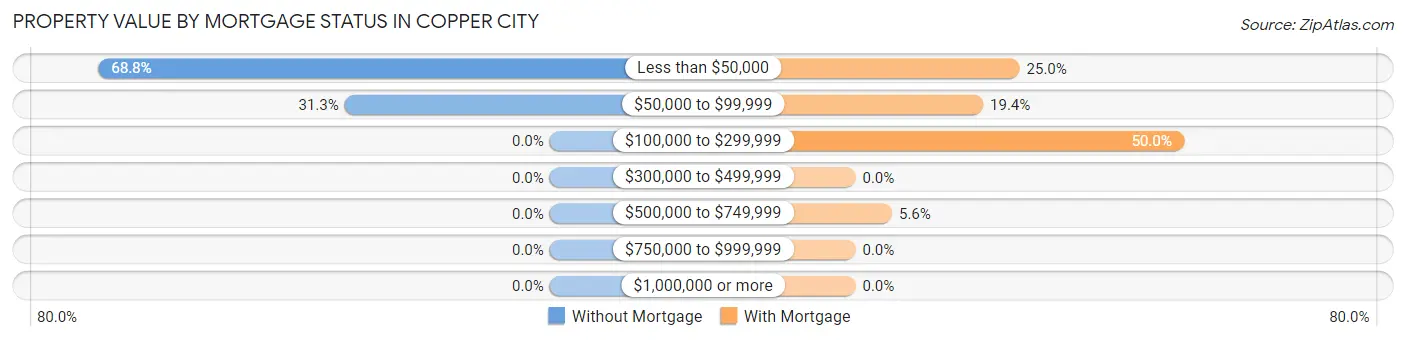
| Property Value | Without Mortgage | With Mortgage |
| Less than $50,000 | 22 (68.8%) | 9 (25.0%) |
| $50,000 to $99,999 | 10 (31.2%) | 7 (19.4%) |
| $100,000 to $299,999 | 0 (0.0%) | 18 (50.0%) |
| $300,000 to $499,999 | 0 (0.0%) | 0 (0.0%) |
| $500,000 to $749,999 | 0 (0.0%) | 2 (5.6%) |
| $750,000 to $999,999 | 0 (0.0%) | 0 (0.0%) |
| $1,000,000 or more | 0 (0.0%) | 0 (0.0%) |
| Total | 32 (100.0%) | 36 (100.0%) |
Household Income by Mortgage Status in Copper City
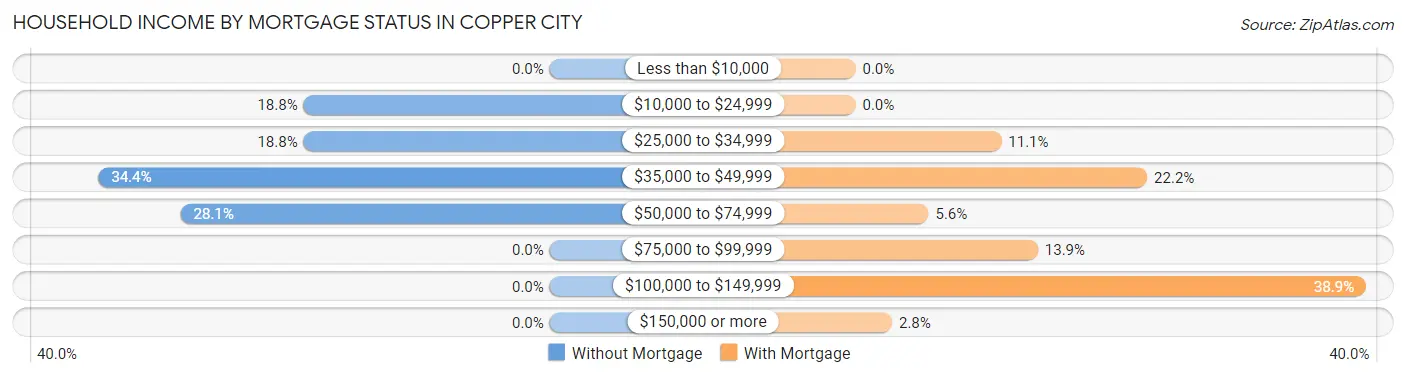
| Household Income | Without Mortgage | With Mortgage |
| Less than $10,000 | 0 (0.0%) | 0 (0.0%) |
| $10,000 to $24,999 | 6 (18.8%) | 0 (0.0%) |
| $25,000 to $34,999 | 6 (18.8%) | 4 (11.1%) |
| $35,000 to $49,999 | 11 (34.4%) | 8 (22.2%) |
| $50,000 to $74,999 | 9 (28.1%) | 2 (5.6%) |
| $75,000 to $99,999 | 0 (0.0%) | 5 (13.9%) |
| $100,000 to $149,999 | 0 (0.0%) | 14 (38.9%) |
| $150,000 or more | 0 (0.0%) | 1 (2.8%) |
| Total | 32 (100.0%) | 36 (100.0%) |
Property Value to Household Income Ratio in Copper City
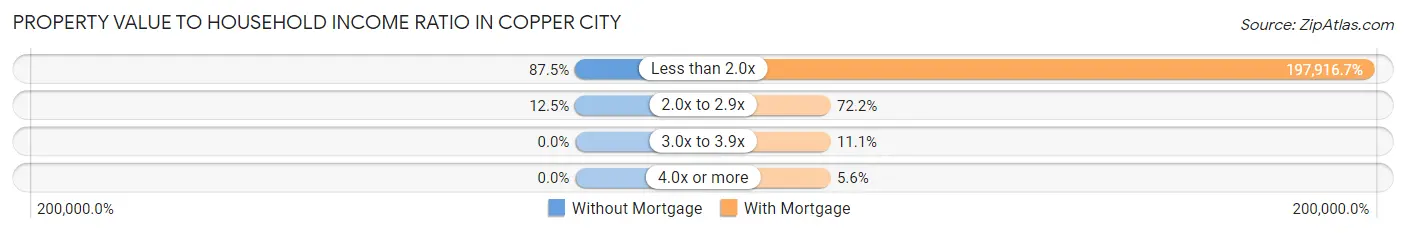
| Value-to-Income Ratio | Without Mortgage | With Mortgage |
| Less than 2.0x | 28 (87.5%) | 71,250 (197,916.7%) |
| 2.0x to 2.9x | 4 (12.5%) | 26 (72.2%) |
| 3.0x to 3.9x | 0 (0.0%) | 4 (11.1%) |
| 4.0x or more | 0 (0.0%) | 2 (5.6%) |
| Total | 32 (100.0%) | 36 (100.0%) |
Real Estate Taxes by Mortgage Status in Copper City
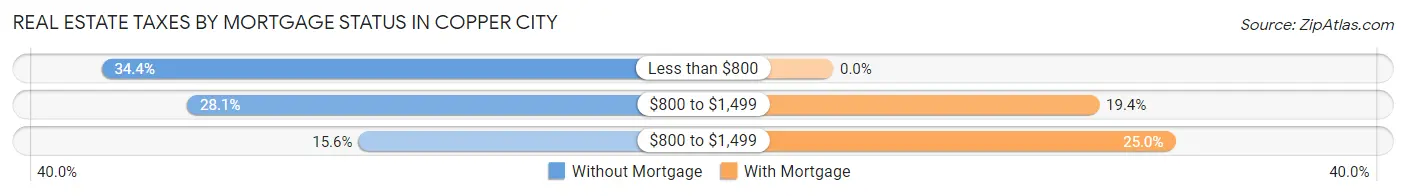
| Property Taxes | Without Mortgage | With Mortgage |
| Less than $800 | 11 (34.4%) | 0 (0.0%) |
| $800 to $1,499 | 9 (28.1%) | 7 (19.4%) |
| $800 to $1,499 | 5 (15.6%) | 9 (25.0%) |
| Total | 32 (100.0%) | 36 (100.0%) |
Health & Disability in Copper City
Health Insurance Coverage by Age in Copper City
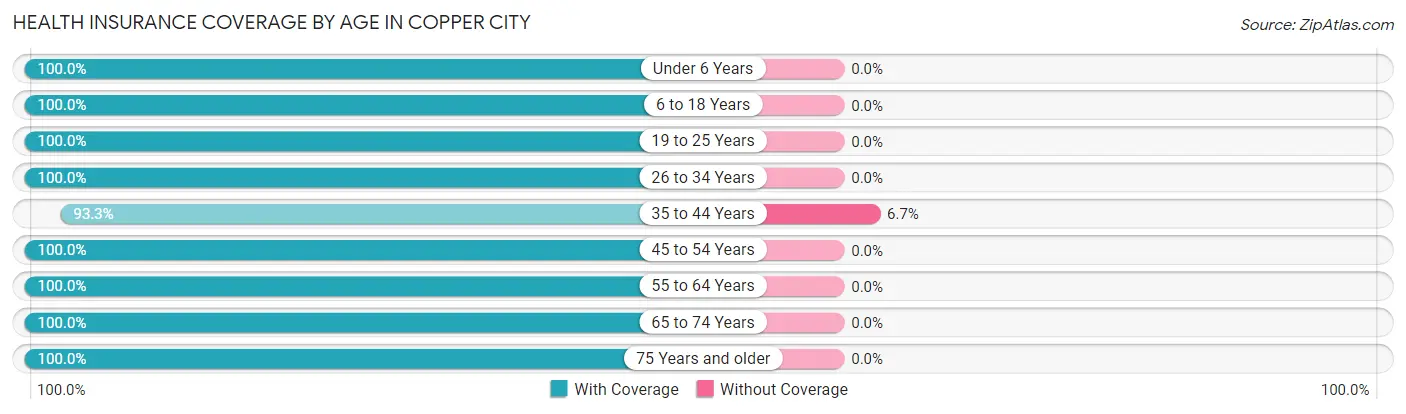
| Age Bracket | With Coverage | Without Coverage |
| Under 6 Years | 11 (100.0%) | 0 (0.0%) |
| 6 to 18 Years | 53 (100.0%) | 0 (0.0%) |
| 19 to 25 Years | 11 (100.0%) | 0 (0.0%) |
| 26 to 34 Years | 23 (100.0%) | 0 (0.0%) |
| 35 to 44 Years | 14 (93.3%) | 1 (6.7%) |
| 45 to 54 Years | 20 (100.0%) | 0 (0.0%) |
| 55 to 64 Years | 54 (100.0%) | 0 (0.0%) |
| 65 to 74 Years | 28 (100.0%) | 0 (0.0%) |
| 75 Years and older | 14 (100.0%) | 0 (0.0%) |
| Total | 228 (99.6%) | 1 (0.4%) |
Health Insurance Coverage by Citizenship Status in Copper City

| Citizenship Status | With Coverage | Without Coverage |
| Native Born | 11 (100.0%) | 0 (0.0%) |
| Foreign Born, Citizen | 53 (100.0%) | 0 (0.0%) |
| Foreign Born, not a Citizen | 11 (100.0%) | 0 (0.0%) |
Health Insurance Coverage by Household Income in Copper City
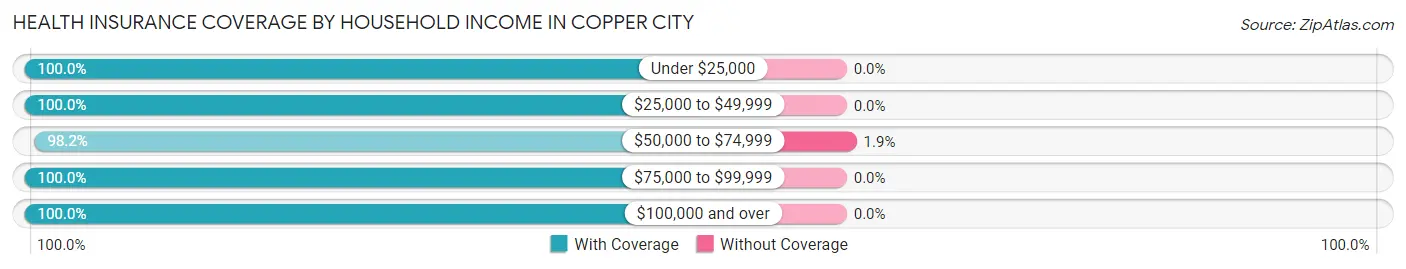
| Household Income | With Coverage | Without Coverage |
| Under $25,000 | 24 (100.0%) | 0 (0.0%) |
| $25,000 to $49,999 | 57 (100.0%) | 0 (0.0%) |
| $50,000 to $74,999 | 53 (98.2%) | 1 (1.8%) |
| $75,000 to $99,999 | 88 (100.0%) | 0 (0.0%) |
| $100,000 and over | 6 (100.0%) | 0 (0.0%) |
Public vs Private Health Insurance Coverage by Age in Copper City
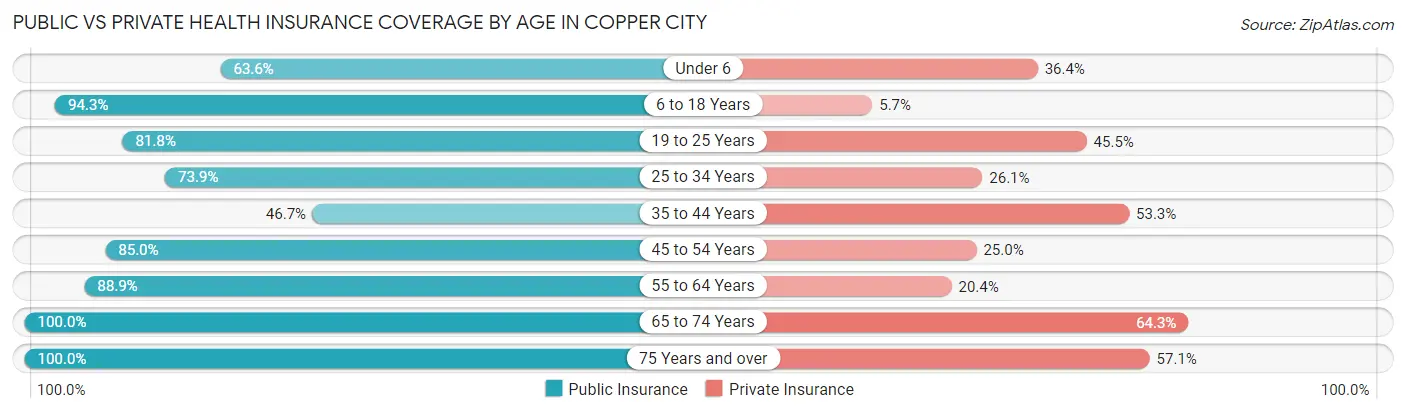
| Age Bracket | Public Insurance | Private Insurance |
| Under 6 | 7 (63.6%) | 4 (36.4%) |
| 6 to 18 Years | 50 (94.3%) | 3 (5.7%) |
| 19 to 25 Years | 9 (81.8%) | 5 (45.5%) |
| 25 to 34 Years | 17 (73.9%) | 6 (26.1%) |
| 35 to 44 Years | 7 (46.7%) | 8 (53.3%) |
| 45 to 54 Years | 17 (85.0%) | 5 (25.0%) |
| 55 to 64 Years | 48 (88.9%) | 11 (20.4%) |
| 65 to 74 Years | 28 (100.0%) | 18 (64.3%) |
| 75 Years and over | 14 (100.0%) | 8 (57.1%) |
| Total | 197 (86.0%) | 68 (29.7%) |
Disability Status by Sex by Age in Copper City
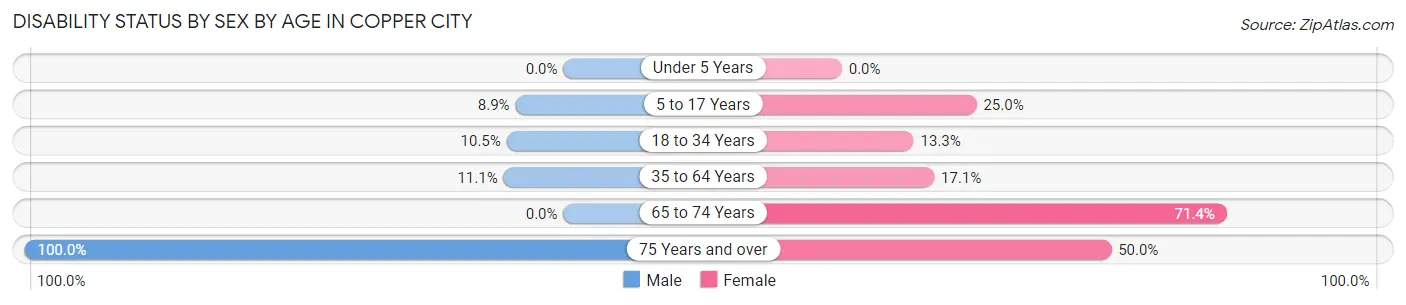
| Age Bracket | Male | Female |
| Under 5 Years | 0 (0.0%) | 0 (0.0%) |
| 5 to 17 Years | 4 (8.9%) | 2 (25.0%) |
| 18 to 34 Years | 2 (10.5%) | 2 (13.3%) |
| 35 to 64 Years | 6 (11.1%) | 6 (17.1%) |
| 65 to 74 Years | 0 (0.0%) | 5 (71.4%) |
| 75 Years and over | 6 (100.0%) | 4 (50.0%) |
Disability Class by Sex by Age in Copper City
Disability Class: Hearing Difficulty
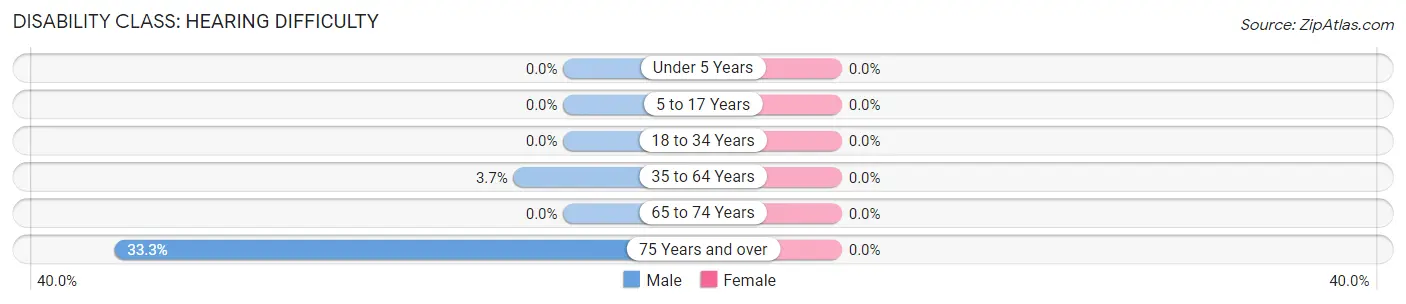
| Age Bracket | Male | Female |
| Under 5 Years | 0 (0.0%) | 0 (0.0%) |
| 5 to 17 Years | 0 (0.0%) | 0 (0.0%) |
| 18 to 34 Years | 0 (0.0%) | 0 (0.0%) |
| 35 to 64 Years | 2 (3.7%) | 0 (0.0%) |
| 65 to 74 Years | 0 (0.0%) | 0 (0.0%) |
| 75 Years and over | 2 (33.3%) | 0 (0.0%) |
Disability Class: Vision Difficulty
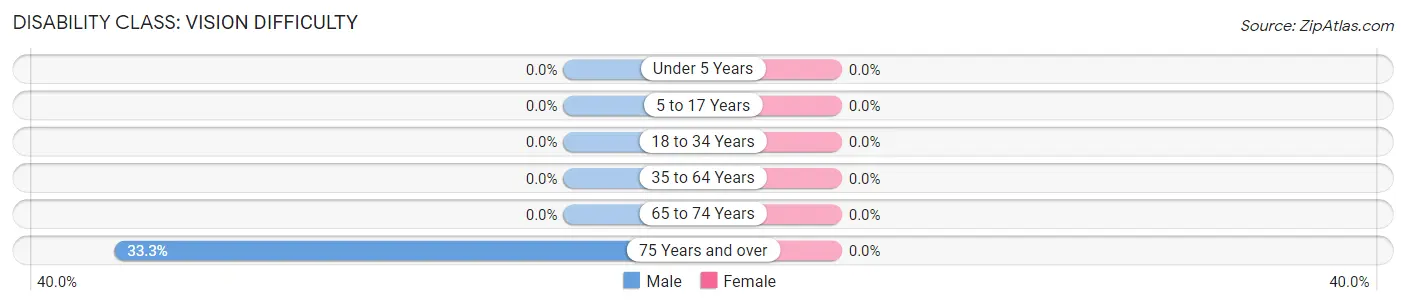
| Age Bracket | Male | Female |
| Under 5 Years | 0 (0.0%) | 0 (0.0%) |
| 5 to 17 Years | 0 (0.0%) | 0 (0.0%) |
| 18 to 34 Years | 0 (0.0%) | 0 (0.0%) |
| 35 to 64 Years | 0 (0.0%) | 0 (0.0%) |
| 65 to 74 Years | 0 (0.0%) | 0 (0.0%) |
| 75 Years and over | 2 (33.3%) | 0 (0.0%) |
Disability Class: Cognitive Difficulty
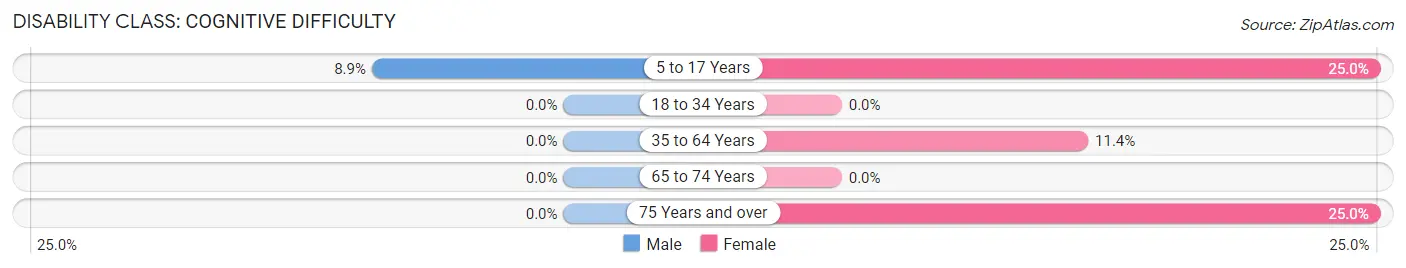
| Age Bracket | Male | Female |
| 5 to 17 Years | 4 (8.9%) | 2 (25.0%) |
| 18 to 34 Years | 0 (0.0%) | 0 (0.0%) |
| 35 to 64 Years | 0 (0.0%) | 4 (11.4%) |
| 65 to 74 Years | 0 (0.0%) | 0 (0.0%) |
| 75 Years and over | 0 (0.0%) | 2 (25.0%) |
Disability Class: Ambulatory Difficulty
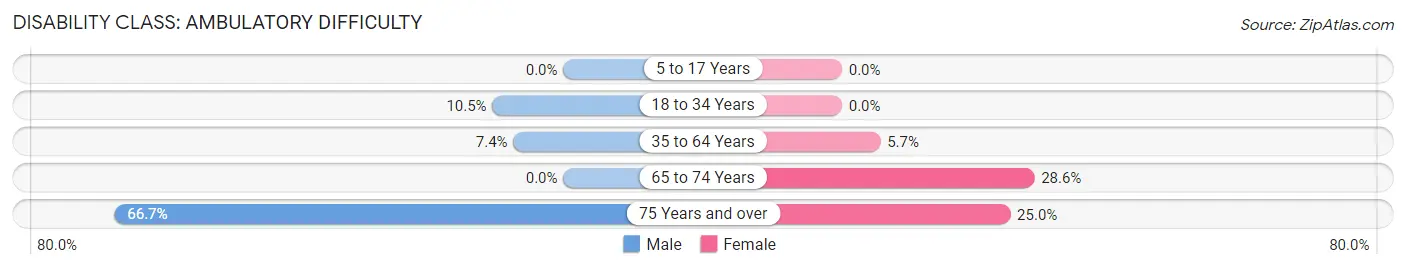
| Age Bracket | Male | Female |
| 5 to 17 Years | 0 (0.0%) | 0 (0.0%) |
| 18 to 34 Years | 2 (10.5%) | 0 (0.0%) |
| 35 to 64 Years | 4 (7.4%) | 2 (5.7%) |
| 65 to 74 Years | 0 (0.0%) | 2 (28.6%) |
| 75 Years and over | 4 (66.7%) | 2 (25.0%) |
Disability Class: Self-Care Difficulty
| Age Bracket | Male | Female |
| 5 to 17 Years | 0 (0.0%) | 0 (0.0%) |
| 18 to 34 Years | 0 (0.0%) | 0 (0.0%) |
| 35 to 64 Years | 0 (0.0%) | 0 (0.0%) |
| 65 to 74 Years | 0 (0.0%) | 0 (0.0%) |
| 75 Years and over | 0 (0.0%) | 0 (0.0%) |
Technology Access in Copper City
Computing Device Access in Copper City
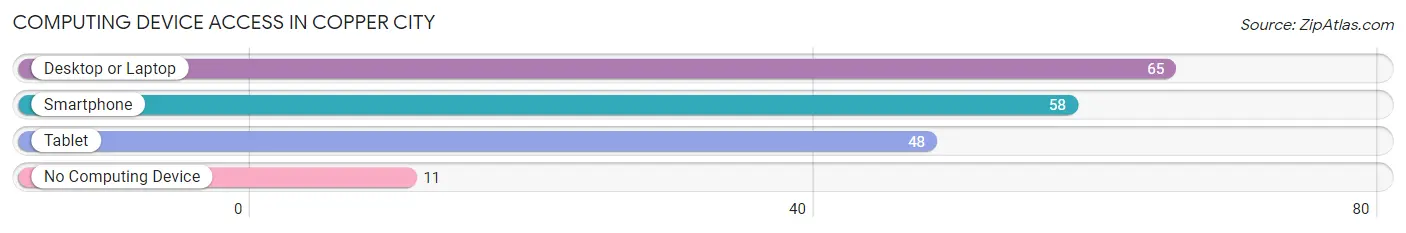
| Device Type | # Households | % Households |
| Desktop or Laptop | 65 | 83.3% |
| Smartphone | 58 | 74.4% |
| Tablet | 48 | 61.5% |
| No Computing Device | 11 | 14.1% |
| Total | 78 | 100.0% |
Internet Access in Copper City
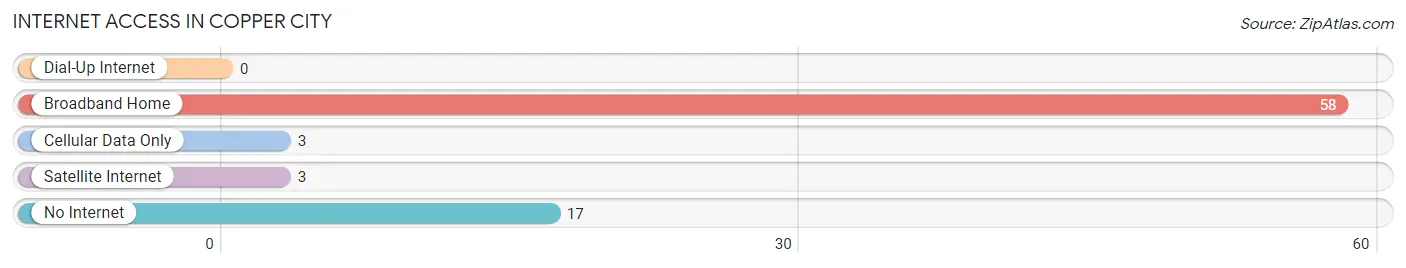
| Internet Type | # Households | % Households |
| Dial-Up Internet | 0 | 0.0% |
| Broadband Home | 58 | 74.4% |
| Cellular Data Only | 3 | 3.8% |
| Satellite Internet | 3 | 3.8% |
| No Internet | 17 | 21.8% |
| Total | 78 | 100.0% |
Copper City Summary
Copper City, Michigan is a small city located in the Upper Peninsula of Michigan. It is situated on the shores of Lake Superior, and is home to a population of just over 1,000 people. The city is known for its rich copper mining history, and is home to a number of historic sites and attractions.
Geography
Copper City is located in the Upper Peninsula of Michigan, on the shores of Lake Superior. The city is situated in the Keweenaw Peninsula, which is known for its copper mining history. The city is surrounded by forests and lakes, and is home to a number of outdoor recreational activities. The city is located approximately 30 miles from the nearest major city, Marquette.
Economy
Copper City’s economy is largely based on tourism and copper mining. The city is home to a number of historic sites and attractions, including the Copper City Mining Museum, which showcases the city’s copper mining history. The city is also home to a number of outdoor recreational activities, such as fishing, hunting, and camping. The city is also home to a number of small businesses, including restaurants, shops, and lodging.
Demographics
As of the 2010 census, Copper City had a population of 1,072 people. The population is largely white, with a small percentage of African Americans, Native Americans, and other races. The median household income is $37,500, and the median age is 44. The city is home to a number of churches, and the majority of the population is Christian.
History
Copper City was founded in 1845, and was originally known as Copper Harbor. The city was founded by a group of miners who were looking to exploit the area’s rich copper deposits. The city quickly grew, and by the late 19th century, it was one of the largest copper mining towns in the United States. The city’s copper mining industry declined in the early 20th century, and the city shifted its focus to tourism. Today, the city is home to a number of historic sites and attractions, and is a popular destination for outdoor recreation.
Conclusion
Copper City, Michigan is a small city located in the Upper Peninsula of Michigan. It is situated on the shores of Lake Superior, and is home to a population of just over 1,000 people. The city is known for its rich copper mining history, and is home to a number of historic sites and attractions. The city’s economy is largely based on tourism and copper mining, and the city is home to a number of small businesses. The population is largely white, with a small percentage of African Americans, Native Americans, and other races. Copper City was founded in 1845, and was originally known as Copper Harbor. The city quickly grew, and by the late 19th century, it was one of the largest copper mining towns in the United States. Today, the city is home to a number of historic sites and attractions, and is a popular destination for outdoor recreation.
Common Questions
What is Per Capita Income in Copper City?
Per Capita income in Copper City is $21,892.
What is the Median Family Income in Copper City?
Median Family Income in Copper City is $53,750.
What is the Median Household income in Copper City?
Median Household Income in Copper City is $48,333.
What is Income or Wage Gap in Copper City?
Income or Wage Gap in Copper City is 1.8%.
Women in Copper City earn 98.2 cents for every dollar earned by a man.
What is Inequality or Gini Index in Copper City?
Inequality or Gini Index in Copper City is 0.31.
What is the Total Population of Copper City?
Total Population of Copper City is 229.
What is the Total Male Population of Copper City?
Total Male Population of Copper City is 154.
What is the Total Female Population of Copper City?
Total Female Population of Copper City is 75.
What is the Ratio of Males per 100 Females in Copper City?
There are 205.33 Males per 100 Females in Copper City.
What is the Ratio of Females per 100 Males in Copper City?
There are 48.70 Females per 100 Males in Copper City.
What is the Median Population Age in Copper City?
Median Population Age in Copper City is 47.1 Years.
What is the Average Family Size in Copper City
Average Family Size in Copper City is 3.4 People.
What is the Average Household Size in Copper City
Average Household Size in Copper City is 2.9 People.
How Large is the Labor Force in Copper City?
There are 97 People in the Labor Forcein in Copper City.
What is the Percentage of People in the Labor Force in Copper City?
57.1% of People are in the Labor Force in Copper City.
What is the Unemployment Rate in Copper City?
Unemployment Rate in Copper City is 33.0%.