Mancelona, MI Map & Demographics
Mancelona Map
Mancelona Overview
$26,999
PER CAPITA INCOME
$49,205
AVG FAMILY INCOME
$50,329
AVG HOUSEHOLD INCOME
33.3%
WAGE / INCOME GAP [ % ]
66.7¢/ $1
WAGE / INCOME GAP [ $ ]
$12,229
FAMILY INCOME DEFICIT
0.43
INEQUALITY / GINI INDEX
1,622
TOTAL POPULATION
771
MALE POPULATION
851
FEMALE POPULATION
90.60
MALES / 100 FEMALES
110.38
FEMALES / 100 MALES
35.0
MEDIAN AGE
2.9
AVG FAMILY SIZE
2.4
AVG HOUSEHOLD SIZE
826
LABOR FORCE [ PEOPLE ]
68.0%
PERCENT IN LABOR FORCE
11.6%
UNEMPLOYMENT RATE
Mancelona Zip Codes
Mancelona Area Codes
Income in Mancelona
Income Overview in Mancelona
Per Capita Income in Mancelona is $26,999, while median incomes of families and households are $49,205 and $50,329 respectively.
| Characteristic | Number | Measure |
| Per Capita Income | 1,622 | $26,999 |
| Median Family Income | 414 | $49,205 |
| Mean Family Income | 414 | $78,909 |
| Median Household Income | 665 | $50,329 |
| Mean Household Income | 665 | $69,420 |
| Income Deficit | 414 | $12,229 |
| Wage / Income Gap (%) | 1,622 | 33.30% |
| Wage / Income Gap ($) | 1,622 | 66.70¢ per $1 |
| Gini / Inequality Index | 1,622 | 0.43 |
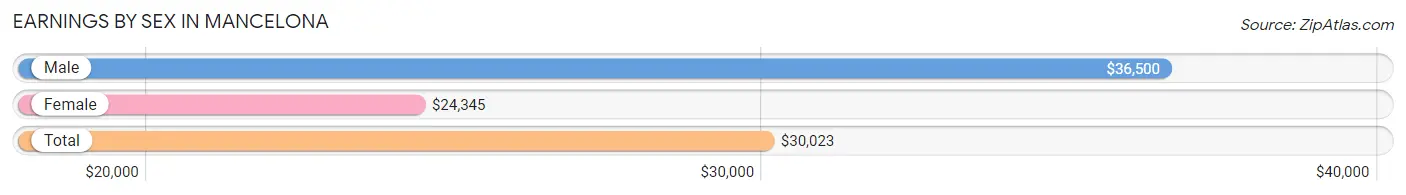
Earnings by Sex in Mancelona
Average Earnings in Mancelona are $30,023, $36,500 for men and $24,345 for women, a difference of 33.3%.
| Sex | Number | Average Earnings |
| Male | 368 (44.0%) | $36,500 |
| Female | 469 (56.0%) | $24,345 |
| Total | 837 (100.0%) | $30,023 |
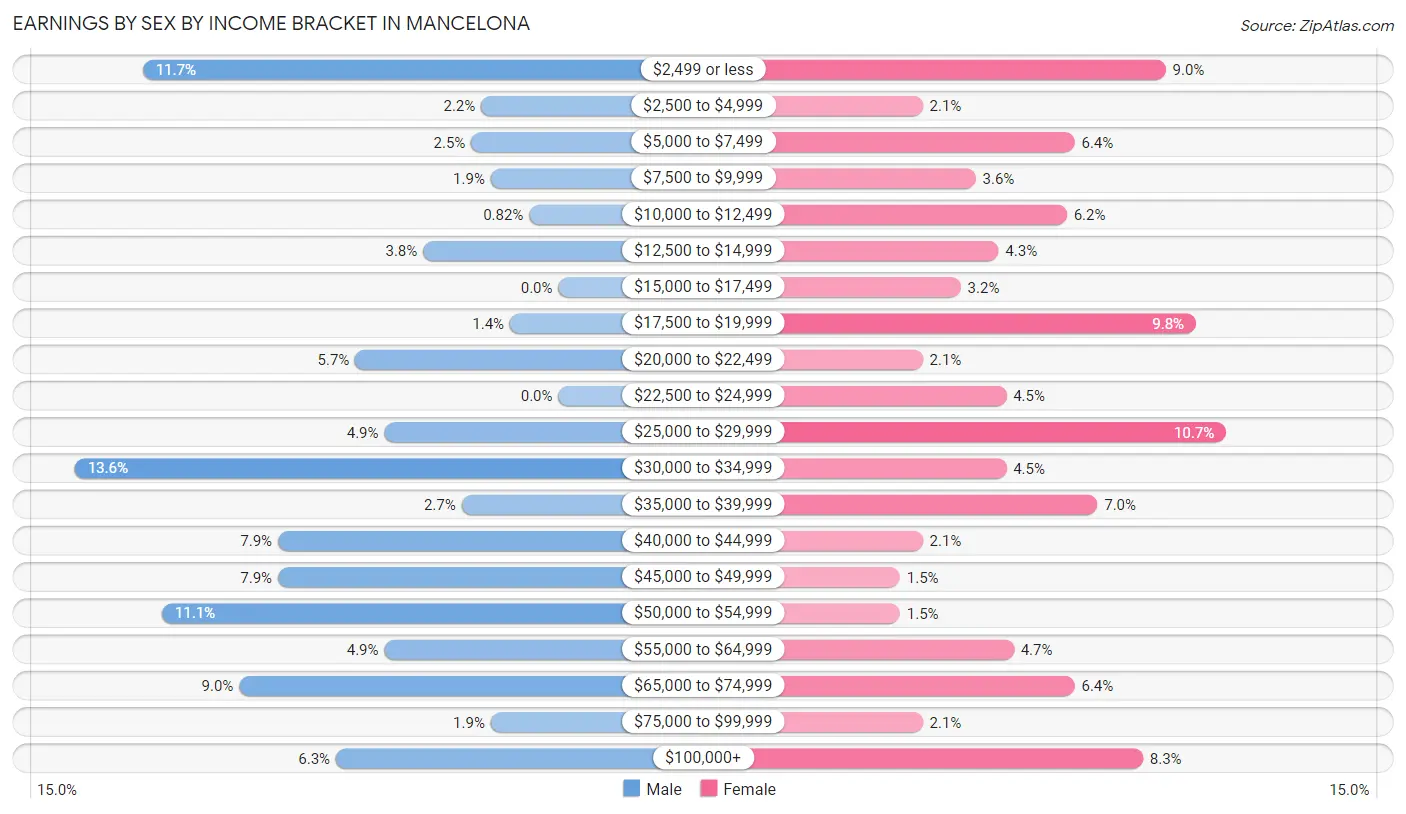
Earnings by Sex by Income Bracket in Mancelona
The most common earnings brackets in Mancelona are $30,000 to $34,999 for men (50 | 13.6%) and $25,000 to $29,999 for women (50 | 10.7%).
| Income | Male | Female |
| $2,499 or less | 43 (11.7%) | 42 (9.0%) |
| $2,500 to $4,999 | 8 (2.2%) | 10 (2.1%) |
| $5,000 to $7,499 | 9 (2.5%) | 30 (6.4%) |
| $7,500 to $9,999 | 7 (1.9%) | 17 (3.6%) |
| $10,000 to $12,499 | 3 (0.8%) | 29 (6.2%) |
| $12,500 to $14,999 | 14 (3.8%) | 20 (4.3%) |
| $15,000 to $17,499 | 0 (0.0%) | 15 (3.2%) |
| $17,500 to $19,999 | 5 (1.4%) | 46 (9.8%) |
| $20,000 to $22,499 | 21 (5.7%) | 10 (2.1%) |
| $22,500 to $24,999 | 0 (0.0%) | 21 (4.5%) |
| $25,000 to $29,999 | 18 (4.9%) | 50 (10.7%) |
| $30,000 to $34,999 | 50 (13.6%) | 21 (4.5%) |
| $35,000 to $39,999 | 10 (2.7%) | 33 (7.0%) |
| $40,000 to $44,999 | 29 (7.9%) | 10 (2.1%) |
| $45,000 to $49,999 | 29 (7.9%) | 7 (1.5%) |
| $50,000 to $54,999 | 41 (11.1%) | 7 (1.5%) |
| $55,000 to $64,999 | 18 (4.9%) | 22 (4.7%) |
| $65,000 to $74,999 | 33 (9.0%) | 30 (6.4%) |
| $75,000 to $99,999 | 7 (1.9%) | 10 (2.1%) |
| $100,000+ | 23 (6.2%) | 39 (8.3%) |
| Total | 368 (100.0%) | 469 (100.0%) |
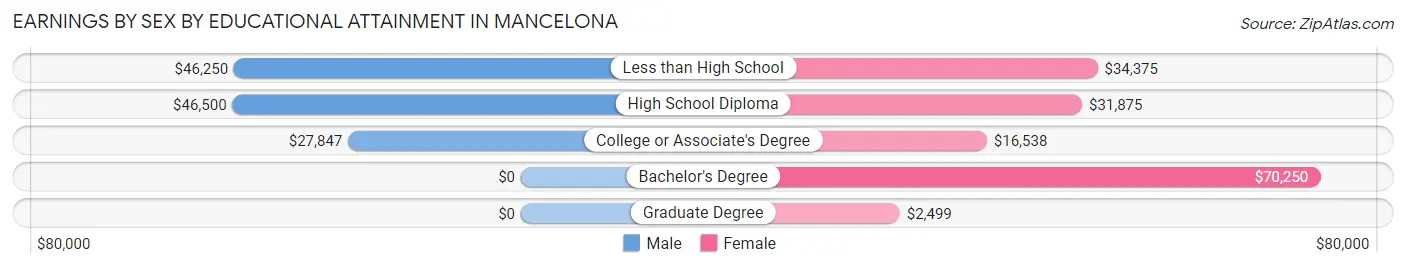
Earnings by Sex by Educational Attainment in Mancelona
Average earnings in Mancelona are $42,589 for men and $25,156 for women, a difference of 40.9%. Men with an educational attainment of high school diploma enjoy the highest average annual earnings of $46,500, while those with college or associate's degree education earn the least with $27,847. Women with an educational attainment of bachelor's degree earn the most with the average annual earnings of $70,250, while those with graduate degree education have the smallest earnings of $2,499.
| Educational Attainment | Male Income | Female Income |
| Less than High School | $46,250 | $34,375 |
| High School Diploma | $46,500 | $31,875 |
| College or Associate's Degree | $27,847 | $16,538 |
| Bachelor's Degree | - | - |
| Graduate Degree | - | - |
| Total | $42,589 | $25,156 |
Family Income in Mancelona
Family Income Brackets in Mancelona
According to the Mancelona family income data, there are 85 families falling into the $25,000 to $34,999 income range, which is the most common income bracket and makes up 20.5% of all families. Conversely, the less than $10,000 income bracket is the least frequent group with only 8 families (1.9%) belonging to this category.
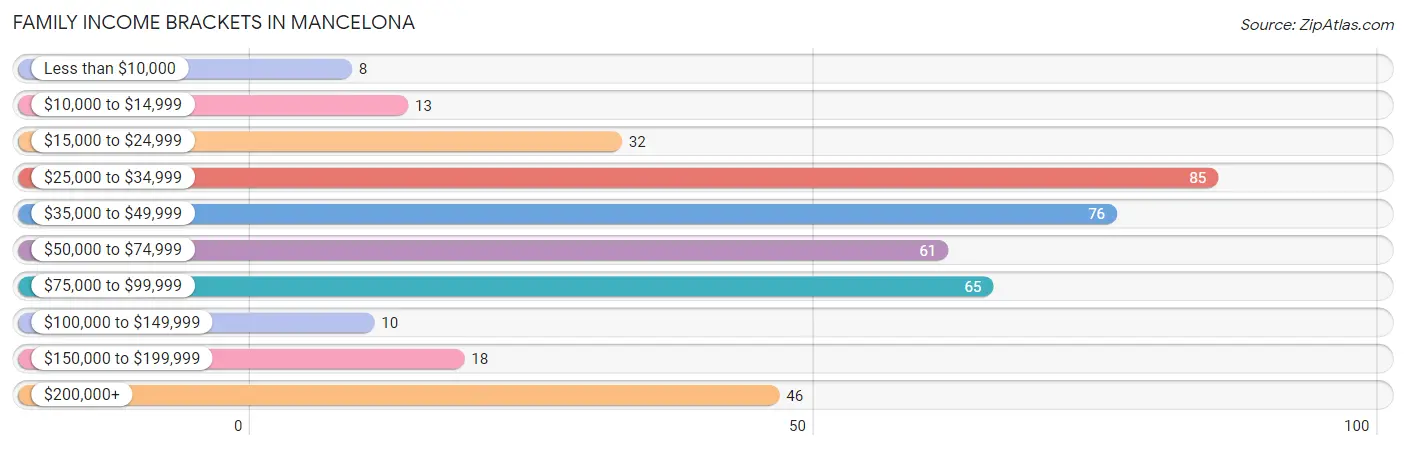
| Income Bracket | # Families | % Families |
| Less than $10,000 | 8 | 1.9% |
| $10,000 to $14,999 | 13 | 3.1% |
| $15,000 to $24,999 | 32 | 7.7% |
| $25,000 to $34,999 | 85 | 20.5% |
| $35,000 to $49,999 | 76 | 18.4% |
| $50,000 to $74,999 | 61 | 14.7% |
| $75,000 to $99,999 | 65 | 15.7% |
| $100,000 to $149,999 | 10 | 2.4% |
| $150,000 to $199,999 | 18 | 4.3% |
| $200,000+ | 46 | 11.1% |
Family Income by Famaliy Size in Mancelona
5-person families (63 | 15.2%) account for the highest median family income in Mancelona with $62,321 per family, while 2-person families (187 | 45.2%) have the highest median income of $26,771 per family member.
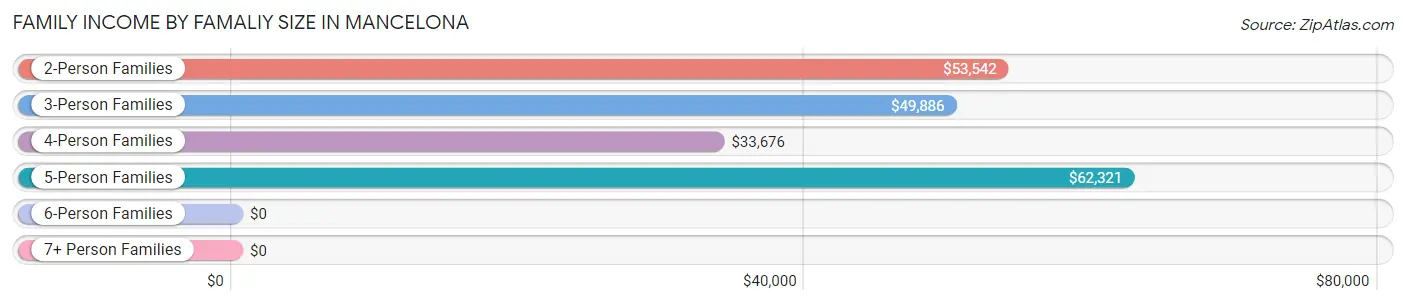
| Income Bracket | # Families | Median Income |
| 2-Person Families | 187 (45.2%) | $53,542 |
| 3-Person Families | 106 (25.6%) | $49,886 |
| 4-Person Families | 32 (7.7%) | $33,676 |
| 5-Person Families | 63 (15.2%) | $62,321 |
| 6-Person Families | 26 (6.3%) | $0 |
| 7+ Person Families | 0 (0.0%) | $0 |
| Total | 414 (100.0%) | $49,205 |
Family Income by Number of Earners in Mancelona
The median family income in Mancelona is $49,205, with families comprising 3+ earners (18) having the highest median family income of $98,889, while families with 1 earner (175) have the lowest median family income of $29,479, accounting for 4.3% and 42.3% of families, respectively.
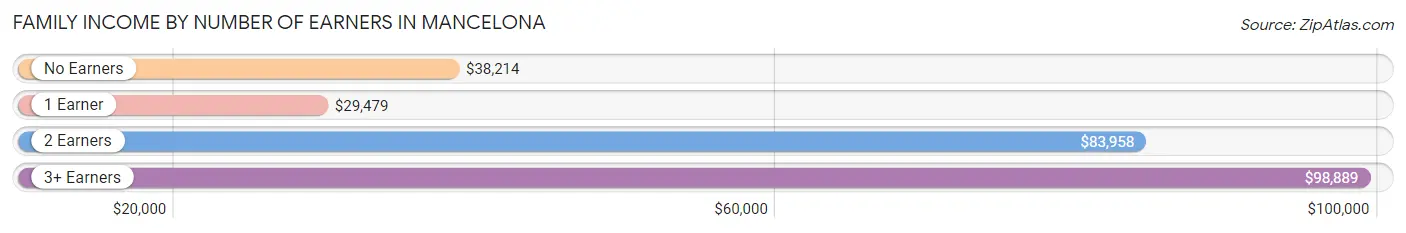
| Number of Earners | # Families | Median Income |
| No Earners | 36 (8.7%) | $38,214 |
| 1 Earner | 175 (42.3%) | $29,479 |
| 2 Earners | 185 (44.7%) | $83,958 |
| 3+ Earners | 18 (4.3%) | $98,889 |
| Total | 414 (100.0%) | $49,205 |
Household Income in Mancelona
Household Income Brackets in Mancelona
With 153 households falling in the category, the $25,000 to $34,999 income range is the most frequent in Mancelona, accounting for 23.0% of all households. In contrast, only 8 households (1.2%) fall into the less than $10,000 income bracket, making it the least populous group.
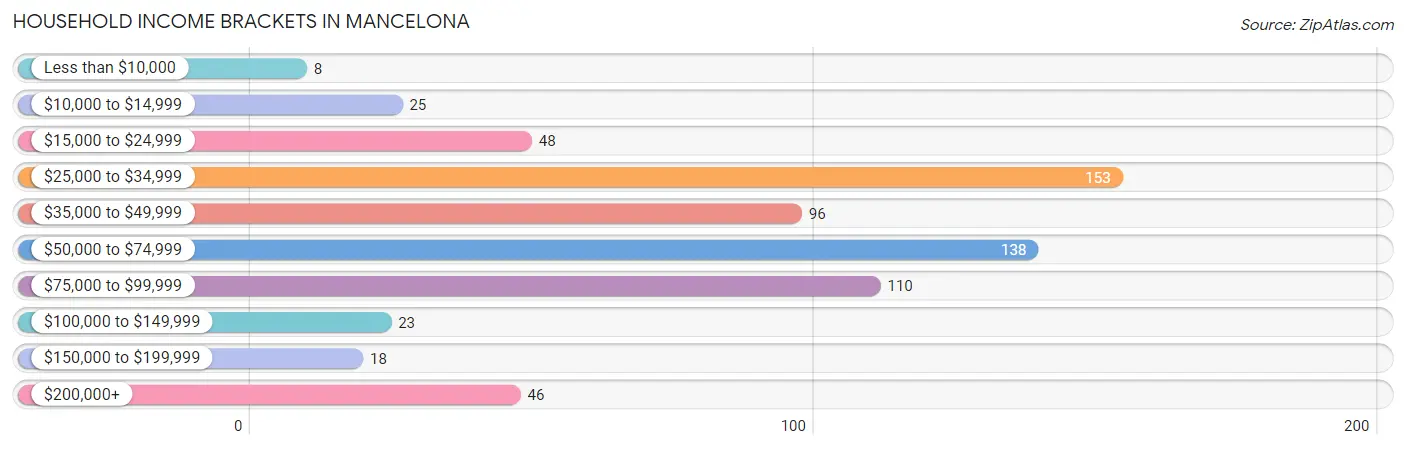
| Income Bracket | # Households | % Households |
| Less than $10,000 | 8 | 1.2% |
| $10,000 to $14,999 | 25 | 3.8% |
| $15,000 to $24,999 | 48 | 7.2% |
| $25,000 to $34,999 | 153 | 23.0% |
| $35,000 to $49,999 | 96 | 14.4% |
| $50,000 to $74,999 | 138 | 20.8% |
| $75,000 to $99,999 | 110 | 16.5% |
| $100,000 to $149,999 | 23 | 3.5% |
| $150,000 to $199,999 | 18 | 2.7% |
| $200,000+ | 46 | 6.9% |
Household Income by Householder Age in Mancelona
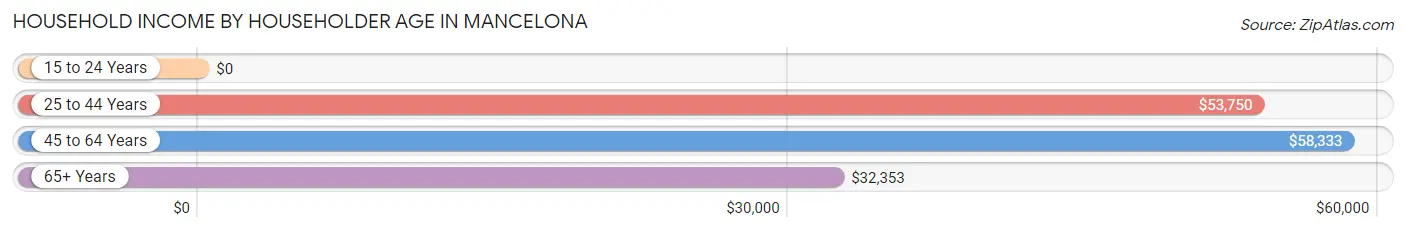
The median household income in Mancelona is $50,329, with the highest median household income of $58,333 found in the 45 to 64 years age bracket for the primary householder. A total of 222 households (33.4%) fall into this category. Meanwhile, the 15 to 24 years age bracket for the primary householder has the lowest median household income of $0, with 47 households (7.1%) in this group.
| Income Bracket | # Households | Median Income |
| 15 to 24 Years | 47 (7.1%) | $0 |
| 25 to 44 Years | 284 (42.7%) | $53,750 |
| 45 to 64 Years | 222 (33.4%) | $58,333 |
| 65+ Years | 112 (16.8%) | $32,353 |
| Total | 665 (100.0%) | $50,329 |
Poverty in Mancelona
Income Below Poverty by Sex and Age in Mancelona
With 17.8% poverty level for males and 22.4% for females among the residents of Mancelona, 5 year old males and under 5 year old females are the most vulnerable to poverty, with 26 males (83.9%) and 13 females (56.5%) in their respective age groups living below the poverty level.
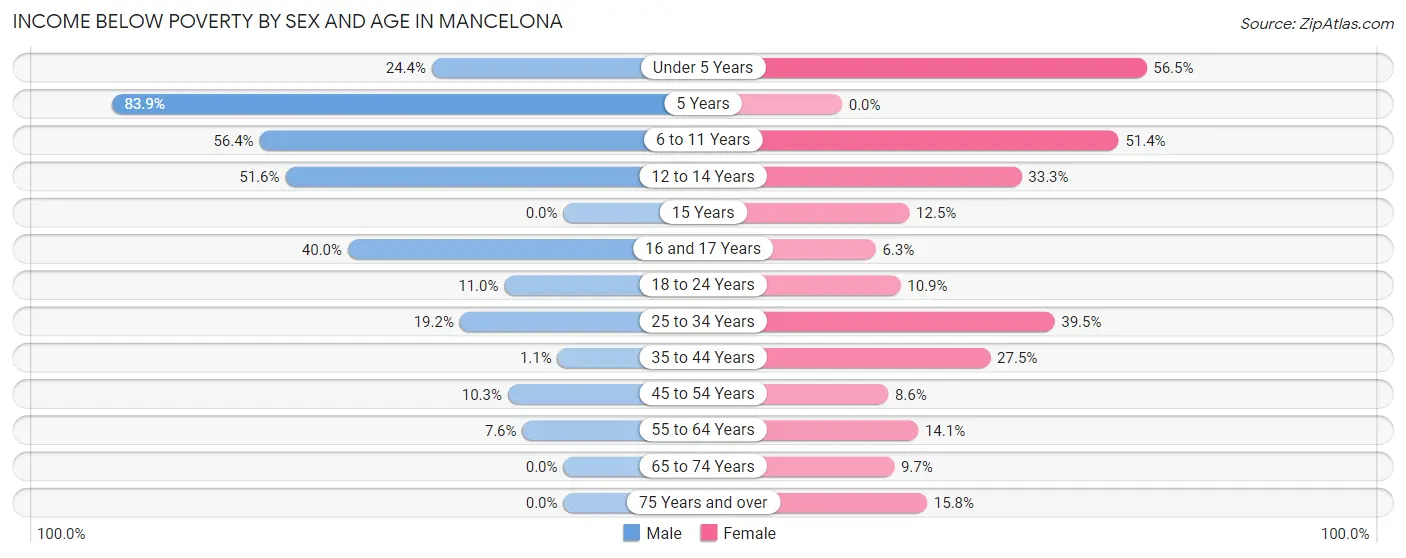
| Age Bracket | Male | Female |
| Under 5 Years | 21 (24.4%) | 13 (56.5%) |
| 5 Years | 26 (83.9%) | 0 (0.0%) |
| 6 to 11 Years | 22 (56.4%) | 19 (51.3%) |
| 12 to 14 Years | 16 (51.6%) | 17 (33.3%) |
| 15 Years | 0 (0.0%) | 6 (12.5%) |
| 16 and 17 Years | 4 (40.0%) | 1 (6.2%) |
| 18 to 24 Years | 8 (11.0%) | 10 (10.9%) |
| 25 to 34 Years | 20 (19.2%) | 43 (39.5%) |
| 35 to 44 Years | 1 (1.1%) | 46 (27.5%) |
| 45 to 54 Years | 10 (10.3%) | 9 (8.6%) |
| 55 to 64 Years | 7 (7.6%) | 14 (14.1%) |
| 65 to 74 Years | 0 (0.0%) | 6 (9.7%) |
| 75 Years and over | 0 (0.0%) | 6 (15.8%) |
| Total | 135 (17.8%) | 190 (22.4%) |
Income Above Poverty by Sex and Age in Mancelona
According to the poverty statistics in Mancelona, males aged 15 years and females aged 5 years are the age groups that are most secure financially, with 100.0% of males and 100.0% of females in these age groups living above the poverty line.
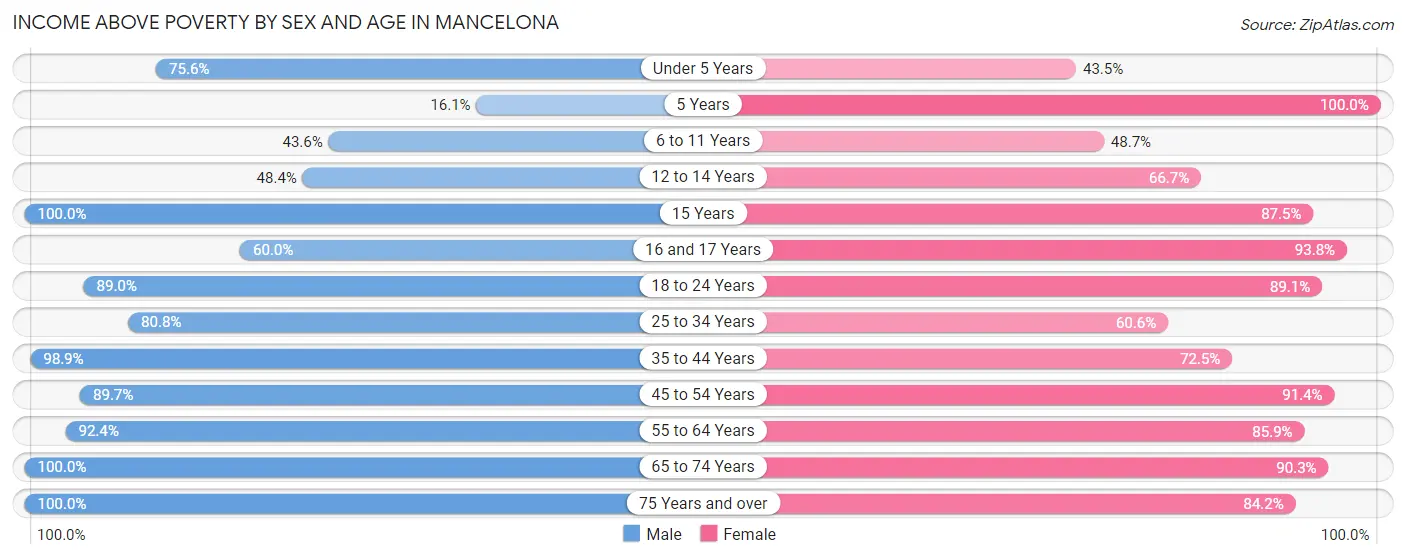
| Age Bracket | Male | Female |
| Under 5 Years | 65 (75.6%) | 10 (43.5%) |
| 5 Years | 5 (16.1%) | 3 (100.0%) |
| 6 to 11 Years | 17 (43.6%) | 18 (48.6%) |
| 12 to 14 Years | 15 (48.4%) | 34 (66.7%) |
| 15 Years | 44 (100.0%) | 42 (87.5%) |
| 16 and 17 Years | 6 (60.0%) | 15 (93.8%) |
| 18 to 24 Years | 65 (89.0%) | 82 (89.1%) |
| 25 to 34 Years | 84 (80.8%) | 66 (60.6%) |
| 35 to 44 Years | 92 (98.9%) | 121 (72.5%) |
| 45 to 54 Years | 87 (89.7%) | 96 (91.4%) |
| 55 to 64 Years | 85 (92.4%) | 85 (85.9%) |
| 65 to 74 Years | 41 (100.0%) | 56 (90.3%) |
| 75 Years and over | 16 (100.0%) | 32 (84.2%) |
| Total | 622 (82.2%) | 660 (77.6%) |
Income Below Poverty Among Married-Couple Families in Mancelona
The poverty statistics for married-couple families in Mancelona show that 6.5% or 17 of the total 263 families live below the poverty line. Families with 1 or 2 children have the highest poverty rate of 12.3%, comprising of 9 families. On the other hand, families with no children have the lowest poverty rate of 3.3%, which includes 5 families.
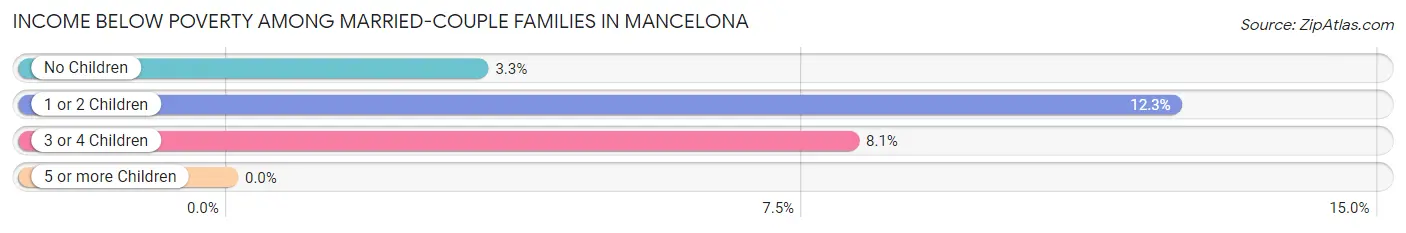
| Children | Above Poverty | Below Poverty |
| No Children | 148 (96.7%) | 5 (3.3%) |
| 1 or 2 Children | 64 (87.7%) | 9 (12.3%) |
| 3 or 4 Children | 34 (91.9%) | 3 (8.1%) |
| 5 or more Children | 0 (0.0%) | 0 (0.0%) |
| Total | 246 (93.5%) | 17 (6.5%) |
Income Below Poverty Among Single-Parent Households in Mancelona
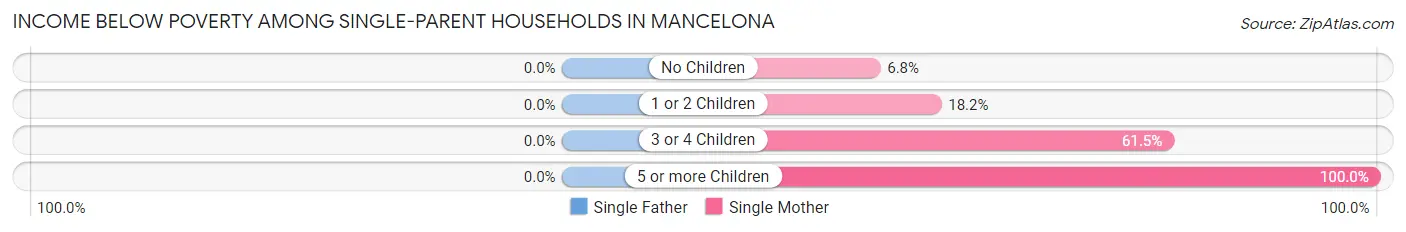
| Children | Single Father | Single Mother |
| No Children | 0 (0.0%) | 3 (6.8%) |
| 1 or 2 Children | 0 (0.0%) | 10 (18.2%) |
| 3 or 4 Children | 0 (0.0%) | 8 (61.5%) |
| 5 or more Children | 0 (0.0%) | 18 (100.0%) |
| Total | 0 (0.0%) | 39 (30.0%) |
Income Below Poverty Among Married-Couple vs Single-Parent Households in Mancelona
The poverty data for Mancelona shows that 17 of the married-couple family households (6.5%) and 39 of the single-parent households (25.8%) are living below the poverty level. Within the married-couple family households, those with 1 or 2 children have the highest poverty rate, with 9 households (12.3%) falling below the poverty line. Among the single-parent households, those with 5 or more children have the highest poverty rate, with 18 household (100.0%) living below poverty.
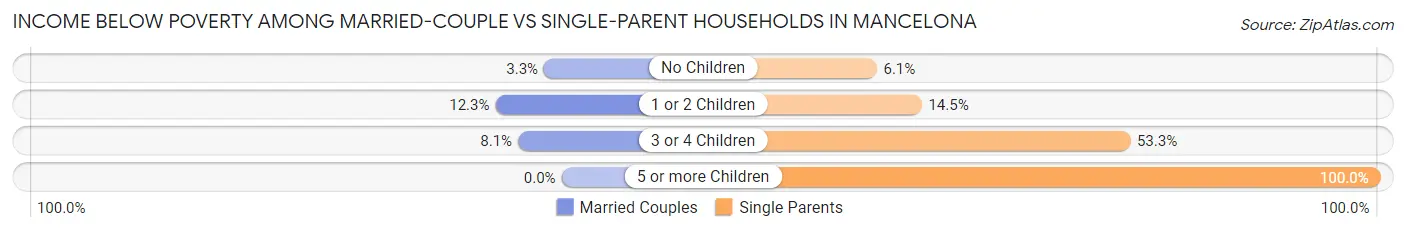
| Children | Married-Couple Families | Single-Parent Households |
| No Children | 5 (3.3%) | 3 (6.1%) |
| 1 or 2 Children | 9 (12.3%) | 10 (14.5%) |
| 3 or 4 Children | 3 (8.1%) | 8 (53.3%) |
| 5 or more Children | 0 (0.0%) | 18 (100.0%) |
| Total | 17 (6.5%) | 39 (25.8%) |
Race in Mancelona
The most populous races in Mancelona are White / Caucasian (1,413 | 87.1%), Black / African American (111 | 6.8%), and Two or more Races (77 | 4.8%).
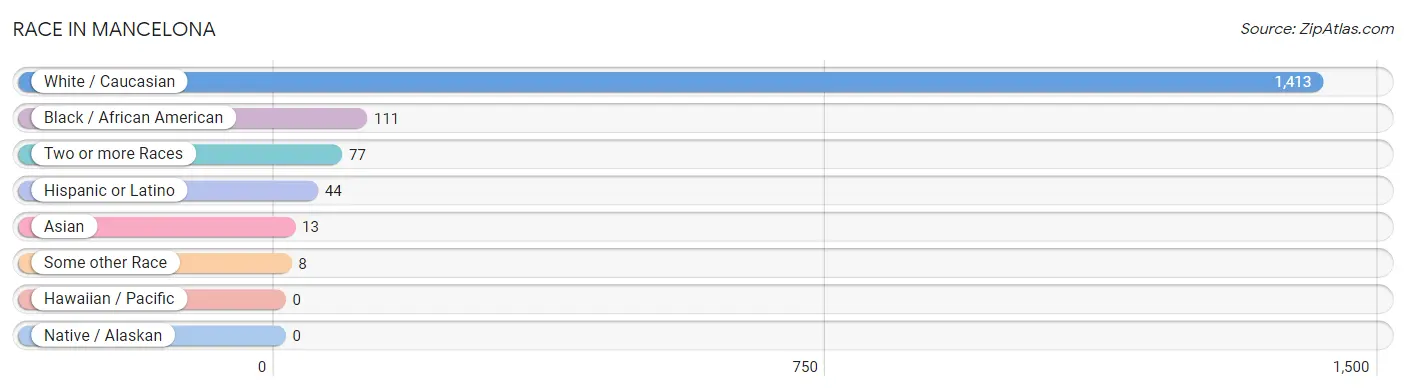
| Race | # Population | % Population |
| Asian | 13 | 0.8% |
| Black / African American | 111 | 6.8% |
| Hawaiian / Pacific | 0 | 0.0% |
| Hispanic or Latino | 44 | 2.7% |
| Native / Alaskan | 0 | 0.0% |
| White / Caucasian | 1,413 | 87.1% |
| Two or more Races | 77 | 4.8% |
| Some other Race | 8 | 0.5% |
| Total | 1,622 | 100.0% |
Ancestry in Mancelona
The most populous ancestries reported in Mancelona are English (333 | 20.5%), German (288 | 17.8%), American (144 | 8.9%), Irish (127 | 7.8%), and Dutch (83 | 5.1%), together accounting for 60.1% of all Mancelona residents.
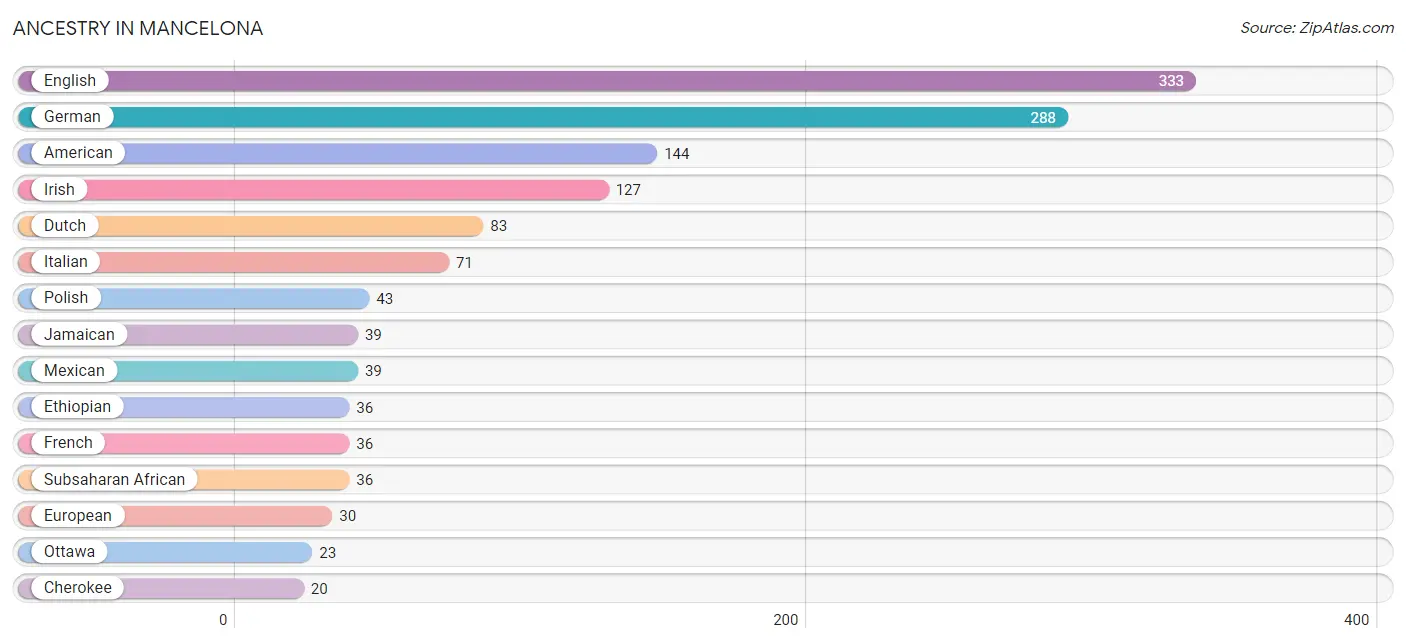
| Ancestry | # Population | % Population |
| American | 144 | 8.9% |
| Austrian | 5 | 0.3% |
| Belgian | 3 | 0.2% |
| Blackfeet | 1 | 0.1% |
| British | 3 | 0.2% |
| Canadian | 3 | 0.2% |
| Cherokee | 20 | 1.2% |
| Chippewa | 7 | 0.4% |
| Czech | 3 | 0.2% |
| Dutch | 83 | 5.1% |
| English | 333 | 20.5% |
| Ethiopian | 36 | 2.2% |
| European | 30 | 1.8% |
| Finnish | 11 | 0.7% |
| French | 36 | 2.2% |
| French Canadian | 13 | 0.8% |
| German | 288 | 17.8% |
| Indian (Asian) | 4 | 0.3% |
| Irish | 127 | 7.8% |
| Italian | 71 | 4.4% |
| Jamaican | 39 | 2.4% |
| Korean | 1 | 0.1% |
| Mexican | 39 | 2.4% |
| Norwegian | 5 | 0.3% |
| Ottawa | 23 | 1.4% |
| Polish | 43 | 2.6% |
| Portuguese | 12 | 0.7% |
| Scottish | 15 | 0.9% |
| Spaniard | 5 | 0.3% |
| Sri Lankan | 9 | 0.5% |
| Subsaharan African | 36 | 2.2% |
| Swedish | 9 | 0.5% |
| Tongan | 8 | 0.5% | View All 33 Rows |
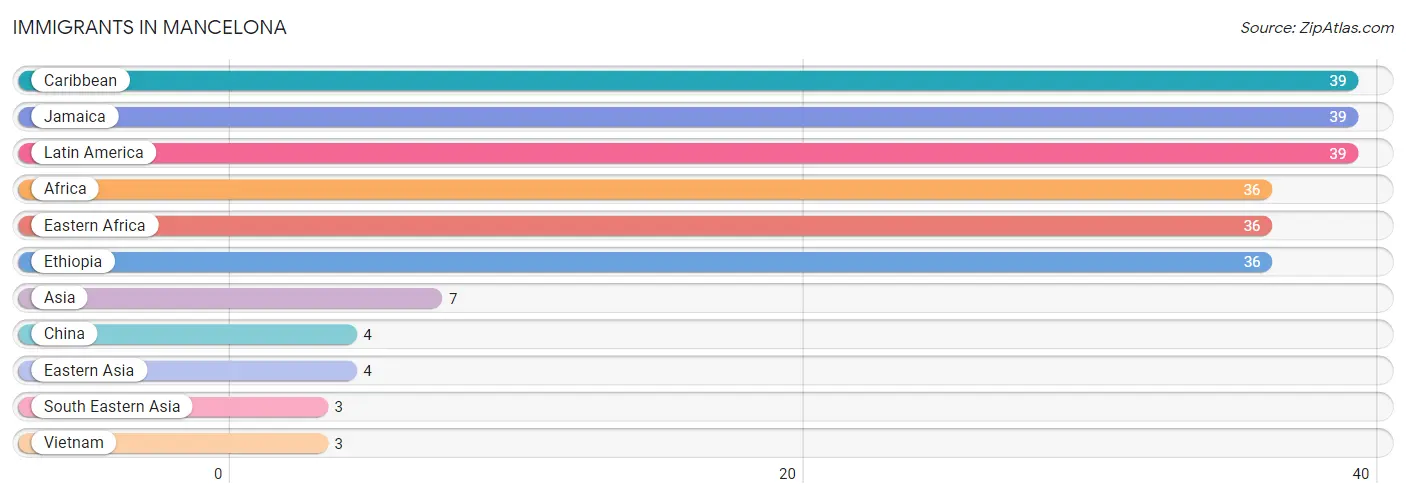
Immigrants in Mancelona
The most numerous immigrant groups reported in Mancelona came from Caribbean (39 | 2.4%), Jamaica (39 | 2.4%), Latin America (39 | 2.4%), Africa (36 | 2.2%), and Eastern Africa (36 | 2.2%), together accounting for 11.6% of all Mancelona residents.
| Immigration Origin | # Population | % Population |
| Africa | 36 | 2.2% |
| Asia | 7 | 0.4% |
| Caribbean | 39 | 2.4% |
| China | 4 | 0.3% |
| Eastern Africa | 36 | 2.2% |
| Eastern Asia | 4 | 0.3% |
| Ethiopia | 36 | 2.2% |
| Jamaica | 39 | 2.4% |
| Latin America | 39 | 2.4% |
| South Eastern Asia | 3 | 0.2% |
| Vietnam | 3 | 0.2% | View All 11 Rows |
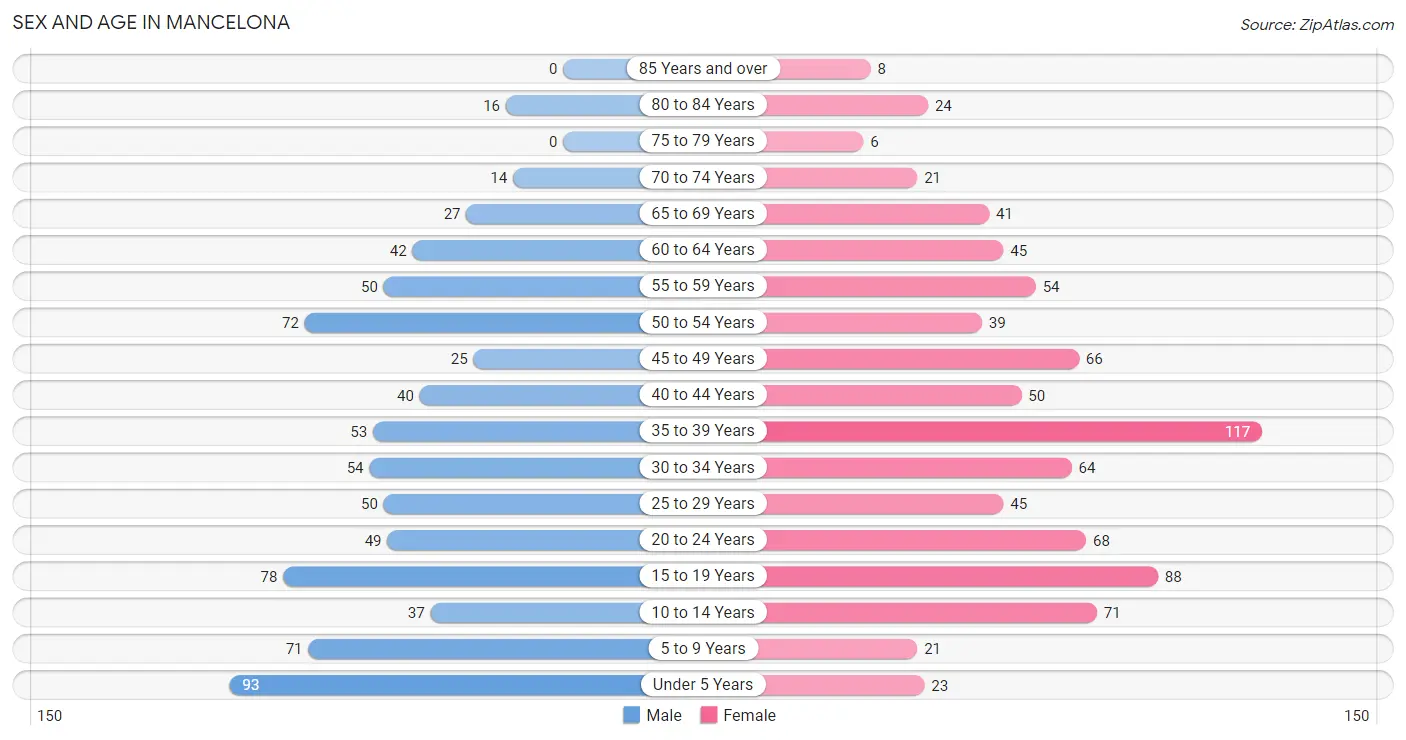
Sex and Age in Mancelona
Sex and Age in Mancelona
The most populous age groups in Mancelona are Under 5 Years (93 | 12.1%) for men and 35 to 39 Years (117 | 13.8%) for women.
| Age Bracket | Male | Female |
| Under 5 Years | 93 (12.1%) | 23 (2.7%) |
| 5 to 9 Years | 71 (9.2%) | 21 (2.5%) |
| 10 to 14 Years | 37 (4.8%) | 71 (8.3%) |
| 15 to 19 Years | 78 (10.1%) | 88 (10.3%) |
| 20 to 24 Years | 49 (6.4%) | 68 (8.0%) |
| 25 to 29 Years | 50 (6.5%) | 45 (5.3%) |
| 30 to 34 Years | 54 (7.0%) | 64 (7.5%) |
| 35 to 39 Years | 53 (6.9%) | 117 (13.8%) |
| 40 to 44 Years | 40 (5.2%) | 50 (5.9%) |
| 45 to 49 Years | 25 (3.2%) | 66 (7.8%) |
| 50 to 54 Years | 72 (9.3%) | 39 (4.6%) |
| 55 to 59 Years | 50 (6.5%) | 54 (6.4%) |
| 60 to 64 Years | 42 (5.4%) | 45 (5.3%) |
| 65 to 69 Years | 27 (3.5%) | 41 (4.8%) |
| 70 to 74 Years | 14 (1.8%) | 21 (2.5%) |
| 75 to 79 Years | 0 (0.0%) | 6 (0.7%) |
| 80 to 84 Years | 16 (2.1%) | 24 (2.8%) |
| 85 Years and over | 0 (0.0%) | 8 (0.9%) |
| Total | 771 (100.0%) | 851 (100.0%) |
Families and Households in Mancelona
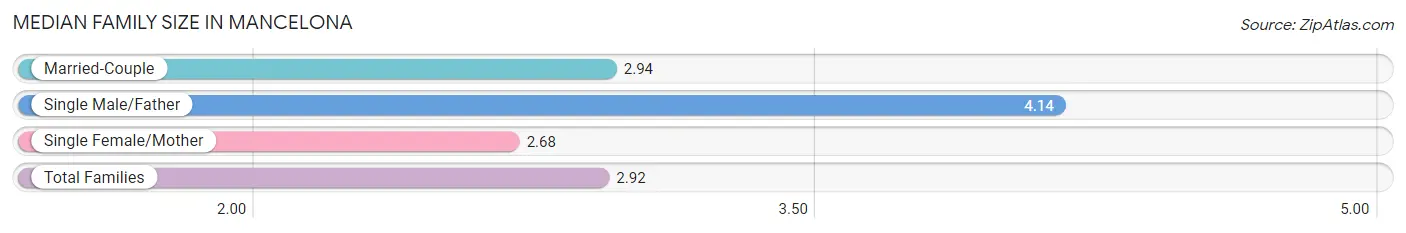
Median Family Size in Mancelona
The median family size in Mancelona is 2.92 persons per family, with single male/father families (21 | 5.1%) accounting for the largest median family size of 4.14 persons per family. On the other hand, single female/mother families (130 | 31.4%) represent the smallest median family size with 2.68 persons per family.
| Family Type | # Families | Family Size |
| Married-Couple | 263 (63.5%) | 2.94 |
| Single Male/Father | 21 (5.1%) | 4.14 |
| Single Female/Mother | 130 (31.4%) | 2.68 |
| Total Families | 414 (100.0%) | 2.92 |
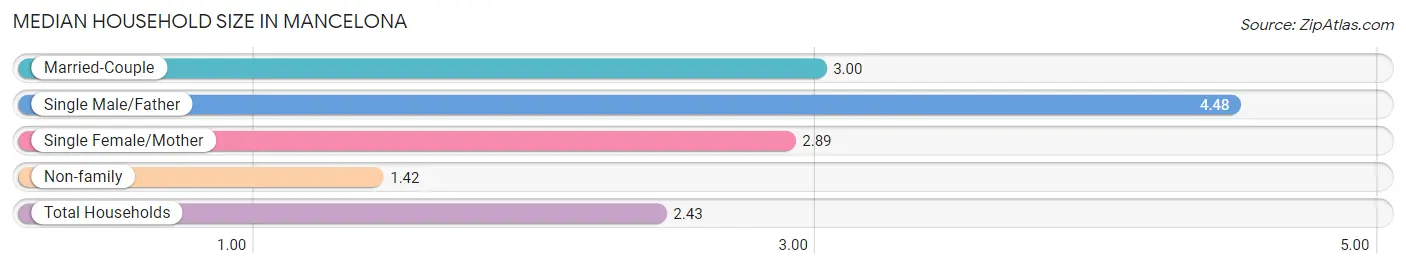
Median Household Size in Mancelona
The median household size in Mancelona is 2.43 persons per household, with single male/father households (21 | 3.2%) accounting for the largest median household size of 4.48 persons per household. non-family households (251 | 37.7%) represent the smallest median household size with 1.42 persons per household.
| Household Type | # Households | Household Size |
| Married-Couple | 263 (39.6%) | 3.00 |
| Single Male/Father | 21 (3.2%) | 4.48 |
| Single Female/Mother | 130 (19.6%) | 2.89 |
| Non-family | 251 (37.7%) | 1.42 |
| Total Households | 665 (100.0%) | 2.43 |
Household Size by Marriage Status in Mancelona
Out of a total of 665 households in Mancelona, 414 (62.3%) are family households, while 251 (37.7%) are nonfamily households. The most numerous type of family households are 2-person households, comprising 176, and the most common type of nonfamily households are 1-person households, comprising 148.
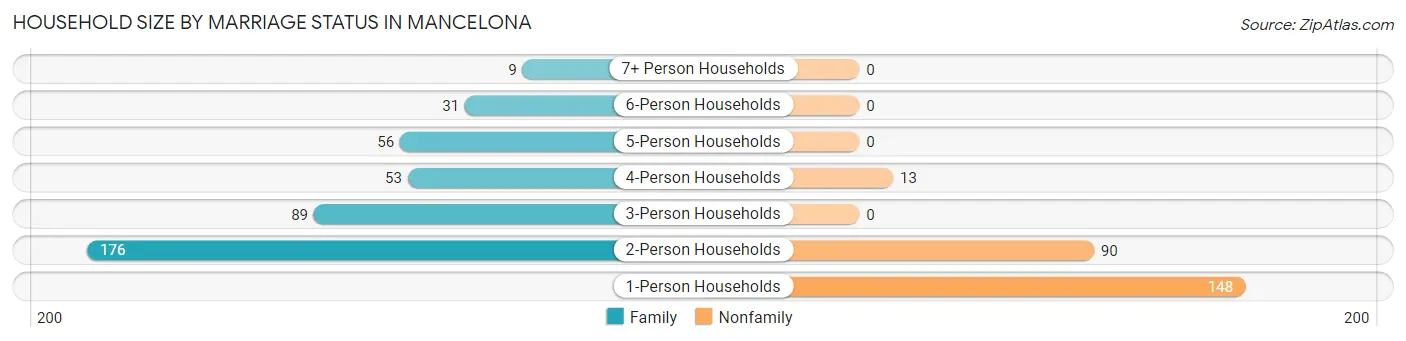
| Household Size | Family Households | Nonfamily Households |
| 1-Person Households | - | 148 (22.3%) |
| 2-Person Households | 176 (26.5%) | 90 (13.5%) |
| 3-Person Households | 89 (13.4%) | 0 (0.0%) |
| 4-Person Households | 53 (8.0%) | 13 (1.9%) |
| 5-Person Households | 56 (8.4%) | 0 (0.0%) |
| 6-Person Households | 31 (4.7%) | 0 (0.0%) |
| 7+ Person Households | 9 (1.3%) | 0 (0.0%) |
| Total | 414 (62.3%) | 251 (37.7%) |
Female Fertility in Mancelona
Fertility by Age in Mancelona
Average fertility rate in Mancelona is 26.0 births per 1,000 women. Women in the age bracket of 20 to 34 years have the highest fertility rate with 73.0 births per 1,000 women. Women in the age bracket of 20 to 34 years acount for 100.0% of all women with births.
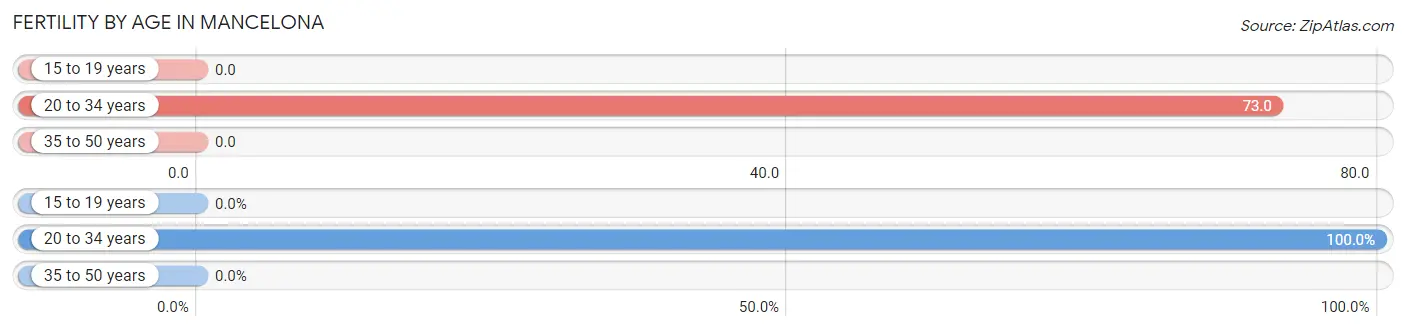
| Age Bracket | Women with Births | Births / 1,000 Women |
| 15 to 19 years | 0 (0.0%) | 0.0 |
| 20 to 34 years | 13 (100.0%) | 73.0 |
| 35 to 50 years | 0 (0.0%) | 0.0 |
| Total | 13 (100.0%) | 26.0 |
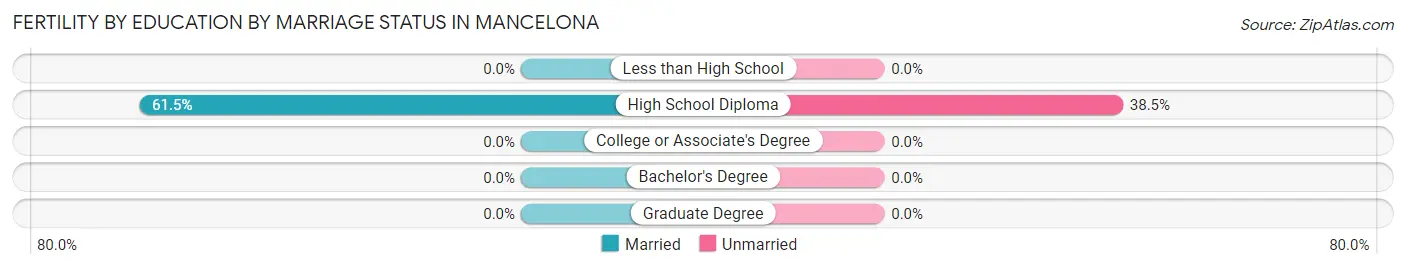
Fertility by Age by Marriage Status in Mancelona
61.5% of women with births (13) in Mancelona are married. The highest percentage of unmarried women with births falls into 20 to 34 years age bracket with 38.5% of them unmarried at the time of birth, while the lowest percentage of unmarried women with births belong to 20 to 34 years age bracket with 38.5% of them unmarried.
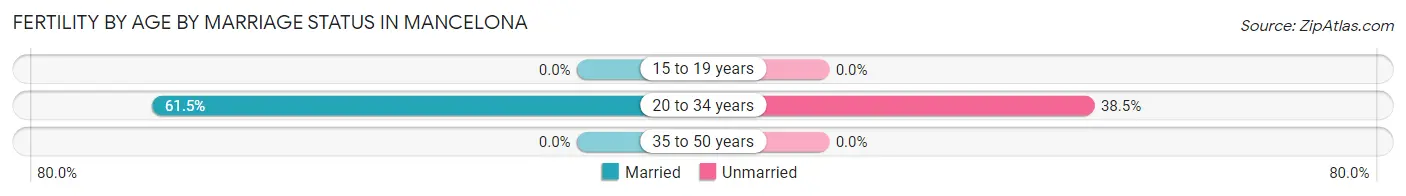
| Age Bracket | Married | Unmarried |
| 15 to 19 years | 0 (0.0%) | 0 (0.0%) |
| 20 to 34 years | 8 (61.5%) | 5 (38.5%) |
| 35 to 50 years | 0 (0.0%) | 0 (0.0%) |
| Total | 8 (61.5%) | 5 (38.5%) |
Fertility by Education in Mancelona
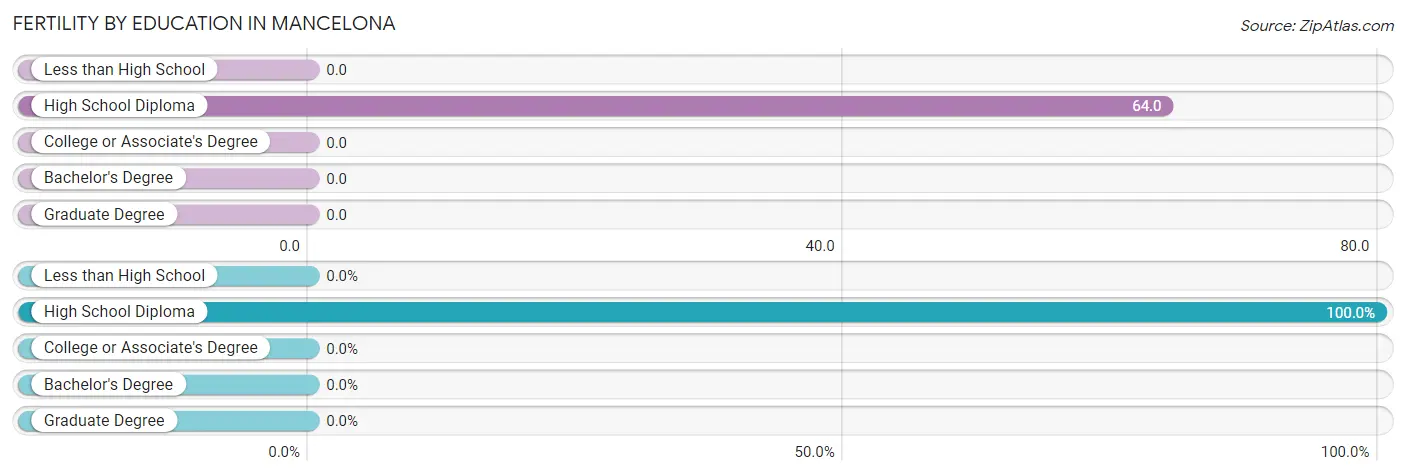
| Educational Attainment | Women with Births | Births / 1,000 Women |
| Less than High School | 0 (0.0%) | 0.0 |
| High School Diploma | 13 (100.0%) | 64.0 |
| College or Associate's Degree | 0 (0.0%) | 0.0 |
| Bachelor's Degree | 0 (0.0%) | 0.0 |
| Graduate Degree | 0 (0.0%) | 0.0 |
| Total | 13 (100.0%) | 26.0 |
Fertility by Education by Marriage Status in Mancelona
38.5% of women with births in Mancelona are unmarried. Women with the educational attainment of high school diploma are most likely to be married with 61.5% of them married at childbirth, while women with the educational attainment of high school diploma are least likely to be married with 38.5% of them unmarried at childbirth.
| Educational Attainment | Married | Unmarried |
| Less than High School | 0 (0.0%) | 0 (0.0%) |
| High School Diploma | 8 (61.5%) | 5 (38.5%) |
| College or Associate's Degree | 0 (0.0%) | 0 (0.0%) |
| Bachelor's Degree | 0 (0.0%) | 0 (0.0%) |
| Graduate Degree | 0 (0.0%) | 0 (0.0%) |
| Total | 8 (61.5%) | 5 (38.5%) |
Employment Characteristics in Mancelona
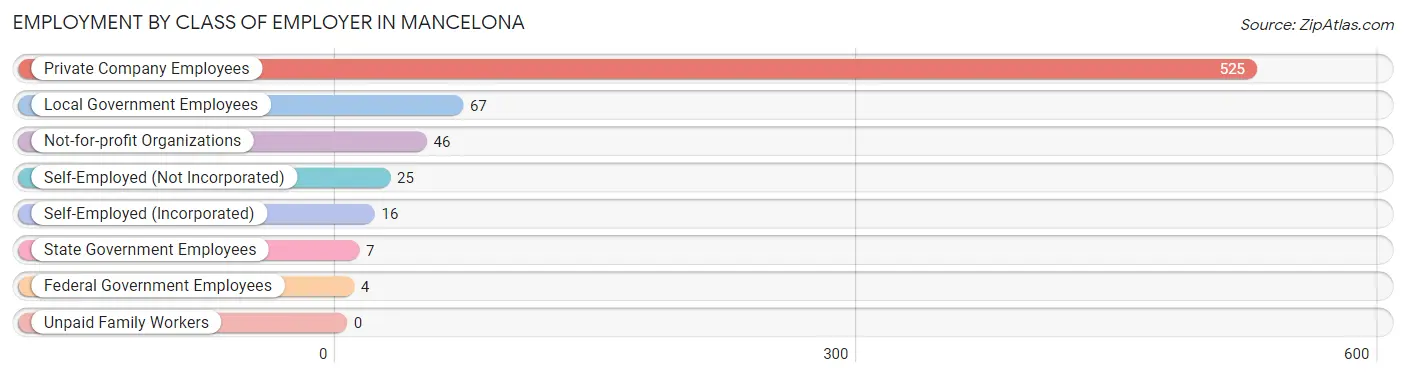
Employment by Class of Employer in Mancelona
Among the 690 employed individuals in Mancelona, private company employees (525 | 76.1%), local government employees (67 | 9.7%), and not-for-profit organizations (46 | 6.7%) make up the most common classes of employment.
| Employer Class | # Employees | % Employees |
| Private Company Employees | 525 | 76.1% |
| Self-Employed (Incorporated) | 16 | 2.3% |
| Self-Employed (Not Incorporated) | 25 | 3.6% |
| Not-for-profit Organizations | 46 | 6.7% |
| Local Government Employees | 67 | 9.7% |
| State Government Employees | 7 | 1.0% |
| Federal Government Employees | 4 | 0.6% |
| Unpaid Family Workers | 0 | 0.0% |
| Total | 690 | 100.0% |
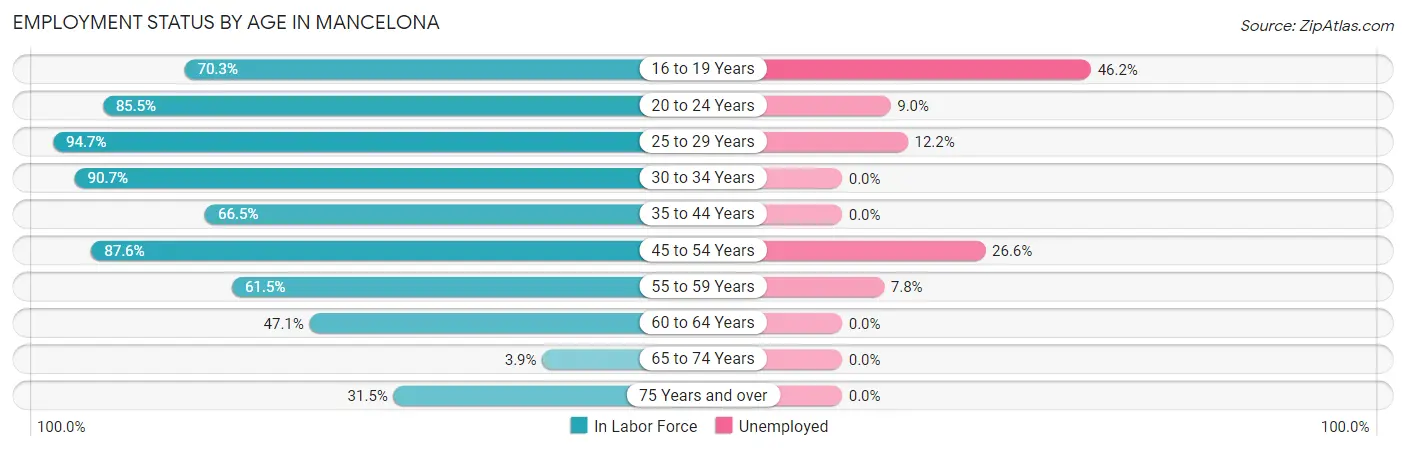
Employment Status by Age in Mancelona
According to the labor force statistics for Mancelona, out of the total population over 16 years of age (1,214), 68.0% or 826 individuals are in the labor force, with 11.6% or 96 of them unemployed. The age group with the highest labor force participation rate is 25 to 29 years, with 94.7% or 90 individuals in the labor force. Within the labor force, the 16 to 19 years age range has the highest percentage of unemployed individuals, with 46.2% or 24 of them being unemployed.
| Age Bracket | In Labor Force | Unemployed |
| 16 to 19 Years | 52 (70.3%) | 24 (46.2%) |
| 20 to 24 Years | 100 (85.5%) | 9 (9.0%) |
| 25 to 29 Years | 90 (94.7%) | 11 (12.2%) |
| 30 to 34 Years | 107 (90.7%) | 0 (0.0%) |
| 35 to 44 Years | 173 (66.5%) | 0 (0.0%) |
| 45 to 54 Years | 177 (87.6%) | 47 (26.6%) |
| 55 to 59 Years | 64 (61.5%) | 5 (7.8%) |
| 60 to 64 Years | 41 (47.1%) | 0 (0.0%) |
| 65 to 74 Years | 4 (3.9%) | 0 (0.0%) |
| 75 Years and over | 17 (31.5%) | 0 (0.0%) |
| Total | 826 (68.0%) | 96 (11.6%) |
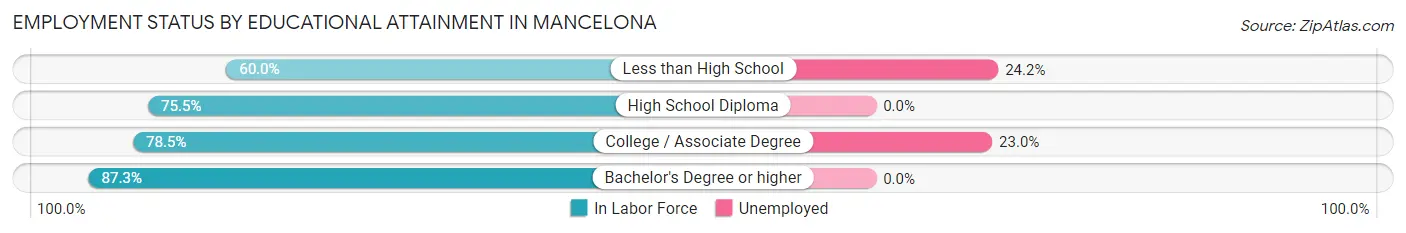
Employment Status by Educational Attainment in Mancelona
According to labor force statistics for Mancelona, 75.3% of individuals (652) out of the total population between 25 and 64 years of age (866) are in the labor force, with 9.7% or 63 of them being unemployed. The group with the highest labor force participation rate are those with the educational attainment of bachelor's degree or higher, with 87.3% or 55 individuals in the labor force. Within the labor force, individuals with less than high school education have the highest percentage of unemployment, with 24.2% or 16 of them being unemployed.
| Educational Attainment | In Labor Force | Unemployed |
| Less than High School | 66 (60.0%) | 27 (24.2%) |
| High School Diploma | 327 (75.5%) | 0 (0.0%) |
| College / Associate Degree | 204 (78.5%) | 60 (23.0%) |
| Bachelor's Degree or higher | 55 (87.3%) | 0 (0.0%) |
| Total | 652 (75.3%) | 84 (9.7%) |
Employment Occupations by Sex in Mancelona
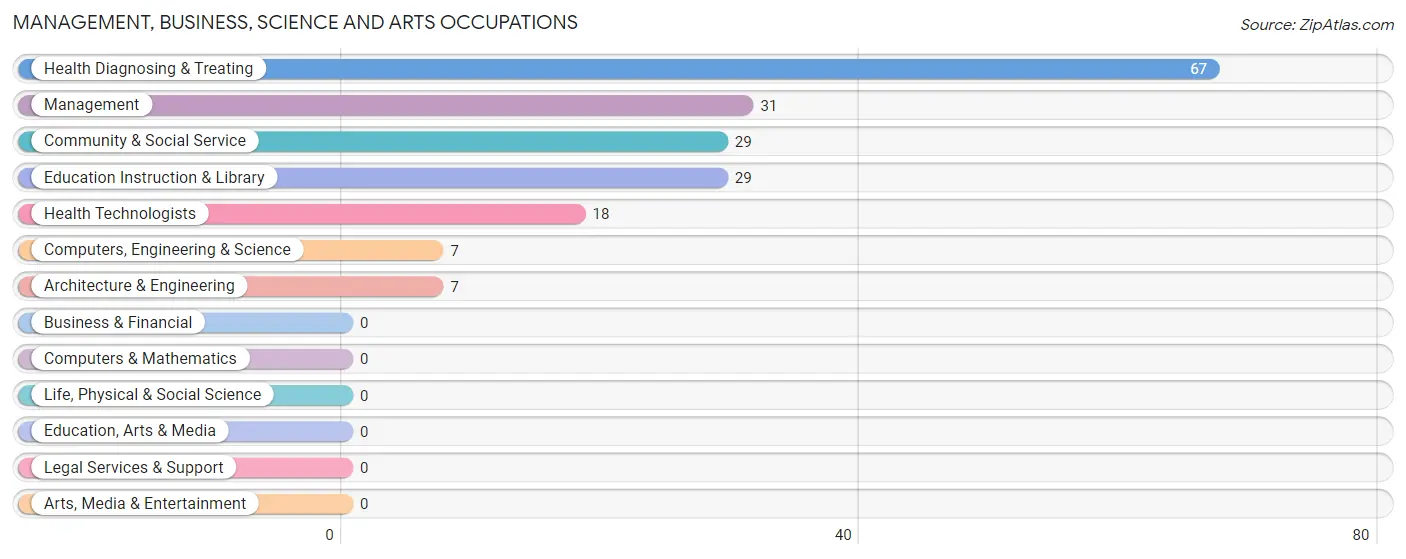
Management, Business, Science and Arts Occupations
The most common Management, Business, Science and Arts occupations in Mancelona are Health Diagnosing & Treating (67 | 9.2%), Management (31 | 4.3%), Community & Social Service (29 | 4.0%), Education Instruction & Library (29 | 4.0%), and Health Technologists (18 | 2.5%).
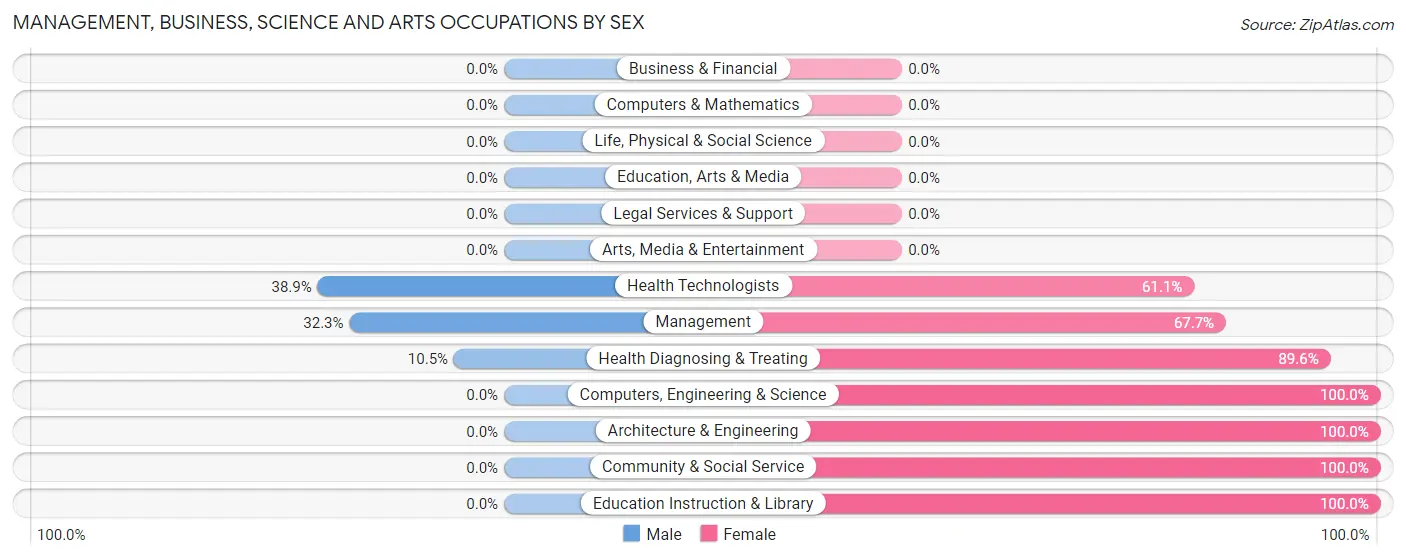
Management, Business, Science and Arts Occupations by Sex
Within the Management, Business, Science and Arts occupations in Mancelona, the most male-oriented occupations are Health Technologists (38.9%), Management (32.3%), and Health Diagnosing & Treating (10.4%), while the most female-oriented occupations are Computers, Engineering & Science (100.0%), Architecture & Engineering (100.0%), and Community & Social Service (100.0%).
| Occupation | Male | Female |
| Management | 10 (32.3%) | 21 (67.7%) |
| Business & Financial | 0 (0.0%) | 0 (0.0%) |
| Computers, Engineering & Science | 0 (0.0%) | 7 (100.0%) |
| Computers & Mathematics | 0 (0.0%) | 0 (0.0%) |
| Architecture & Engineering | 0 (0.0%) | 7 (100.0%) |
| Life, Physical & Social Science | 0 (0.0%) | 0 (0.0%) |
| Community & Social Service | 0 (0.0%) | 29 (100.0%) |
| Education, Arts & Media | 0 (0.0%) | 0 (0.0%) |
| Legal Services & Support | 0 (0.0%) | 0 (0.0%) |
| Education Instruction & Library | 0 (0.0%) | 29 (100.0%) |
| Arts, Media & Entertainment | 0 (0.0%) | 0 (0.0%) |
| Health Diagnosing & Treating | 7 (10.4%) | 60 (89.5%) |
| Health Technologists | 7 (38.9%) | 11 (61.1%) |
| Total (Category) | 17 (12.7%) | 117 (87.3%) |
| Total (Overall) | 298 (40.9%) | 431 (59.1%) |
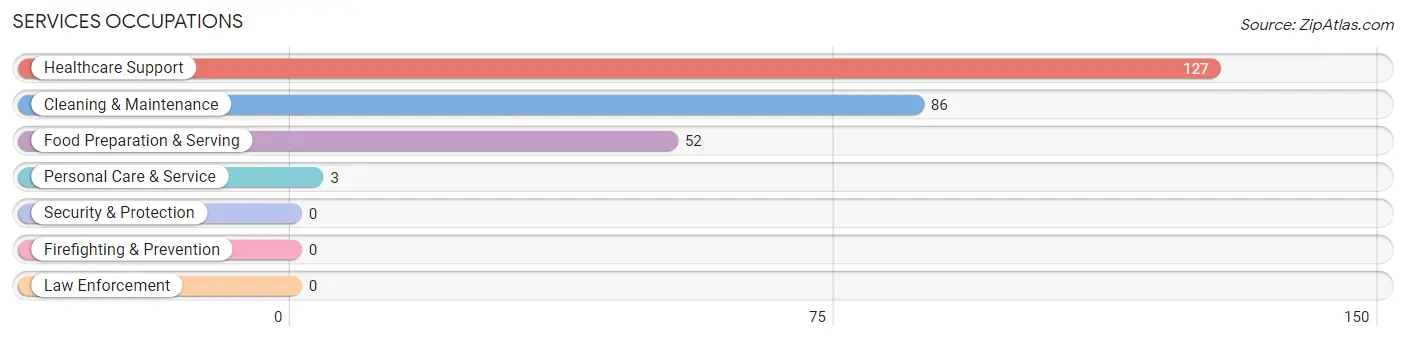
Services Occupations
The most common Services occupations in Mancelona are Healthcare Support (127 | 17.4%), Cleaning & Maintenance (86 | 11.8%), Food Preparation & Serving (52 | 7.1%), and Personal Care & Service (3 | 0.4%).
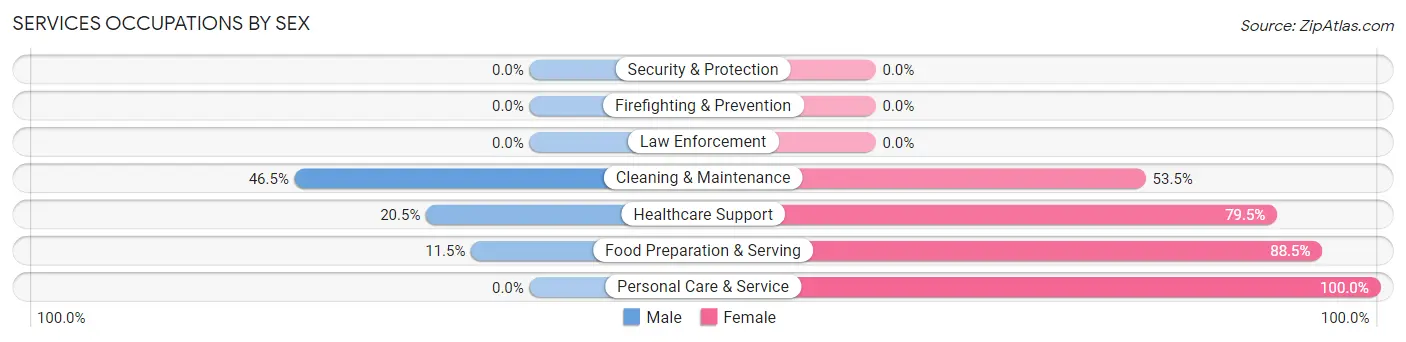
Services Occupations by Sex
Within the Services occupations in Mancelona, the most male-oriented occupations are Cleaning & Maintenance (46.5%), Healthcare Support (20.5%), and Food Preparation & Serving (11.5%), while the most female-oriented occupations are Personal Care & Service (100.0%), Food Preparation & Serving (88.5%), and Healthcare Support (79.5%).
| Occupation | Male | Female |
| Healthcare Support | 26 (20.5%) | 101 (79.5%) |
| Security & Protection | 0 (0.0%) | 0 (0.0%) |
| Firefighting & Prevention | 0 (0.0%) | 0 (0.0%) |
| Law Enforcement | 0 (0.0%) | 0 (0.0%) |
| Food Preparation & Serving | 6 (11.5%) | 46 (88.5%) |
| Cleaning & Maintenance | 40 (46.5%) | 46 (53.5%) |
| Personal Care & Service | 0 (0.0%) | 3 (100.0%) |
| Total (Category) | 72 (26.9%) | 196 (73.1%) |
| Total (Overall) | 298 (40.9%) | 431 (59.1%) |
Sales and Office Occupations
The most common Sales and Office occupations in Mancelona are Office & Administration (60 | 8.2%), and Sales & Related (36 | 4.9%).
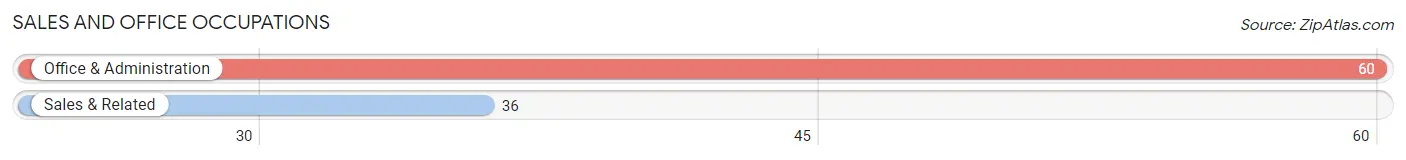
Sales and Office Occupations by Sex
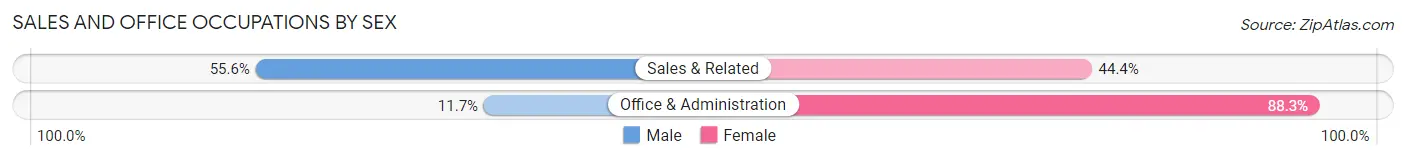
| Occupation | Male | Female |
| Sales & Related | 20 (55.6%) | 16 (44.4%) |
| Office & Administration | 7 (11.7%) | 53 (88.3%) |
| Total (Category) | 27 (28.1%) | 69 (71.9%) |
| Total (Overall) | 298 (40.9%) | 431 (59.1%) |
Natural Resources, Construction and Maintenance Occupations
The most common Natural Resources, Construction and Maintenance occupations in Mancelona are Construction & Extraction (62 | 8.5%), Installation, Maintenance & Repair (43 | 5.9%), and Farming, Fishing & Forestry (20 | 2.7%).
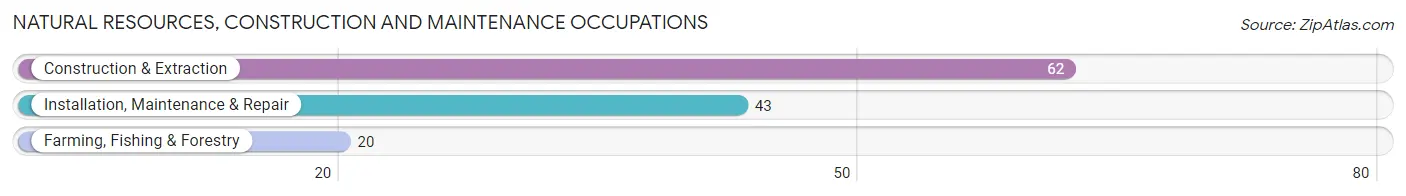
Natural Resources, Construction and Maintenance Occupations by Sex
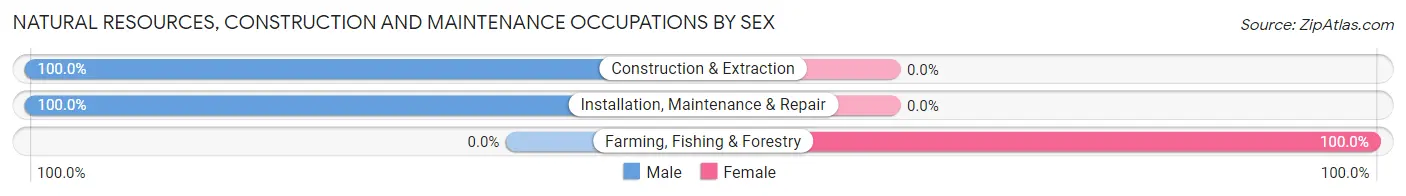
| Occupation | Male | Female |
| Farming, Fishing & Forestry | 0 (0.0%) | 20 (100.0%) |
| Construction & Extraction | 62 (100.0%) | 0 (0.0%) |
| Installation, Maintenance & Repair | 43 (100.0%) | 0 (0.0%) |
| Total (Category) | 105 (84.0%) | 20 (16.0%) |
| Total (Overall) | 298 (40.9%) | 431 (59.1%) |
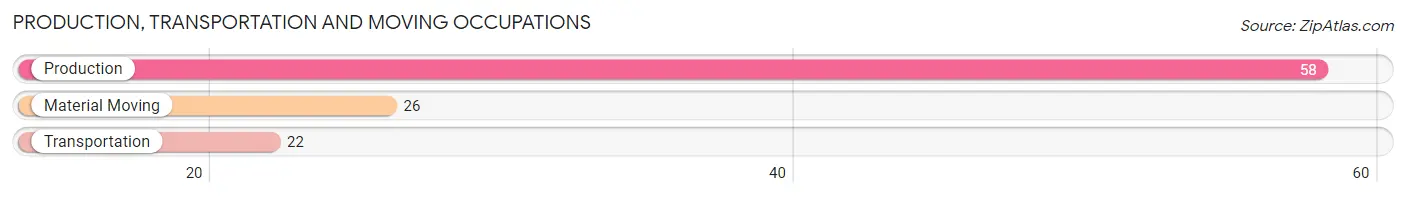
Production, Transportation and Moving Occupations
The most common Production, Transportation and Moving occupations in Mancelona are Production (58 | 8.0%), Material Moving (26 | 3.6%), and Transportation (22 | 3.0%).
Production, Transportation and Moving Occupations by Sex
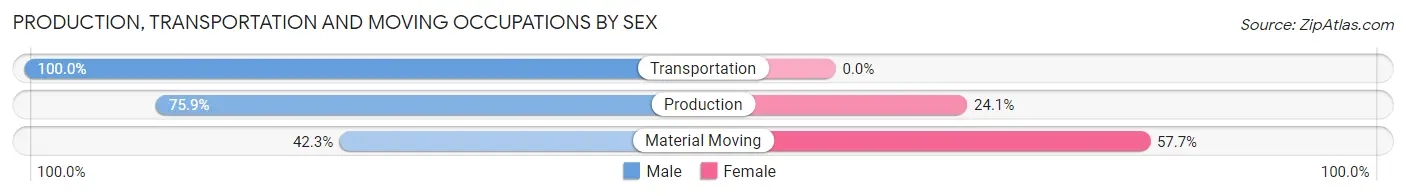
| Occupation | Male | Female |
| Production | 44 (75.9%) | 14 (24.1%) |
| Transportation | 22 (100.0%) | 0 (0.0%) |
| Material Moving | 11 (42.3%) | 15 (57.7%) |
| Total (Category) | 77 (72.6%) | 29 (27.4%) |
| Total (Overall) | 298 (40.9%) | 431 (59.1%) |
Employment Industries by Sex in Mancelona
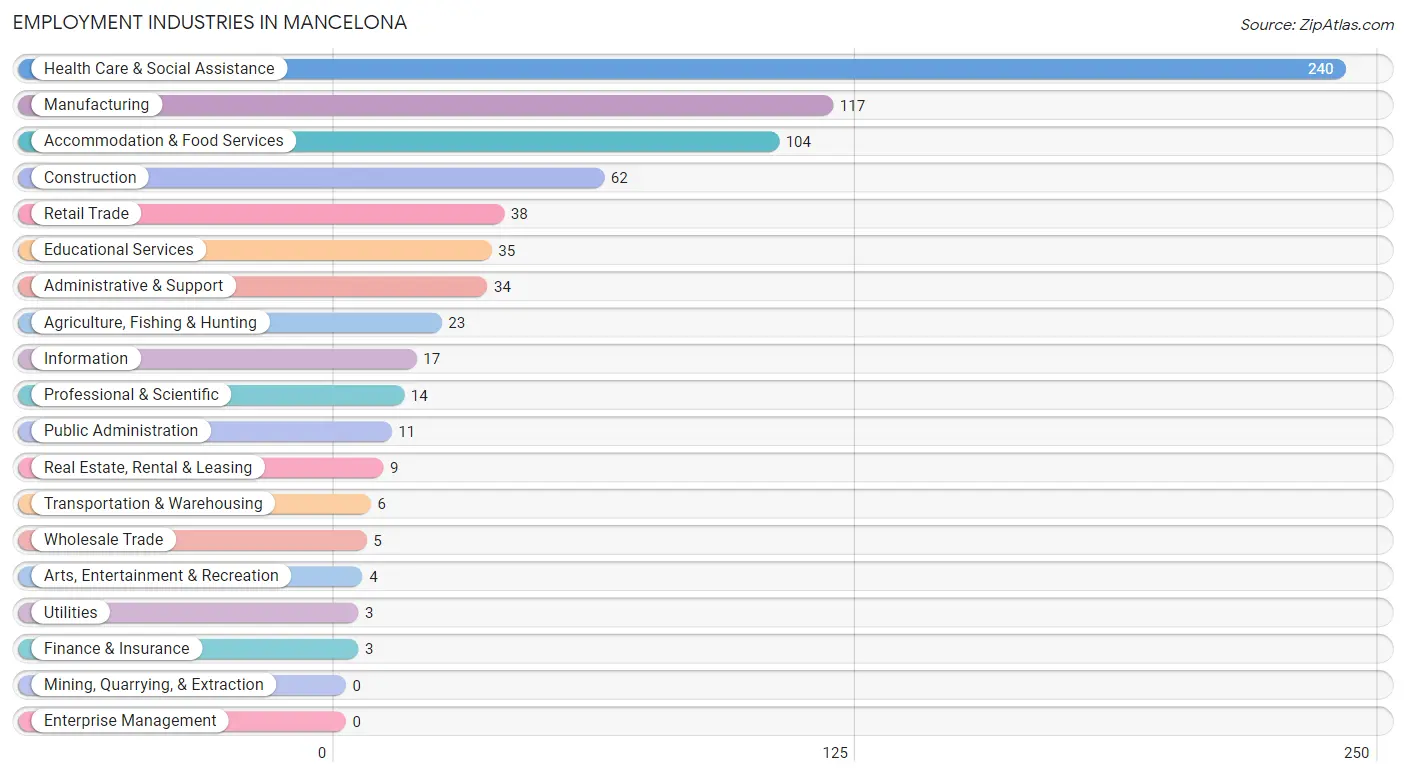
Employment Industries in Mancelona
The major employment industries in Mancelona include Health Care & Social Assistance (240 | 32.9%), Manufacturing (117 | 16.1%), Accommodation & Food Services (104 | 14.3%), Construction (62 | 8.5%), and Retail Trade (38 | 5.2%).
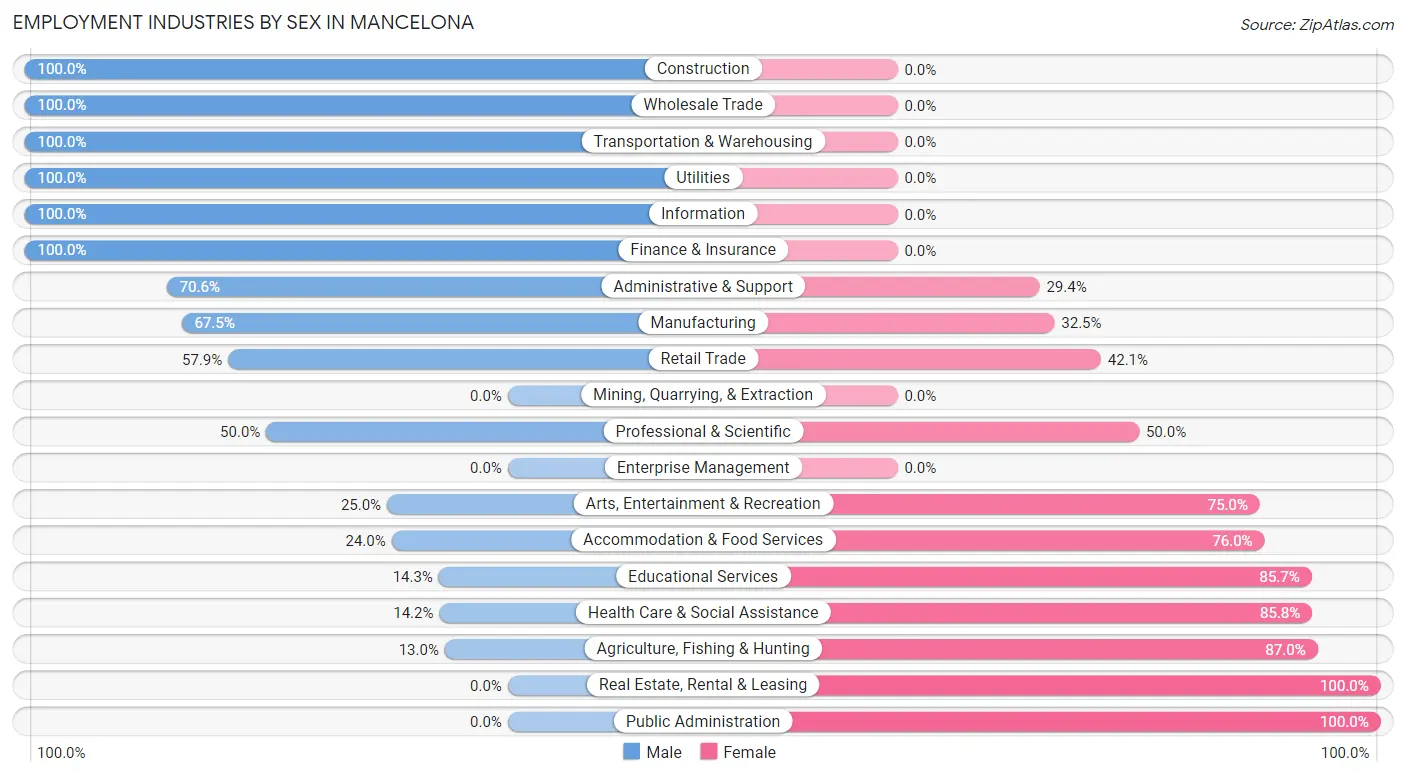
Employment Industries by Sex in Mancelona
The Mancelona industries that see more men than women are Construction (100.0%), Wholesale Trade (100.0%), and Transportation & Warehousing (100.0%), whereas the industries that tend to have a higher number of women are Real Estate, Rental & Leasing (100.0%), Public Administration (100.0%), and Agriculture, Fishing & Hunting (87.0%).
| Industry | Male | Female |
| Agriculture, Fishing & Hunting | 3 (13.0%) | 20 (87.0%) |
| Mining, Quarrying, & Extraction | 0 (0.0%) | 0 (0.0%) |
| Construction | 62 (100.0%) | 0 (0.0%) |
| Manufacturing | 79 (67.5%) | 38 (32.5%) |
| Wholesale Trade | 5 (100.0%) | 0 (0.0%) |
| Retail Trade | 22 (57.9%) | 16 (42.1%) |
| Transportation & Warehousing | 6 (100.0%) | 0 (0.0%) |
| Utilities | 3 (100.0%) | 0 (0.0%) |
| Information | 17 (100.0%) | 0 (0.0%) |
| Finance & Insurance | 3 (100.0%) | 0 (0.0%) |
| Real Estate, Rental & Leasing | 0 (0.0%) | 9 (100.0%) |
| Professional & Scientific | 7 (50.0%) | 7 (50.0%) |
| Enterprise Management | 0 (0.0%) | 0 (0.0%) |
| Administrative & Support | 24 (70.6%) | 10 (29.4%) |
| Educational Services | 5 (14.3%) | 30 (85.7%) |
| Health Care & Social Assistance | 34 (14.2%) | 206 (85.8%) |
| Arts, Entertainment & Recreation | 1 (25.0%) | 3 (75.0%) |
| Accommodation & Food Services | 25 (24.0%) | 79 (76.0%) |
| Public Administration | 0 (0.0%) | 11 (100.0%) |
| Total | 298 (40.9%) | 431 (59.1%) |
Education in Mancelona
School Enrollment in Mancelona
The most common levels of schooling among the 390 students in Mancelona are high school (194 | 49.7%), middle school (53 | 13.6%), and elementary school (42 | 10.8%).
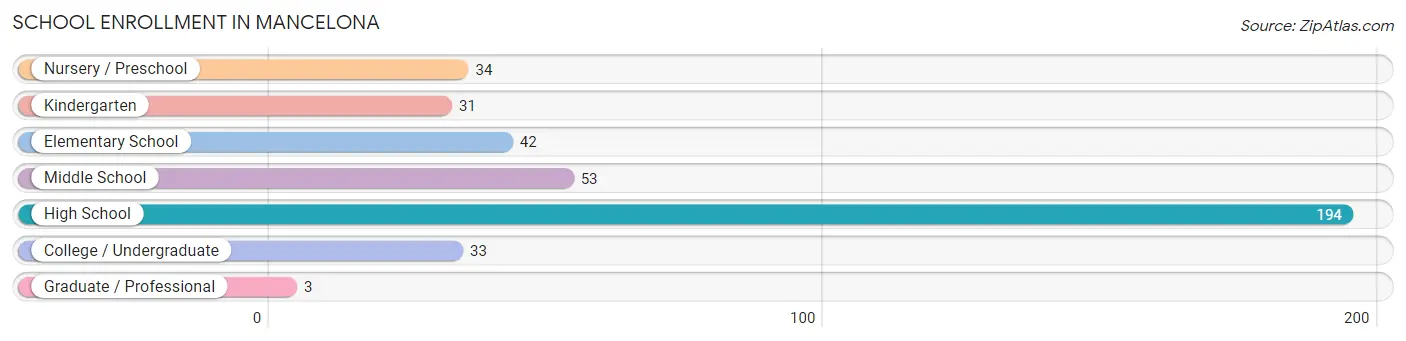
| School Level | # Students | % Students |
| Nursery / Preschool | 34 | 8.7% |
| Kindergarten | 31 | 8.0% |
| Elementary School | 42 | 10.8% |
| Middle School | 53 | 13.6% |
| High School | 194 | 49.7% |
| College / Undergraduate | 33 | 8.5% |
| Graduate / Professional | 3 | 0.8% |
| Total | 390 | 100.0% |
School Enrollment by Age by Funding Source in Mancelona
Out of a total of 390 students who are enrolled in schools in Mancelona, 28 (7.2%) attend a private institution, while the remaining 362 (92.8%) are enrolled in public schools. The age group of 18 to 19 year olds has the highest likelihood of being enrolled in private schools, with 15 (62.5% in the age bracket) enrolled. Conversely, the age group of 3 to 4 year olds has the lowest likelihood of being enrolled in a private school, with 18 (100.0% in the age bracket) attending a public institution.

| Age Bracket | Public School | Private School |
| 3 to 4 Year Olds | 18 (100.0%) | 0 (0.0%) |
| 5 to 9 Year Old | 90 (97.8%) | 2 (2.2%) |
| 10 to 14 Year Olds | 89 (100.0%) | 0 (0.0%) |
| 15 to 17 Year Olds | 118 (100.0%) | 0 (0.0%) |
| 18 to 19 Year Olds | 9 (37.5%) | 15 (62.5%) |
| 20 to 24 Year Olds | 17 (70.8%) | 7 (29.2%) |
| 25 to 34 Year Olds | 17 (100.0%) | 0 (0.0%) |
| 35 Years and over | 4 (50.0%) | 4 (50.0%) |
| Total | 362 (92.8%) | 28 (7.2%) |
Educational Attainment by Field of Study in Mancelona
Education (18 | 23.1%), science & technology (13 | 16.7%), multidisciplinary studies (10 | 12.8%), psychology (9 | 11.5%), and visual & performing arts (8 | 10.3%) are the most common fields of study among 78 individuals in Mancelona who have obtained a bachelor's degree or higher.
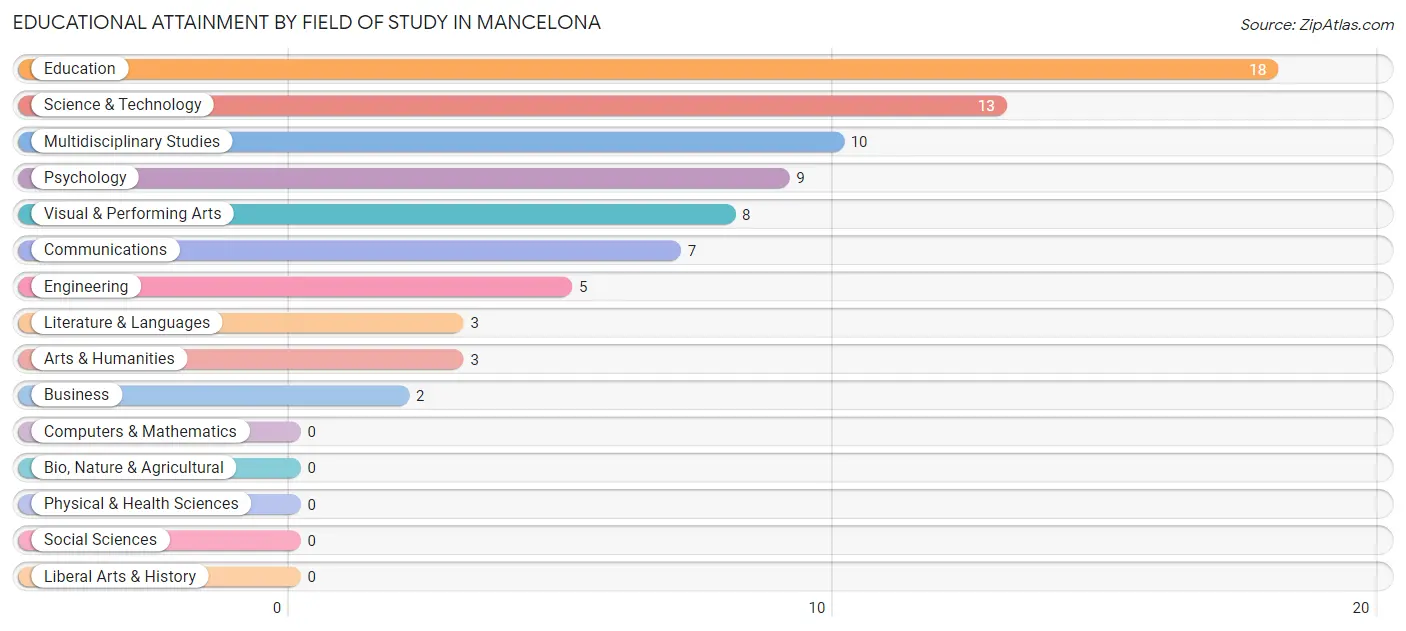
| Field of Study | # Graduates | % Graduates |
| Computers & Mathematics | 0 | 0.0% |
| Bio, Nature & Agricultural | 0 | 0.0% |
| Physical & Health Sciences | 0 | 0.0% |
| Psychology | 9 | 11.5% |
| Social Sciences | 0 | 0.0% |
| Engineering | 5 | 6.4% |
| Multidisciplinary Studies | 10 | 12.8% |
| Science & Technology | 13 | 16.7% |
| Business | 2 | 2.6% |
| Education | 18 | 23.1% |
| Literature & Languages | 3 | 3.8% |
| Liberal Arts & History | 0 | 0.0% |
| Visual & Performing Arts | 8 | 10.3% |
| Communications | 7 | 9.0% |
| Arts & Humanities | 3 | 3.8% |
| Total | 78 | 100.0% |
Transportation & Commute in Mancelona
Vehicle Availability by Sex in Mancelona
The most prevalent vehicle ownership categories in Mancelona are males with 2 vehicles (134, accounting for 45.4%) and females with 2 vehicles (94, making up 33.9%).
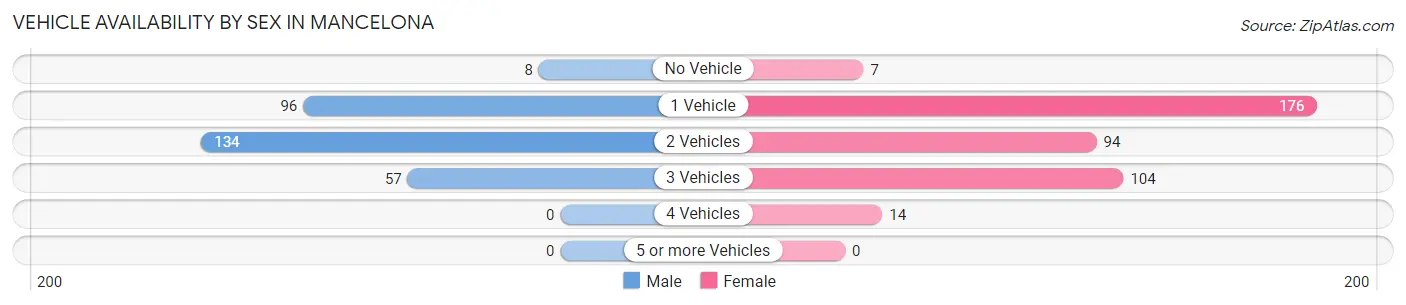
| Vehicles Available | Male | Female |
| No Vehicle | 8 (2.7%) | 7 (1.8%) |
| 1 Vehicle | 96 (32.5%) | 176 (44.6%) |
| 2 Vehicles | 134 (45.4%) | 94 (23.8%) |
| 3 Vehicles | 57 (19.3%) | 104 (26.3%) |
| 4 Vehicles | 0 (0.0%) | 14 (3.5%) |
| 5 or more Vehicles | 0 (0.0%) | 0 (0.0%) |
| Total | 295 (100.0%) | 395 (100.0%) |
Commute Time in Mancelona
The most frequently occuring commute durations in Mancelona are 20 to 24 minutes (162 commuters, 23.9%), 10 to 14 minutes (125 commuters, 18.5%), and 5 to 9 minutes (79 commuters, 11.7%).
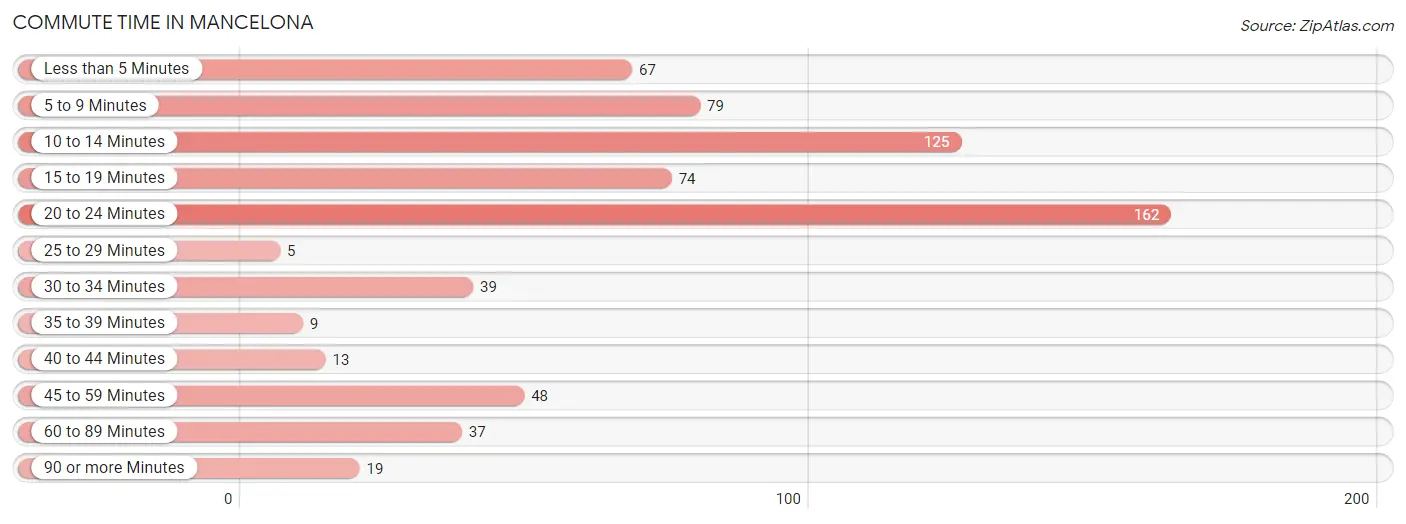
| Commute Time | # Commuters | % Commuters |
| Less than 5 Minutes | 67 | 9.9% |
| 5 to 9 Minutes | 79 | 11.7% |
| 10 to 14 Minutes | 125 | 18.5% |
| 15 to 19 Minutes | 74 | 10.9% |
| 20 to 24 Minutes | 162 | 23.9% |
| 25 to 29 Minutes | 5 | 0.7% |
| 30 to 34 Minutes | 39 | 5.8% |
| 35 to 39 Minutes | 9 | 1.3% |
| 40 to 44 Minutes | 13 | 1.9% |
| 45 to 59 Minutes | 48 | 7.1% |
| 60 to 89 Minutes | 37 | 5.5% |
| 90 or more Minutes | 19 | 2.8% |
Commute Time by Sex in Mancelona
The most common commute times in Mancelona are 10 to 14 minutes (61 commuters, 20.7%) for males and 20 to 24 minutes (110 commuters, 28.8%) for females.
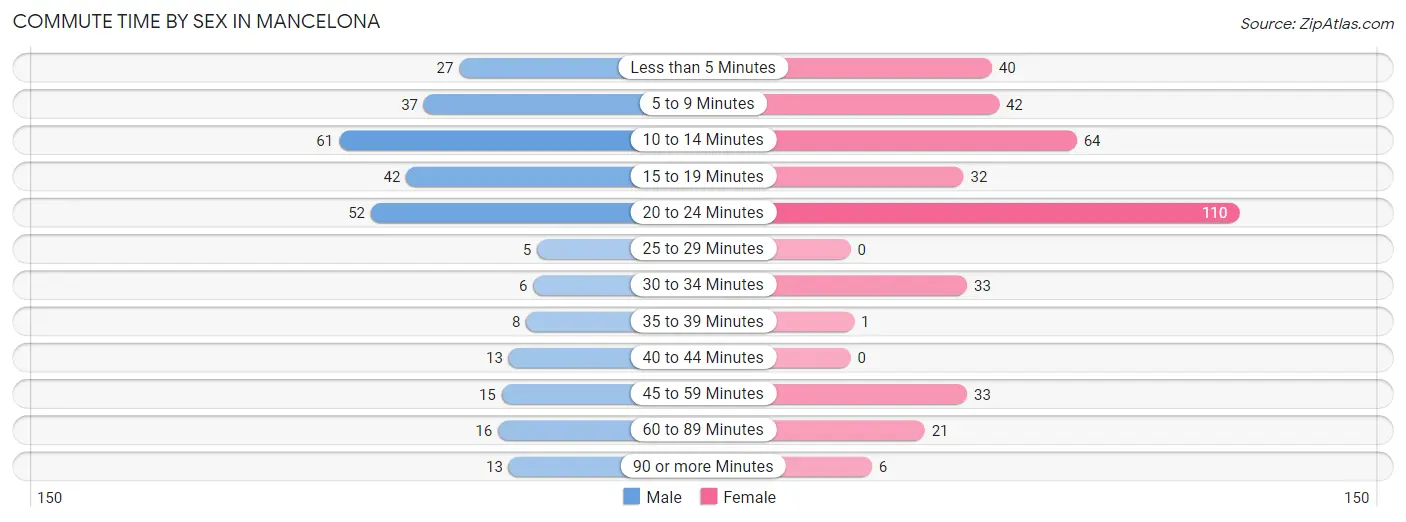
| Commute Time | Male | Female |
| Less than 5 Minutes | 27 (9.1%) | 40 (10.5%) |
| 5 to 9 Minutes | 37 (12.5%) | 42 (11.0%) |
| 10 to 14 Minutes | 61 (20.7%) | 64 (16.8%) |
| 15 to 19 Minutes | 42 (14.2%) | 32 (8.4%) |
| 20 to 24 Minutes | 52 (17.6%) | 110 (28.8%) |
| 25 to 29 Minutes | 5 (1.7%) | 0 (0.0%) |
| 30 to 34 Minutes | 6 (2.0%) | 33 (8.6%) |
| 35 to 39 Minutes | 8 (2.7%) | 1 (0.3%) |
| 40 to 44 Minutes | 13 (4.4%) | 0 (0.0%) |
| 45 to 59 Minutes | 15 (5.1%) | 33 (8.6%) |
| 60 to 89 Minutes | 16 (5.4%) | 21 (5.5%) |
| 90 or more Minutes | 13 (4.4%) | 6 (1.6%) |
Time of Departure to Work by Sex in Mancelona
The most frequent times of departure to work in Mancelona are 6:30 AM to 6:59 AM (54, 18.3%) for males and 7:30 AM to 7:59 AM (83, 21.7%) for females.
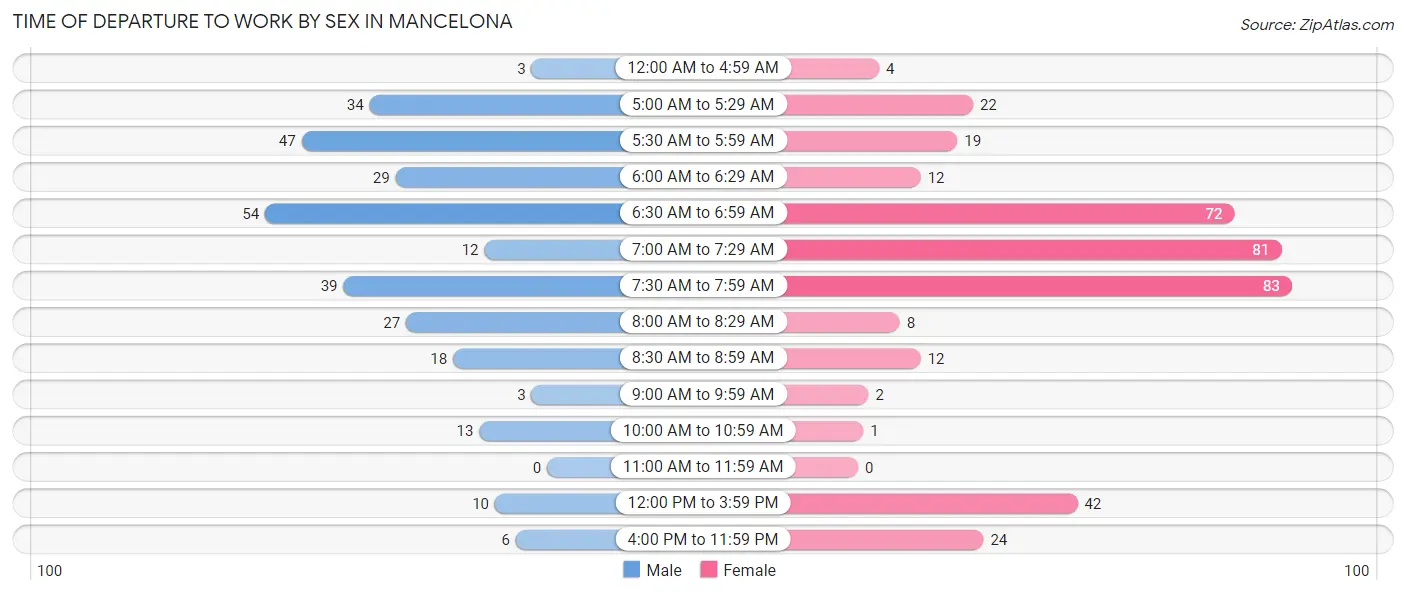
| Time of Departure | Male | Female |
| 12:00 AM to 4:59 AM | 3 (1.0%) | 4 (1.1%) |
| 5:00 AM to 5:29 AM | 34 (11.5%) | 22 (5.8%) |
| 5:30 AM to 5:59 AM | 47 (15.9%) | 19 (5.0%) |
| 6:00 AM to 6:29 AM | 29 (9.8%) | 12 (3.1%) |
| 6:30 AM to 6:59 AM | 54 (18.3%) | 72 (18.9%) |
| 7:00 AM to 7:29 AM | 12 (4.1%) | 81 (21.2%) |
| 7:30 AM to 7:59 AM | 39 (13.2%) | 83 (21.7%) |
| 8:00 AM to 8:29 AM | 27 (9.1%) | 8 (2.1%) |
| 8:30 AM to 8:59 AM | 18 (6.1%) | 12 (3.1%) |
| 9:00 AM to 9:59 AM | 3 (1.0%) | 2 (0.5%) |
| 10:00 AM to 10:59 AM | 13 (4.4%) | 1 (0.3%) |
| 11:00 AM to 11:59 AM | 0 (0.0%) | 0 (0.0%) |
| 12:00 PM to 3:59 PM | 10 (3.4%) | 42 (11.0%) |
| 4:00 PM to 11:59 PM | 6 (2.0%) | 24 (6.3%) |
| Total | 295 (100.0%) | 382 (100.0%) |
Housing Occupancy in Mancelona
Occupancy by Ownership in Mancelona
Of the total 665 dwellings in Mancelona, owner-occupied units account for 435 (65.4%), while renter-occupied units make up 230 (34.6%).
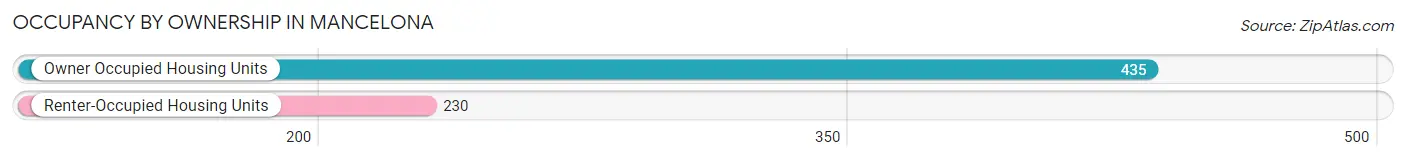
| Occupancy | # Housing Units | % Housing Units |
| Owner Occupied Housing Units | 435 | 65.4% |
| Renter-Occupied Housing Units | 230 | 34.6% |
| Total Occupied Housing Units | 665 | 100.0% |
Occupancy by Household Size in Mancelona
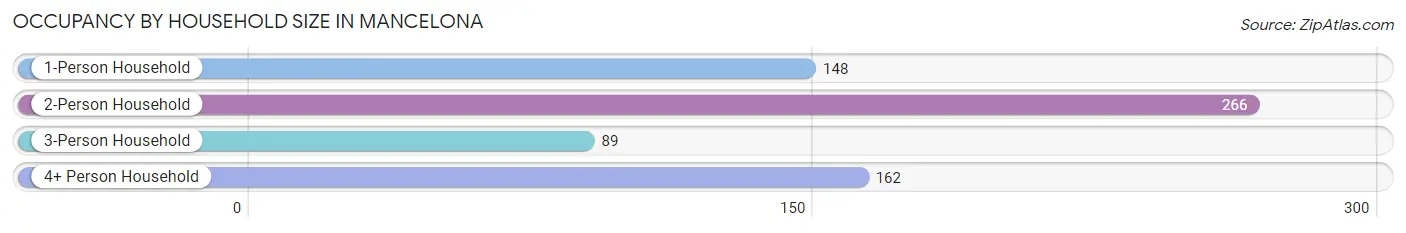
| Household Size | # Housing Units | % Housing Units |
| 1-Person Household | 148 | 22.3% |
| 2-Person Household | 266 | 40.0% |
| 3-Person Household | 89 | 13.4% |
| 4+ Person Household | 162 | 24.4% |
| Total Housing Units | 665 | 100.0% |
Occupancy by Ownership by Household Size in Mancelona
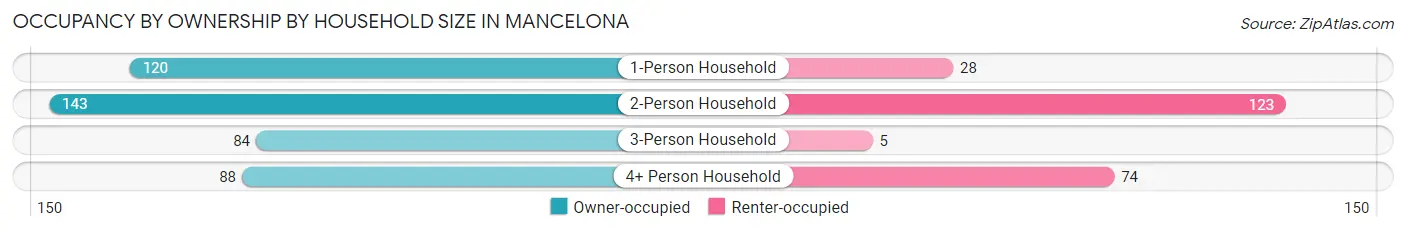
| Household Size | Owner-occupied | Renter-occupied |
| 1-Person Household | 120 (81.1%) | 28 (18.9%) |
| 2-Person Household | 143 (53.8%) | 123 (46.2%) |
| 3-Person Household | 84 (94.4%) | 5 (5.6%) |
| 4+ Person Household | 88 (54.3%) | 74 (45.7%) |
| Total Housing Units | 435 (65.4%) | 230 (34.6%) |
Occupancy by Educational Attainment in Mancelona
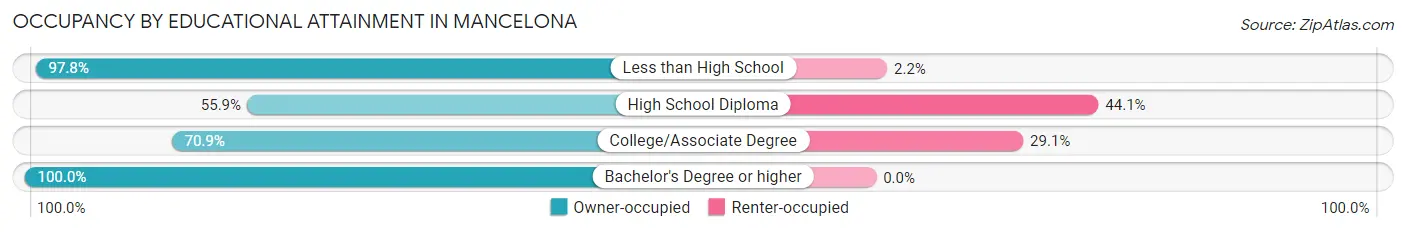
| Household Size | Owner-occupied | Renter-occupied |
| Less than High School | 45 (97.8%) | 1 (2.2%) |
| High School Diploma | 226 (55.9%) | 178 (44.1%) |
| College/Associate Degree | 124 (70.9%) | 51 (29.1%) |
| Bachelor's Degree or higher | 40 (100.0%) | 0 (0.0%) |
Occupancy by Age of Householder in Mancelona
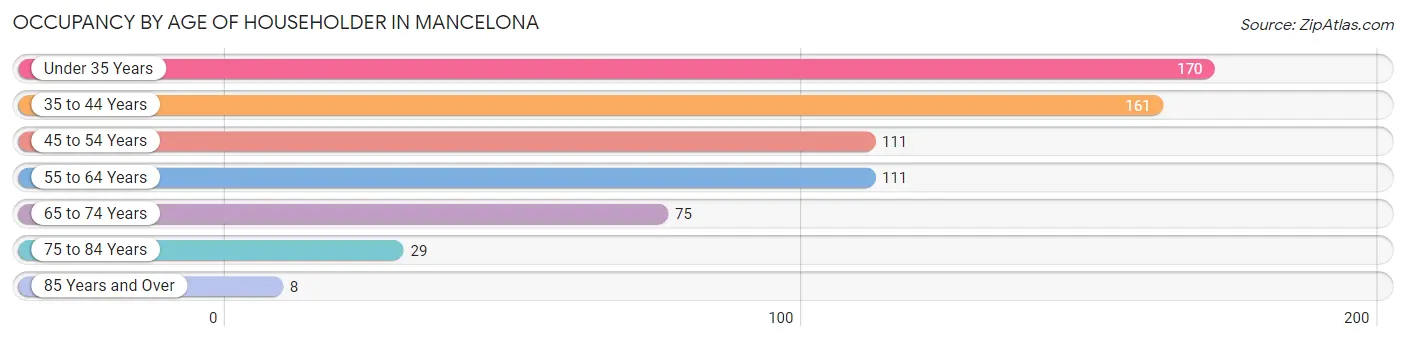
| Age Bracket | # Households | % Households |
| Under 35 Years | 170 | 25.6% |
| 35 to 44 Years | 161 | 24.2% |
| 45 to 54 Years | 111 | 16.7% |
| 55 to 64 Years | 111 | 16.7% |
| 65 to 74 Years | 75 | 11.3% |
| 75 to 84 Years | 29 | 4.4% |
| 85 Years and Over | 8 | 1.2% |
| Total | 665 | 100.0% |
Housing Finances in Mancelona
Median Income by Occupancy in Mancelona
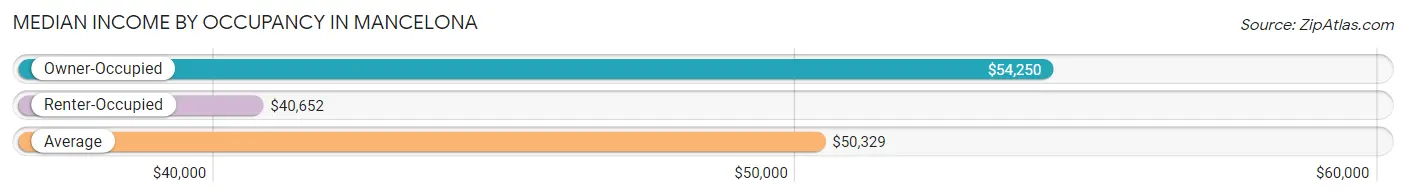
| Occupancy Type | # Households | Median Income |
| Owner-Occupied | 435 (65.4%) | $54,250 |
| Renter-Occupied | 230 (34.6%) | $40,652 |
| Average | 665 (100.0%) | $50,329 |
Occupancy by Householder Income Bracket in Mancelona
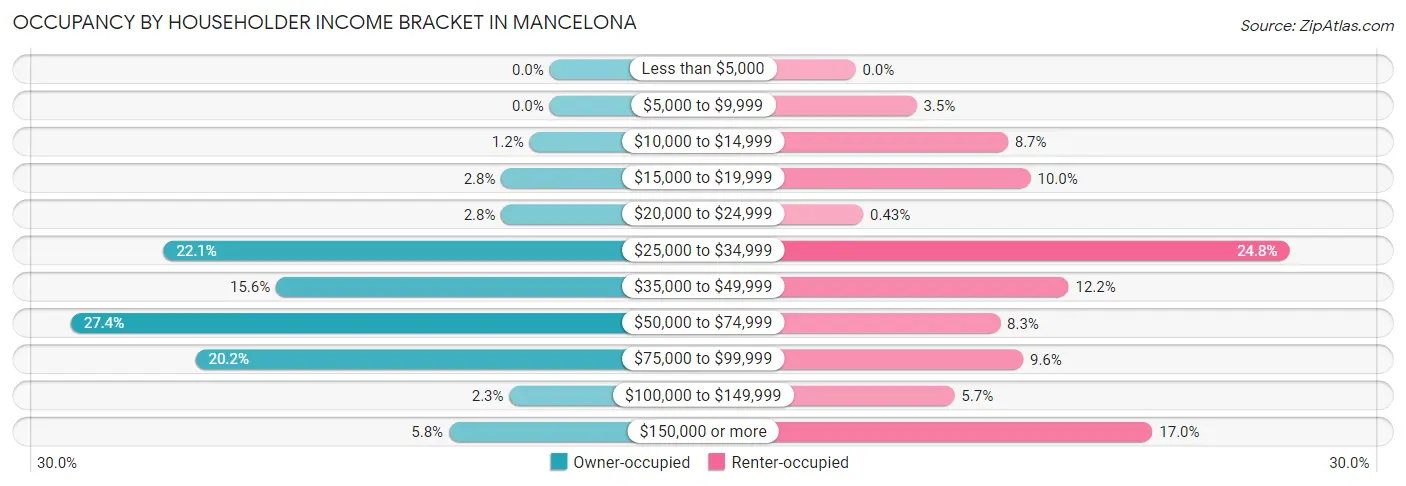
| Income Bracket | Owner-occupied | Renter-occupied |
| Less than $5,000 | 0 (0.0%) | 0 (0.0%) |
| $5,000 to $9,999 | 0 (0.0%) | 8 (3.5%) |
| $10,000 to $14,999 | 5 (1.1%) | 20 (8.7%) |
| $15,000 to $19,999 | 12 (2.8%) | 23 (10.0%) |
| $20,000 to $24,999 | 12 (2.8%) | 1 (0.4%) |
| $25,000 to $34,999 | 96 (22.1%) | 57 (24.8%) |
| $35,000 to $49,999 | 68 (15.6%) | 28 (12.2%) |
| $50,000 to $74,999 | 119 (27.4%) | 19 (8.3%) |
| $75,000 to $99,999 | 88 (20.2%) | 22 (9.6%) |
| $100,000 to $149,999 | 10 (2.3%) | 13 (5.7%) |
| $150,000 or more | 25 (5.8%) | 39 (17.0%) |
| Total | 435 (100.0%) | 230 (100.0%) |
Monthly Housing Cost Tiers in Mancelona
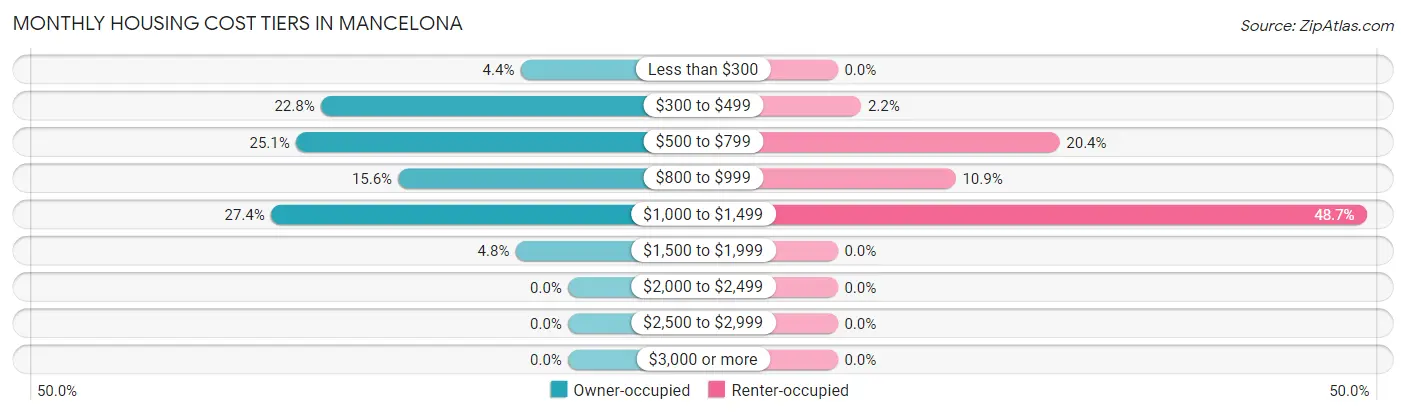
| Monthly Cost | Owner-occupied | Renter-occupied |
| Less than $300 | 19 (4.4%) | 0 (0.0%) |
| $300 to $499 | 99 (22.8%) | 5 (2.2%) |
| $500 to $799 | 109 (25.1%) | 47 (20.4%) |
| $800 to $999 | 68 (15.6%) | 25 (10.9%) |
| $1,000 to $1,499 | 119 (27.4%) | 112 (48.7%) |
| $1,500 to $1,999 | 21 (4.8%) | 0 (0.0%) |
| $2,000 to $2,499 | 0 (0.0%) | 0 (0.0%) |
| $2,500 to $2,999 | 0 (0.0%) | 0 (0.0%) |
| $3,000 or more | 0 (0.0%) | 0 (0.0%) |
| Total | 435 (100.0%) | 230 (100.0%) |
Physical Housing Characteristics in Mancelona
Housing Structures in Mancelona
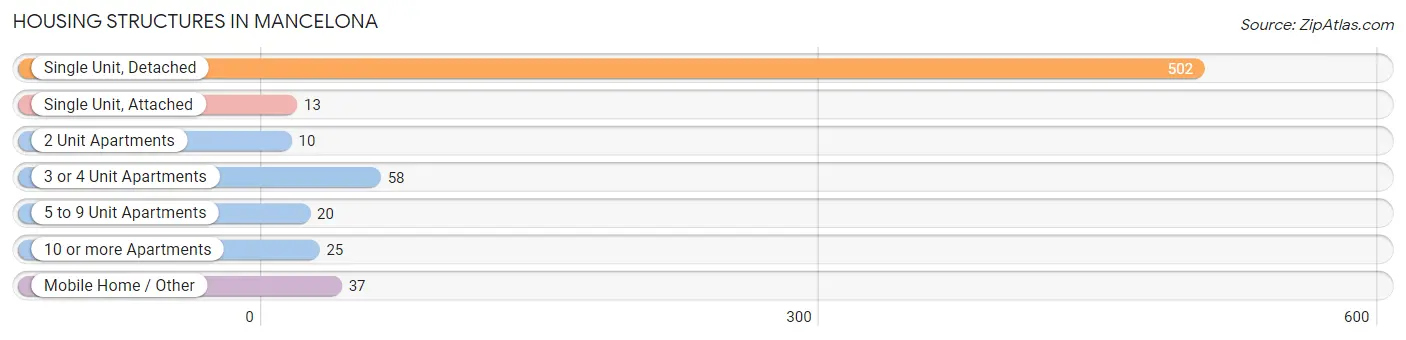
| Structure Type | # Housing Units | % Housing Units |
| Single Unit, Detached | 502 | 75.5% |
| Single Unit, Attached | 13 | 1.9% |
| 2 Unit Apartments | 10 | 1.5% |
| 3 or 4 Unit Apartments | 58 | 8.7% |
| 5 to 9 Unit Apartments | 20 | 3.0% |
| 10 or more Apartments | 25 | 3.8% |
| Mobile Home / Other | 37 | 5.6% |
| Total | 665 | 100.0% |
Housing Structures by Occupancy in Mancelona
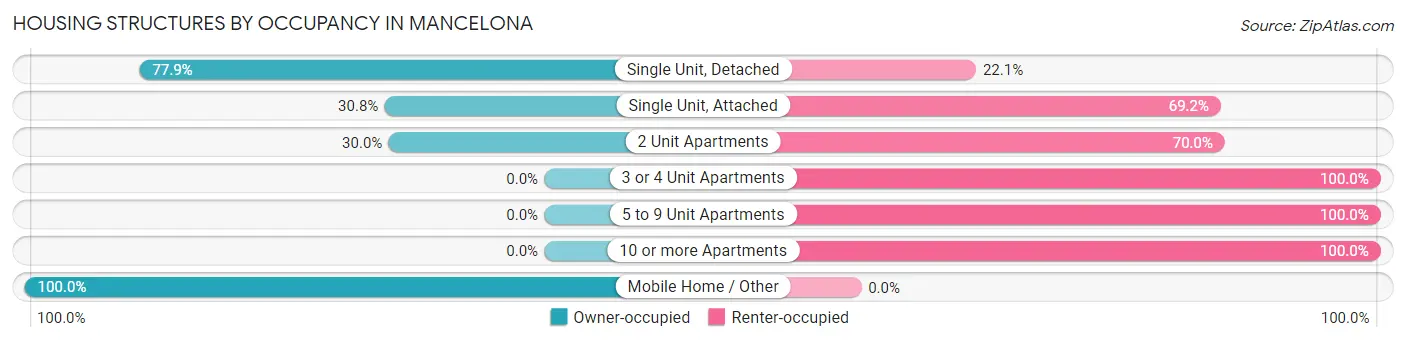
| Structure Type | Owner-occupied | Renter-occupied |
| Single Unit, Detached | 391 (77.9%) | 111 (22.1%) |
| Single Unit, Attached | 4 (30.8%) | 9 (69.2%) |
| 2 Unit Apartments | 3 (30.0%) | 7 (70.0%) |
| 3 or 4 Unit Apartments | 0 (0.0%) | 58 (100.0%) |
| 5 to 9 Unit Apartments | 0 (0.0%) | 20 (100.0%) |
| 10 or more Apartments | 0 (0.0%) | 25 (100.0%) |
| Mobile Home / Other | 37 (100.0%) | 0 (0.0%) |
| Total | 435 (65.4%) | 230 (34.6%) |
Housing Structures by Number of Rooms in Mancelona
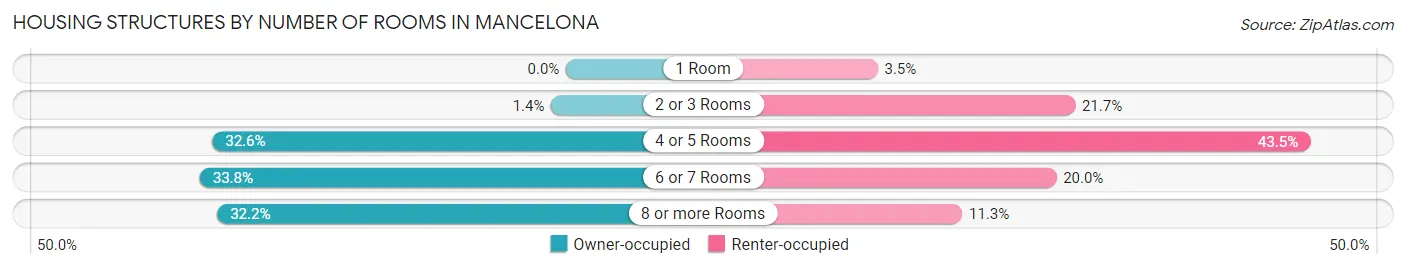
| Number of Rooms | Owner-occupied | Renter-occupied |
| 1 Room | 0 (0.0%) | 8 (3.5%) |
| 2 or 3 Rooms | 6 (1.4%) | 50 (21.7%) |
| 4 or 5 Rooms | 142 (32.6%) | 100 (43.5%) |
| 6 or 7 Rooms | 147 (33.8%) | 46 (20.0%) |
| 8 or more Rooms | 140 (32.2%) | 26 (11.3%) |
| Total | 435 (100.0%) | 230 (100.0%) |
Housing Structure by Heating Type in Mancelona
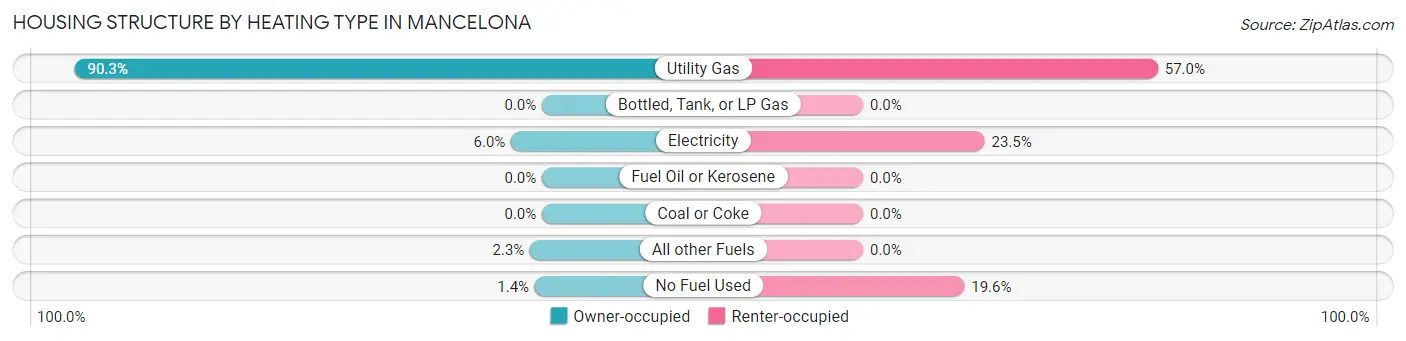
| Heating Type | Owner-occupied | Renter-occupied |
| Utility Gas | 393 (90.3%) | 131 (57.0%) |
| Bottled, Tank, or LP Gas | 0 (0.0%) | 0 (0.0%) |
| Electricity | 26 (6.0%) | 54 (23.5%) |
| Fuel Oil or Kerosene | 0 (0.0%) | 0 (0.0%) |
| Coal or Coke | 0 (0.0%) | 0 (0.0%) |
| All other Fuels | 10 (2.3%) | 0 (0.0%) |
| No Fuel Used | 6 (1.4%) | 45 (19.6%) |
| Total | 435 (100.0%) | 230 (100.0%) |
Household Vehicle Usage in Mancelona
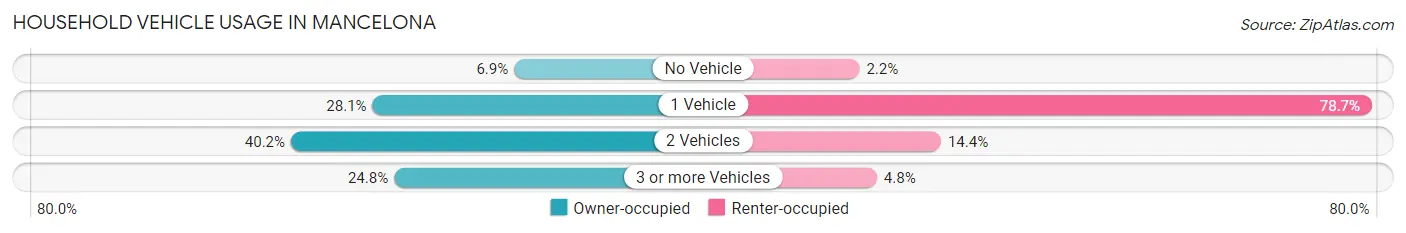
| Vehicles per Household | Owner-occupied | Renter-occupied |
| No Vehicle | 30 (6.9%) | 5 (2.2%) |
| 1 Vehicle | 122 (28.1%) | 181 (78.7%) |
| 2 Vehicles | 175 (40.2%) | 33 (14.3%) |
| 3 or more Vehicles | 108 (24.8%) | 11 (4.8%) |
| Total | 435 (100.0%) | 230 (100.0%) |
Real Estate & Mortgages in Mancelona
Real Estate and Mortgage Overview in Mancelona
| Characteristic | Without Mortgage | With Mortgage |
| Housing Units | 169 | 266 |
| Median Property Value | $87,400 | $120,500 |
| Median Household Income | $47,933 | $25 |
| Monthly Housing Costs | $452 | $0 |
| Real Estate Taxes | $1,383 | $17 |
Property Value by Mortgage Status in Mancelona
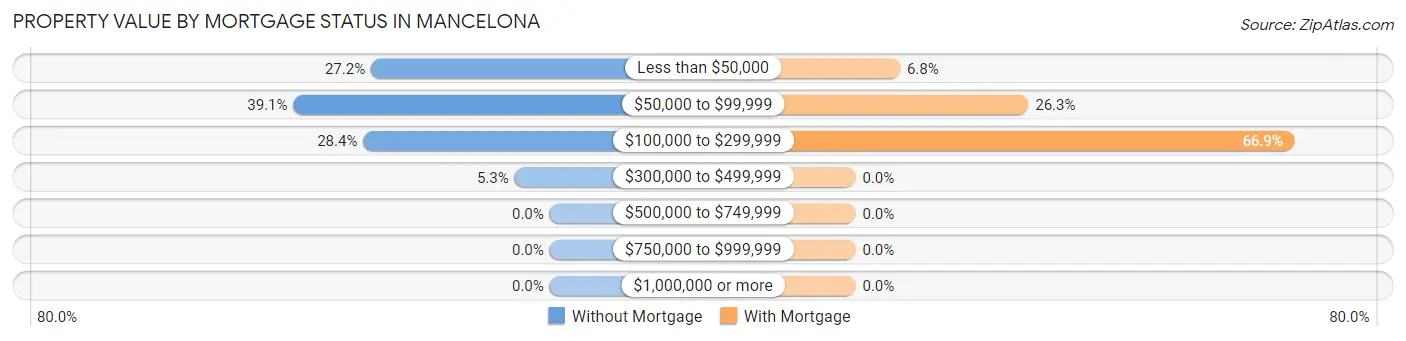
| Property Value | Without Mortgage | With Mortgage |
| Less than $50,000 | 46 (27.2%) | 18 (6.8%) |
| $50,000 to $99,999 | 66 (39.1%) | 70 (26.3%) |
| $100,000 to $299,999 | 48 (28.4%) | 178 (66.9%) |
| $300,000 to $499,999 | 9 (5.3%) | 0 (0.0%) |
| $500,000 to $749,999 | 0 (0.0%) | 0 (0.0%) |
| $750,000 to $999,999 | 0 (0.0%) | 0 (0.0%) |
| $1,000,000 or more | 0 (0.0%) | 0 (0.0%) |
| Total | 169 (100.0%) | 266 (100.0%) |
Household Income by Mortgage Status in Mancelona
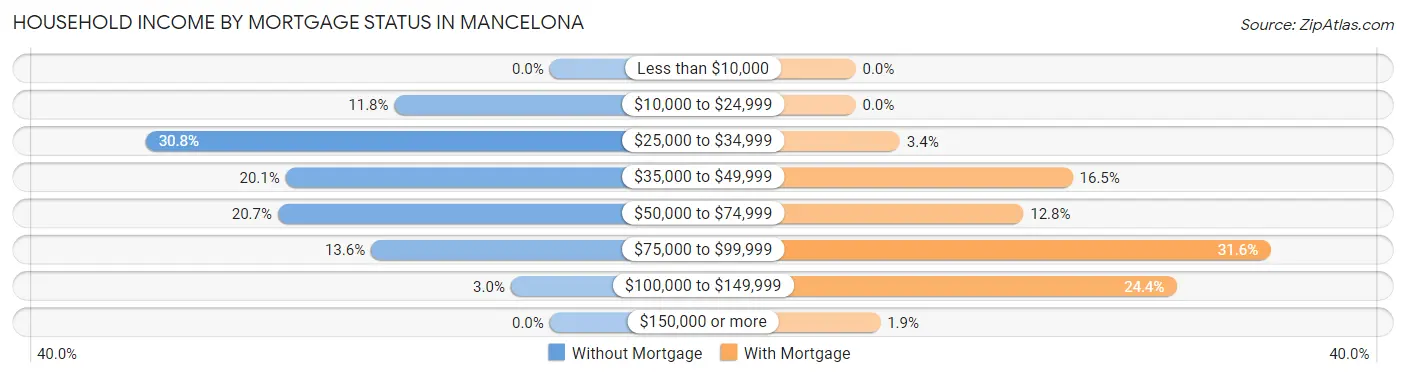
| Household Income | Without Mortgage | With Mortgage |
| Less than $10,000 | 0 (0.0%) | 0 (0.0%) |
| $10,000 to $24,999 | 20 (11.8%) | 0 (0.0%) |
| $25,000 to $34,999 | 52 (30.8%) | 9 (3.4%) |
| $35,000 to $49,999 | 34 (20.1%) | 44 (16.5%) |
| $50,000 to $74,999 | 35 (20.7%) | 34 (12.8%) |
| $75,000 to $99,999 | 23 (13.6%) | 84 (31.6%) |
| $100,000 to $149,999 | 5 (3.0%) | 65 (24.4%) |
| $150,000 or more | 0 (0.0%) | 5 (1.9%) |
| Total | 169 (100.0%) | 266 (100.0%) |
Property Value to Household Income Ratio in Mancelona
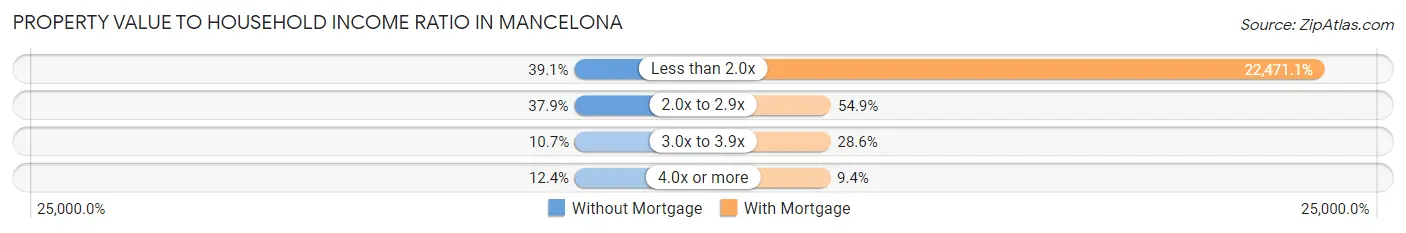
| Value-to-Income Ratio | Without Mortgage | With Mortgage |
| Less than 2.0x | 66 (39.1%) | 59,773 (22,471.0%) |
| 2.0x to 2.9x | 64 (37.9%) | 146 (54.9%) |
| 3.0x to 3.9x | 18 (10.6%) | 76 (28.6%) |
| 4.0x or more | 21 (12.4%) | 25 (9.4%) |
| Total | 169 (100.0%) | 266 (100.0%) |
Real Estate Taxes by Mortgage Status in Mancelona
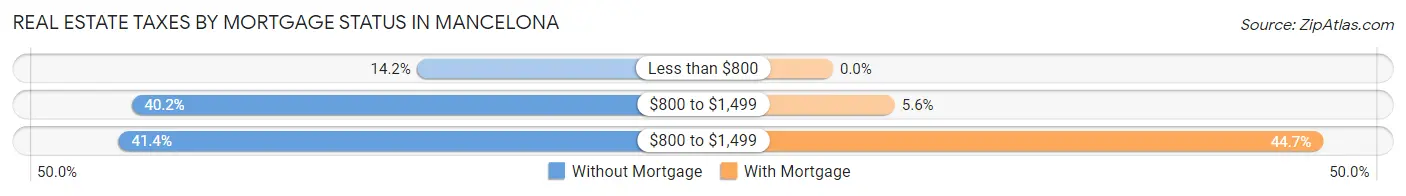
| Property Taxes | Without Mortgage | With Mortgage |
| Less than $800 | 24 (14.2%) | 0 (0.0%) |
| $800 to $1,499 | 68 (40.2%) | 15 (5.6%) |
| $800 to $1,499 | 70 (41.4%) | 119 (44.7%) |
| Total | 169 (100.0%) | 266 (100.0%) |
Health & Disability in Mancelona
Health Insurance Coverage by Age in Mancelona
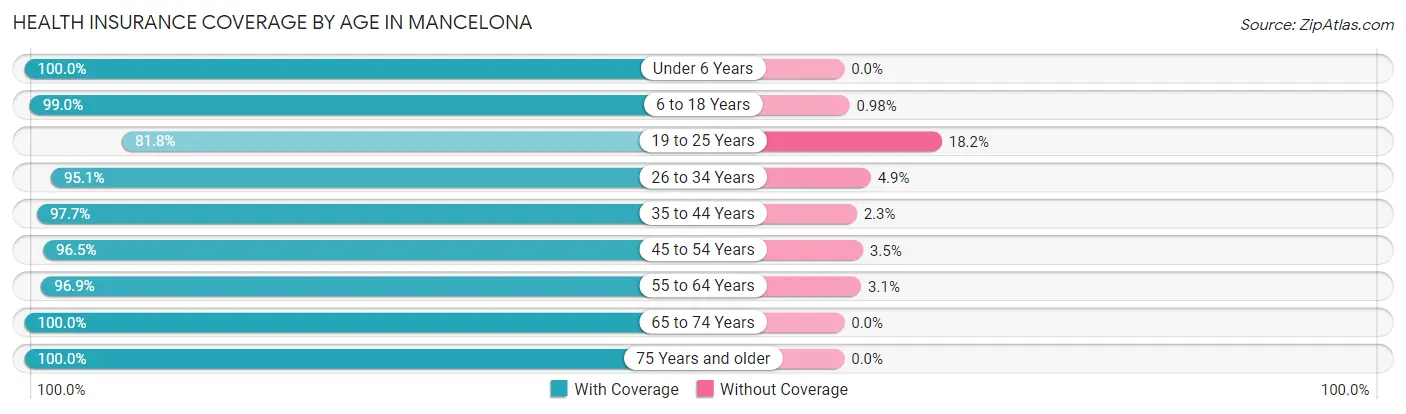
| Age Bracket | With Coverage | Without Coverage |
| Under 6 Years | 150 (100.0%) | 0 (0.0%) |
| 6 to 18 Years | 302 (99.0%) | 3 (1.0%) |
| 19 to 25 Years | 126 (81.8%) | 28 (18.2%) |
| 26 to 34 Years | 193 (95.1%) | 10 (4.9%) |
| 35 to 44 Years | 254 (97.7%) | 6 (2.3%) |
| 45 to 54 Years | 195 (96.5%) | 7 (3.5%) |
| 55 to 64 Years | 185 (96.9%) | 6 (3.1%) |
| 65 to 74 Years | 103 (100.0%) | 0 (0.0%) |
| 75 Years and older | 54 (100.0%) | 0 (0.0%) |
| Total | 1,562 (96.3%) | 60 (3.7%) |
Health Insurance Coverage by Citizenship Status in Mancelona
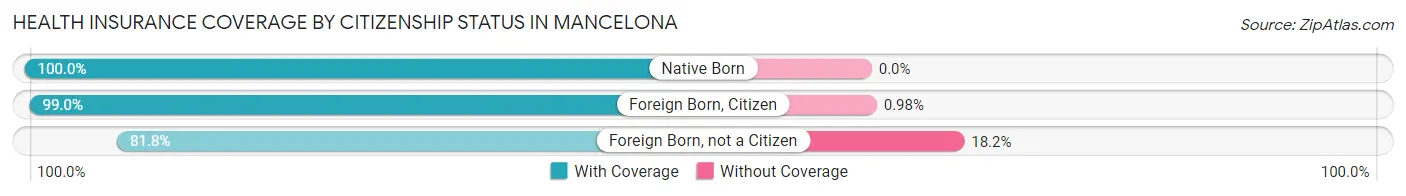
| Citizenship Status | With Coverage | Without Coverage |
| Native Born | 150 (100.0%) | 0 (0.0%) |
| Foreign Born, Citizen | 302 (99.0%) | 3 (1.0%) |
| Foreign Born, not a Citizen | 126 (81.8%) | 28 (18.2%) |
Health Insurance Coverage by Household Income in Mancelona
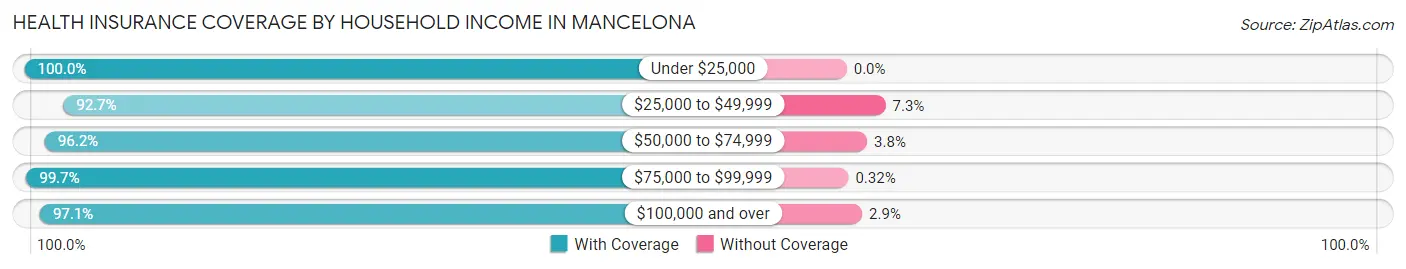
| Household Income | With Coverage | Without Coverage |
| Under $25,000 | 198 (100.0%) | 0 (0.0%) |
| $25,000 to $49,999 | 510 (92.7%) | 40 (7.3%) |
| $50,000 to $74,999 | 303 (96.2%) | 12 (3.8%) |
| $75,000 to $99,999 | 310 (99.7%) | 1 (0.3%) |
| $100,000 and over | 236 (97.1%) | 7 (2.9%) |
Public vs Private Health Insurance Coverage by Age in Mancelona
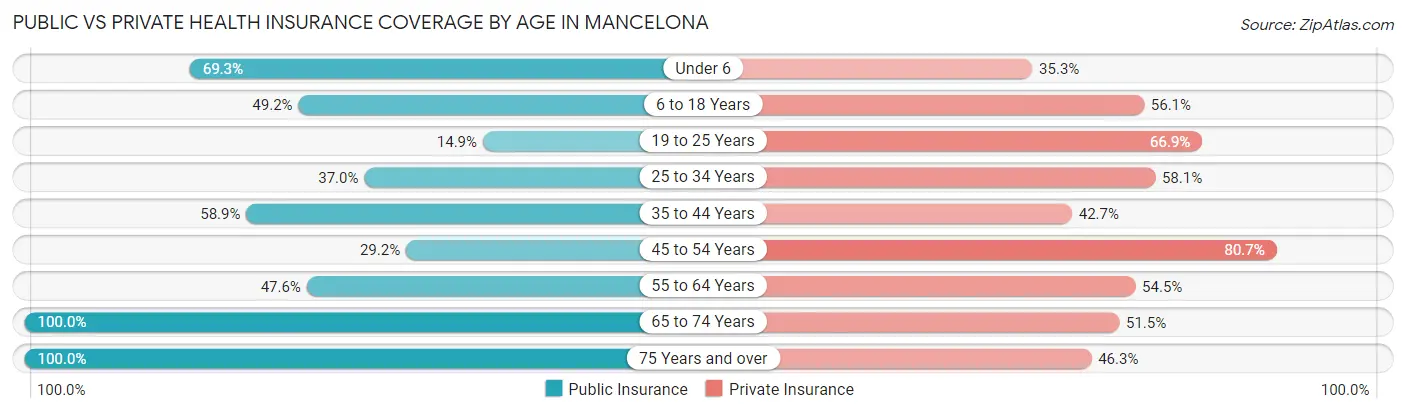
| Age Bracket | Public Insurance | Private Insurance |
| Under 6 | 104 (69.3%) | 53 (35.3%) |
| 6 to 18 Years | 150 (49.2%) | 171 (56.1%) |
| 19 to 25 Years | 23 (14.9%) | 103 (66.9%) |
| 25 to 34 Years | 75 (36.9%) | 118 (58.1%) |
| 35 to 44 Years | 153 (58.9%) | 111 (42.7%) |
| 45 to 54 Years | 59 (29.2%) | 163 (80.7%) |
| 55 to 64 Years | 91 (47.6%) | 104 (54.4%) |
| 65 to 74 Years | 103 (100.0%) | 53 (51.5%) |
| 75 Years and over | 54 (100.0%) | 25 (46.3%) |
| Total | 812 (50.1%) | 901 (55.5%) |
Disability Status by Sex by Age in Mancelona
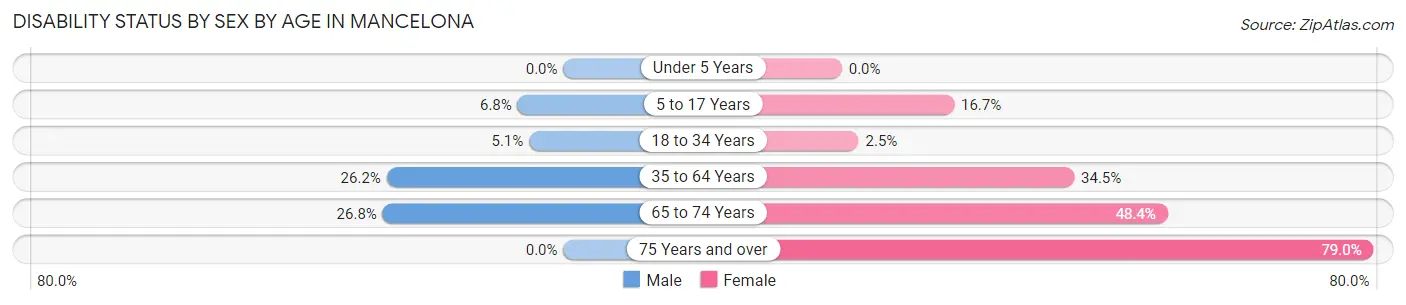
| Age Bracket | Male | Female |
| Under 5 Years | 0 (0.0%) | 0 (0.0%) |
| 5 to 17 Years | 11 (6.8%) | 26 (16.7%) |
| 18 to 34 Years | 9 (5.1%) | 5 (2.5%) |
| 35 to 64 Years | 74 (26.2%) | 128 (34.5%) |
| 65 to 74 Years | 11 (26.8%) | 30 (48.4%) |
| 75 Years and over | 0 (0.0%) | 30 (78.9%) |
Disability Class by Sex by Age in Mancelona
Disability Class: Hearing Difficulty
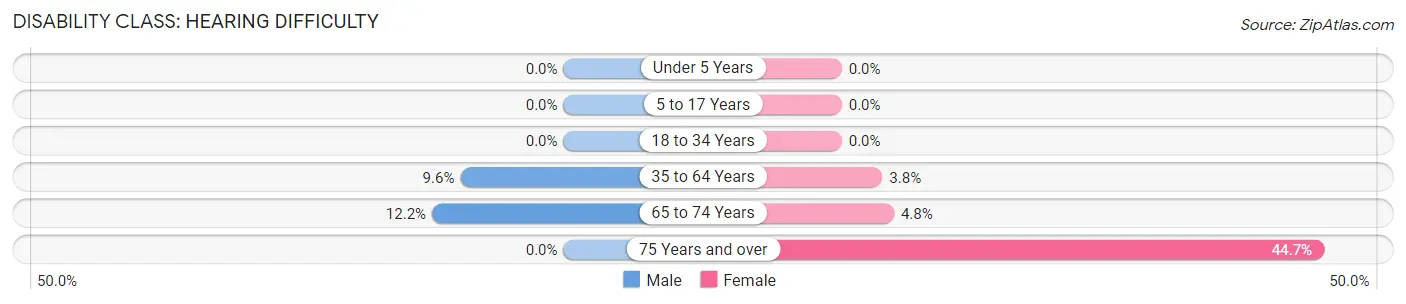
| Age Bracket | Male | Female |
| Under 5 Years | 0 (0.0%) | 0 (0.0%) |
| 5 to 17 Years | 0 (0.0%) | 0 (0.0%) |
| 18 to 34 Years | 0 (0.0%) | 0 (0.0%) |
| 35 to 64 Years | 27 (9.6%) | 14 (3.8%) |
| 65 to 74 Years | 5 (12.2%) | 3 (4.8%) |
| 75 Years and over | 0 (0.0%) | 17 (44.7%) |
Disability Class: Vision Difficulty
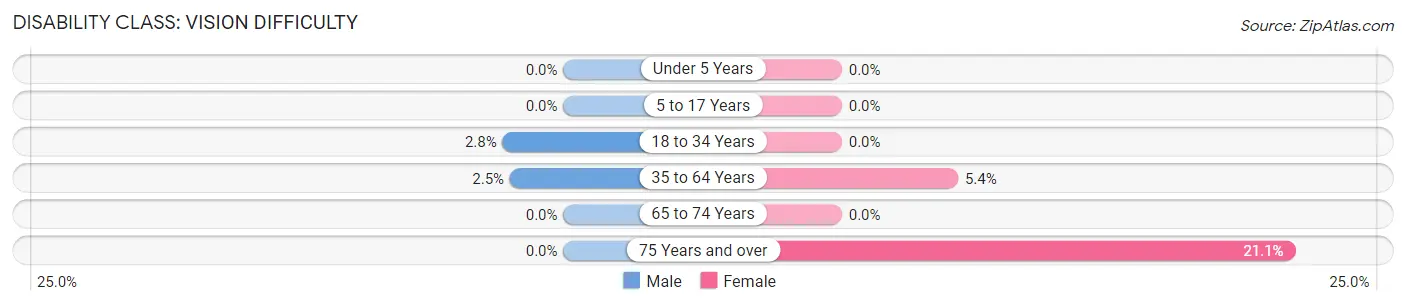
| Age Bracket | Male | Female |
| Under 5 Years | 0 (0.0%) | 0 (0.0%) |
| 5 to 17 Years | 0 (0.0%) | 0 (0.0%) |
| 18 to 34 Years | 5 (2.8%) | 0 (0.0%) |
| 35 to 64 Years | 7 (2.5%) | 20 (5.4%) |
| 65 to 74 Years | 0 (0.0%) | 0 (0.0%) |
| 75 Years and over | 0 (0.0%) | 8 (21.0%) |
Disability Class: Cognitive Difficulty
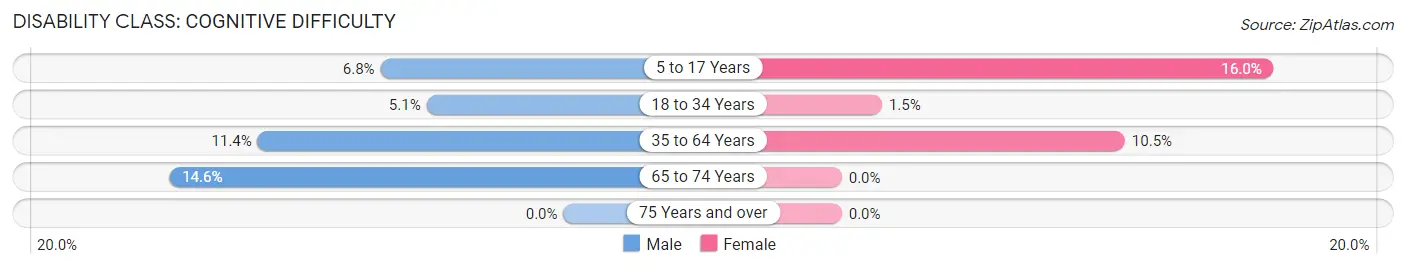
| Age Bracket | Male | Female |
| 5 to 17 Years | 11 (6.8%) | 25 (16.0%) |
| 18 to 34 Years | 9 (5.1%) | 3 (1.5%) |
| 35 to 64 Years | 32 (11.4%) | 39 (10.5%) |
| 65 to 74 Years | 6 (14.6%) | 0 (0.0%) |
| 75 Years and over | 0 (0.0%) | 0 (0.0%) |
Disability Class: Ambulatory Difficulty
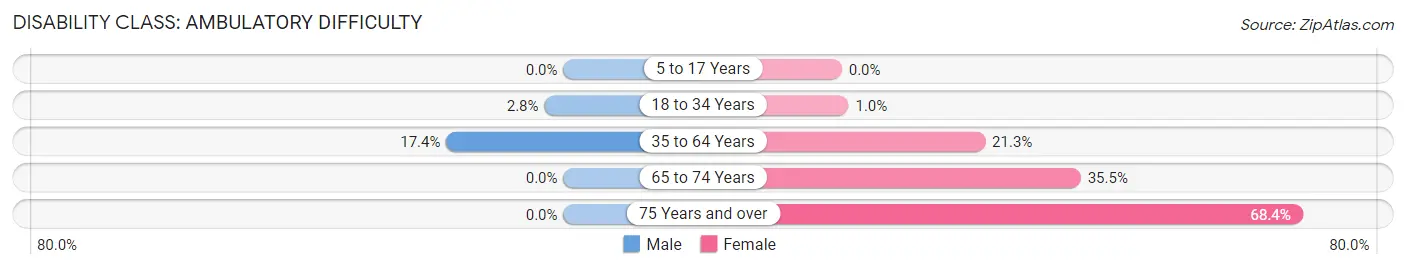
| Age Bracket | Male | Female |
| 5 to 17 Years | 0 (0.0%) | 0 (0.0%) |
| 18 to 34 Years | 5 (2.8%) | 2 (1.0%) |
| 35 to 64 Years | 49 (17.4%) | 79 (21.3%) |
| 65 to 74 Years | 0 (0.0%) | 22 (35.5%) |
| 75 Years and over | 0 (0.0%) | 26 (68.4%) |
Disability Class: Self-Care Difficulty
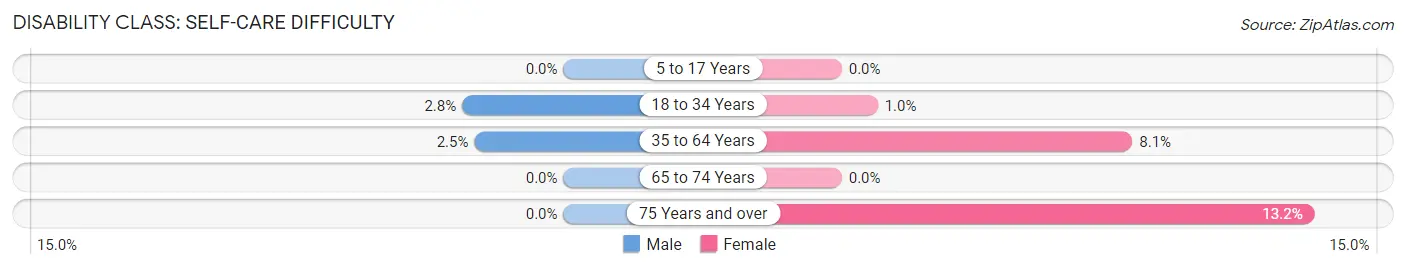
| Age Bracket | Male | Female |
| 5 to 17 Years | 0 (0.0%) | 0 (0.0%) |
| 18 to 34 Years | 5 (2.8%) | 2 (1.0%) |
| 35 to 64 Years | 7 (2.5%) | 30 (8.1%) |
| 65 to 74 Years | 0 (0.0%) | 0 (0.0%) |
| 75 Years and over | 0 (0.0%) | 5 (13.2%) |
Technology Access in Mancelona
Computing Device Access in Mancelona
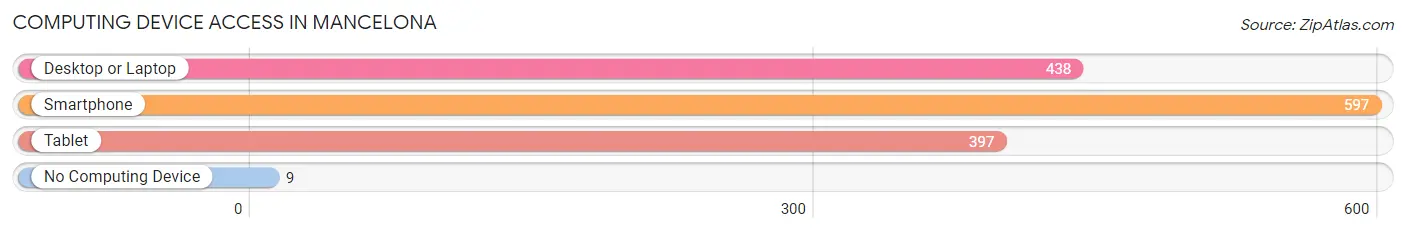
| Device Type | # Households | % Households |
| Desktop or Laptop | 438 | 65.9% |
| Smartphone | 597 | 89.8% |
| Tablet | 397 | 59.7% |
| No Computing Device | 9 | 1.3% |
| Total | 665 | 100.0% |
Internet Access in Mancelona
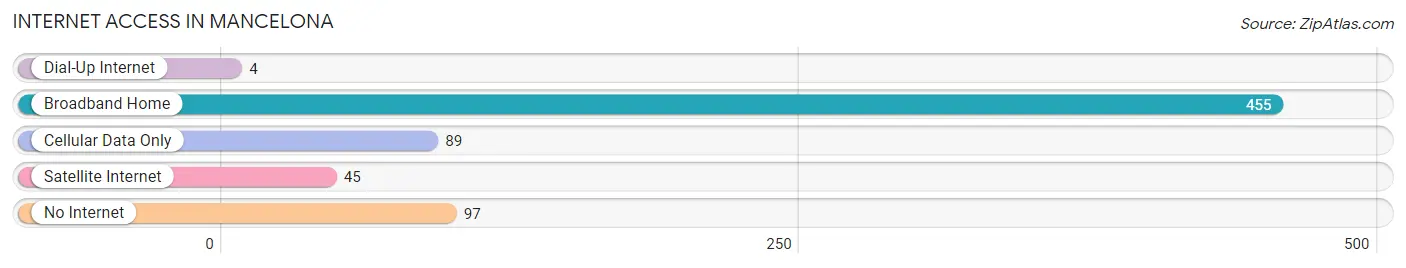
| Internet Type | # Households | % Households |
| Dial-Up Internet | 4 | 0.6% |
| Broadband Home | 455 | 68.4% |
| Cellular Data Only | 89 | 13.4% |
| Satellite Internet | 45 | 6.8% |
| No Internet | 97 | 14.6% |
| Total | 665 | 100.0% |
Mancelona Summary
Mancelona is a small town located in the northwest corner of Michigan’s Lower Peninsula. It is situated in Antrim County, approximately 30 miles northeast of Traverse City. The town was founded in 1871 and is named after the Mancelona Creek, which runs through the area. The population of Mancelona was 1,845 at the 2010 census.
History
Mancelona was founded in 1871 by a group of settlers from Ohio. The town was originally known as “Mancelona Station” due to its location on the Grand Rapids and Indiana Railroad. The town was officially incorporated in 1887.
In the early 1900s, Mancelona was a thriving lumber town. The town was home to several sawmills and lumber companies, including the Mancelona Lumber Company, which was founded in 1902. The lumber industry was the primary source of employment for the town’s residents.
In the 1920s, the lumber industry began to decline and the town’s economy shifted to agriculture. The town was home to several dairy farms and orchards. The town also became a popular tourist destination, with several resorts and campgrounds located in the area.
Geography
Mancelona is located in the northwest corner of Michigan’s Lower Peninsula. It is situated in Antrim County, approximately 30 miles northeast of Traverse City. The town is located on the Mancelona Creek, which runs through the area.
The town is surrounded by several lakes, including Lake Bellaire, Lake Skegemog, and Lake Mancelona. The area is also home to several state parks, including the Mancelona State Forest and the Mancelona State Game Area.
Economy
The economy of Mancelona is largely based on tourism and agriculture. The town is home to several resorts and campgrounds, as well as several dairy farms and orchards. The town is also home to several manufacturing companies, including a furniture factory and a plastics factory.
Demographics
As of the 2010 census, the population of Mancelona was 1,845. The racial makeup of the town was 95.3% White, 0.7% African American, 0.3% Native American, 0.3% Asian, 0.1% Pacific Islander, 0.7% from other races, and 2.0% from two or more races. Hispanic or Latino of any race were 2.2% of the population.
The median income for a household in Mancelona was $37,917, and the median income for a family was $45,000. The per capita income for the town was $19,845. About 11.2% of families and 14.2% of the population were below the poverty line, including 19.2% of those under age 18 and 8.3% of those age 65 or over.
Common Questions
What is Per Capita Income in Mancelona?
Per Capita income in Mancelona is $26,999.
What is the Median Family Income in Mancelona?
Median Family Income in Mancelona is $49,205.
What is the Median Household income in Mancelona?
Median Household Income in Mancelona is $50,329.
What is Income or Wage Gap in Mancelona?
Income or Wage Gap in Mancelona is 33.3%.
Women in Mancelona earn 66.7 cents for every dollar earned by a man.
What is Family Income Deficit in Mancelona?
Family Income Deficit in Mancelona is $12,229.
Families that are below poverty line in Mancelona earn $12,229 less on average than the poverty threshold level.
What is Inequality or Gini Index in Mancelona?
Inequality or Gini Index in Mancelona is 0.43.
What is the Total Population of Mancelona?
Total Population of Mancelona is 1,622.
What is the Total Male Population of Mancelona?
Total Male Population of Mancelona is 771.
What is the Total Female Population of Mancelona?
Total Female Population of Mancelona is 851.
What is the Ratio of Males per 100 Females in Mancelona?
There are 90.60 Males per 100 Females in Mancelona.
What is the Ratio of Females per 100 Males in Mancelona?
There are 110.38 Females per 100 Males in Mancelona.
What is the Median Population Age in Mancelona?
Median Population Age in Mancelona is 35.0 Years.
What is the Average Family Size in Mancelona
Average Family Size in Mancelona is 2.9 People.
What is the Average Household Size in Mancelona
Average Household Size in Mancelona is 2.4 People.
How Large is the Labor Force in Mancelona?
There are 826 People in the Labor Forcein in Mancelona.
What is the Percentage of People in the Labor Force in Mancelona?
68.0% of People are in the Labor Force in Mancelona.
What is the Unemployment Rate in Mancelona?
Unemployment Rate in Mancelona is 11.6%.