Zip Codes with the Highest Percentage of Population Employed in Accommodation & Food Services in Burton, MI
RELATED REPORTS & OPTIONS
Accommodation & Food Services
Burton
Compare Zip Codes
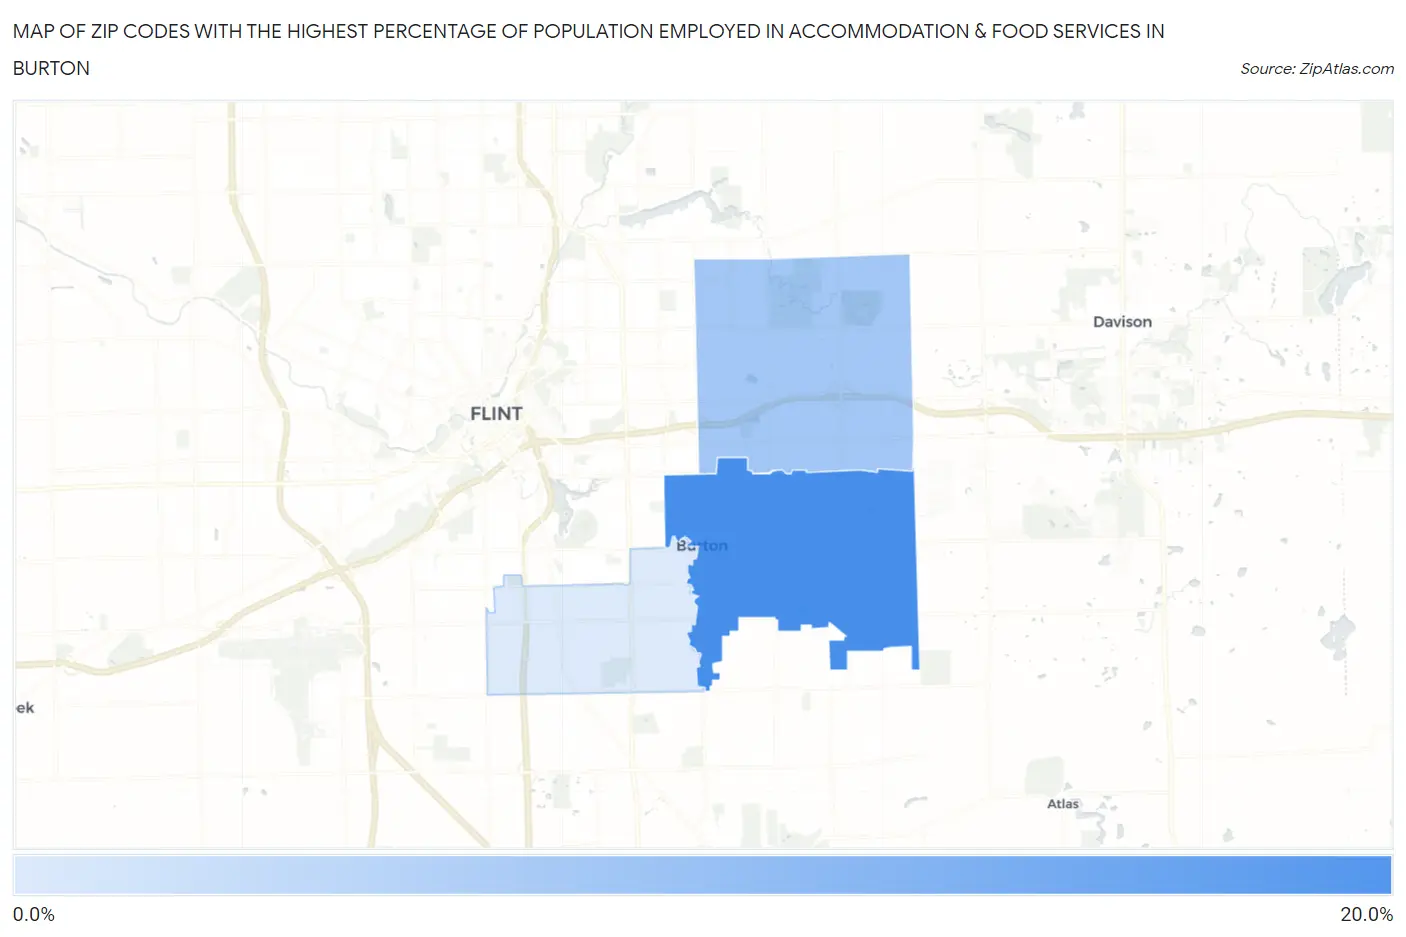
Map of Zip Codes with the Highest Percentage of Population Employed in Accommodation & Food Services in Burton
5.9%
15.1%
Zip Codes with the Highest Percentage of Population Employed in Accommodation & Food Services in Burton, MI
| Zip Code | % Employed | vs State | vs National | |
| 1. | 48519 | 15.1% | 7.1%(+8.00)#39 | 6.9%(+8.20)#1,651 |
| 2. | 48509 | 9.4% | 7.1%(+2.27)#189 | 6.9%(+2.47)#5,421 |
| 3. | 48529 | 5.9% | 7.1%(-1.15)#541 | 6.9%(-0.943)#13,646 |
1
Common Questions
What are the Top Zip Codes with the Highest Percentage of Population Employed in Accommodation & Food Services in Burton, MI?
Top Zip Codes with the Highest Percentage of Population Employed in Accommodation & Food Services in Burton, MI are:
What zip code has the Highest Percentage of Population Employed in Accommodation & Food Services in Burton, MI?
48519 has the Highest Percentage of Population Employed in Accommodation & Food Services in Burton, MI with 15.1%.
What is the Percentage of Population Employed in Accommodation & Food Services in Burton, MI?
Percentage of Population Employed in Accommodation & Food Services in Burton is 10.1%.
What is the Percentage of Population Employed in Accommodation & Food Services in Michigan?
Percentage of Population Employed in Accommodation & Food Services in Michigan is 7.1%.
What is the Percentage of Population Employed in Accommodation & Food Services in the United States?
Percentage of Population Employed in Accommodation & Food Services in the United States is 6.9%.