Zip Codes with the Highest Percentage of Population Employed in Legal Services & Support in Laurel, MD
RELATED REPORTS & OPTIONS
Legal Services & Support
Laurel
Compare Zip Codes
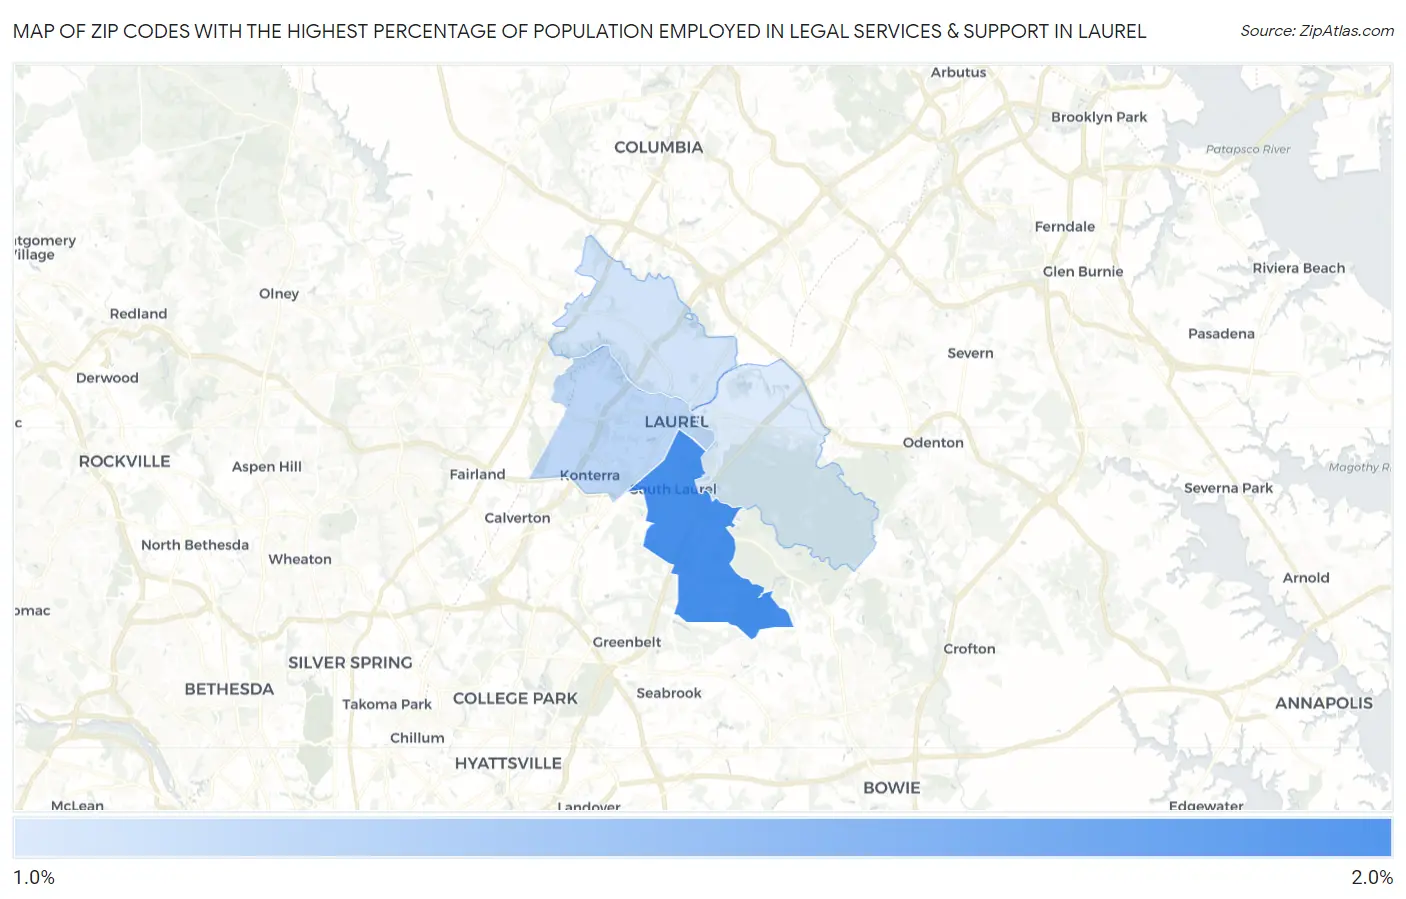
Map of Zip Codes with the Highest Percentage of Population Employed in Legal Services & Support in Laurel
1.5%
1.9%
Zip Codes with the Highest Percentage of Population Employed in Legal Services & Support in Laurel, MD
| Zip Code | % Employed | vs State | vs National | |
| 1. | 20708 | 1.9% | 1.8%(+0.080)#117 | 1.2%(+0.669)#3,858 |
| 2. | 20707 | 1.6% | 1.8%(-0.185)#136 | 1.2%(+0.404)#4,714 |
| 3. | 20723 | 1.5% | 1.8%(-0.232)#140 | 1.2%(+0.358)#4,883 |
| 4. | 20724 | 1.5% | 1.8%(-0.259)#143 | 1.2%(+0.330)#4,990 |
1
Common Questions
What are the Top 3 Zip Codes with the Highest Percentage of Population Employed in Legal Services & Support in Laurel, MD?
Top 3 Zip Codes with the Highest Percentage of Population Employed in Legal Services & Support in Laurel, MD are:
What zip code has the Highest Percentage of Population Employed in Legal Services & Support in Laurel, MD?
20708 has the Highest Percentage of Population Employed in Legal Services & Support in Laurel, MD with 1.9%.
What is the Percentage of Population Employed in Legal Services & Support in Laurel, MD?
Percentage of Population Employed in Legal Services & Support in Laurel is 1.4%.
What is the Percentage of Population Employed in Legal Services & Support in Maryland?
Percentage of Population Employed in Legal Services & Support in Maryland is 1.8%.
What is the Percentage of Population Employed in Legal Services & Support in the United States?
Percentage of Population Employed in Legal Services & Support in the United States is 1.2%.