Seat Pleasant, MD Map & Demographics
Seat Pleasant Map
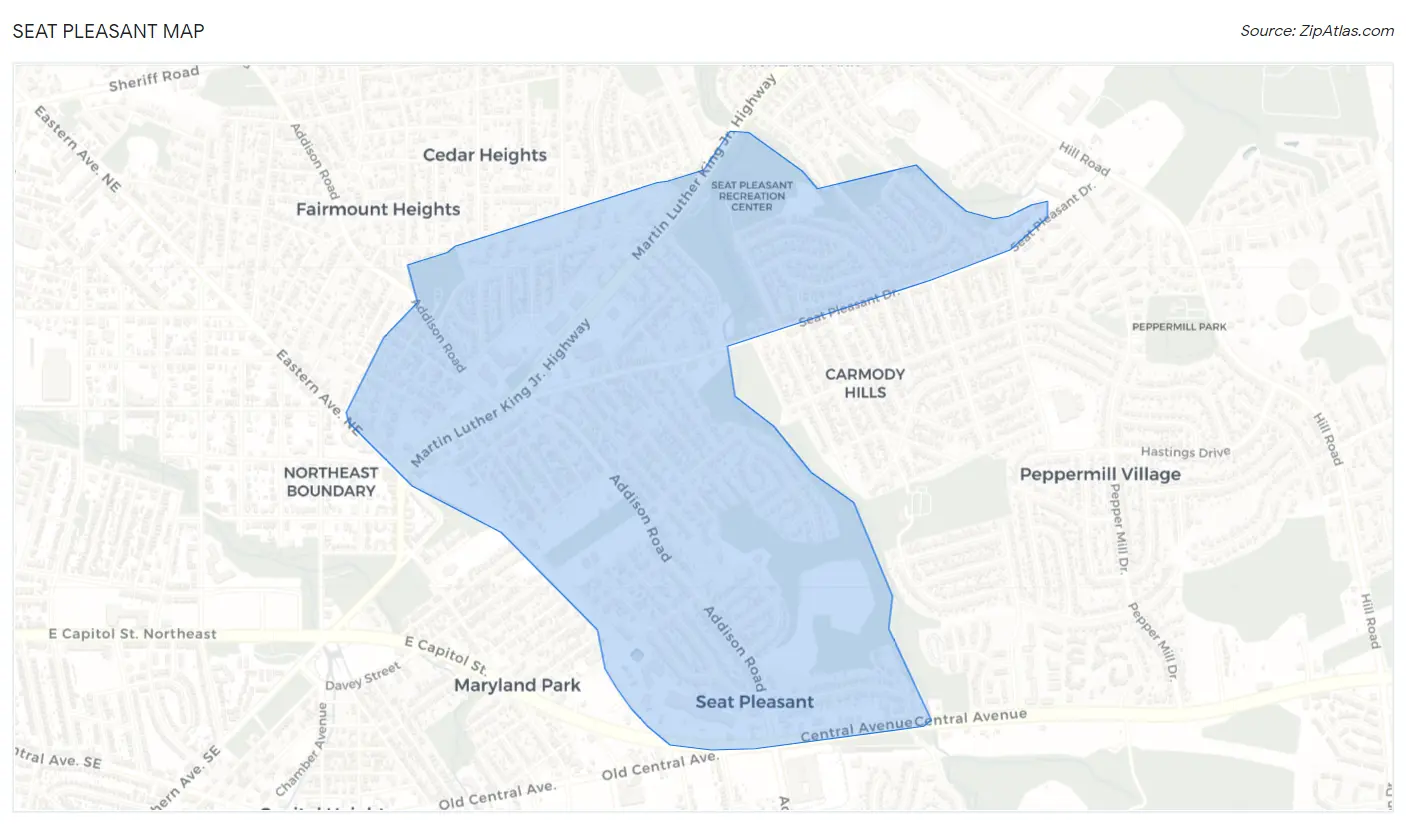
Seat Pleasant Overview
$36,959
PER CAPITA INCOME
$71,288
AVG FAMILY INCOME
$54,613
AVG HOUSEHOLD INCOME
25.4%
WAGE / INCOME GAP [ % ]
74.6¢/ $1
WAGE / INCOME GAP [ $ ]
0.47
INEQUALITY / GINI INDEX
4,544
TOTAL POPULATION
1,837
MALE POPULATION
2,707
FEMALE POPULATION
67.86
MALES / 100 FEMALES
147.36
FEMALES / 100 MALES
43.4
MEDIAN AGE
3.3
AVG FAMILY SIZE
2.2
AVG HOUSEHOLD SIZE
2,426
LABOR FORCE [ PEOPLE ]
67.0%
PERCENT IN LABOR FORCE
18.9%
UNEMPLOYMENT RATE
Income in Seat Pleasant
Income Overview in Seat Pleasant
Per Capita Income in Seat Pleasant is $36,959, while median incomes of families and households are $71,288 and $54,613 respectively.
| Characteristic | Number | Measure |
| Per Capita Income | 4,544 | $36,959 |
| Median Family Income | 980 | $71,288 |
| Mean Family Income | 980 | $107,915 |
| Median Household Income | 2,052 | $54,613 |
| Mean Household Income | 2,052 | $75,652 |
| Income Deficit | 980 | $0 |
| Wage / Income Gap (%) | 4,544 | 25.42% |
| Wage / Income Gap ($) | 4,544 | 74.58¢ per $1 |
| Gini / Inequality Index | 4,544 | 0.47 |
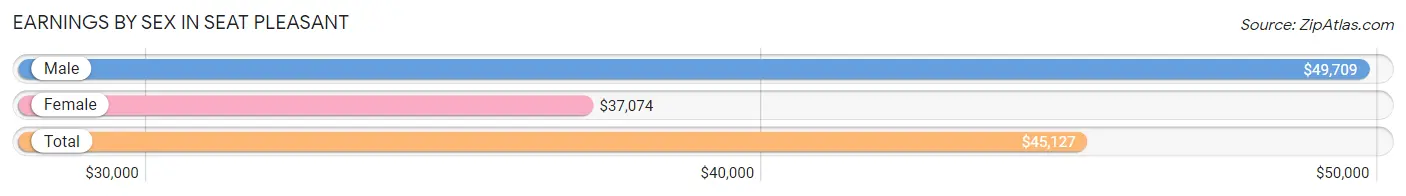
Earnings by Sex in Seat Pleasant
Average Earnings in Seat Pleasant are $45,127, $49,709 for men and $37,074 for women, a difference of 25.4%.
| Sex | Number | Average Earnings |
| Male | 1,238 (51.4%) | $49,709 |
| Female | 1,172 (48.6%) | $37,074 |
| Total | 2,410 (100.0%) | $45,127 |
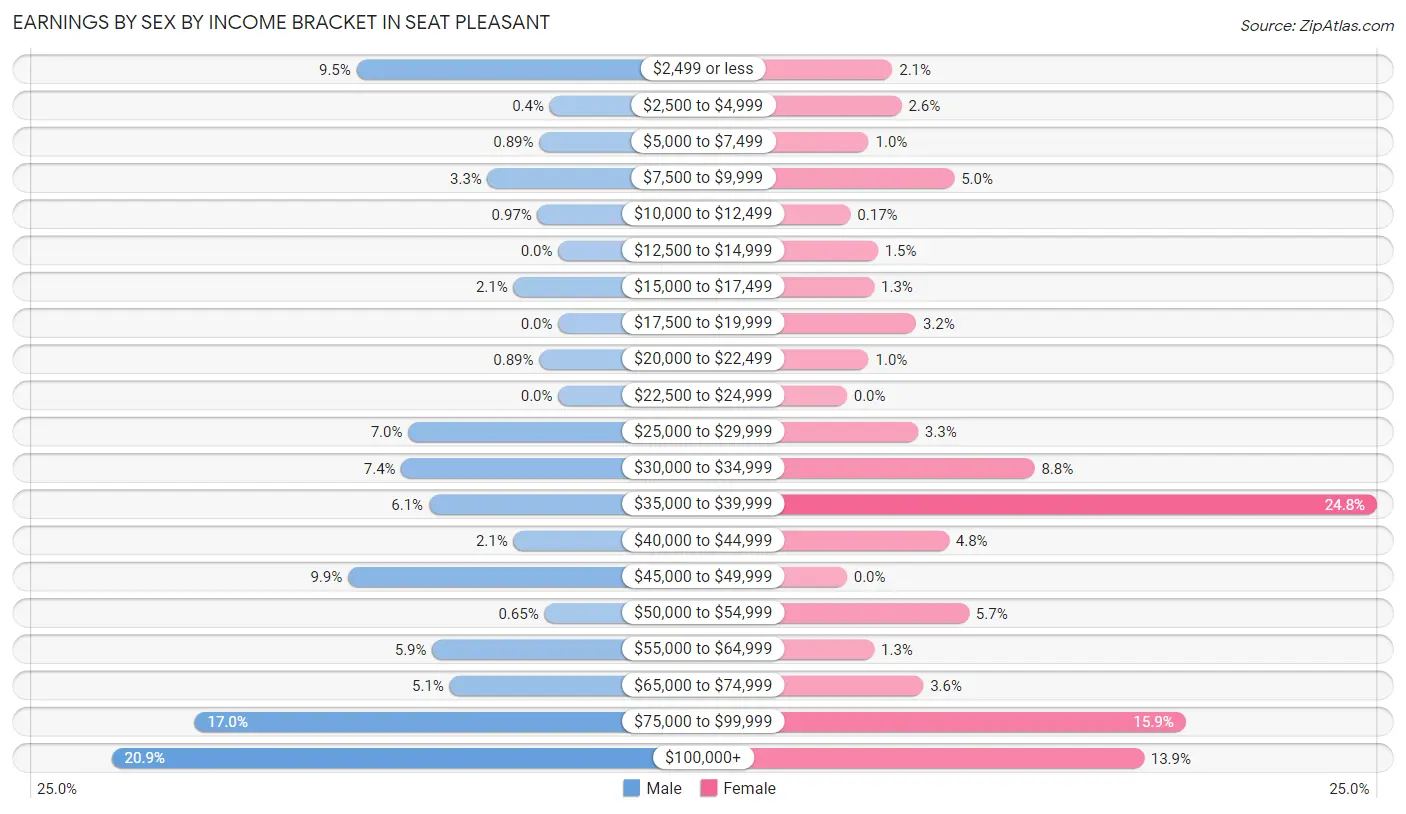
Earnings by Sex by Income Bracket in Seat Pleasant
The most common earnings brackets in Seat Pleasant are $100,000+ for men (259 | 20.9%) and $35,000 to $39,999 for women (291 | 24.8%).
| Income | Male | Female |
| $2,499 or less | 117 (9.5%) | 25 (2.1%) |
| $2,500 to $4,999 | 5 (0.4%) | 30 (2.6%) |
| $5,000 to $7,499 | 11 (0.9%) | 12 (1.0%) |
| $7,500 to $9,999 | 41 (3.3%) | 59 (5.0%) |
| $10,000 to $12,499 | 12 (1.0%) | 2 (0.2%) |
| $12,500 to $14,999 | 0 (0.0%) | 17 (1.5%) |
| $15,000 to $17,499 | 26 (2.1%) | 15 (1.3%) |
| $17,500 to $19,999 | 0 (0.0%) | 38 (3.2%) |
| $20,000 to $22,499 | 11 (0.9%) | 12 (1.0%) |
| $22,500 to $24,999 | 0 (0.0%) | 0 (0.0%) |
| $25,000 to $29,999 | 87 (7.0%) | 39 (3.3%) |
| $30,000 to $34,999 | 91 (7.3%) | 103 (8.8%) |
| $35,000 to $39,999 | 75 (6.1%) | 291 (24.8%) |
| $40,000 to $44,999 | 26 (2.1%) | 56 (4.8%) |
| $45,000 to $49,999 | 122 (9.9%) | 0 (0.0%) |
| $50,000 to $54,999 | 8 (0.6%) | 67 (5.7%) |
| $55,000 to $64,999 | 73 (5.9%) | 15 (1.3%) |
| $65,000 to $74,999 | 63 (5.1%) | 42 (3.6%) |
| $75,000 to $99,999 | 211 (17.0%) | 186 (15.9%) |
| $100,000+ | 259 (20.9%) | 163 (13.9%) |
| Total | 1,238 (100.0%) | 1,172 (100.0%) |
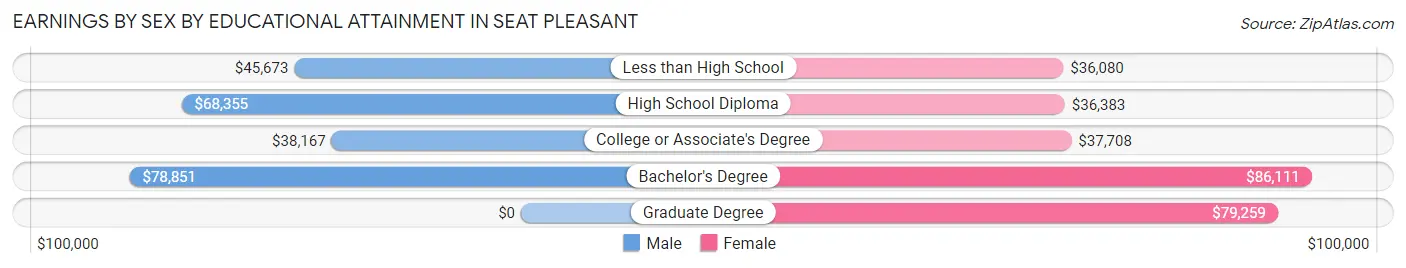
Earnings by Sex by Educational Attainment in Seat Pleasant
Average earnings in Seat Pleasant are $58,109 for men and $37,114 for women, a difference of 36.1%. Men with an educational attainment of bachelor's degree enjoy the highest average annual earnings of $78,851, while those with college or associate's degree education earn the least with $38,167. Women with an educational attainment of bachelor's degree earn the most with the average annual earnings of $86,111, while those with less than high school education have the smallest earnings of $36,080.
| Educational Attainment | Male Income | Female Income |
| Less than High School | $45,673 | $36,080 |
| High School Diploma | $68,355 | $36,383 |
| College or Associate's Degree | $38,167 | $37,708 |
| Bachelor's Degree | $78,851 | $86,111 |
| Graduate Degree | - | - |
| Total | $58,109 | $37,114 |
Family Income in Seat Pleasant
Family Income Brackets in Seat Pleasant
According to the Seat Pleasant family income data, there are 293 families falling into the $50,000 to $74,999 income range, which is the most common income bracket and makes up 29.9% of all families.
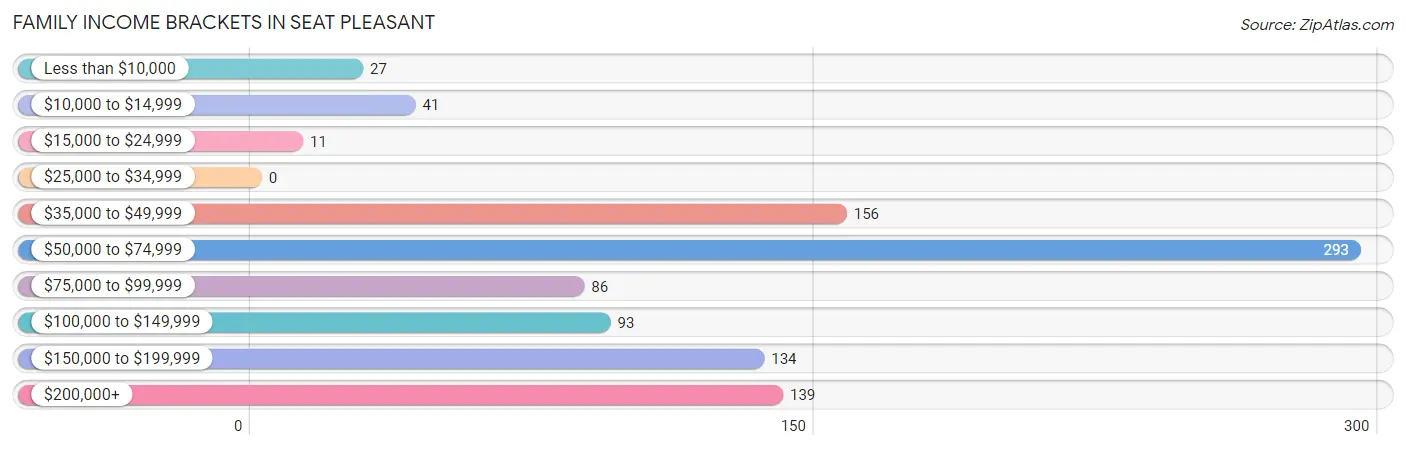
| Income Bracket | # Families | % Families |
| Less than $10,000 | 27 | 2.8% |
| $10,000 to $14,999 | 41 | 4.2% |
| $15,000 to $24,999 | 11 | 1.1% |
| $25,000 to $34,999 | 0 | 0.0% |
| $35,000 to $49,999 | 156 | 15.9% |
| $50,000 to $74,999 | 293 | 29.9% |
| $75,000 to $99,999 | 86 | 8.8% |
| $100,000 to $149,999 | 93 | 9.5% |
| $150,000 to $199,999 | 134 | 13.7% |
| $200,000+ | 139 | 14.2% |
Family Income by Famaliy Size in Seat Pleasant
4-person families (126 | 12.9%) account for the highest median family income in Seat Pleasant with $98,864 per family, while 2-person families (426 | 43.5%) have the highest median income of $31,607 per family member.
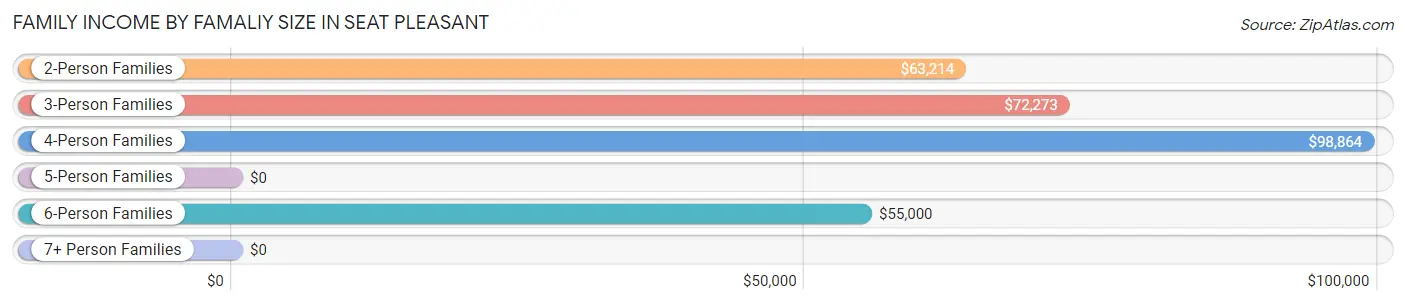
| Income Bracket | # Families | Median Income |
| 2-Person Families | 426 (43.5%) | $63,214 |
| 3-Person Families | 314 (32.0%) | $72,273 |
| 4-Person Families | 126 (12.9%) | $98,864 |
| 5-Person Families | 36 (3.7%) | $0 |
| 6-Person Families | 78 (8.0%) | $55,000 |
| 7+ Person Families | 0 (0.0%) | $0 |
| Total | 980 (100.0%) | $71,288 |
Family Income by Number of Earners in Seat Pleasant
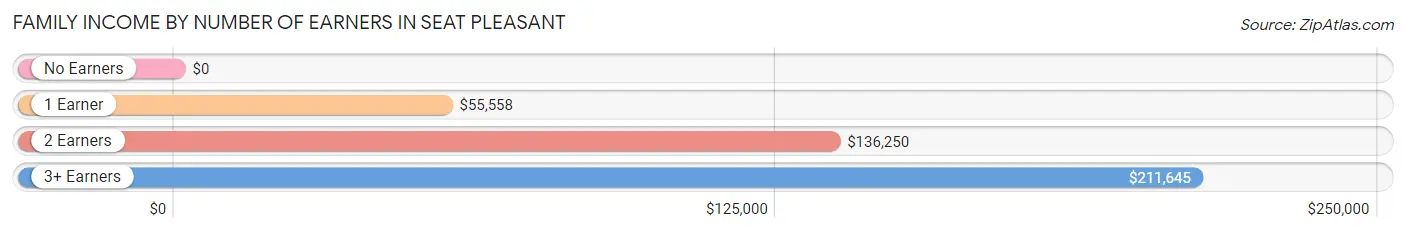
| Number of Earners | # Families | Median Income |
| No Earners | 94 (9.6%) | $0 |
| 1 Earner | 477 (48.7%) | $55,558 |
| 2 Earners | 260 (26.5%) | $136,250 |
| 3+ Earners | 149 (15.2%) | $211,645 |
| Total | 980 (100.0%) | $71,288 |
Household Income in Seat Pleasant
Household Income Brackets in Seat Pleasant
With 394 households falling in the category, the $35,000 to $49,999 income range is the most frequent in Seat Pleasant, accounting for 19.2% of all households. In contrast, only 12 households (0.6%) fall into the $25,000 to $34,999 income bracket, making it the least populous group.
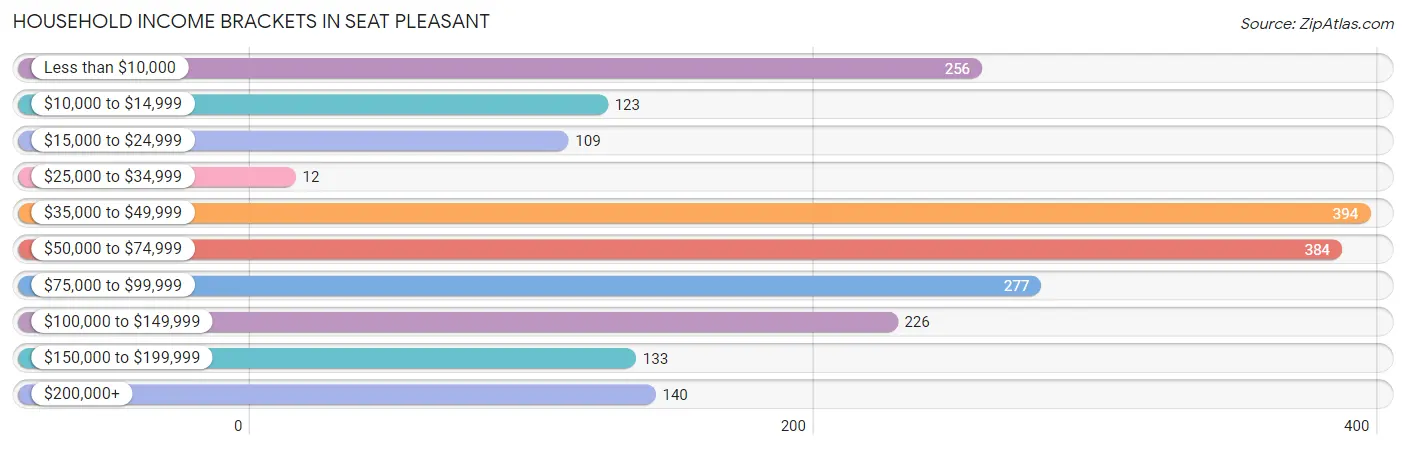
| Income Bracket | # Households | % Households |
| Less than $10,000 | 256 | 12.5% |
| $10,000 to $14,999 | 123 | 6.0% |
| $15,000 to $24,999 | 109 | 5.3% |
| $25,000 to $34,999 | 12 | 0.6% |
| $35,000 to $49,999 | 394 | 19.2% |
| $50,000 to $74,999 | 384 | 18.7% |
| $75,000 to $99,999 | 277 | 13.5% |
| $100,000 to $149,999 | 226 | 11.0% |
| $150,000 to $199,999 | 133 | 6.5% |
| $200,000+ | 140 | 6.8% |
Household Income by Householder Age in Seat Pleasant
The median household income in Seat Pleasant is $54,613, with the highest median household income of $78,036 found in the 45 to 64 years age bracket for the primary householder. A total of 867 households (42.2%) fall into this category.
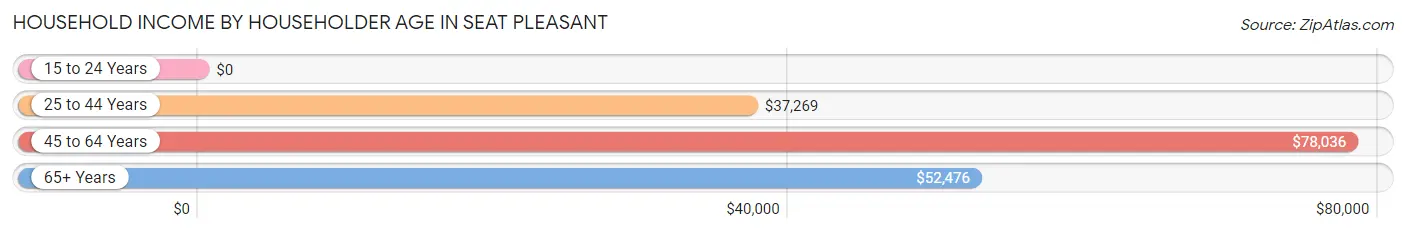
| Income Bracket | # Households | Median Income |
| 15 to 24 Years | 0 (0.0%) | $0 |
| 25 to 44 Years | 588 (28.6%) | $37,269 |
| 45 to 64 Years | 867 (42.2%) | $78,036 |
| 65+ Years | 597 (29.1%) | $52,476 |
| Total | 2,052 (100.0%) | $54,613 |
Poverty in Seat Pleasant
Income Below Poverty by Sex and Age in Seat Pleasant
With 4.7% poverty level for males and 20.9% for females among the residents of Seat Pleasant, 65 to 74 year old males and 12 to 14 year old females are the most vulnerable to poverty, with 37 males (21.0%) and 41 females (45.1%) in their respective age groups living below the poverty level.
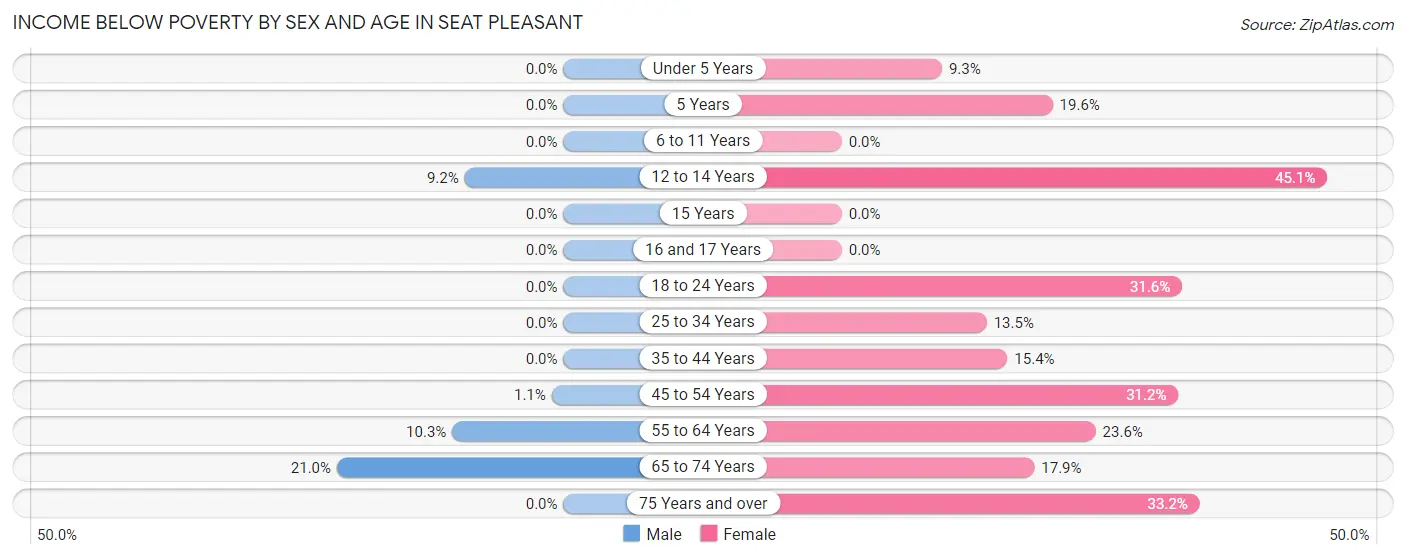
| Age Bracket | Male | Female |
| Under 5 Years | 0 (0.0%) | 28 (9.3%) |
| 5 Years | 0 (0.0%) | 27 (19.6%) |
| 6 to 11 Years | 0 (0.0%) | 0 (0.0%) |
| 12 to 14 Years | 11 (9.2%) | 41 (45.1%) |
| 15 Years | 0 (0.0%) | 0 (0.0%) |
| 16 and 17 Years | 0 (0.0%) | 0 (0.0%) |
| 18 to 24 Years | 0 (0.0%) | 12 (31.6%) |
| 25 to 34 Years | 0 (0.0%) | 30 (13.5%) |
| 35 to 44 Years | 0 (0.0%) | 61 (15.4%) |
| 45 to 54 Years | 3 (1.1%) | 118 (31.2%) |
| 55 to 64 Years | 35 (10.3%) | 94 (23.6%) |
| 65 to 74 Years | 37 (21.0%) | 67 (17.9%) |
| 75 Years and over | 0 (0.0%) | 87 (33.2%) |
| Total | 86 (4.7%) | 565 (20.9%) |
Income Above Poverty by Sex and Age in Seat Pleasant
According to the poverty statistics in Seat Pleasant, males aged under 5 years and females aged 6 to 11 years are the age groups that are most secure financially, with 100.0% of males and 100.0% of females in these age groups living above the poverty line.
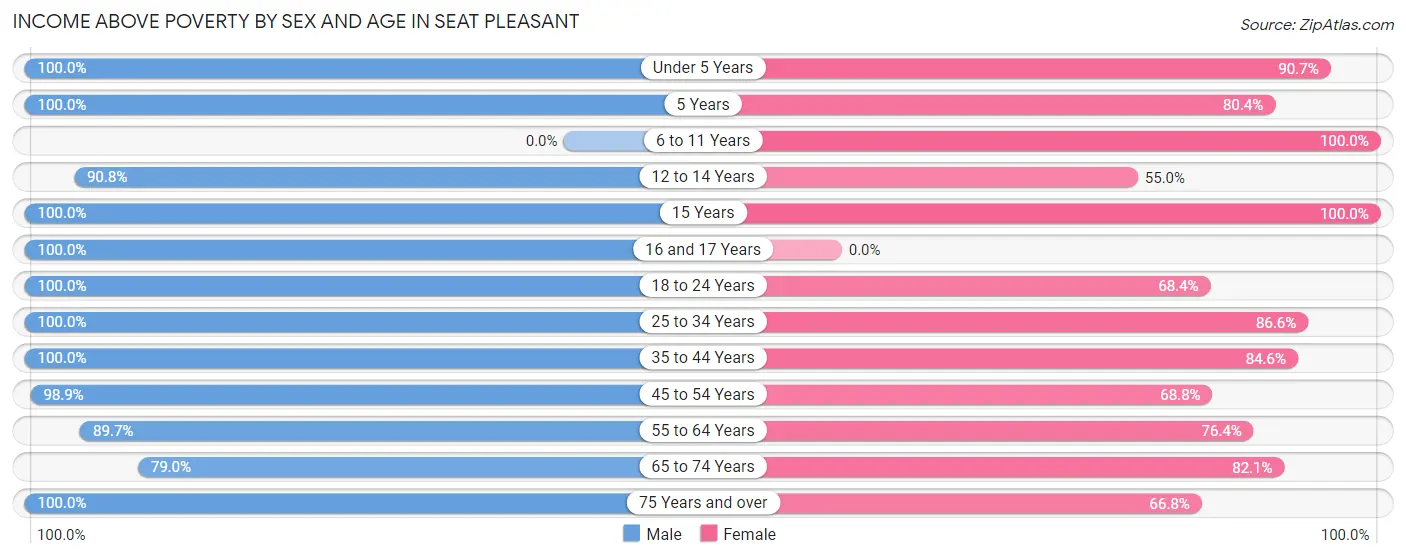
| Age Bracket | Male | Female |
| Under 5 Years | 63 (100.0%) | 273 (90.7%) |
| 5 Years | 20 (100.0%) | 111 (80.4%) |
| 6 to 11 Years | 0 (0.0%) | 59 (100.0%) |
| 12 to 14 Years | 109 (90.8%) | 50 (54.9%) |
| 15 Years | 85 (100.0%) | 46 (100.0%) |
| 16 and 17 Years | 13 (100.0%) | 0 (0.0%) |
| 18 to 24 Years | 91 (100.0%) | 26 (68.4%) |
| 25 to 34 Years | 453 (100.0%) | 193 (86.6%) |
| 35 to 44 Years | 158 (100.0%) | 336 (84.6%) |
| 45 to 54 Years | 271 (98.9%) | 260 (68.8%) |
| 55 to 64 Years | 304 (89.7%) | 305 (76.4%) |
| 65 to 74 Years | 139 (79.0%) | 308 (82.1%) |
| 75 Years and over | 45 (100.0%) | 175 (66.8%) |
| Total | 1,751 (95.3%) | 2,142 (79.1%) |
Income Below Poverty Among Married-Couple Families in Seat Pleasant
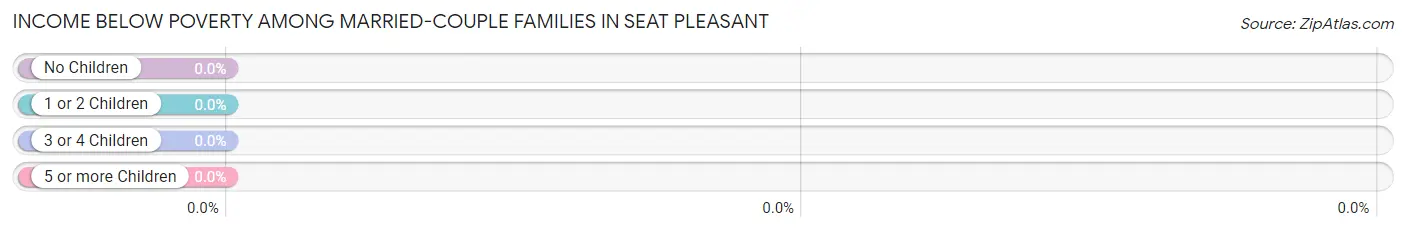
| Children | Above Poverty | Below Poverty |
| No Children | 151 (100.0%) | 0 (0.0%) |
| 1 or 2 Children | 125 (100.0%) | 0 (0.0%) |
| 3 or 4 Children | 50 (100.0%) | 0 (0.0%) |
| 5 or more Children | 0 (0.0%) | 0 (0.0%) |
| Total | 326 (100.0%) | 0 (0.0%) |
Income Below Poverty Among Single-Parent Households in Seat Pleasant
According to the poverty data in Seat Pleasant, 6.7% or 11 single-father households and 13.9% or 68 single-mother households are living below the poverty line. Among single-father households, those with 1 or 2 children have the highest poverty rate, with 11 households (27.5%) experiencing poverty. Likewise, among single-mother households, those with 1 or 2 children have the highest poverty rate, with 68 households (20.5%) falling below the poverty line.
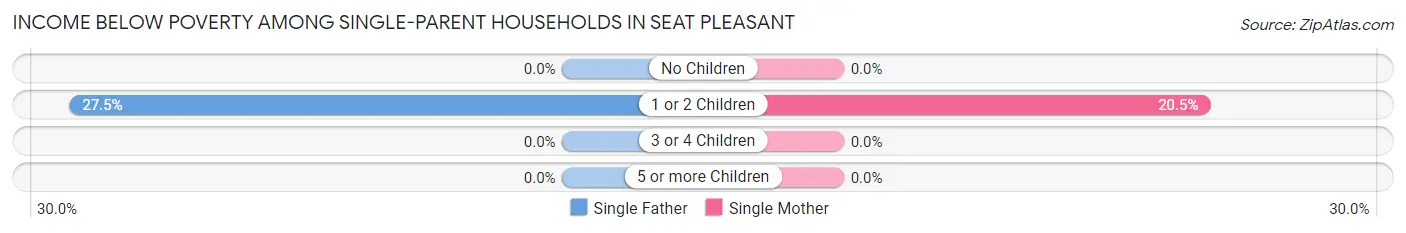
| Children | Single Father | Single Mother |
| No Children | 0 (0.0%) | 0 (0.0%) |
| 1 or 2 Children | 11 (27.5%) | 68 (20.5%) |
| 3 or 4 Children | 0 (0.0%) | 0 (0.0%) |
| 5 or more Children | 0 (0.0%) | 0 (0.0%) |
| Total | 11 (6.7%) | 68 (13.9%) |
Income Below Poverty Among Married-Couple vs Single-Parent Households in Seat Pleasant
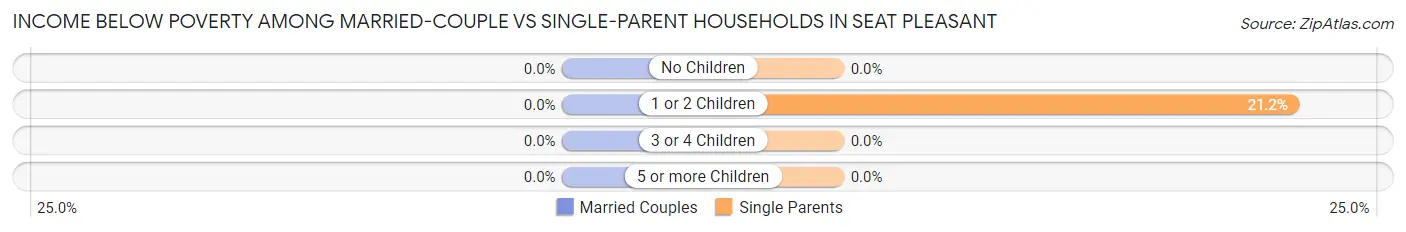
| Children | Married-Couple Families | Single-Parent Households |
| No Children | 0 (0.0%) | 0 (0.0%) |
| 1 or 2 Children | 0 (0.0%) | 79 (21.2%) |
| 3 or 4 Children | 0 (0.0%) | 0 (0.0%) |
| 5 or more Children | 0 (0.0%) | 0 (0.0%) |
| Total | 0 (0.0%) | 79 (12.1%) |
Race in Seat Pleasant
The most populous races in Seat Pleasant are Black / African American (3,866 | 85.1%), Hispanic or Latino (561 | 12.3%), and Some other Race (460 | 10.1%).
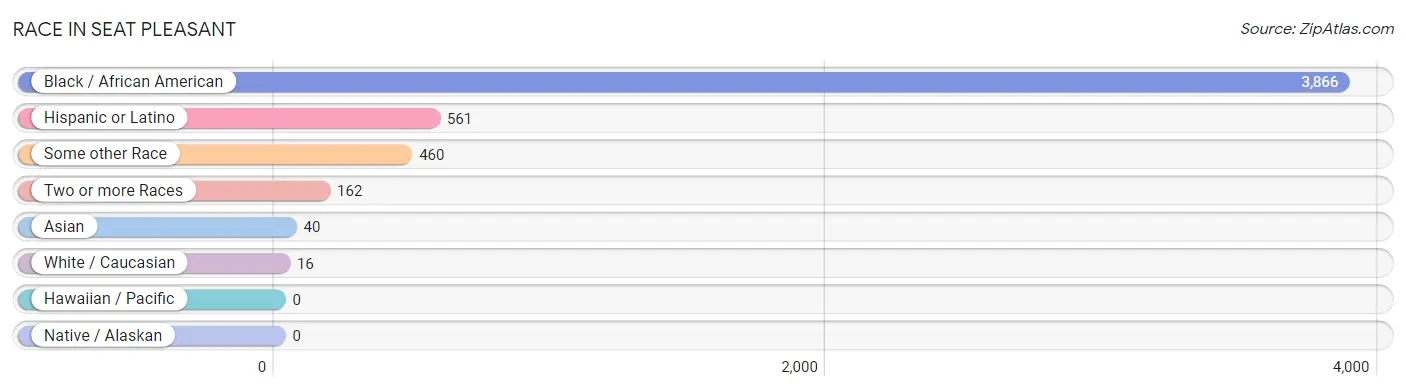
| Race | # Population | % Population |
| Asian | 40 | 0.9% |
| Black / African American | 3,866 | 85.1% |
| Hawaiian / Pacific | 0 | 0.0% |
| Hispanic or Latino | 561 | 12.3% |
| Native / Alaskan | 0 | 0.0% |
| White / Caucasian | 16 | 0.4% |
| Two or more Races | 162 | 3.6% |
| Some other Race | 460 | 10.1% |
| Total | 4,544 | 100.0% |
Ancestry in Seat Pleasant
The most populous ancestries reported in Seat Pleasant are Central American (463 | 10.2%), Salvadoran (463 | 10.2%), Subsaharan African (295 | 6.5%), Nigerian (160 | 3.5%), and African (145 | 3.2%), together accounting for 33.6% of all Seat Pleasant residents.
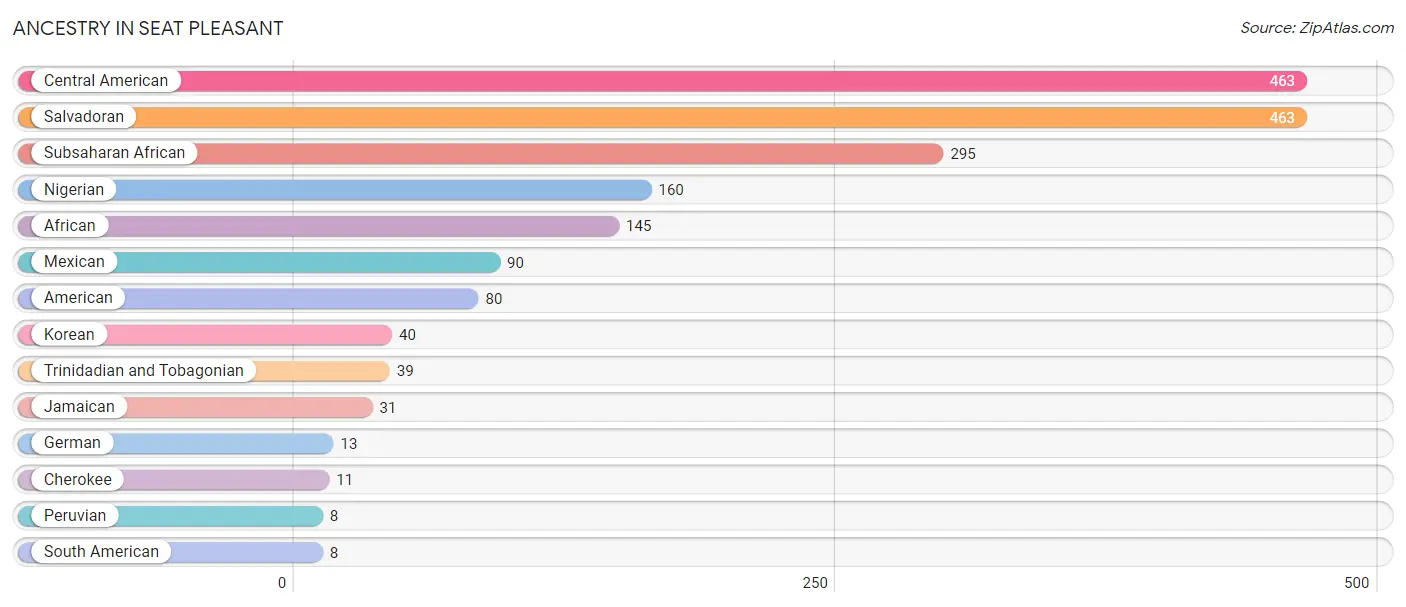
| Ancestry | # Population | % Population |
| African | 145 | 3.2% |
| American | 80 | 1.8% |
| Central American | 463 | 10.2% |
| Cherokee | 11 | 0.2% |
| German | 13 | 0.3% |
| Jamaican | 31 | 0.7% |
| Korean | 40 | 0.9% |
| Mexican | 90 | 2.0% |
| Nigerian | 160 | 3.5% |
| Peruvian | 8 | 0.2% |
| Salvadoran | 463 | 10.2% |
| South American | 8 | 0.2% |
| Subsaharan African | 295 | 6.5% |
| Trinidadian and Tobagonian | 39 | 0.9% | View All 14 Rows |
Immigrants in Seat Pleasant
The most numerous immigrant groups reported in Seat Pleasant came from Latin America (256 | 5.6%), Central America (158 | 3.5%), Africa (123 | 2.7%), Nigeria (123 | 2.7%), and Western Africa (123 | 2.7%), together accounting for 17.2% of all Seat Pleasant residents.
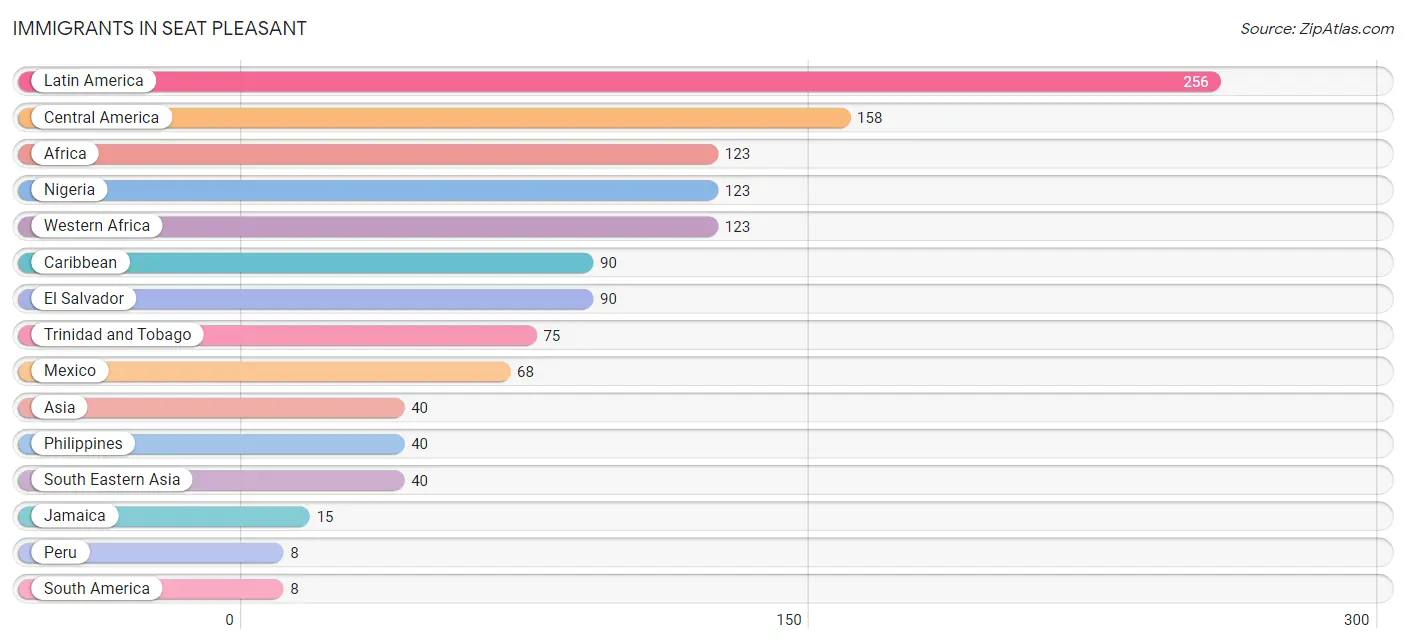
| Immigration Origin | # Population | % Population |
| Africa | 123 | 2.7% |
| Asia | 40 | 0.9% |
| Caribbean | 90 | 2.0% |
| Central America | 158 | 3.5% |
| El Salvador | 90 | 2.0% |
| Jamaica | 15 | 0.3% |
| Latin America | 256 | 5.6% |
| Mexico | 68 | 1.5% |
| Nigeria | 123 | 2.7% |
| Peru | 8 | 0.2% |
| Philippines | 40 | 0.9% |
| South America | 8 | 0.2% |
| South Eastern Asia | 40 | 0.9% |
| Trinidad and Tobago | 75 | 1.7% |
| Western Africa | 123 | 2.7% | View All 15 Rows |
Sex and Age in Seat Pleasant
Sex and Age in Seat Pleasant
The most populous age groups in Seat Pleasant are 30 to 34 Years (276 | 15.0%) for men and 35 to 39 Years (352 | 13.0%) for women.
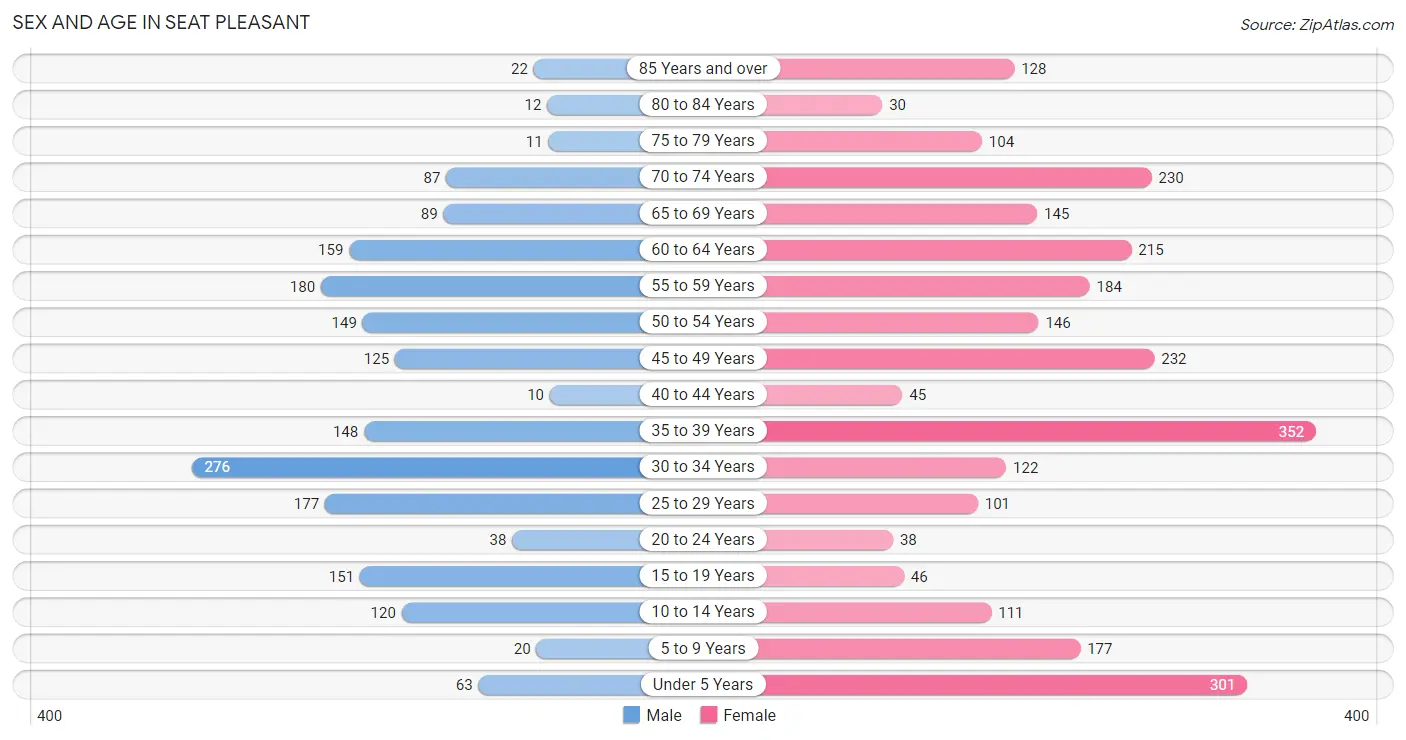
| Age Bracket | Male | Female |
| Under 5 Years | 63 (3.4%) | 301 (11.1%) |
| 5 to 9 Years | 20 (1.1%) | 177 (6.5%) |
| 10 to 14 Years | 120 (6.5%) | 111 (4.1%) |
| 15 to 19 Years | 151 (8.2%) | 46 (1.7%) |
| 20 to 24 Years | 38 (2.1%) | 38 (1.4%) |
| 25 to 29 Years | 177 (9.6%) | 101 (3.7%) |
| 30 to 34 Years | 276 (15.0%) | 122 (4.5%) |
| 35 to 39 Years | 148 (8.1%) | 352 (13.0%) |
| 40 to 44 Years | 10 (0.5%) | 45 (1.7%) |
| 45 to 49 Years | 125 (6.8%) | 232 (8.6%) |
| 50 to 54 Years | 149 (8.1%) | 146 (5.4%) |
| 55 to 59 Years | 180 (9.8%) | 184 (6.8%) |
| 60 to 64 Years | 159 (8.7%) | 215 (7.9%) |
| 65 to 69 Years | 89 (4.8%) | 145 (5.4%) |
| 70 to 74 Years | 87 (4.7%) | 230 (8.5%) |
| 75 to 79 Years | 11 (0.6%) | 104 (3.8%) |
| 80 to 84 Years | 12 (0.6%) | 30 (1.1%) |
| 85 Years and over | 22 (1.2%) | 128 (4.7%) |
| Total | 1,837 (100.0%) | 2,707 (100.0%) |
Families and Households in Seat Pleasant
Median Family Size in Seat Pleasant
The median family size in Seat Pleasant is 3.28 persons per family, with married-couple families (326 | 33.3%) accounting for the largest median family size of 4.26 persons per family. On the other hand, single female/mother families (490 | 50.0%) represent the smallest median family size with 2.78 persons per family.
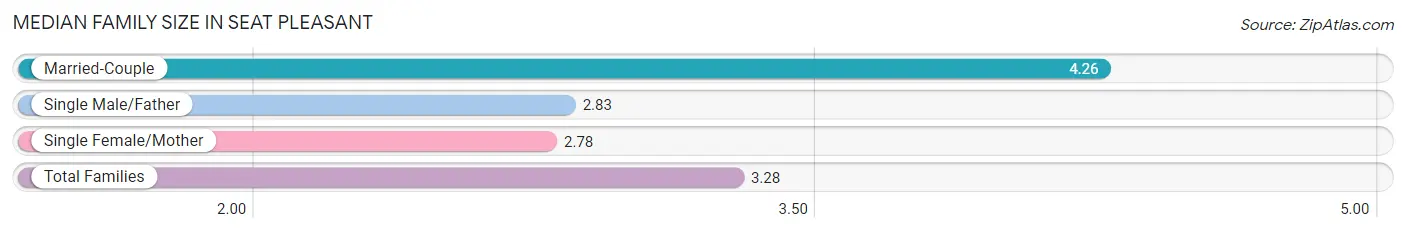
| Family Type | # Families | Family Size |
| Married-Couple | 326 (33.3%) | 4.26 |
| Single Male/Father | 164 (16.7%) | 2.83 |
| Single Female/Mother | 490 (50.0%) | 2.78 |
| Total Families | 980 (100.0%) | 3.28 |
Median Household Size in Seat Pleasant
The median household size in Seat Pleasant is 2.21 persons per household, with married-couple households (326 | 15.9%) accounting for the largest median household size of 4.26 persons per household. non-family households (1,072 | 52.2%) represent the smallest median household size with 1.19 persons per household.
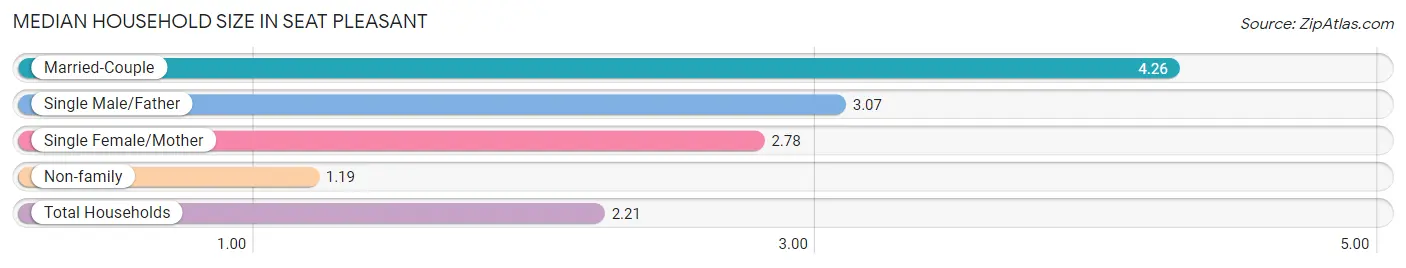
| Household Type | # Households | Household Size |
| Married-Couple | 326 (15.9%) | 4.26 |
| Single Male/Father | 164 (8.0%) | 3.07 |
| Single Female/Mother | 490 (23.9%) | 2.78 |
| Non-family | 1,072 (52.2%) | 1.19 |
| Total Households | 2,052 (100.0%) | 2.21 |
Household Size by Marriage Status in Seat Pleasant
Out of a total of 2,052 households in Seat Pleasant, 980 (47.8%) are family households, while 1,072 (52.2%) are nonfamily households. The most numerous type of family households are 2-person households, comprising 397, and the most common type of nonfamily households are 1-person households, comprising 924.
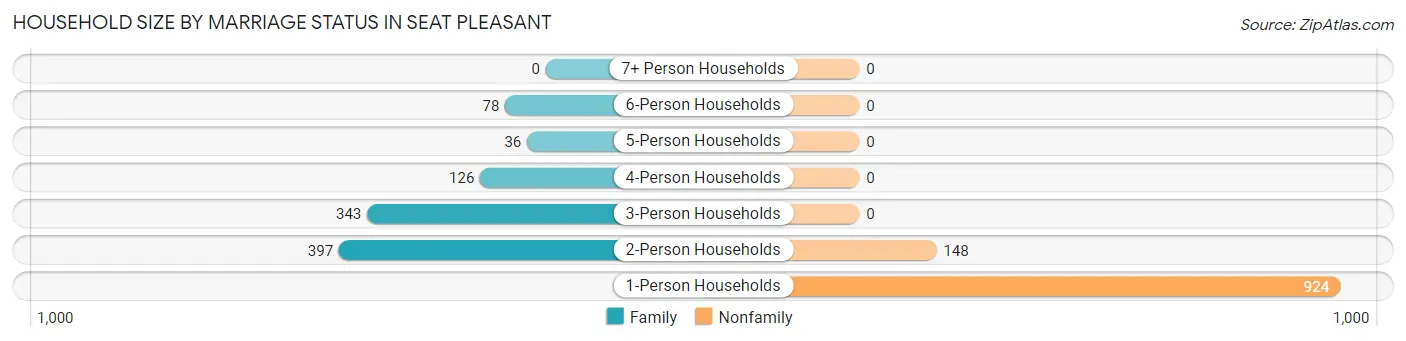
| Household Size | Family Households | Nonfamily Households |
| 1-Person Households | - | 924 (45.0%) |
| 2-Person Households | 397 (19.4%) | 148 (7.2%) |
| 3-Person Households | 343 (16.7%) | 0 (0.0%) |
| 4-Person Households | 126 (6.1%) | 0 (0.0%) |
| 5-Person Households | 36 (1.8%) | 0 (0.0%) |
| 6-Person Households | 78 (3.8%) | 0 (0.0%) |
| 7+ Person Households | 0 (0.0%) | 0 (0.0%) |
| Total | 980 (47.8%) | 1,072 (52.2%) |
Female Fertility in Seat Pleasant
Fertility by Age in Seat Pleasant
Average fertility rate in Seat Pleasant is 41.0 births per 1,000 women. Women in the age bracket of 20 to 34 years have the highest fertility rate with 146.0 births per 1,000 women. Women in the age bracket of 20 to 34 years acount for 100.0% of all women with births.
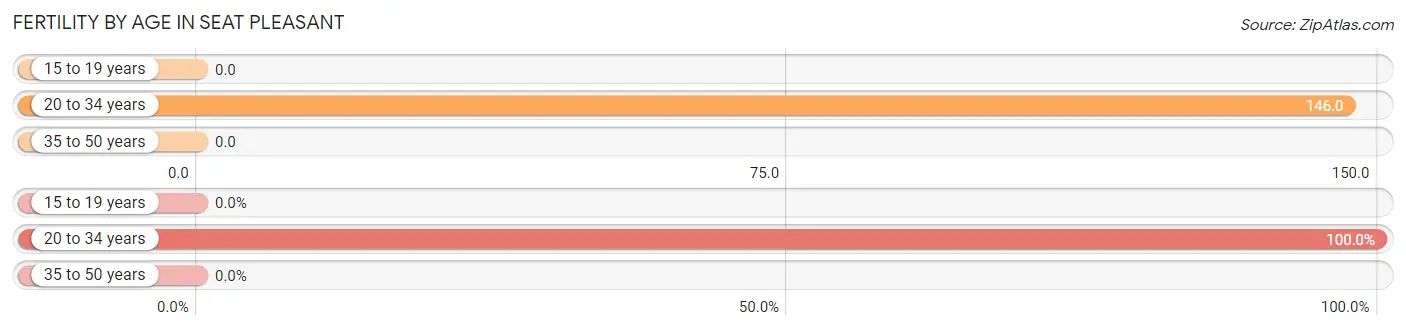
| Age Bracket | Women with Births | Births / 1,000 Women |
| 15 to 19 years | 0 (0.0%) | 0.0 |
| 20 to 34 years | 38 (100.0%) | 146.0 |
| 35 to 50 years | 0 (0.0%) | 0.0 |
| Total | 38 (100.0%) | 41.0 |
Fertility by Age by Marriage Status in Seat Pleasant
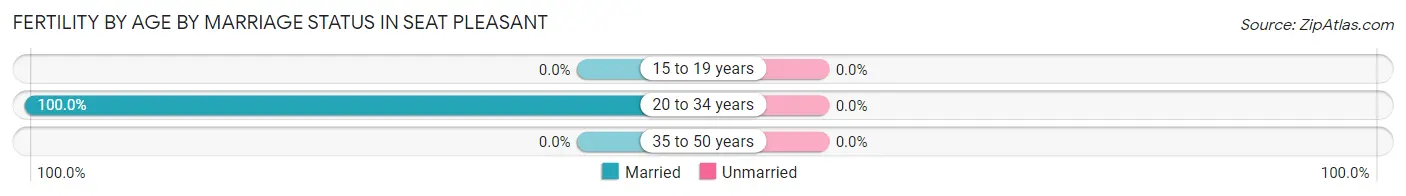
| Age Bracket | Married | Unmarried |
| 15 to 19 years | 0 (0.0%) | 0 (0.0%) |
| 20 to 34 years | 38 (100.0%) | 0 (0.0%) |
| 35 to 50 years | 0 (0.0%) | 0 (0.0%) |
| Total | 38 (100.0%) | 0 (0.0%) |
Fertility by Education in Seat Pleasant
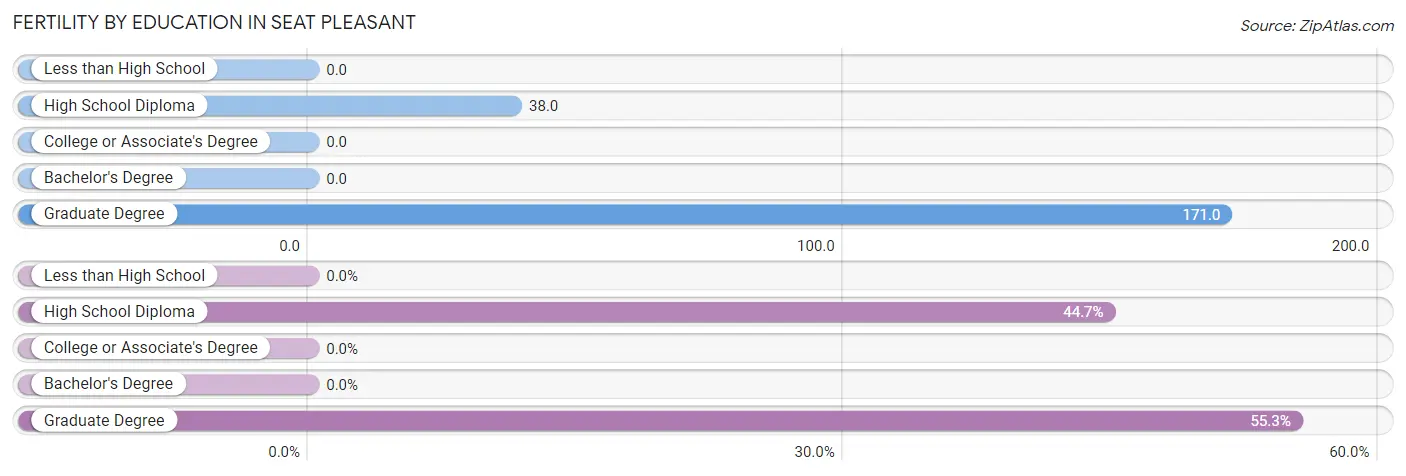
| Educational Attainment | Women with Births | Births / 1,000 Women |
| Less than High School | 0 (0.0%) | 0.0 |
| High School Diploma | 17 (44.7%) | 38.0 |
| College or Associate's Degree | 0 (0.0%) | 0.0 |
| Bachelor's Degree | 0 (0.0%) | 0.0 |
| Graduate Degree | 21 (55.3%) | 171.0 |
| Total | 38 (100.0%) | 41.0 |
Fertility by Education by Marriage Status in Seat Pleasant
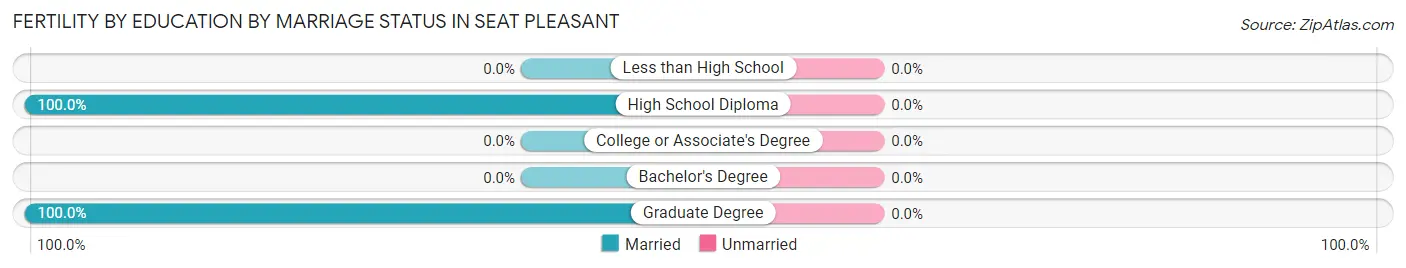
| Educational Attainment | Married | Unmarried |
| Less than High School | 0 (0.0%) | 0 (0.0%) |
| High School Diploma | 17 (100.0%) | 0 (0.0%) |
| College or Associate's Degree | 0 (0.0%) | 0 (0.0%) |
| Bachelor's Degree | 0 (0.0%) | 0 (0.0%) |
| Graduate Degree | 21 (100.0%) | 0 (0.0%) |
| Total | 38 (100.0%) | 0 (0.0%) |
Employment Characteristics in Seat Pleasant
Employment by Class of Employer in Seat Pleasant
Among the 1,967 employed individuals in Seat Pleasant, private company employees (1,203 | 61.2%), not-for-profit organizations (252 | 12.8%), and federal government employees (236 | 12.0%) make up the most common classes of employment.
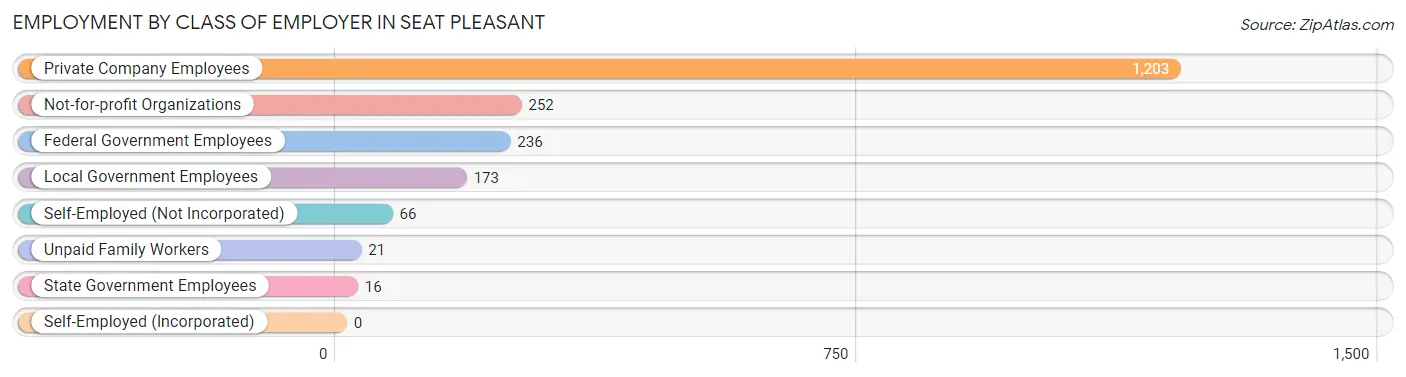
| Employer Class | # Employees | % Employees |
| Private Company Employees | 1,203 | 61.2% |
| Self-Employed (Incorporated) | 0 | 0.0% |
| Self-Employed (Not Incorporated) | 66 | 3.4% |
| Not-for-profit Organizations | 252 | 12.8% |
| Local Government Employees | 173 | 8.8% |
| State Government Employees | 16 | 0.8% |
| Federal Government Employees | 236 | 12.0% |
| Unpaid Family Workers | 21 | 1.1% |
| Total | 1,967 | 100.0% |
Employment Status by Age in Seat Pleasant
According to the labor force statistics for Seat Pleasant, out of the total population over 16 years of age (3,621), 67.0% or 2,426 individuals are in the labor force, with 18.9% or 459 of them unemployed. The age group with the highest labor force participation rate is 25 to 29 years, with 100.0% or 278 individuals in the labor force. Within the labor force, the 16 to 19 years age range has the highest percentage of unemployed individuals, with 64.2% or 34 of them being unemployed.
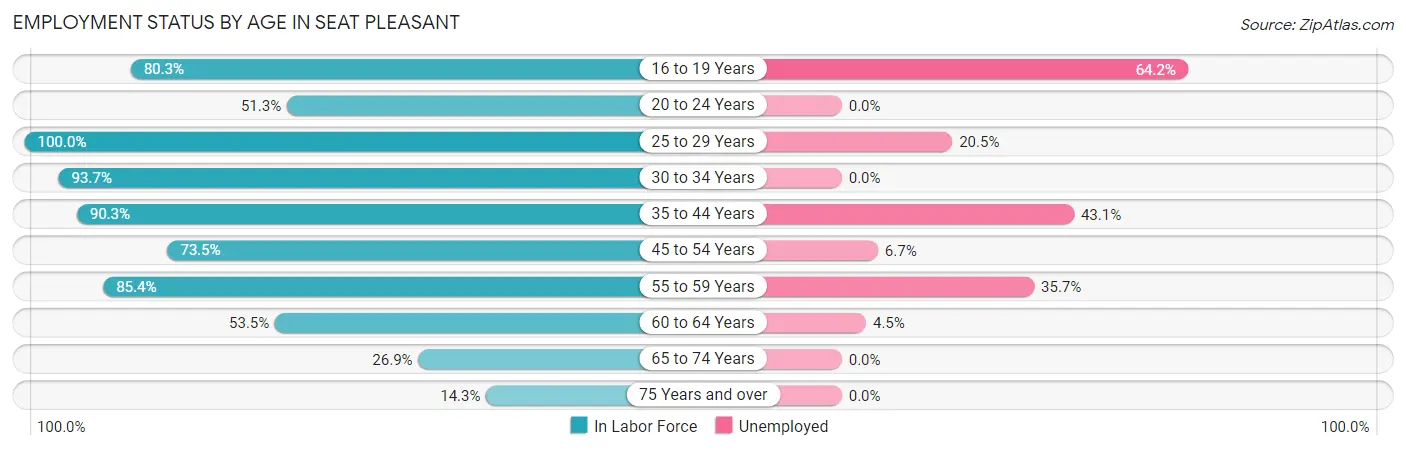
| Age Bracket | In Labor Force | Unemployed |
| 16 to 19 Years | 53 (80.3%) | 34 (64.2%) |
| 20 to 24 Years | 39 (51.3%) | 0 (0.0%) |
| 25 to 29 Years | 278 (100.0%) | 57 (20.5%) |
| 30 to 34 Years | 373 (93.7%) | 0 (0.0%) |
| 35 to 44 Years | 501 (90.3%) | 216 (43.1%) |
| 45 to 54 Years | 479 (73.5%) | 32 (6.7%) |
| 55 to 59 Years | 311 (85.4%) | 111 (35.7%) |
| 60 to 64 Years | 200 (53.5%) | 9 (4.5%) |
| 65 to 74 Years | 148 (26.9%) | 0 (0.0%) |
| 75 Years and over | 44 (14.3%) | 0 (0.0%) |
| Total | 2,426 (67.0%) | 459 (18.9%) |
Employment Status by Educational Attainment in Seat Pleasant
According to labor force statistics for Seat Pleasant, 81.7% of individuals (2,141) out of the total population between 25 and 64 years of age (2,621) are in the labor force, with 19.8% or 424 of them being unemployed. The group with the highest labor force participation rate are those with the educational attainment of bachelor's degree or higher, with 84.6% or 461 individuals in the labor force. Within the labor force, individuals with high school diploma education have the highest percentage of unemployment, with 31.4% or 261 of them being unemployed.
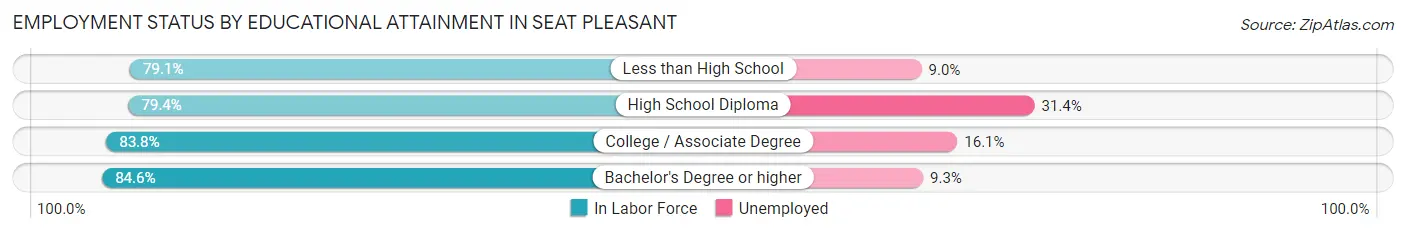
| Educational Attainment | In Labor Force | Unemployed |
| Less than High School | 223 (79.1%) | 25 (9.0%) |
| High School Diploma | 830 (79.4%) | 328 (31.4%) |
| College / Associate Degree | 628 (83.8%) | 121 (16.1%) |
| Bachelor's Degree or higher | 461 (84.6%) | 51 (9.3%) |
| Total | 2,141 (81.7%) | 519 (19.8%) |
Employment Occupations by Sex in Seat Pleasant
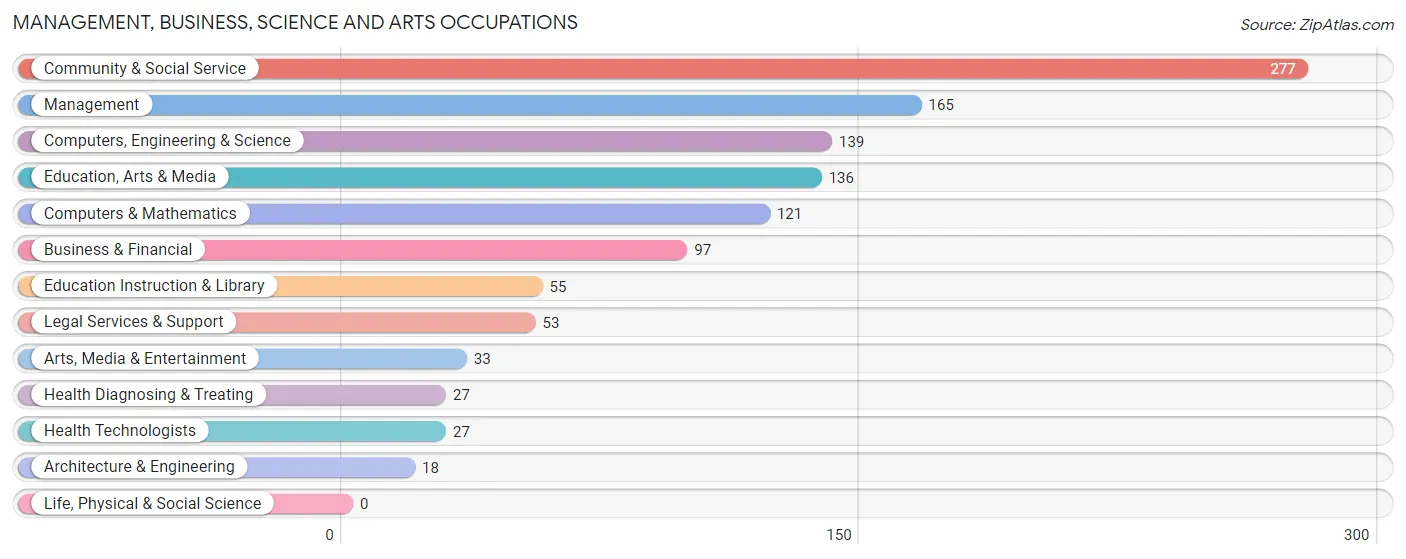
Management, Business, Science and Arts Occupations
The most common Management, Business, Science and Arts occupations in Seat Pleasant are Community & Social Service (277 | 14.1%), Management (165 | 8.4%), Computers, Engineering & Science (139 | 7.1%), Education, Arts & Media (136 | 6.9%), and Computers & Mathematics (121 | 6.2%).
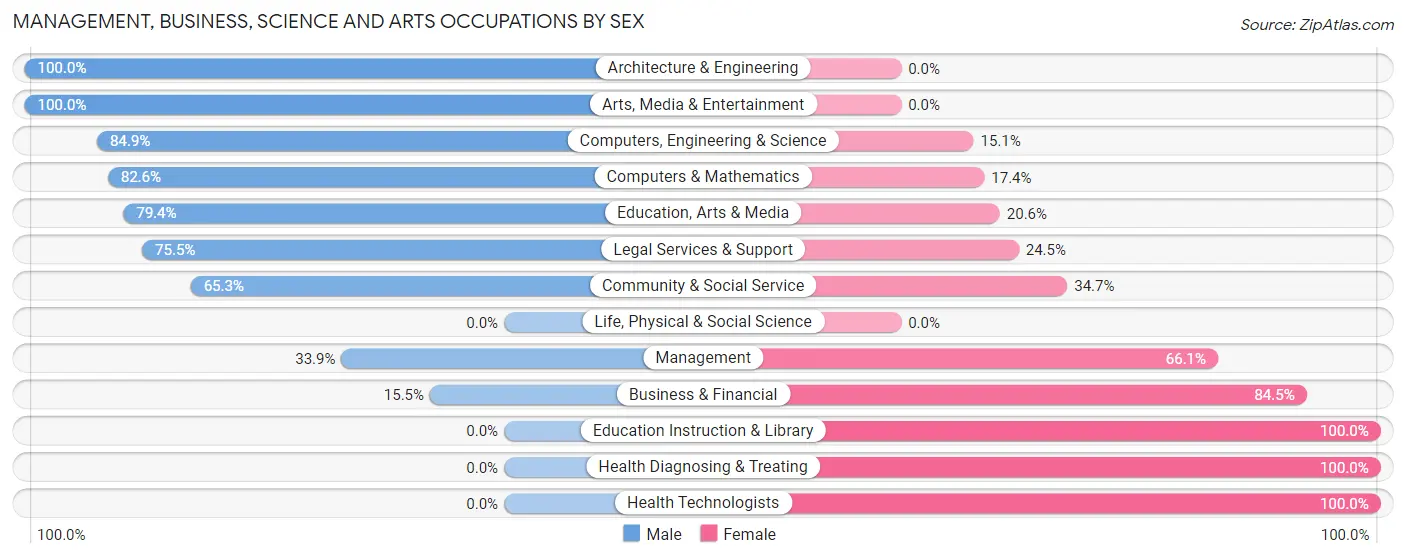
Management, Business, Science and Arts Occupations by Sex
Within the Management, Business, Science and Arts occupations in Seat Pleasant, the most male-oriented occupations are Architecture & Engineering (100.0%), Arts, Media & Entertainment (100.0%), and Computers, Engineering & Science (84.9%), while the most female-oriented occupations are Education Instruction & Library (100.0%), Health Diagnosing & Treating (100.0%), and Health Technologists (100.0%).
| Occupation | Male | Female |
| Management | 56 (33.9%) | 109 (66.1%) |
| Business & Financial | 15 (15.5%) | 82 (84.5%) |
| Computers, Engineering & Science | 118 (84.9%) | 21 (15.1%) |
| Computers & Mathematics | 100 (82.6%) | 21 (17.4%) |
| Architecture & Engineering | 18 (100.0%) | 0 (0.0%) |
| Life, Physical & Social Science | 0 (0.0%) | 0 (0.0%) |
| Community & Social Service | 181 (65.3%) | 96 (34.7%) |
| Education, Arts & Media | 108 (79.4%) | 28 (20.6%) |
| Legal Services & Support | 40 (75.5%) | 13 (24.5%) |
| Education Instruction & Library | 0 (0.0%) | 55 (100.0%) |
| Arts, Media & Entertainment | 33 (100.0%) | 0 (0.0%) |
| Health Diagnosing & Treating | 0 (0.0%) | 27 (100.0%) |
| Health Technologists | 0 (0.0%) | 27 (100.0%) |
| Total (Category) | 370 (52.5%) | 335 (47.5%) |
| Total (Overall) | 1,023 (52.1%) | 941 (47.9%) |
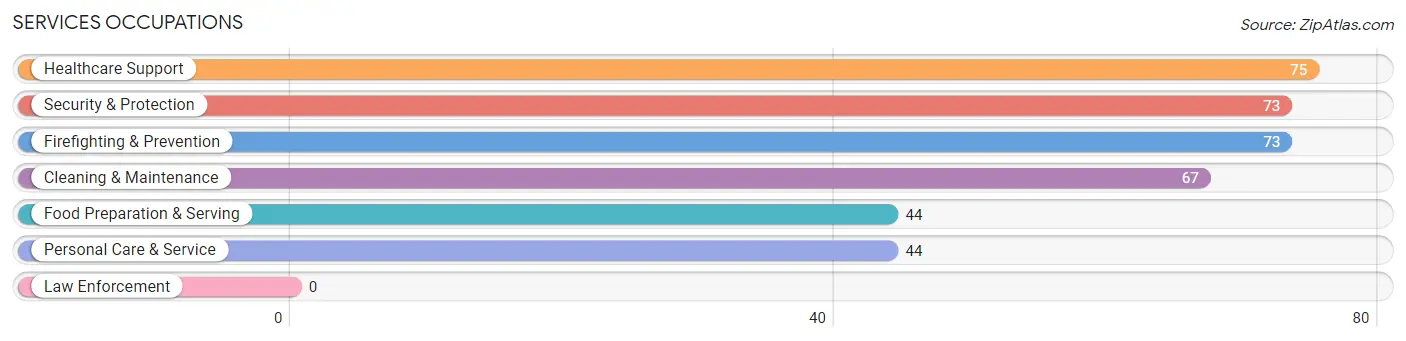
Services Occupations
The most common Services occupations in Seat Pleasant are Healthcare Support (75 | 3.8%), Security & Protection (73 | 3.7%), Firefighting & Prevention (73 | 3.7%), Cleaning & Maintenance (67 | 3.4%), and Food Preparation & Serving (44 | 2.2%).
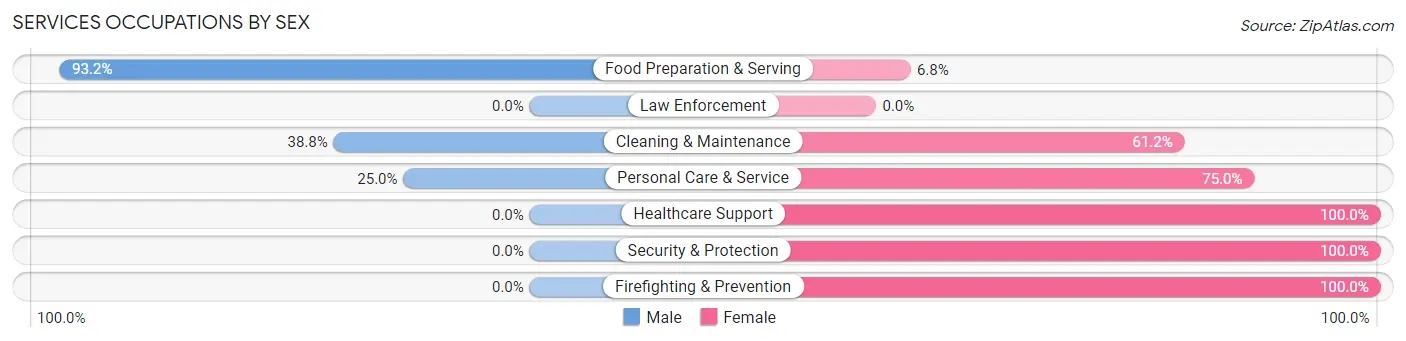
Services Occupations by Sex
Within the Services occupations in Seat Pleasant, the most male-oriented occupations are Food Preparation & Serving (93.2%), Cleaning & Maintenance (38.8%), and Personal Care & Service (25.0%), while the most female-oriented occupations are Healthcare Support (100.0%), Security & Protection (100.0%), and Firefighting & Prevention (100.0%).
| Occupation | Male | Female |
| Healthcare Support | 0 (0.0%) | 75 (100.0%) |
| Security & Protection | 0 (0.0%) | 73 (100.0%) |
| Firefighting & Prevention | 0 (0.0%) | 73 (100.0%) |
| Law Enforcement | 0 (0.0%) | 0 (0.0%) |
| Food Preparation & Serving | 41 (93.2%) | 3 (6.8%) |
| Cleaning & Maintenance | 26 (38.8%) | 41 (61.2%) |
| Personal Care & Service | 11 (25.0%) | 33 (75.0%) |
| Total (Category) | 78 (25.7%) | 225 (74.3%) |
| Total (Overall) | 1,023 (52.1%) | 941 (47.9%) |
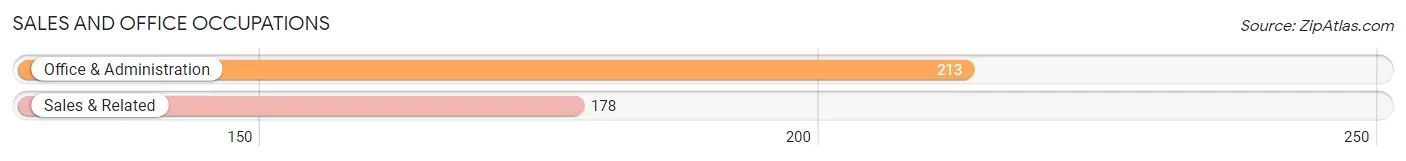
Sales and Office Occupations
The most common Sales and Office occupations in Seat Pleasant are Office & Administration (213 | 10.8%), and Sales & Related (178 | 9.1%).
Sales and Office Occupations by Sex
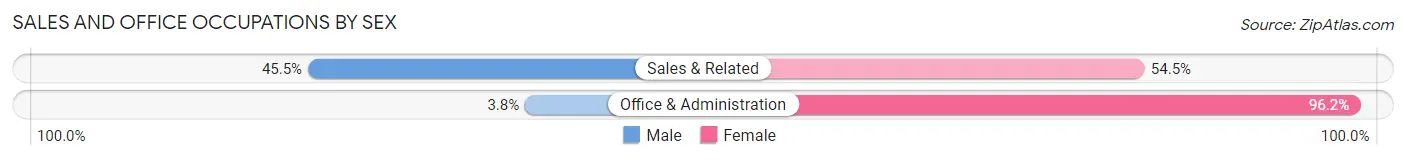
| Occupation | Male | Female |
| Sales & Related | 81 (45.5%) | 97 (54.5%) |
| Office & Administration | 8 (3.8%) | 205 (96.2%) |
| Total (Category) | 89 (22.8%) | 302 (77.2%) |
| Total (Overall) | 1,023 (52.1%) | 941 (47.9%) |
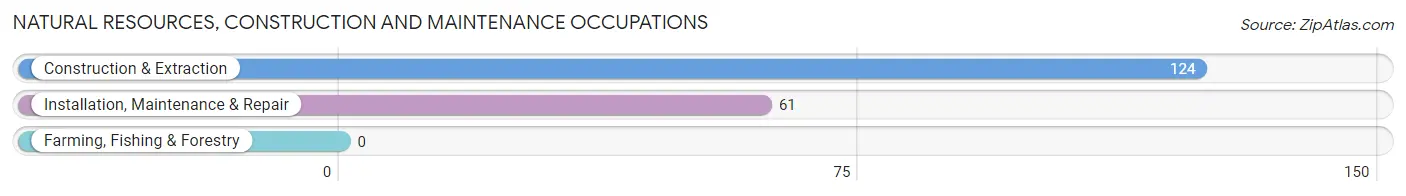
Natural Resources, Construction and Maintenance Occupations
The most common Natural Resources, Construction and Maintenance occupations in Seat Pleasant are Construction & Extraction (124 | 6.3%), and Installation, Maintenance & Repair (61 | 3.1%).
Natural Resources, Construction and Maintenance Occupations by Sex
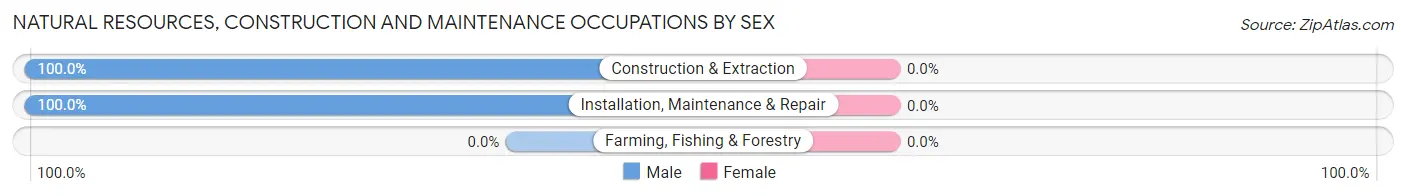
| Occupation | Male | Female |
| Farming, Fishing & Forestry | 0 (0.0%) | 0 (0.0%) |
| Construction & Extraction | 124 (100.0%) | 0 (0.0%) |
| Installation, Maintenance & Repair | 61 (100.0%) | 0 (0.0%) |
| Total (Category) | 185 (100.0%) | 0 (0.0%) |
| Total (Overall) | 1,023 (52.1%) | 941 (47.9%) |
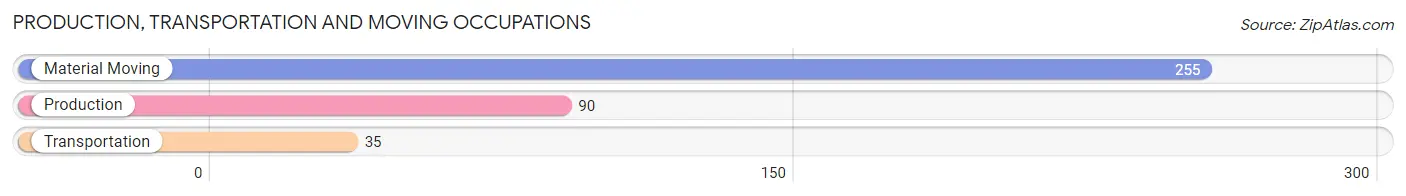
Production, Transportation and Moving Occupations
The most common Production, Transportation and Moving occupations in Seat Pleasant are Material Moving (255 | 13.0%), Production (90 | 4.6%), and Transportation (35 | 1.8%).
Production, Transportation and Moving Occupations by Sex
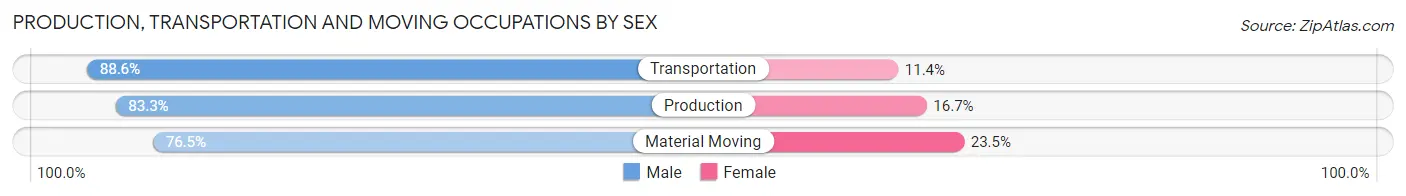
| Occupation | Male | Female |
| Production | 75 (83.3%) | 15 (16.7%) |
| Transportation | 31 (88.6%) | 4 (11.4%) |
| Material Moving | 195 (76.5%) | 60 (23.5%) |
| Total (Category) | 301 (79.2%) | 79 (20.8%) |
| Total (Overall) | 1,023 (52.1%) | 941 (47.9%) |
Employment Industries by Sex in Seat Pleasant
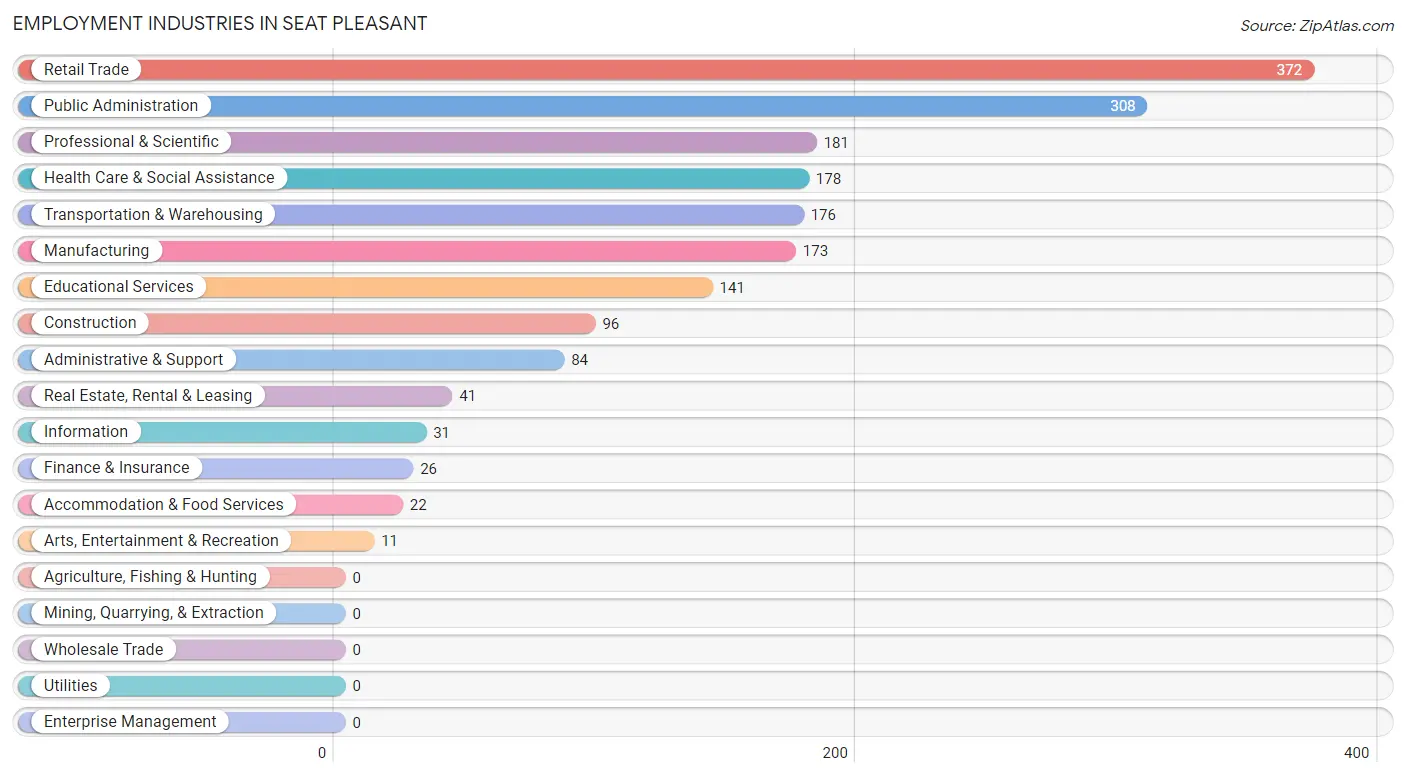
Employment Industries in Seat Pleasant
The major employment industries in Seat Pleasant include Retail Trade (372 | 18.9%), Public Administration (308 | 15.7%), Professional & Scientific (181 | 9.2%), Health Care & Social Assistance (178 | 9.1%), and Transportation & Warehousing (176 | 9.0%).
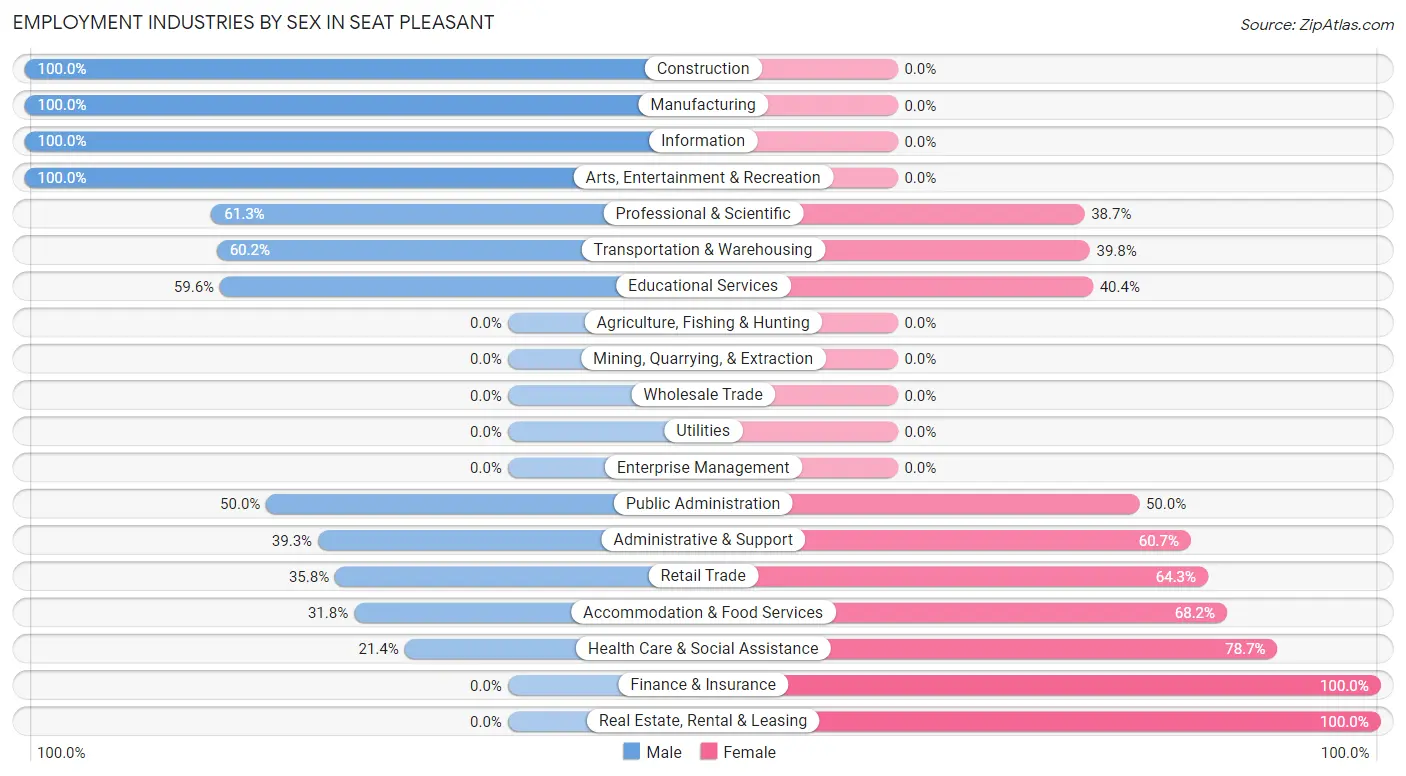
Employment Industries by Sex in Seat Pleasant
The Seat Pleasant industries that see more men than women are Construction (100.0%), Manufacturing (100.0%), and Information (100.0%), whereas the industries that tend to have a higher number of women are Finance & Insurance (100.0%), Real Estate, Rental & Leasing (100.0%), and Health Care & Social Assistance (78.6%).
| Industry | Male | Female |
| Agriculture, Fishing & Hunting | 0 (0.0%) | 0 (0.0%) |
| Mining, Quarrying, & Extraction | 0 (0.0%) | 0 (0.0%) |
| Construction | 96 (100.0%) | 0 (0.0%) |
| Manufacturing | 173 (100.0%) | 0 (0.0%) |
| Wholesale Trade | 0 (0.0%) | 0 (0.0%) |
| Retail Trade | 133 (35.7%) | 239 (64.2%) |
| Transportation & Warehousing | 106 (60.2%) | 70 (39.8%) |
| Utilities | 0 (0.0%) | 0 (0.0%) |
| Information | 31 (100.0%) | 0 (0.0%) |
| Finance & Insurance | 0 (0.0%) | 26 (100.0%) |
| Real Estate, Rental & Leasing | 0 (0.0%) | 41 (100.0%) |
| Professional & Scientific | 111 (61.3%) | 70 (38.7%) |
| Enterprise Management | 0 (0.0%) | 0 (0.0%) |
| Administrative & Support | 33 (39.3%) | 51 (60.7%) |
| Educational Services | 84 (59.6%) | 57 (40.4%) |
| Health Care & Social Assistance | 38 (21.3%) | 140 (78.6%) |
| Arts, Entertainment & Recreation | 11 (100.0%) | 0 (0.0%) |
| Accommodation & Food Services | 7 (31.8%) | 15 (68.2%) |
| Public Administration | 154 (50.0%) | 154 (50.0%) |
| Total | 1,023 (52.1%) | 941 (47.9%) |
Education in Seat Pleasant
School Enrollment in Seat Pleasant
The most common levels of schooling among the 736 students in Seat Pleasant are high school (218 | 29.6%), middle school (170 | 23.1%), and kindergarten (159 | 21.6%).
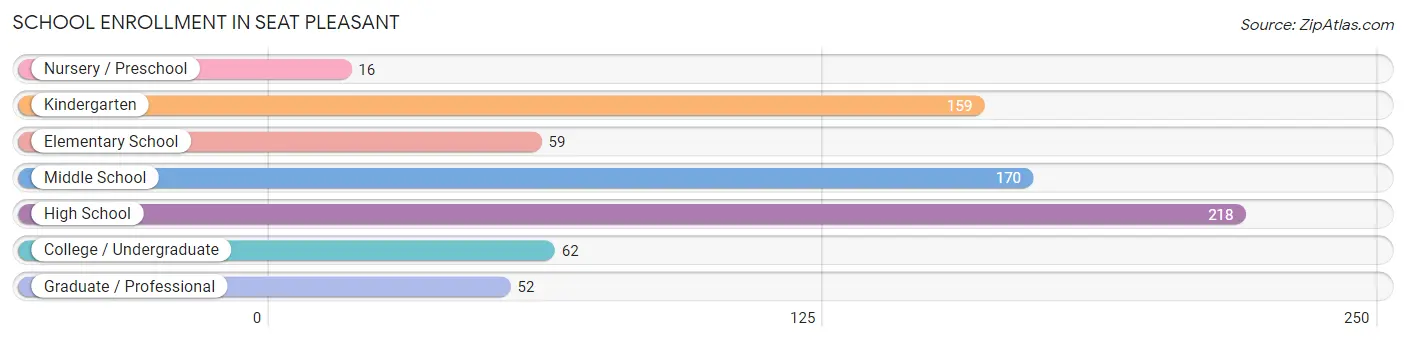
| School Level | # Students | % Students |
| Nursery / Preschool | 16 | 2.2% |
| Kindergarten | 159 | 21.6% |
| Elementary School | 59 | 8.0% |
| Middle School | 170 | 23.1% |
| High School | 218 | 29.6% |
| College / Undergraduate | 62 | 8.4% |
| Graduate / Professional | 52 | 7.1% |
| Total | 736 | 100.0% |
School Enrollment by Age by Funding Source in Seat Pleasant
Out of a total of 736 students who are enrolled in schools in Seat Pleasant, 93 (12.6%) attend a private institution, while the remaining 643 (87.4%) are enrolled in public schools. The age group of 20 to 24 year olds has the highest likelihood of being enrolled in private schools, with 20 (100.0% in the age bracket) enrolled. Conversely, the age group of 18 to 19 year olds has the lowest likelihood of being enrolled in a private school, with 19 (100.0% in the age bracket) attending a public institution.
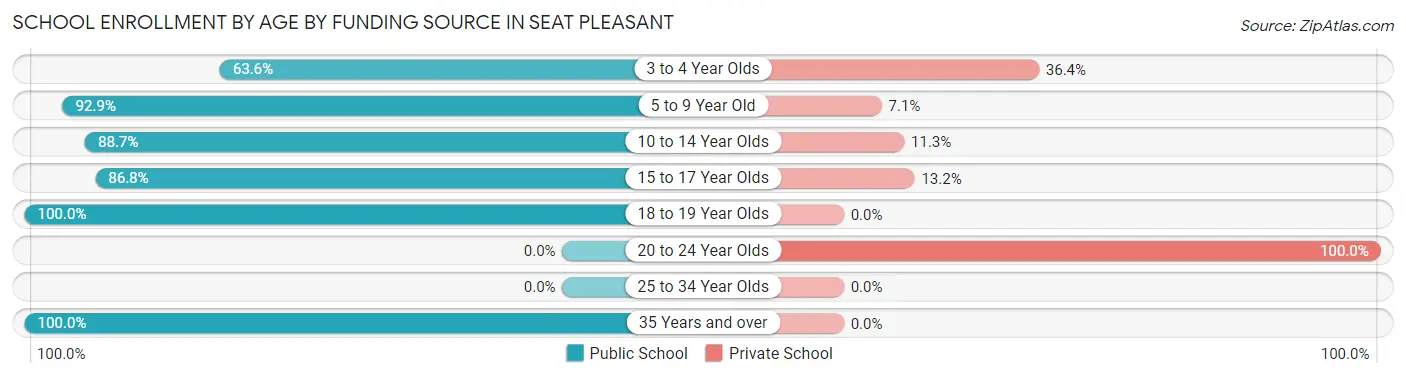
| Age Bracket | Public School | Private School |
| 3 to 4 Year Olds | 28 (63.6%) | 16 (36.4%) |
| 5 to 9 Year Old | 158 (92.9%) | 12 (7.1%) |
| 10 to 14 Year Olds | 205 (88.7%) | 26 (11.3%) |
| 15 to 17 Year Olds | 125 (86.8%) | 19 (13.2%) |
| 18 to 19 Year Olds | 19 (100.0%) | 0 (0.0%) |
| 20 to 24 Year Olds | 0 (0.0%) | 20 (100.0%) |
| 25 to 34 Year Olds | 0 (0.0%) | 0 (0.0%) |
| 35 Years and over | 108 (100.0%) | 0 (0.0%) |
| Total | 643 (87.4%) | 93 (12.6%) |
Educational Attainment by Field of Study in Seat Pleasant
Business (169 | 23.6%), social sciences (122 | 17.1%), arts & humanities (116 | 16.2%), education (89 | 12.4%), and bio, nature & agricultural (57 | 8.0%) are the most common fields of study among 715 individuals in Seat Pleasant who have obtained a bachelor's degree or higher.
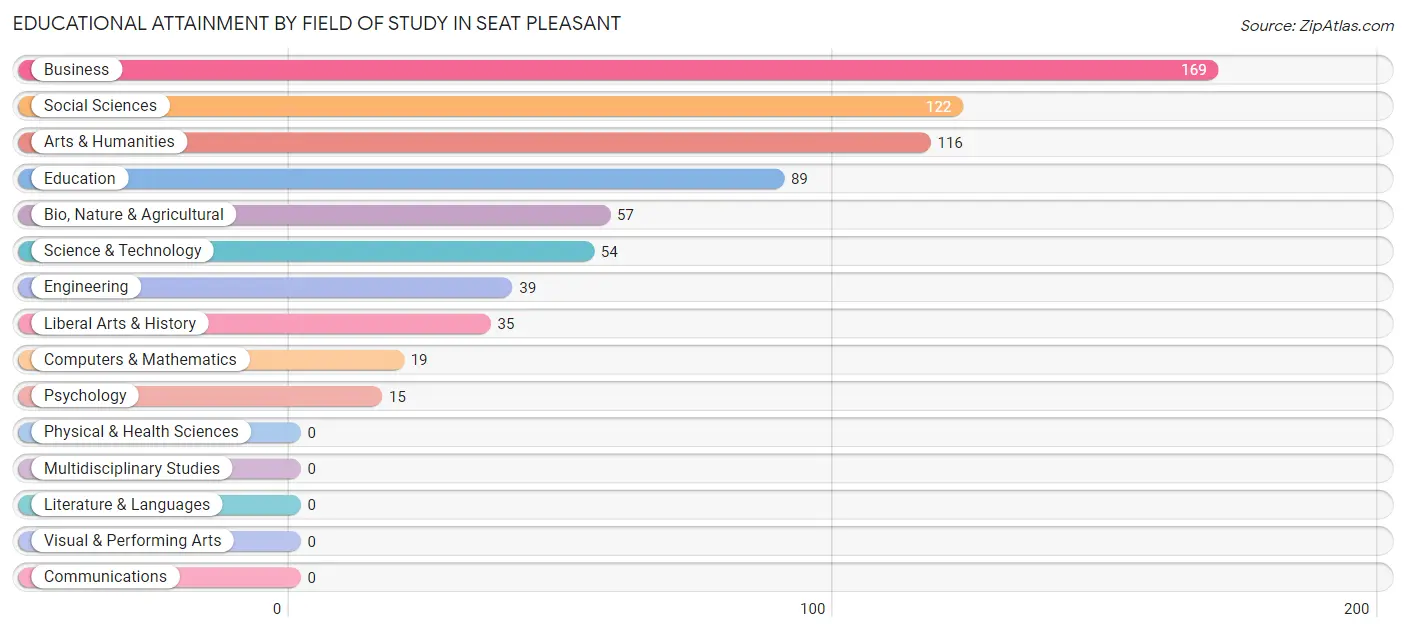
| Field of Study | # Graduates | % Graduates |
| Computers & Mathematics | 19 | 2.7% |
| Bio, Nature & Agricultural | 57 | 8.0% |
| Physical & Health Sciences | 0 | 0.0% |
| Psychology | 15 | 2.1% |
| Social Sciences | 122 | 17.1% |
| Engineering | 39 | 5.4% |
| Multidisciplinary Studies | 0 | 0.0% |
| Science & Technology | 54 | 7.5% |
| Business | 169 | 23.6% |
| Education | 89 | 12.4% |
| Literature & Languages | 0 | 0.0% |
| Liberal Arts & History | 35 | 4.9% |
| Visual & Performing Arts | 0 | 0.0% |
| Communications | 0 | 0.0% |
| Arts & Humanities | 116 | 16.2% |
| Total | 715 | 100.0% |
Transportation & Commute in Seat Pleasant
Vehicle Availability by Sex in Seat Pleasant
The most prevalent vehicle ownership categories in Seat Pleasant are males with 1 vehicle (308, accounting for 30.0%) and females with 1 vehicle (376, making up 32.9%).
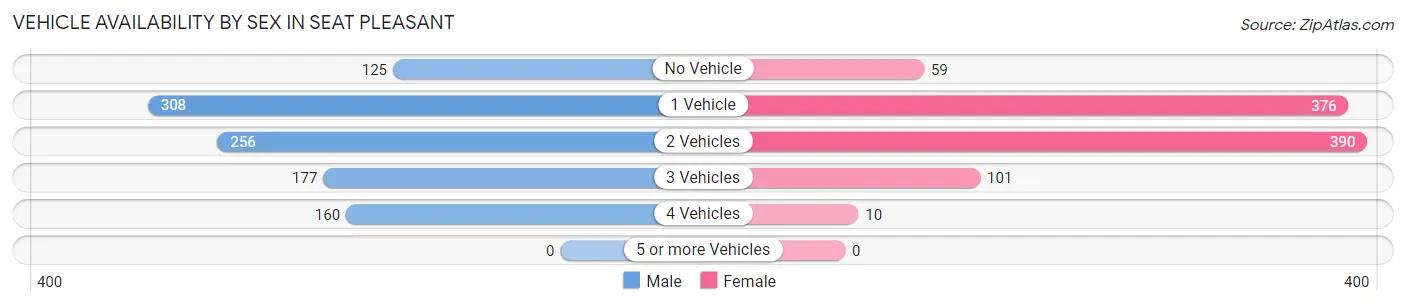
| Vehicles Available | Male | Female |
| No Vehicle | 125 (12.2%) | 59 (6.3%) |
| 1 Vehicle | 308 (30.0%) | 376 (40.2%) |
| 2 Vehicles | 256 (24.9%) | 390 (41.7%) |
| 3 Vehicles | 177 (17.2%) | 101 (10.8%) |
| 4 Vehicles | 160 (15.6%) | 10 (1.1%) |
| 5 or more Vehicles | 0 (0.0%) | 0 (0.0%) |
| Total | 1,026 (100.0%) | 936 (100.0%) |
Commute Time in Seat Pleasant
The most frequently occuring commute durations in Seat Pleasant are 30 to 34 minutes (415 commuters, 23.8%), 60 to 89 minutes (266 commuters, 15.2%), and 20 to 24 minutes (262 commuters, 15.0%).
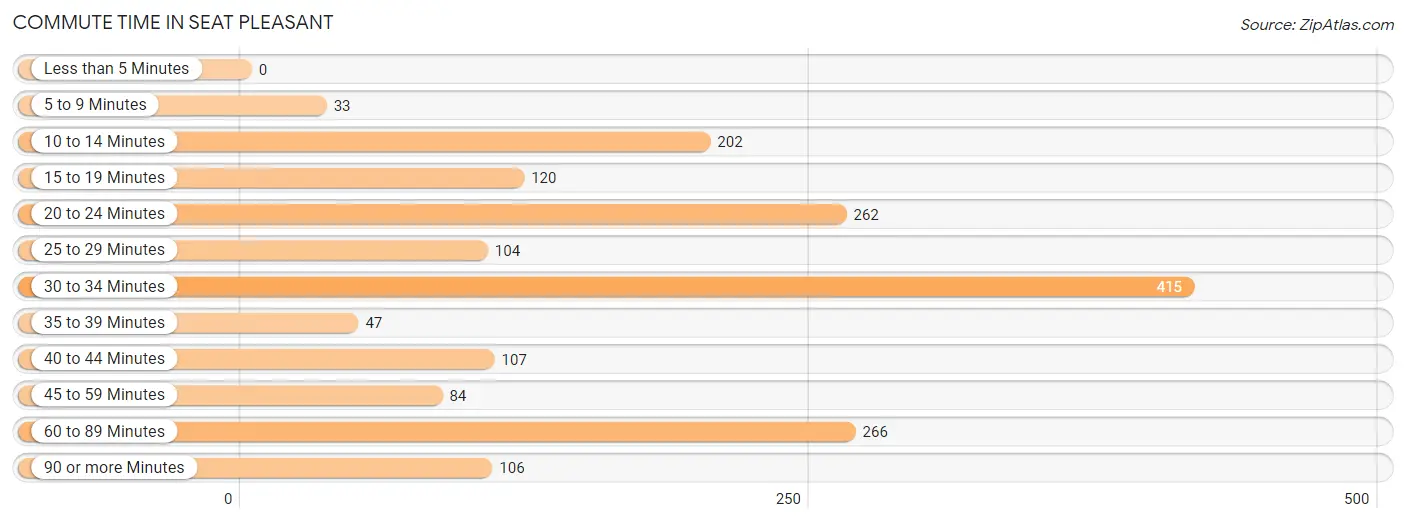
| Commute Time | # Commuters | % Commuters |
| Less than 5 Minutes | 0 | 0.0% |
| 5 to 9 Minutes | 33 | 1.9% |
| 10 to 14 Minutes | 202 | 11.6% |
| 15 to 19 Minutes | 120 | 6.9% |
| 20 to 24 Minutes | 262 | 15.0% |
| 25 to 29 Minutes | 104 | 6.0% |
| 30 to 34 Minutes | 415 | 23.8% |
| 35 to 39 Minutes | 47 | 2.7% |
| 40 to 44 Minutes | 107 | 6.1% |
| 45 to 59 Minutes | 84 | 4.8% |
| 60 to 89 Minutes | 266 | 15.2% |
| 90 or more Minutes | 106 | 6.1% |
Commute Time by Sex in Seat Pleasant
The most common commute times in Seat Pleasant are 30 to 34 minutes (341 commuters, 34.7%) for males and 10 to 14 minutes (187 commuters, 24.5%) for females.
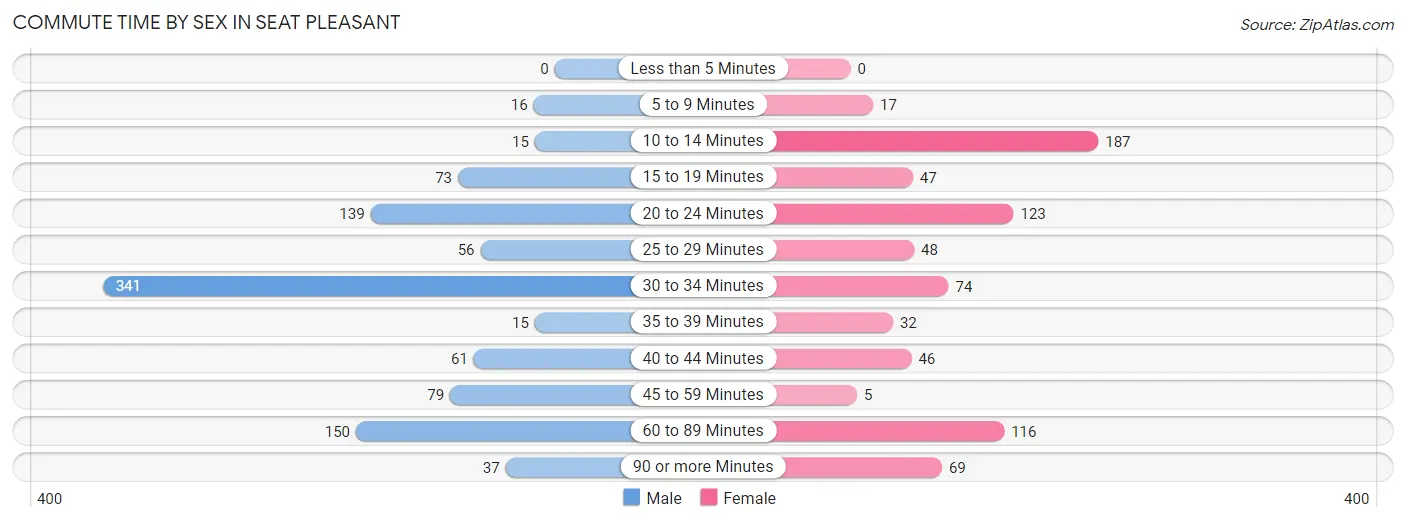
| Commute Time | Male | Female |
| Less than 5 Minutes | 0 (0.0%) | 0 (0.0%) |
| 5 to 9 Minutes | 16 (1.6%) | 17 (2.2%) |
| 10 to 14 Minutes | 15 (1.5%) | 187 (24.5%) |
| 15 to 19 Minutes | 73 (7.4%) | 47 (6.1%) |
| 20 to 24 Minutes | 139 (14.1%) | 123 (16.1%) |
| 25 to 29 Minutes | 56 (5.7%) | 48 (6.3%) |
| 30 to 34 Minutes | 341 (34.7%) | 74 (9.7%) |
| 35 to 39 Minutes | 15 (1.5%) | 32 (4.2%) |
| 40 to 44 Minutes | 61 (6.2%) | 46 (6.0%) |
| 45 to 59 Minutes | 79 (8.0%) | 5 (0.6%) |
| 60 to 89 Minutes | 150 (15.3%) | 116 (15.2%) |
| 90 or more Minutes | 37 (3.8%) | 69 (9.0%) |
Time of Departure to Work by Sex in Seat Pleasant
The most frequent times of departure to work in Seat Pleasant are 7:00 AM to 7:29 AM (154, 15.7%) for males and 7:00 AM to 7:29 AM (214, 28.0%) for females.
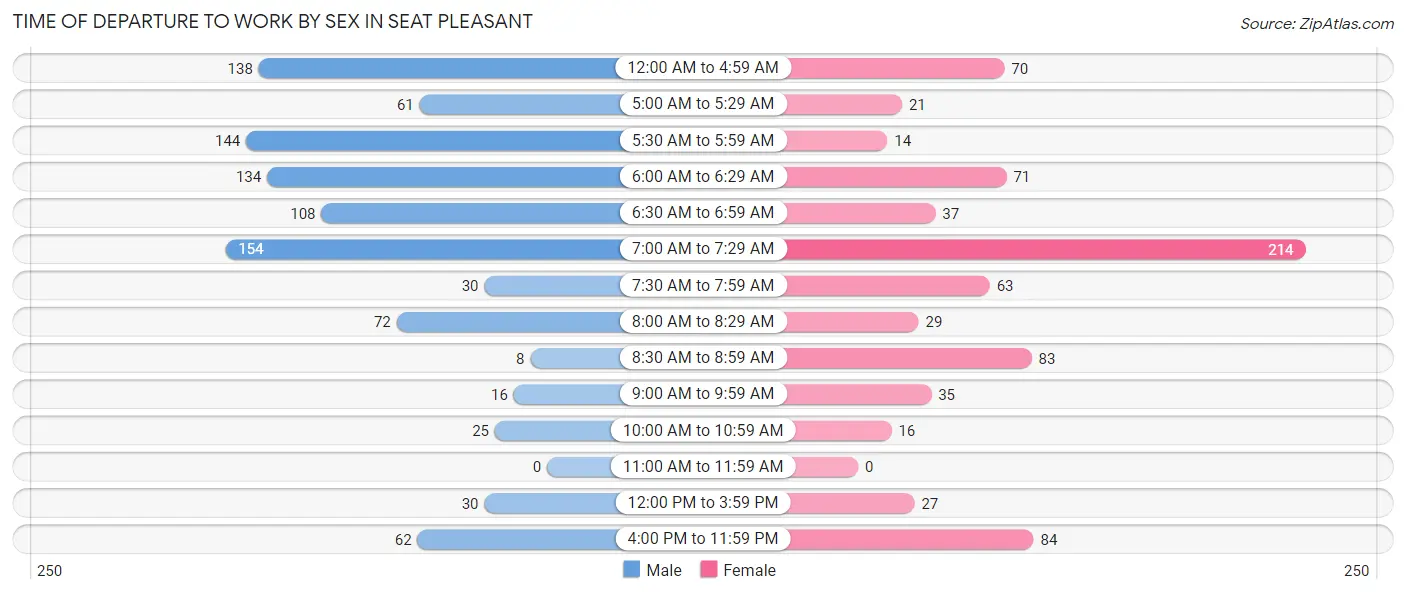
| Time of Departure | Male | Female |
| 12:00 AM to 4:59 AM | 138 (14.1%) | 70 (9.2%) |
| 5:00 AM to 5:29 AM | 61 (6.2%) | 21 (2.8%) |
| 5:30 AM to 5:59 AM | 144 (14.7%) | 14 (1.8%) |
| 6:00 AM to 6:29 AM | 134 (13.7%) | 71 (9.3%) |
| 6:30 AM to 6:59 AM | 108 (11.0%) | 37 (4.8%) |
| 7:00 AM to 7:29 AM | 154 (15.7%) | 214 (28.0%) |
| 7:30 AM to 7:59 AM | 30 (3.0%) | 63 (8.3%) |
| 8:00 AM to 8:29 AM | 72 (7.3%) | 29 (3.8%) |
| 8:30 AM to 8:59 AM | 8 (0.8%) | 83 (10.9%) |
| 9:00 AM to 9:59 AM | 16 (1.6%) | 35 (4.6%) |
| 10:00 AM to 10:59 AM | 25 (2.5%) | 16 (2.1%) |
| 11:00 AM to 11:59 AM | 0 (0.0%) | 0 (0.0%) |
| 12:00 PM to 3:59 PM | 30 (3.0%) | 27 (3.5%) |
| 4:00 PM to 11:59 PM | 62 (6.3%) | 84 (11.0%) |
| Total | 982 (100.0%) | 764 (100.0%) |
Housing Occupancy in Seat Pleasant
Occupancy by Ownership in Seat Pleasant
Of the total 2,052 dwellings in Seat Pleasant, owner-occupied units account for 1,192 (58.1%), while renter-occupied units make up 860 (41.9%).
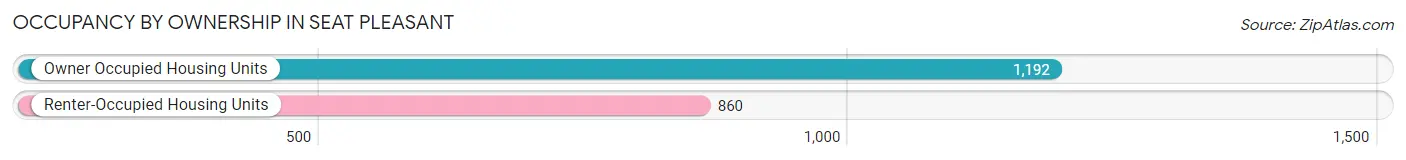
| Occupancy | # Housing Units | % Housing Units |
| Owner Occupied Housing Units | 1,192 | 58.1% |
| Renter-Occupied Housing Units | 860 | 41.9% |
| Total Occupied Housing Units | 2,052 | 100.0% |
Occupancy by Household Size in Seat Pleasant
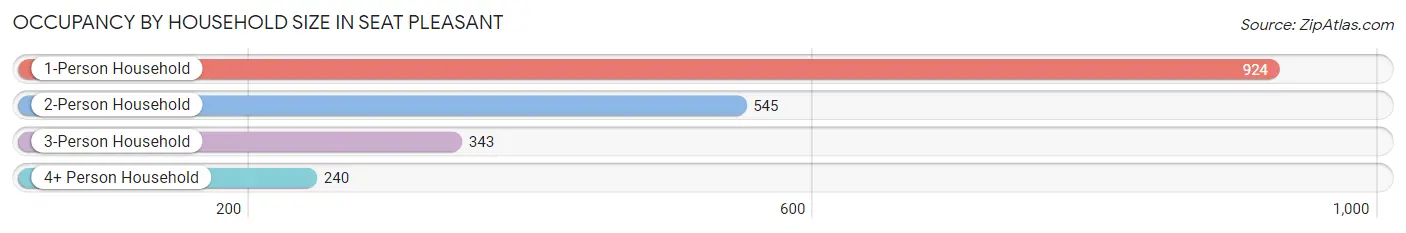
| Household Size | # Housing Units | % Housing Units |
| 1-Person Household | 924 | 45.0% |
| 2-Person Household | 545 | 26.6% |
| 3-Person Household | 343 | 16.7% |
| 4+ Person Household | 240 | 11.7% |
| Total Housing Units | 2,052 | 100.0% |
Occupancy by Ownership by Household Size in Seat Pleasant
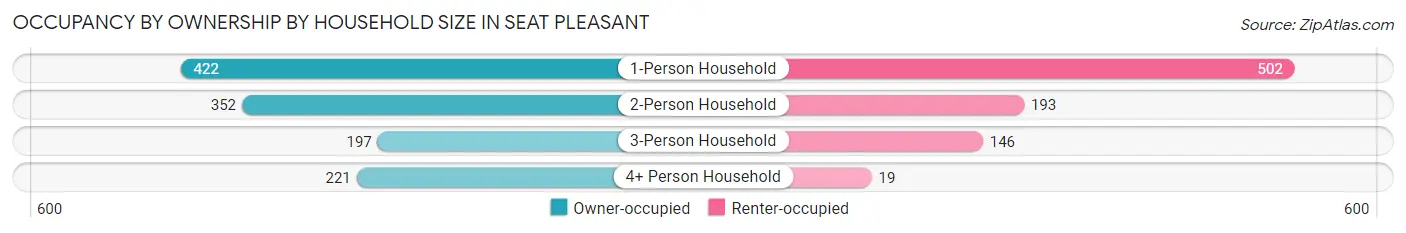
| Household Size | Owner-occupied | Renter-occupied |
| 1-Person Household | 422 (45.7%) | 502 (54.3%) |
| 2-Person Household | 352 (64.6%) | 193 (35.4%) |
| 3-Person Household | 197 (57.4%) | 146 (42.6%) |
| 4+ Person Household | 221 (92.1%) | 19 (7.9%) |
| Total Housing Units | 1,192 (58.1%) | 860 (41.9%) |
Occupancy by Educational Attainment in Seat Pleasant
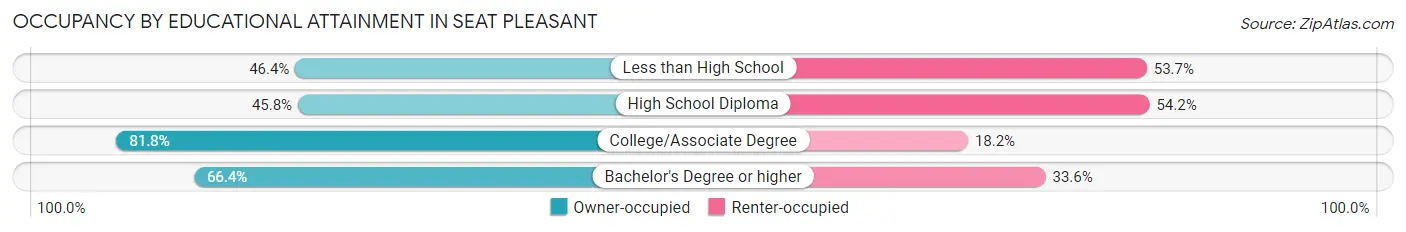
| Household Size | Owner-occupied | Renter-occupied |
| Less than High School | 146 (46.4%) | 169 (53.6%) |
| High School Diploma | 399 (45.8%) | 472 (54.2%) |
| College/Associate Degree | 382 (81.8%) | 85 (18.2%) |
| Bachelor's Degree or higher | 265 (66.4%) | 134 (33.6%) |
Occupancy by Age of Householder in Seat Pleasant
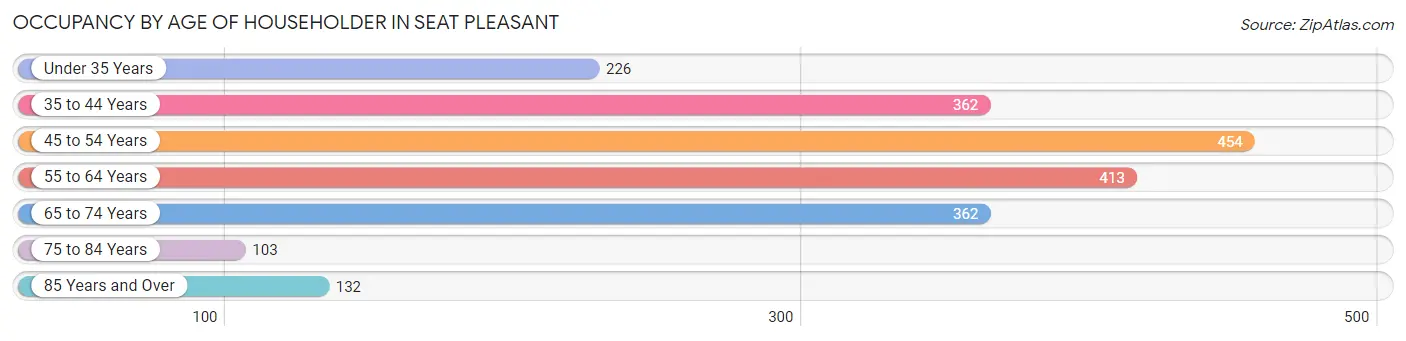
| Age Bracket | # Households | % Households |
| Under 35 Years | 226 | 11.0% |
| 35 to 44 Years | 362 | 17.6% |
| 45 to 54 Years | 454 | 22.1% |
| 55 to 64 Years | 413 | 20.1% |
| 65 to 74 Years | 362 | 17.6% |
| 75 to 84 Years | 103 | 5.0% |
| 85 Years and Over | 132 | 6.4% |
| Total | 2,052 | 100.0% |
Housing Finances in Seat Pleasant
Median Income by Occupancy in Seat Pleasant
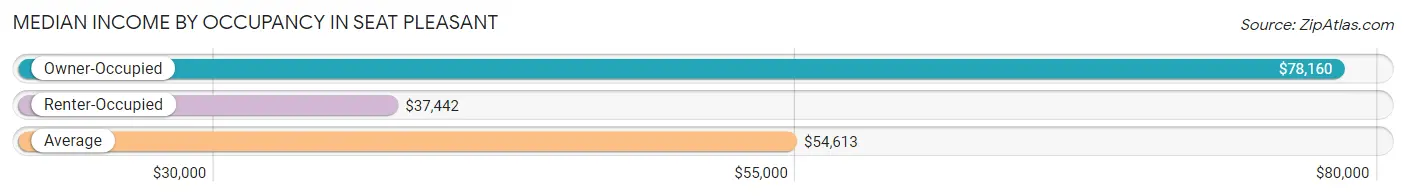
| Occupancy Type | # Households | Median Income |
| Owner-Occupied | 1,192 (58.1%) | $78,160 |
| Renter-Occupied | 860 (41.9%) | $37,442 |
| Average | 2,052 (100.0%) | $54,613 |
Occupancy by Householder Income Bracket in Seat Pleasant
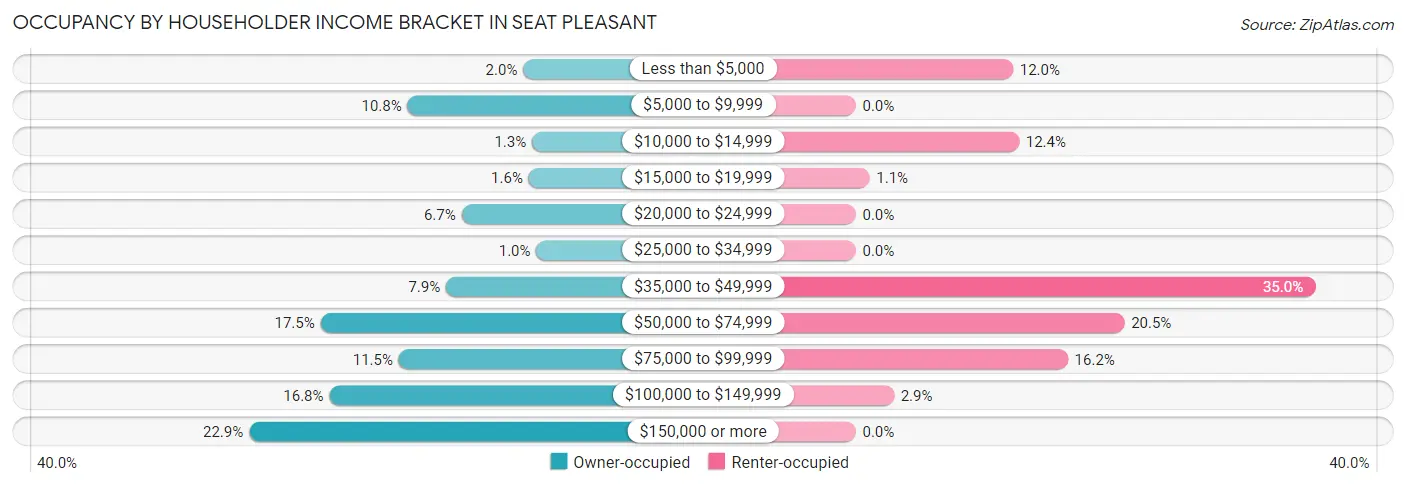
| Income Bracket | Owner-occupied | Renter-occupied |
| Less than $5,000 | 24 (2.0%) | 103 (12.0%) |
| $5,000 to $9,999 | 129 (10.8%) | 0 (0.0%) |
| $10,000 to $14,999 | 16 (1.3%) | 107 (12.4%) |
| $15,000 to $19,999 | 19 (1.6%) | 9 (1.1%) |
| $20,000 to $24,999 | 80 (6.7%) | 0 (0.0%) |
| $25,000 to $34,999 | 12 (1.0%) | 0 (0.0%) |
| $35,000 to $49,999 | 94 (7.9%) | 301 (35.0%) |
| $50,000 to $74,999 | 208 (17.4%) | 176 (20.5%) |
| $75,000 to $99,999 | 137 (11.5%) | 139 (16.2%) |
| $100,000 to $149,999 | 200 (16.8%) | 25 (2.9%) |
| $150,000 or more | 273 (22.9%) | 0 (0.0%) |
| Total | 1,192 (100.0%) | 860 (100.0%) |
Monthly Housing Cost Tiers in Seat Pleasant
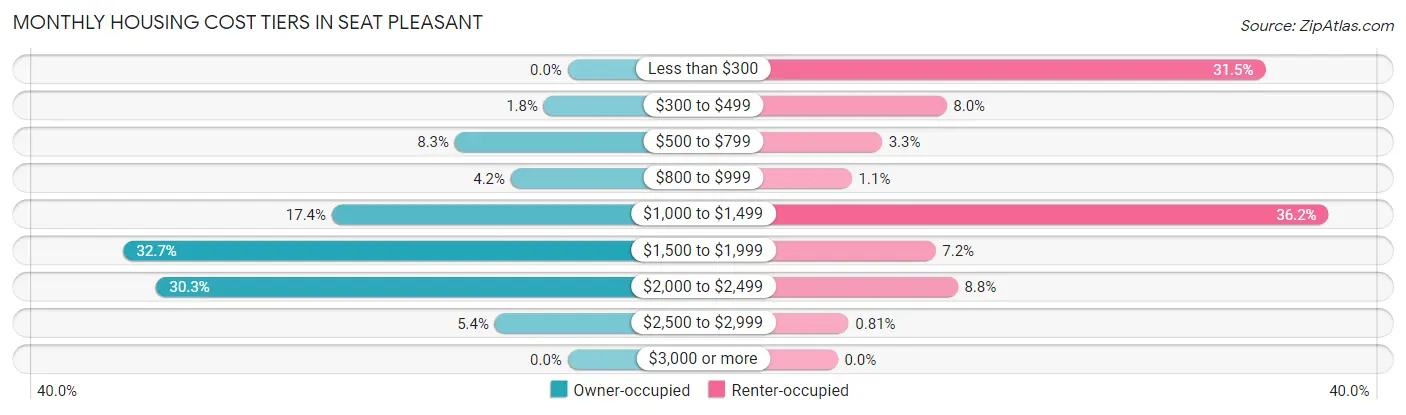
| Monthly Cost | Owner-occupied | Renter-occupied |
| Less than $300 | 0 (0.0%) | 271 (31.5%) |
| $300 to $499 | 21 (1.8%) | 69 (8.0%) |
| $500 to $799 | 99 (8.3%) | 28 (3.3%) |
| $800 to $999 | 50 (4.2%) | 9 (1.1%) |
| $1,000 to $1,499 | 207 (17.4%) | 311 (36.2%) |
| $1,500 to $1,999 | 390 (32.7%) | 62 (7.2%) |
| $2,000 to $2,499 | 361 (30.3%) | 76 (8.8%) |
| $2,500 to $2,999 | 64 (5.4%) | 7 (0.8%) |
| $3,000 or more | 0 (0.0%) | 0 (0.0%) |
| Total | 1,192 (100.0%) | 860 (100.0%) |
Physical Housing Characteristics in Seat Pleasant
Housing Structures in Seat Pleasant
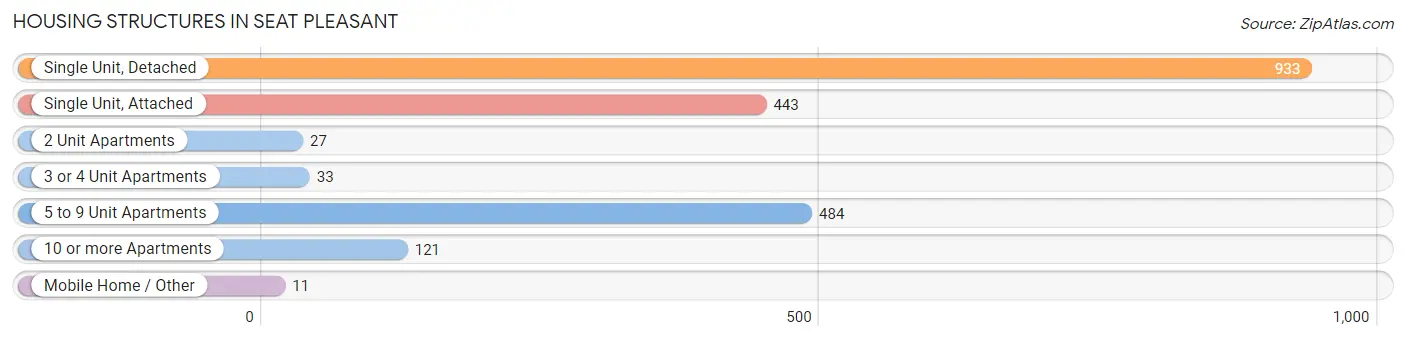
| Structure Type | # Housing Units | % Housing Units |
| Single Unit, Detached | 933 | 45.5% |
| Single Unit, Attached | 443 | 21.6% |
| 2 Unit Apartments | 27 | 1.3% |
| 3 or 4 Unit Apartments | 33 | 1.6% |
| 5 to 9 Unit Apartments | 484 | 23.6% |
| 10 or more Apartments | 121 | 5.9% |
| Mobile Home / Other | 11 | 0.5% |
| Total | 2,052 | 100.0% |
Housing Structures by Occupancy in Seat Pleasant
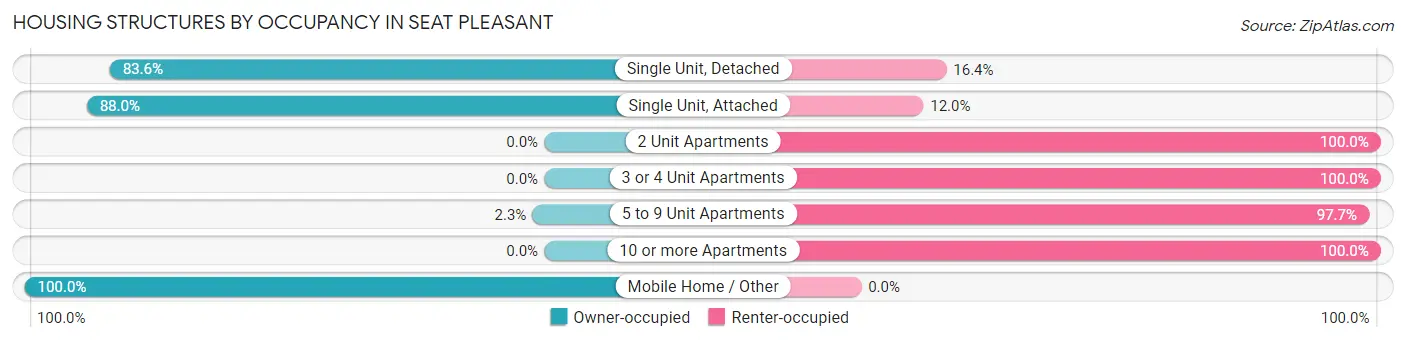
| Structure Type | Owner-occupied | Renter-occupied |
| Single Unit, Detached | 780 (83.6%) | 153 (16.4%) |
| Single Unit, Attached | 390 (88.0%) | 53 (12.0%) |
| 2 Unit Apartments | 0 (0.0%) | 27 (100.0%) |
| 3 or 4 Unit Apartments | 0 (0.0%) | 33 (100.0%) |
| 5 to 9 Unit Apartments | 11 (2.3%) | 473 (97.7%) |
| 10 or more Apartments | 0 (0.0%) | 121 (100.0%) |
| Mobile Home / Other | 11 (100.0%) | 0 (0.0%) |
| Total | 1,192 (58.1%) | 860 (41.9%) |
Housing Structures by Number of Rooms in Seat Pleasant
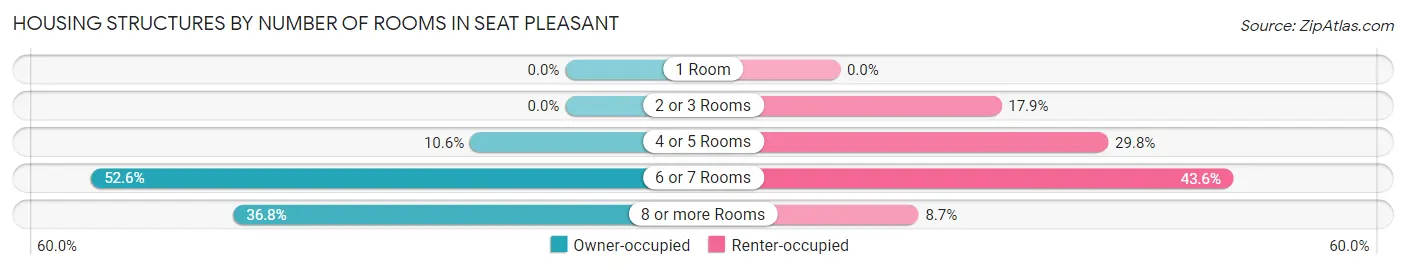
| Number of Rooms | Owner-occupied | Renter-occupied |
| 1 Room | 0 (0.0%) | 0 (0.0%) |
| 2 or 3 Rooms | 0 (0.0%) | 154 (17.9%) |
| 4 or 5 Rooms | 126 (10.6%) | 256 (29.8%) |
| 6 or 7 Rooms | 627 (52.6%) | 375 (43.6%) |
| 8 or more Rooms | 439 (36.8%) | 75 (8.7%) |
| Total | 1,192 (100.0%) | 860 (100.0%) |
Housing Structure by Heating Type in Seat Pleasant
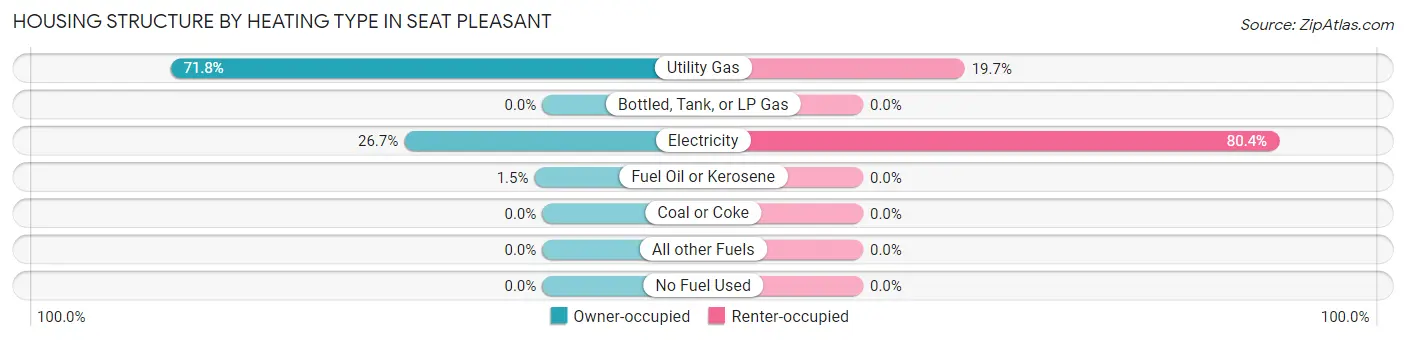
| Heating Type | Owner-occupied | Renter-occupied |
| Utility Gas | 856 (71.8%) | 169 (19.7%) |
| Bottled, Tank, or LP Gas | 0 (0.0%) | 0 (0.0%) |
| Electricity | 318 (26.7%) | 691 (80.3%) |
| Fuel Oil or Kerosene | 18 (1.5%) | 0 (0.0%) |
| Coal or Coke | 0 (0.0%) | 0 (0.0%) |
| All other Fuels | 0 (0.0%) | 0 (0.0%) |
| No Fuel Used | 0 (0.0%) | 0 (0.0%) |
| Total | 1,192 (100.0%) | 860 (100.0%) |
Household Vehicle Usage in Seat Pleasant
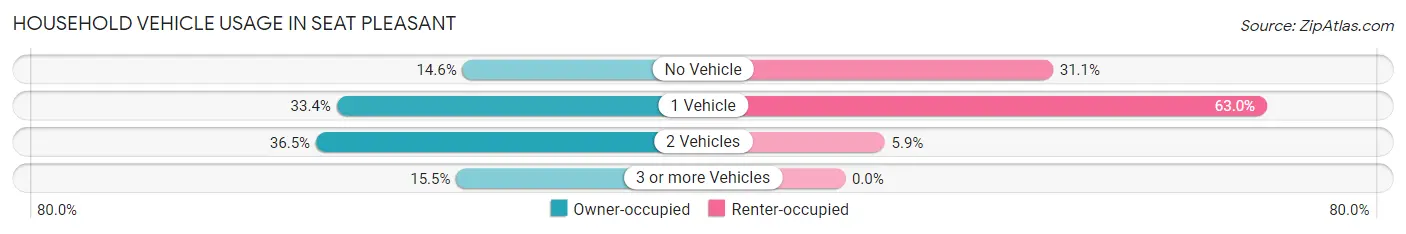
| Vehicles per Household | Owner-occupied | Renter-occupied |
| No Vehicle | 174 (14.6%) | 267 (31.0%) |
| 1 Vehicle | 398 (33.4%) | 542 (63.0%) |
| 2 Vehicles | 435 (36.5%) | 51 (5.9%) |
| 3 or more Vehicles | 185 (15.5%) | 0 (0.0%) |
| Total | 1,192 (100.0%) | 860 (100.0%) |
Real Estate & Mortgages in Seat Pleasant
Real Estate and Mortgage Overview in Seat Pleasant
| Characteristic | Without Mortgage | With Mortgage |
| Housing Units | 180 | 1,012 |
| Median Property Value | $260,700 | $280,700 |
| Median Household Income | $64,048 | $242 |
| Monthly Housing Costs | $693 | $0 |
| Real Estate Taxes | $3,816 | $134 |
Property Value by Mortgage Status in Seat Pleasant
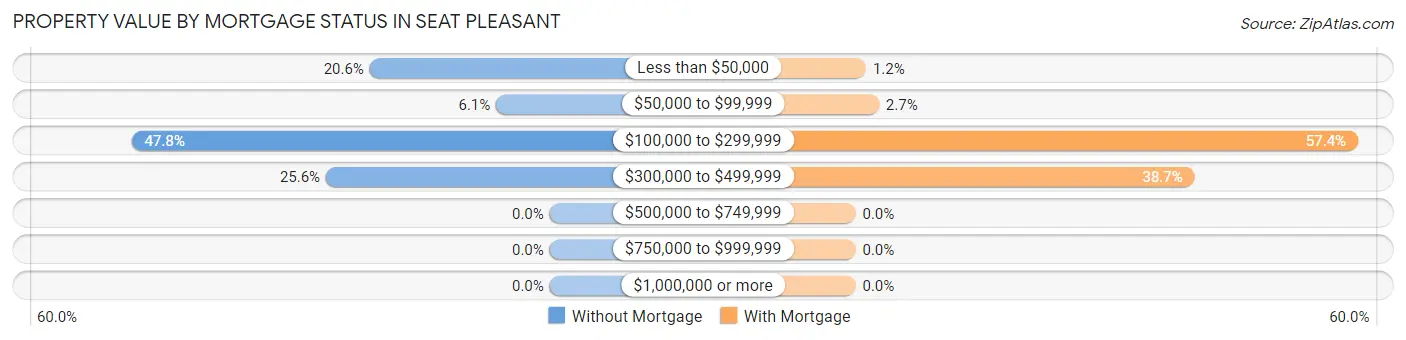
| Property Value | Without Mortgage | With Mortgage |
| Less than $50,000 | 37 (20.6%) | 12 (1.2%) |
| $50,000 to $99,999 | 11 (6.1%) | 27 (2.7%) |
| $100,000 to $299,999 | 86 (47.8%) | 581 (57.4%) |
| $300,000 to $499,999 | 46 (25.6%) | 392 (38.7%) |
| $500,000 to $749,999 | 0 (0.0%) | 0 (0.0%) |
| $750,000 to $999,999 | 0 (0.0%) | 0 (0.0%) |
| $1,000,000 or more | 0 (0.0%) | 0 (0.0%) |
| Total | 180 (100.0%) | 1,012 (100.0%) |
Household Income by Mortgage Status in Seat Pleasant
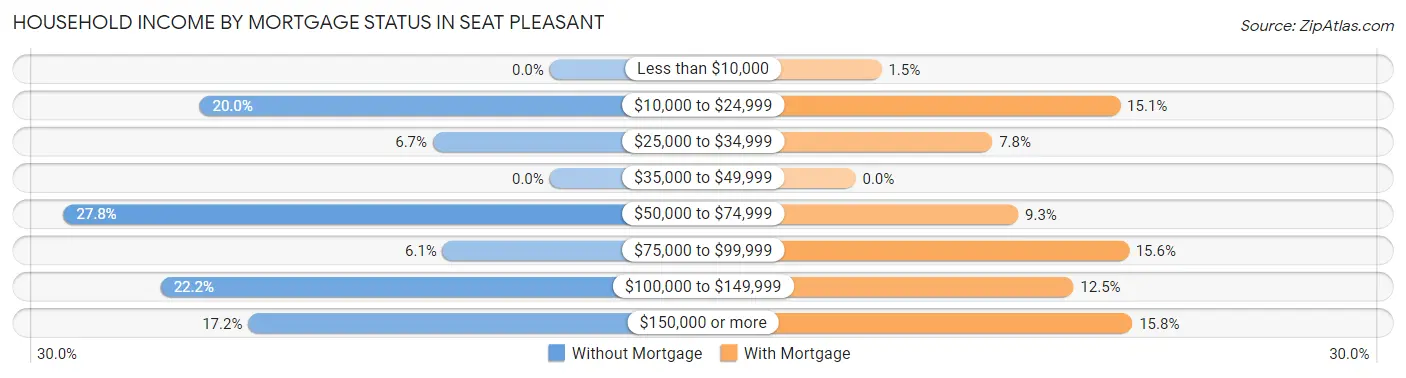
| Household Income | Without Mortgage | With Mortgage |
| Less than $10,000 | 0 (0.0%) | 15 (1.5%) |
| $10,000 to $24,999 | 36 (20.0%) | 153 (15.1%) |
| $25,000 to $34,999 | 12 (6.7%) | 79 (7.8%) |
| $35,000 to $49,999 | 0 (0.0%) | 0 (0.0%) |
| $50,000 to $74,999 | 50 (27.8%) | 94 (9.3%) |
| $75,000 to $99,999 | 11 (6.1%) | 158 (15.6%) |
| $100,000 to $149,999 | 40 (22.2%) | 126 (12.4%) |
| $150,000 or more | 31 (17.2%) | 160 (15.8%) |
| Total | 180 (100.0%) | 1,012 (100.0%) |
Property Value to Household Income Ratio in Seat Pleasant
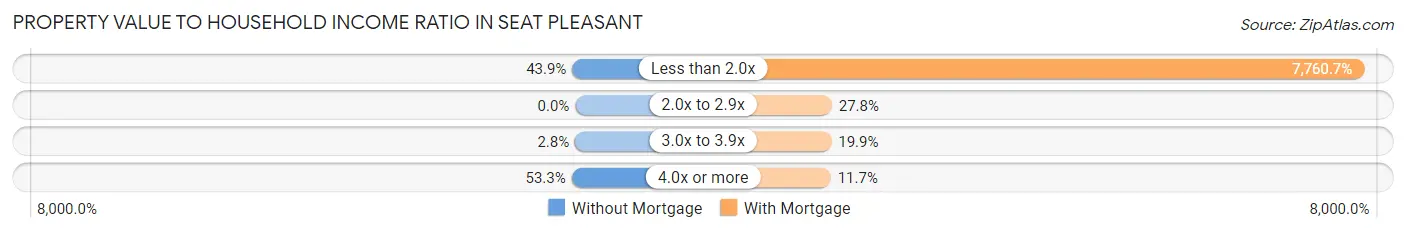
| Value-to-Income Ratio | Without Mortgage | With Mortgage |
| Less than 2.0x | 79 (43.9%) | 78,538 (7,760.7%) |
| 2.0x to 2.9x | 0 (0.0%) | 281 (27.8%) |
| 3.0x to 3.9x | 5 (2.8%) | 201 (19.9%) |
| 4.0x or more | 96 (53.3%) | 118 (11.7%) |
| Total | 180 (100.0%) | 1,012 (100.0%) |
Real Estate Taxes by Mortgage Status in Seat Pleasant
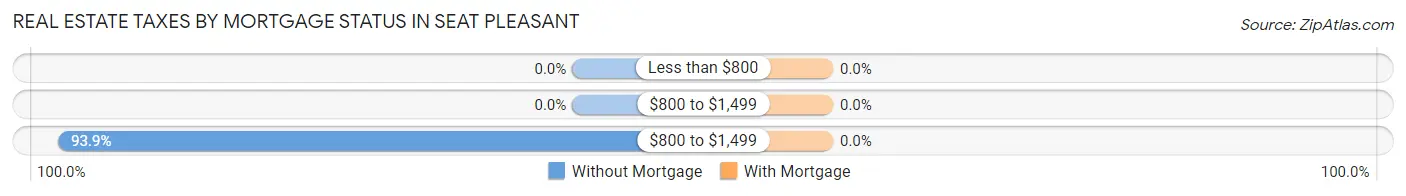
| Property Taxes | Without Mortgage | With Mortgage |
| Less than $800 | 0 (0.0%) | 0 (0.0%) |
| $800 to $1,499 | 0 (0.0%) | 0 (0.0%) |
| $800 to $1,499 | 169 (93.9%) | 0 (0.0%) |
| Total | 180 (100.0%) | 1,012 (100.0%) |
Health & Disability in Seat Pleasant
Health Insurance Coverage by Age in Seat Pleasant
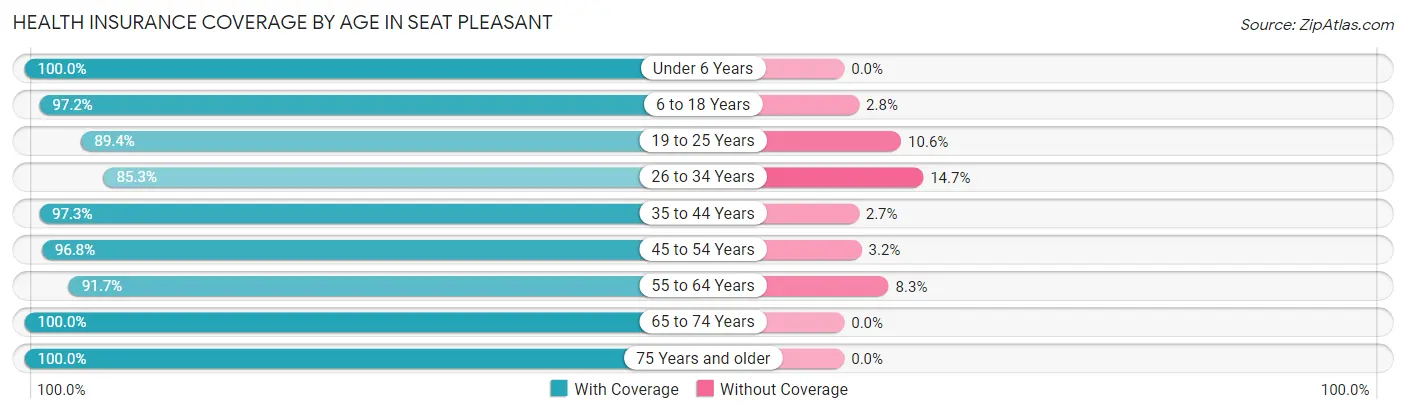
| Age Bracket | With Coverage | Without Coverage |
| Under 6 Years | 522 (100.0%) | 0 (0.0%) |
| 6 to 18 Years | 421 (97.2%) | 12 (2.8%) |
| 19 to 25 Years | 135 (89.4%) | 16 (10.6%) |
| 26 to 34 Years | 539 (85.3%) | 93 (14.7%) |
| 35 to 44 Years | 540 (97.3%) | 15 (2.7%) |
| 45 to 54 Years | 631 (96.8%) | 21 (3.2%) |
| 55 to 64 Years | 677 (91.7%) | 61 (8.3%) |
| 65 to 74 Years | 551 (100.0%) | 0 (0.0%) |
| 75 Years and older | 307 (100.0%) | 0 (0.0%) |
| Total | 4,323 (95.2%) | 218 (4.8%) |
Health Insurance Coverage by Citizenship Status in Seat Pleasant
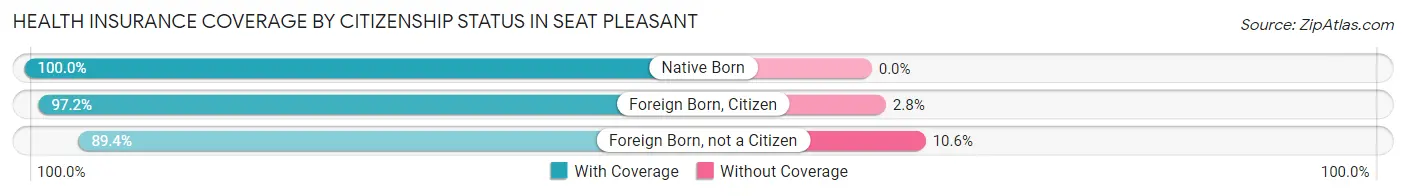
| Citizenship Status | With Coverage | Without Coverage |
| Native Born | 522 (100.0%) | 0 (0.0%) |
| Foreign Born, Citizen | 421 (97.2%) | 12 (2.8%) |
| Foreign Born, not a Citizen | 135 (89.4%) | 16 (10.6%) |
Health Insurance Coverage by Household Income in Seat Pleasant
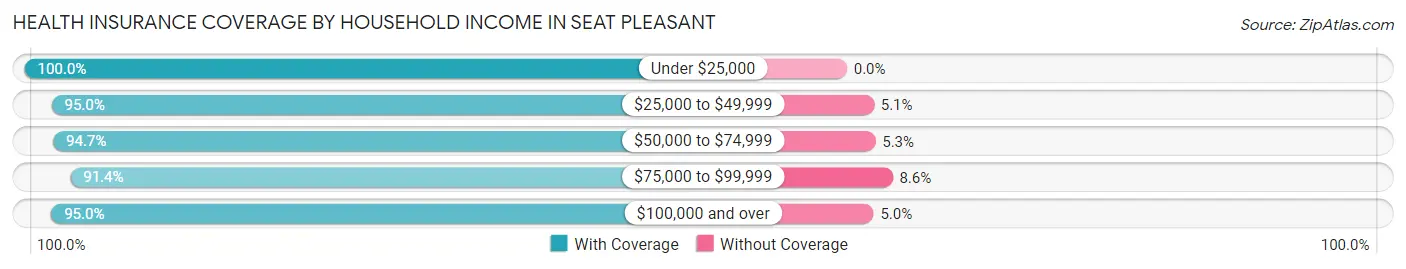
| Household Income | With Coverage | Without Coverage |
| Under $25,000 | 618 (100.0%) | 0 (0.0%) |
| $25,000 to $49,999 | 809 (95.0%) | 43 (5.1%) |
| $50,000 to $74,999 | 922 (94.7%) | 52 (5.3%) |
| $75,000 to $99,999 | 481 (91.4%) | 45 (8.6%) |
| $100,000 and over | 1,483 (95.0%) | 78 (5.0%) |
Public vs Private Health Insurance Coverage by Age in Seat Pleasant
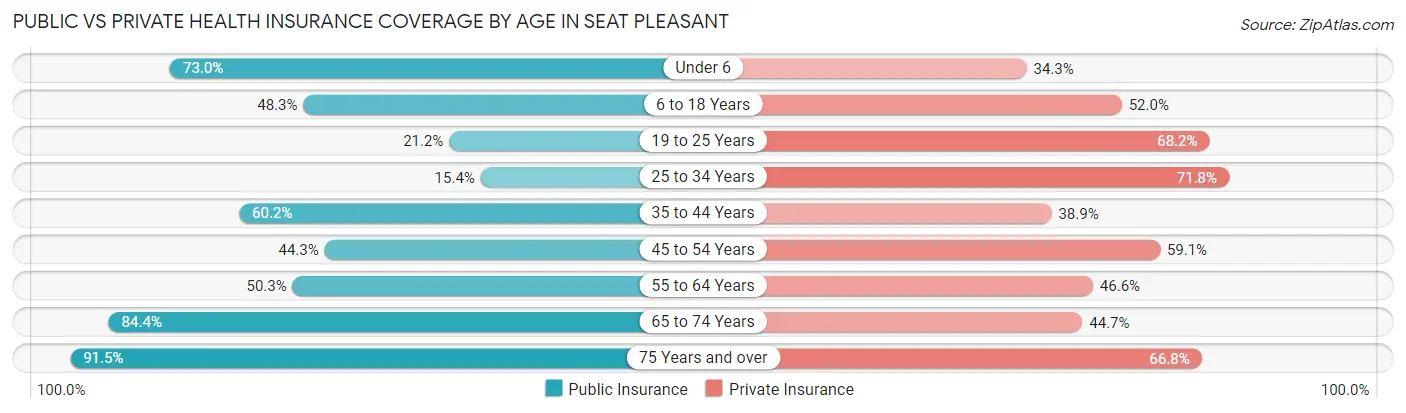
| Age Bracket | Public Insurance | Private Insurance |
| Under 6 | 381 (73.0%) | 179 (34.3%) |
| 6 to 18 Years | 209 (48.3%) | 225 (52.0%) |
| 19 to 25 Years | 32 (21.2%) | 103 (68.2%) |
| 25 to 34 Years | 97 (15.3%) | 454 (71.8%) |
| 35 to 44 Years | 334 (60.2%) | 216 (38.9%) |
| 45 to 54 Years | 289 (44.3%) | 385 (59.1%) |
| 55 to 64 Years | 371 (50.3%) | 344 (46.6%) |
| 65 to 74 Years | 465 (84.4%) | 246 (44.7%) |
| 75 Years and over | 281 (91.5%) | 205 (66.8%) |
| Total | 2,459 (54.1%) | 2,357 (51.9%) |
Disability Status by Sex by Age in Seat Pleasant
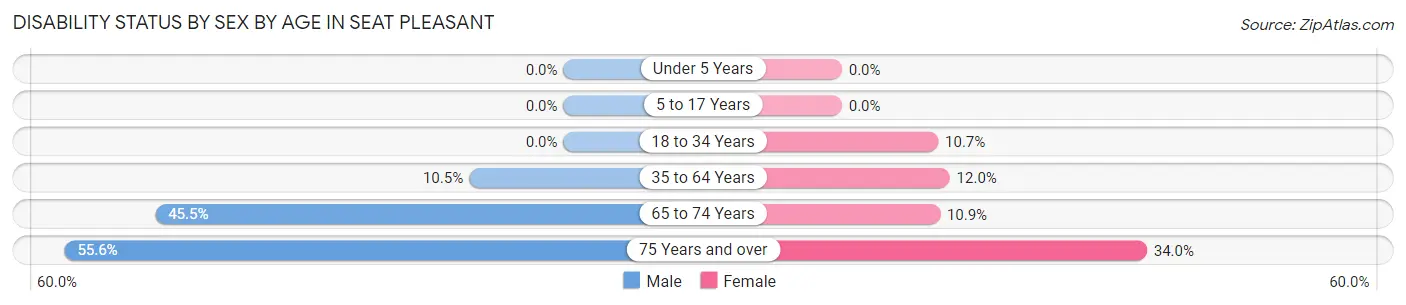
| Age Bracket | Male | Female |
| Under 5 Years | 0 (0.0%) | 0 (0.0%) |
| 5 to 17 Years | 0 (0.0%) | 0 (0.0%) |
| 18 to 34 Years | 0 (0.0%) | 28 (10.7%) |
| 35 to 64 Years | 81 (10.5%) | 141 (12.0%) |
| 65 to 74 Years | 80 (45.5%) | 41 (10.9%) |
| 75 Years and over | 25 (55.6%) | 89 (34.0%) |
Disability Class by Sex by Age in Seat Pleasant
Disability Class: Hearing Difficulty
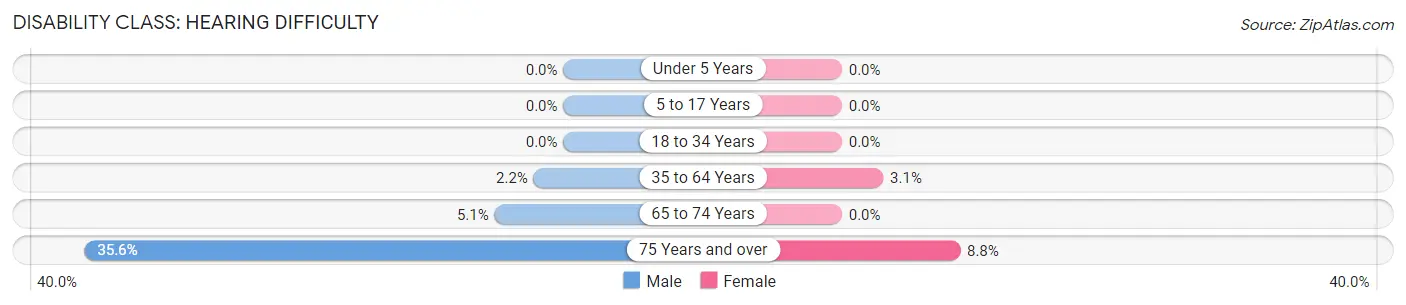
| Age Bracket | Male | Female |
| Under 5 Years | 0 (0.0%) | 0 (0.0%) |
| 5 to 17 Years | 0 (0.0%) | 0 (0.0%) |
| 18 to 34 Years | 0 (0.0%) | 0 (0.0%) |
| 35 to 64 Years | 17 (2.2%) | 36 (3.1%) |
| 65 to 74 Years | 9 (5.1%) | 0 (0.0%) |
| 75 Years and over | 16 (35.6%) | 23 (8.8%) |
Disability Class: Vision Difficulty
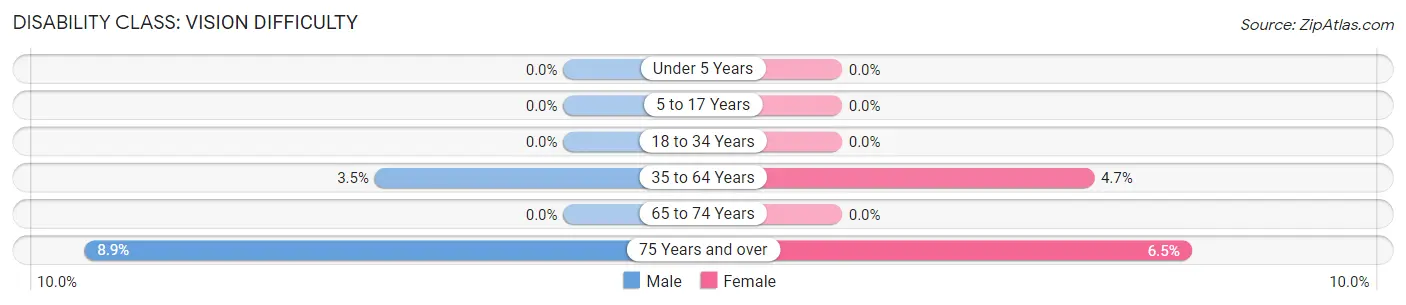
| Age Bracket | Male | Female |
| Under 5 Years | 0 (0.0%) | 0 (0.0%) |
| 5 to 17 Years | 0 (0.0%) | 0 (0.0%) |
| 18 to 34 Years | 0 (0.0%) | 0 (0.0%) |
| 35 to 64 Years | 27 (3.5%) | 55 (4.7%) |
| 65 to 74 Years | 0 (0.0%) | 0 (0.0%) |
| 75 Years and over | 4 (8.9%) | 17 (6.5%) |
Disability Class: Cognitive Difficulty
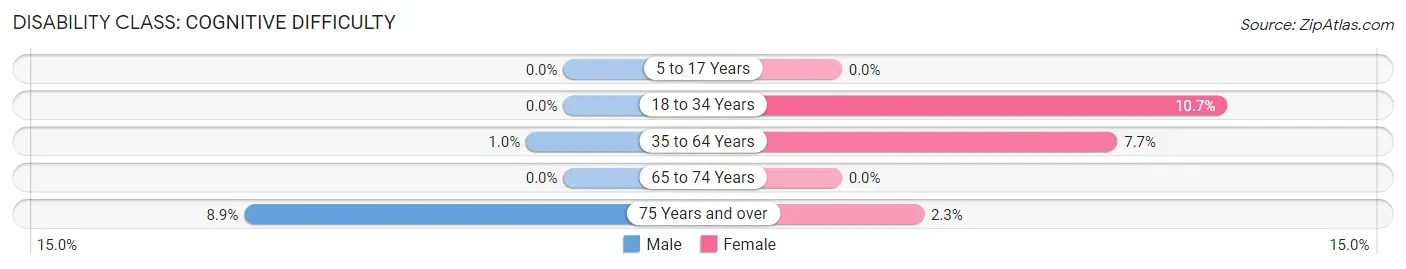
| Age Bracket | Male | Female |
| 5 to 17 Years | 0 (0.0%) | 0 (0.0%) |
| 18 to 34 Years | 0 (0.0%) | 28 (10.7%) |
| 35 to 64 Years | 8 (1.0%) | 90 (7.7%) |
| 65 to 74 Years | 0 (0.0%) | 0 (0.0%) |
| 75 Years and over | 4 (8.9%) | 6 (2.3%) |
Disability Class: Ambulatory Difficulty
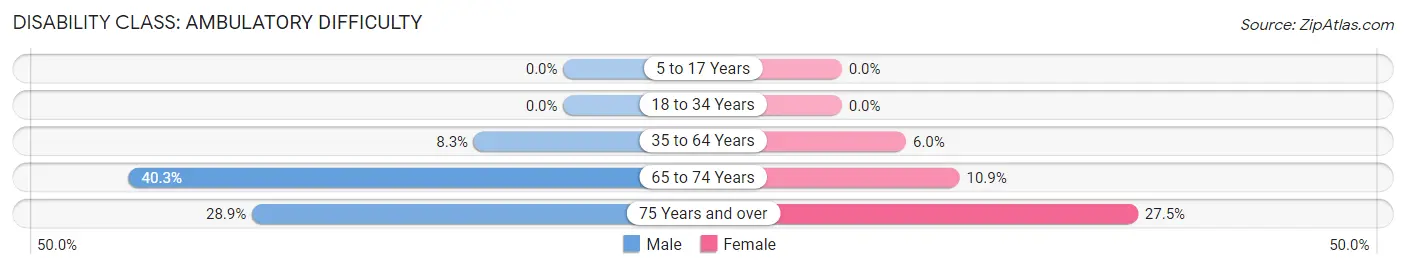
| Age Bracket | Male | Female |
| 5 to 17 Years | 0 (0.0%) | 0 (0.0%) |
| 18 to 34 Years | 0 (0.0%) | 0 (0.0%) |
| 35 to 64 Years | 64 (8.3%) | 70 (6.0%) |
| 65 to 74 Years | 71 (40.3%) | 41 (10.9%) |
| 75 Years and over | 13 (28.9%) | 72 (27.5%) |
Disability Class: Self-Care Difficulty
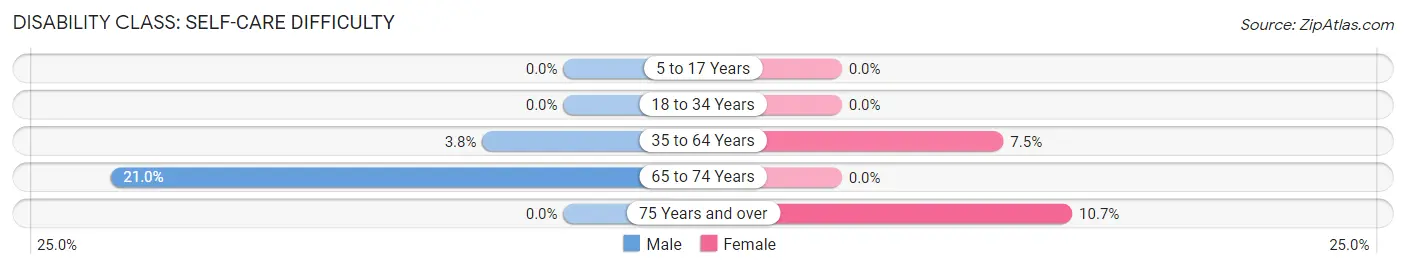
| Age Bracket | Male | Female |
| 5 to 17 Years | 0 (0.0%) | 0 (0.0%) |
| 18 to 34 Years | 0 (0.0%) | 0 (0.0%) |
| 35 to 64 Years | 29 (3.8%) | 88 (7.5%) |
| 65 to 74 Years | 37 (21.0%) | 0 (0.0%) |
| 75 Years and over | 0 (0.0%) | 28 (10.7%) |
Technology Access in Seat Pleasant
Computing Device Access in Seat Pleasant
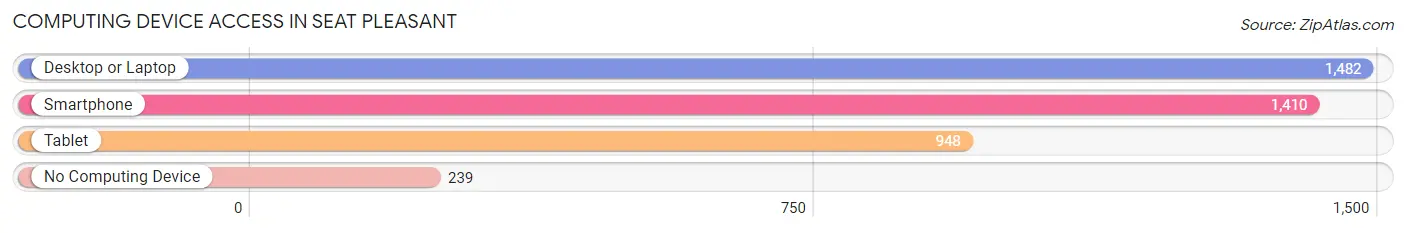
| Device Type | # Households | % Households |
| Desktop or Laptop | 1,482 | 72.2% |
| Smartphone | 1,410 | 68.7% |
| Tablet | 948 | 46.2% |
| No Computing Device | 239 | 11.7% |
| Total | 2,052 | 100.0% |
Internet Access in Seat Pleasant
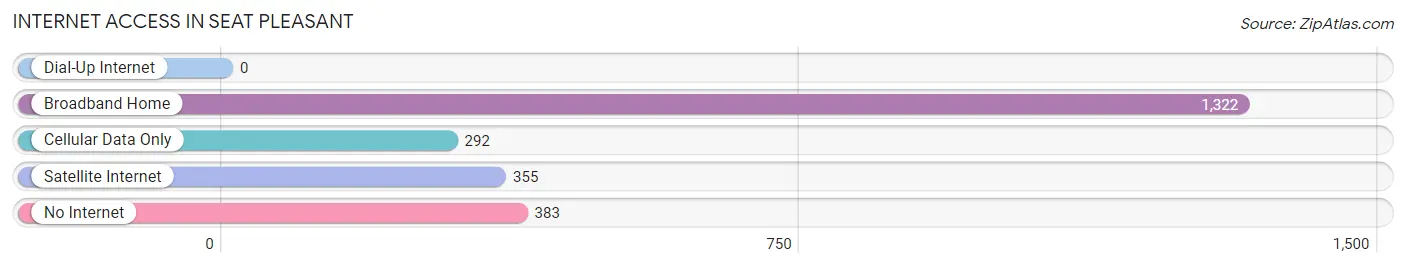
| Internet Type | # Households | % Households |
| Dial-Up Internet | 0 | 0.0% |
| Broadband Home | 1,322 | 64.4% |
| Cellular Data Only | 292 | 14.2% |
| Satellite Internet | 355 | 17.3% |
| No Internet | 383 | 18.7% |
| Total | 2,052 | 100.0% |
Seat Pleasant Summary
Seat Pleasant is a city located in Prince George’s County, Maryland, United States. It is located just east of Washington, D.C. and is part of the Washington metropolitan area. As of the 2010 census, the population of Seat Pleasant was 5,837.
History
Seat Pleasant was originally part of an area known as Broad Creek, which was settled by Native Americans in the 1600s. The area was later settled by European colonists in the 1700s. The town was first known as “Seat Pleasant” in 1820, when it was established as a post office. The name was derived from the fact that the town was located on a hill overlooking the surrounding area.
In the late 1800s, the town began to grow and develop. The first school was built in 1891, and the first church was built in 1895. The town was incorporated in 1931, and the first mayor was elected in 1932.
Geography
Seat Pleasant is located at 38°54'25" North, 76°54'45" West (38.906833, -76.912500). According to the United States Census Bureau, the city has a total area of 0.9 square miles (2.3 km2), all of it land.
Economy
Seat Pleasant’s economy is largely based on the service industry. The city is home to several restaurants, retail stores, and other businesses. The city also has a number of government offices, including the Seat Pleasant City Hall and the Prince George’s County Courthouse.
Demographics
As of the 2010 census, there were 5,837 people, 2,072 households, and 1,521 families residing in the city. The population density was 6,521.3 people per square mile (2,521.2/km2). There were 2,072 housing units at an average density of 2,288.3 per square mile (886.2/km2). The racial makeup of the city was 33.2% White, 57.2% African American, 0.3% Native American, 1.2% Asian, 0.1% Pacific Islander, 5.3% from other races, and 2.7% from two or more races. Hispanic or Latino of any race were 10.2% of the population.
There were 2,072 households, out of which 37.2% had children under the age of 18 living with them, 37.2% were married couples living together, 24.2% had a female householder with no husband present, and 32.2% were non-families. 25.7% of all households were made up of individuals, and 8.2% had someone living alone who was 65 years of age or older. The average household size was 2.83 and the average family size was 3.41.
In the city, the population was spread out, with 28.7% under the age of 18, 9.2% from 18 to 24, 30.2% from 25 to 44, 22.2% from 45 to 64, and 9.7% who were 65 years of age or older. The median age was 33 years. For every 100 females, there were 87.2 males. For every 100 females age 18 and over, there were 81.3 males.
The median income for a household in the city was $41,944, and the median income for a family was $48,958. Males had a median income of $35,938 versus $30,917 for females. The per capita income for the city was $18,945. About 11.2% of families and 13.2% of the population were below the poverty line, including 17.2% of those under age 18 and 11.2% of those age 65 or over.
Common Questions
What is Per Capita Income in Seat Pleasant?
Per Capita income in Seat Pleasant is $36,959.
What is the Median Family Income in Seat Pleasant?
Median Family Income in Seat Pleasant is $71,288.
What is the Median Household income in Seat Pleasant?
Median Household Income in Seat Pleasant is $54,613.
What is Income or Wage Gap in Seat Pleasant?
Income or Wage Gap in Seat Pleasant is 25.4%.
Women in Seat Pleasant earn 74.6 cents for every dollar earned by a man.
What is Inequality or Gini Index in Seat Pleasant?
Inequality or Gini Index in Seat Pleasant is 0.47.
What is the Total Population of Seat Pleasant?
Total Population of Seat Pleasant is 4,544.
What is the Total Male Population of Seat Pleasant?
Total Male Population of Seat Pleasant is 1,837.
What is the Total Female Population of Seat Pleasant?
Total Female Population of Seat Pleasant is 2,707.
What is the Ratio of Males per 100 Females in Seat Pleasant?
There are 67.86 Males per 100 Females in Seat Pleasant.
What is the Ratio of Females per 100 Males in Seat Pleasant?
There are 147.36 Females per 100 Males in Seat Pleasant.
What is the Median Population Age in Seat Pleasant?
Median Population Age in Seat Pleasant is 43.4 Years.
What is the Average Family Size in Seat Pleasant
Average Family Size in Seat Pleasant is 3.3 People.
What is the Average Household Size in Seat Pleasant
Average Household Size in Seat Pleasant is 2.2 People.
How Large is the Labor Force in Seat Pleasant?
There are 2,426 People in the Labor Forcein in Seat Pleasant.
What is the Percentage of People in the Labor Force in Seat Pleasant?
67.0% of People are in the Labor Force in Seat Pleasant.
What is the Unemployment Rate in Seat Pleasant?
Unemployment Rate in Seat Pleasant is 18.9%.