Joppatowne, MD Map & Demographics
Joppatowne Map
Joppatowne Overview
$49,644
PER CAPITA INCOME
$110,709
AVG FAMILY INCOME
$101,141
AVG HOUSEHOLD INCOME
33.9%
WAGE / INCOME GAP [ % ]
66.1¢/ $1
WAGE / INCOME GAP [ $ ]
0.40
INEQUALITY / GINI INDEX
13,391
TOTAL POPULATION
6,431
MALE POPULATION
6,960
FEMALE POPULATION
92.40
MALES / 100 FEMALES
108.23
FEMALES / 100 MALES
42.6
MEDIAN AGE
2.9
AVG FAMILY SIZE
2.5
AVG HOUSEHOLD SIZE
7,913
LABOR FORCE [ PEOPLE ]
70.6%
PERCENT IN LABOR FORCE
5.1%
UNEMPLOYMENT RATE
Income in Joppatowne
Income Overview in Joppatowne
Per Capita Income in Joppatowne is $49,644, while median incomes of families and households are $110,709 and $101,141 respectively.
| Characteristic | Number | Measure |
| Per Capita Income | 13,391 | $49,644 |
| Median Family Income | 3,873 | $110,709 |
| Mean Family Income | 3,873 | $134,195 |
| Median Household Income | 5,286 | $101,141 |
| Mean Household Income | 5,286 | $123,116 |
| Income Deficit | 3,873 | $0 |
| Wage / Income Gap (%) | 13,391 | 33.90% |
| Wage / Income Gap ($) | 13,391 | 66.10¢ per $1 |
| Gini / Inequality Index | 13,391 | 0.40 |
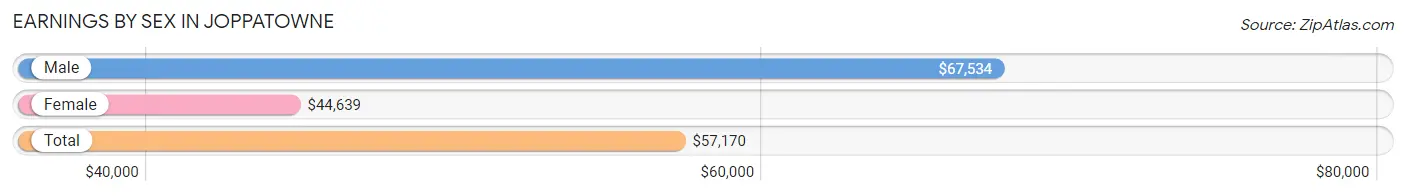
Earnings by Sex in Joppatowne
Average Earnings in Joppatowne are $57,170, $67,534 for men and $44,639 for women, a difference of 33.9%.
| Sex | Number | Average Earnings |
| Male | 4,213 (53.8%) | $67,534 |
| Female | 3,621 (46.2%) | $44,639 |
| Total | 7,834 (100.0%) | $57,170 |
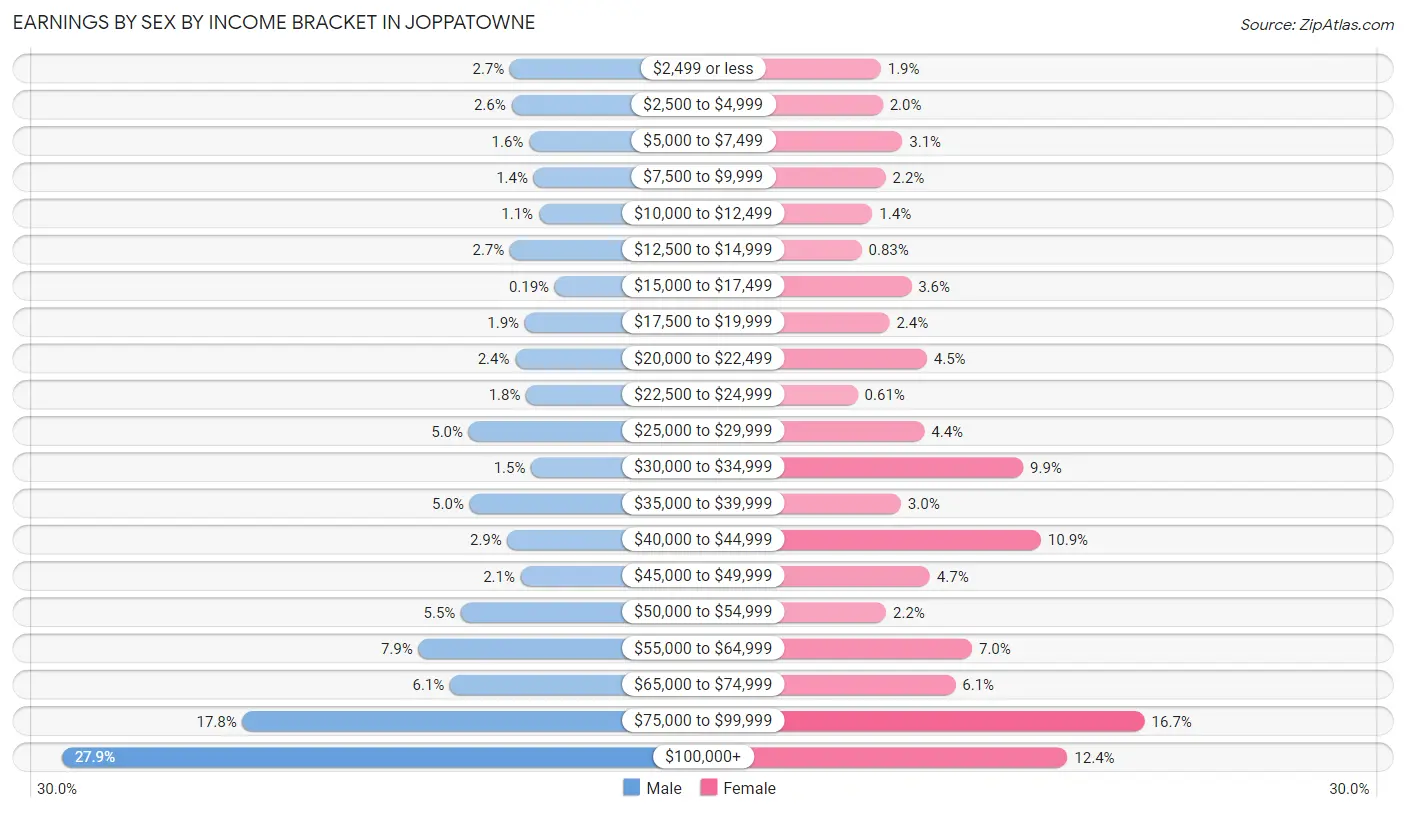
Earnings by Sex by Income Bracket in Joppatowne
The most common earnings brackets in Joppatowne are $100,000+ for men (1,176 | 27.9%) and $75,000 to $99,999 for women (606 | 16.7%).
| Income | Male | Female |
| $2,499 or less | 114 (2.7%) | 69 (1.9%) |
| $2,500 to $4,999 | 111 (2.6%) | 73 (2.0%) |
| $5,000 to $7,499 | 69 (1.6%) | 113 (3.1%) |
| $7,500 to $9,999 | 58 (1.4%) | 79 (2.2%) |
| $10,000 to $12,499 | 46 (1.1%) | 52 (1.4%) |
| $12,500 to $14,999 | 114 (2.7%) | 30 (0.8%) |
| $15,000 to $17,499 | 8 (0.2%) | 131 (3.6%) |
| $17,500 to $19,999 | 79 (1.9%) | 87 (2.4%) |
| $20,000 to $22,499 | 102 (2.4%) | 163 (4.5%) |
| $22,500 to $24,999 | 76 (1.8%) | 22 (0.6%) |
| $25,000 to $29,999 | 212 (5.0%) | 158 (4.4%) |
| $30,000 to $34,999 | 64 (1.5%) | 359 (9.9%) |
| $35,000 to $39,999 | 210 (5.0%) | 110 (3.0%) |
| $40,000 to $44,999 | 120 (2.9%) | 395 (10.9%) |
| $45,000 to $49,999 | 89 (2.1%) | 169 (4.7%) |
| $50,000 to $54,999 | 230 (5.5%) | 80 (2.2%) |
| $55,000 to $64,999 | 331 (7.9%) | 255 (7.0%) |
| $65,000 to $74,999 | 256 (6.1%) | 221 (6.1%) |
| $75,000 to $99,999 | 748 (17.7%) | 606 (16.7%) |
| $100,000+ | 1,176 (27.9%) | 449 (12.4%) |
| Total | 4,213 (100.0%) | 3,621 (100.0%) |
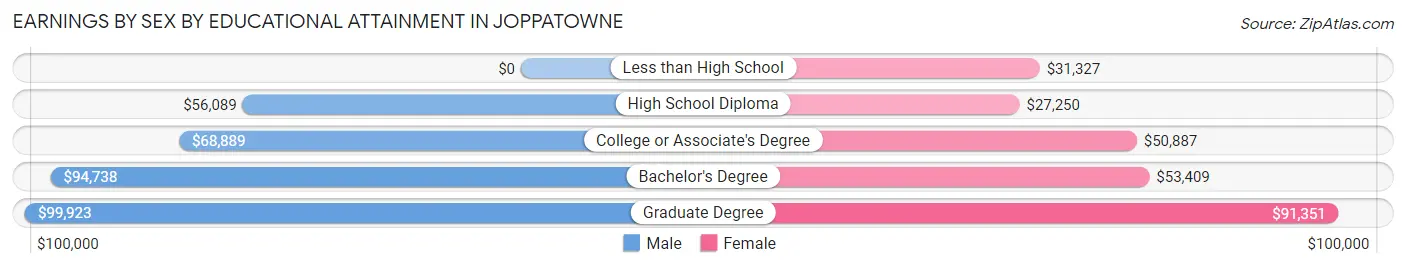
Earnings by Sex by Educational Attainment in Joppatowne
Average earnings in Joppatowne are $78,551 for men and $47,989 for women, a difference of 38.9%. Men with an educational attainment of graduate degree enjoy the highest average annual earnings of $99,923, while those with high school diploma education earn the least with $56,089. Women with an educational attainment of graduate degree earn the most with the average annual earnings of $91,351, while those with high school diploma education have the smallest earnings of $27,250.
| Educational Attainment | Male Income | Female Income |
| Less than High School | - | - |
| High School Diploma | $56,089 | $27,250 |
| College or Associate's Degree | $68,889 | $50,887 |
| Bachelor's Degree | $94,738 | $53,409 |
| Graduate Degree | $99,923 | $91,351 |
| Total | $78,551 | $47,989 |
Family Income in Joppatowne
Family Income Brackets in Joppatowne
According to the Joppatowne family income data, there are 906 families falling into the $100,000 to $149,999 income range, which is the most common income bracket and makes up 23.4% of all families. Conversely, the $10,000 to $14,999 income bracket is the least frequent group with only 23 families (0.6%) belonging to this category.
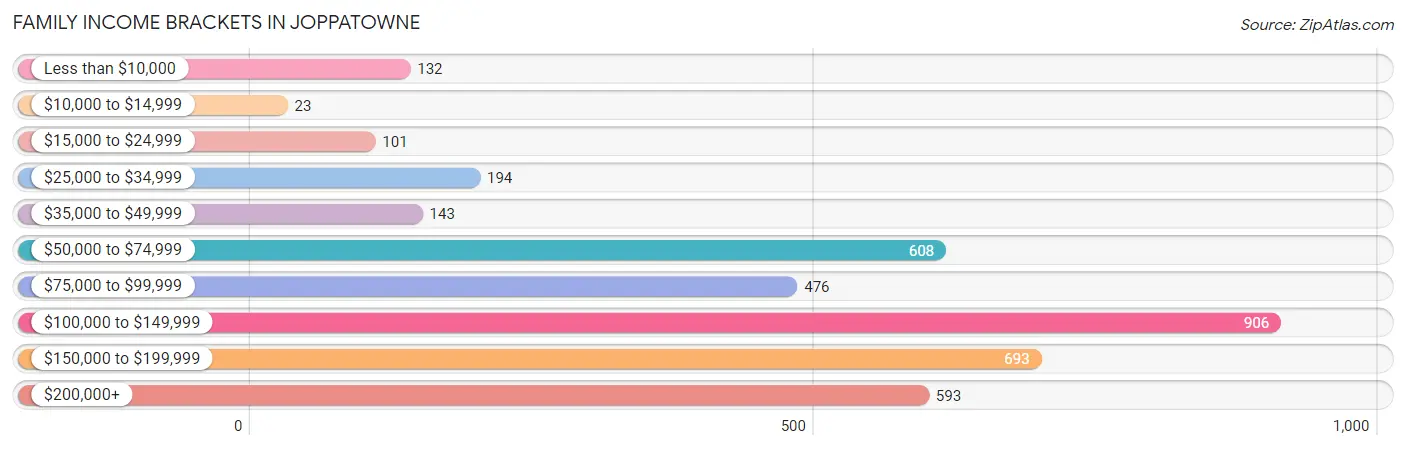
| Income Bracket | # Families | % Families |
| Less than $10,000 | 132 | 3.4% |
| $10,000 to $14,999 | 23 | 0.6% |
| $15,000 to $24,999 | 101 | 2.6% |
| $25,000 to $34,999 | 194 | 5.0% |
| $35,000 to $49,999 | 143 | 3.7% |
| $50,000 to $74,999 | 608 | 15.7% |
| $75,000 to $99,999 | 476 | 12.3% |
| $100,000 to $149,999 | 906 | 23.4% |
| $150,000 to $199,999 | 693 | 17.9% |
| $200,000+ | 593 | 15.3% |
Family Income by Famaliy Size in Joppatowne
4-person families (510 | 13.2%) account for the highest median family income in Joppatowne with $189,919 per family, while 3-person families (827 | 21.3%) have the highest median income of $47,894 per family member.
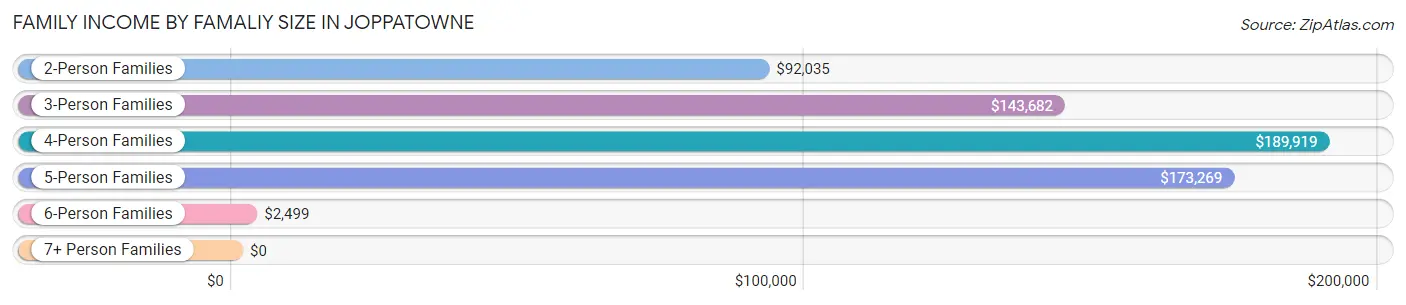
| Income Bracket | # Families | Median Income |
| 2-Person Families | 2,184 (56.4%) | $92,035 |
| 3-Person Families | 827 (21.3%) | $143,682 |
| 4-Person Families | 510 (13.2%) | $189,919 |
| 5-Person Families | 250 (6.5%) | $173,269 |
| 6-Person Families | 70 (1.8%) | $2,499 |
| 7+ Person Families | 32 (0.8%) | $0 |
| Total | 3,873 (100.0%) | $110,709 |
Family Income by Number of Earners in Joppatowne
The median family income in Joppatowne is $110,709, with families comprising 3+ earners (490) having the highest median family income of $187,411, while families with no earners (593) have the lowest median family income of $55,474, accounting for 12.7% and 15.3% of families, respectively.
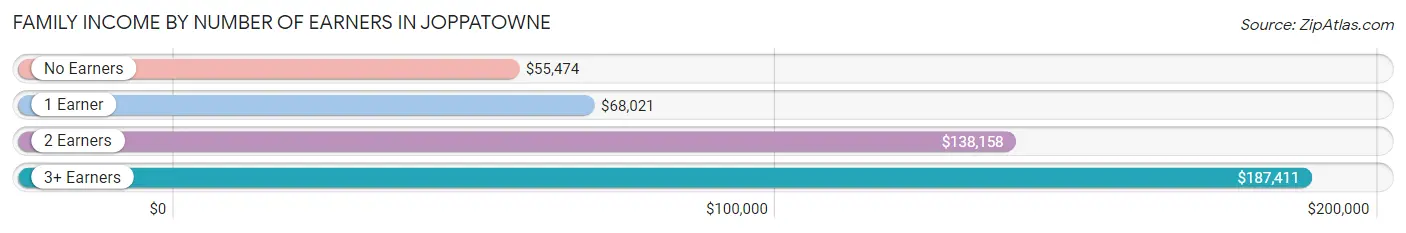
| Number of Earners | # Families | Median Income |
| No Earners | 593 (15.3%) | $55,474 |
| 1 Earner | 1,126 (29.1%) | $68,021 |
| 2 Earners | 1,664 (43.0%) | $138,158 |
| 3+ Earners | 490 (12.7%) | $187,411 |
| Total | 3,873 (100.0%) | $110,709 |
Household Income in Joppatowne
Household Income Brackets in Joppatowne
With 1,147 households falling in the category, the $100,000 to $149,999 income range is the most frequent in Joppatowne, accounting for 21.7% of all households. In contrast, only 53 households (1.0%) fall into the $10,000 to $14,999 income bracket, making it the least populous group.
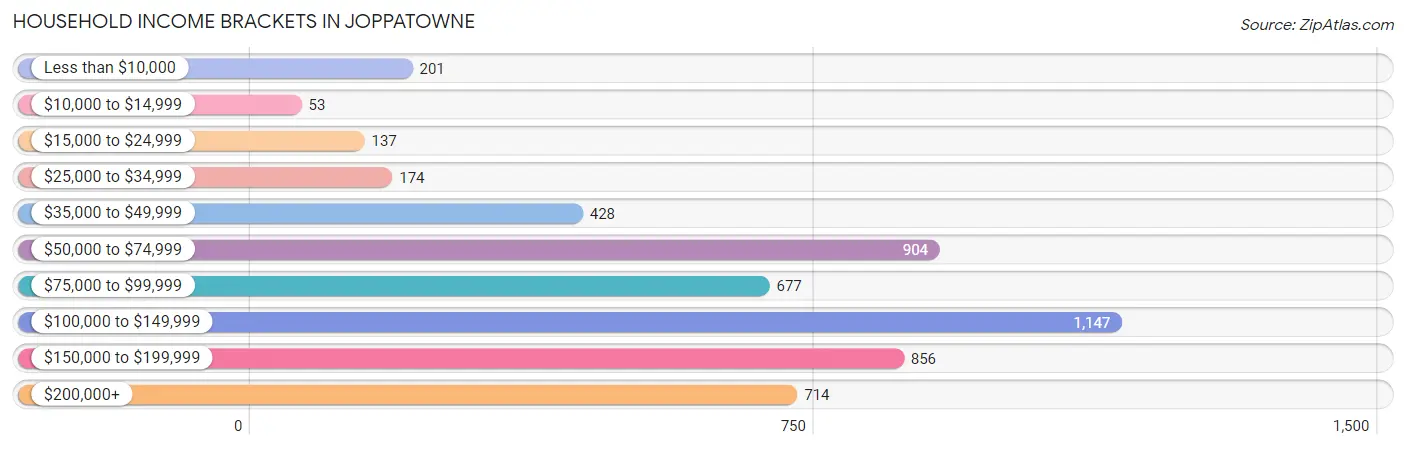
| Income Bracket | # Households | % Households |
| Less than $10,000 | 201 | 3.8% |
| $10,000 to $14,999 | 53 | 1.0% |
| $15,000 to $24,999 | 137 | 2.6% |
| $25,000 to $34,999 | 174 | 3.3% |
| $35,000 to $49,999 | 428 | 8.1% |
| $50,000 to $74,999 | 904 | 17.1% |
| $75,000 to $99,999 | 677 | 12.8% |
| $100,000 to $149,999 | 1,147 | 21.7% |
| $150,000 to $199,999 | 856 | 16.2% |
| $200,000+ | 714 | 13.5% |
Household Income by Householder Age in Joppatowne
The median household income in Joppatowne is $101,141, with the highest median household income of $119,886 found in the 45 to 64 years age bracket for the primary householder. A total of 2,179 households (41.2%) fall into this category. Meanwhile, the 65+ years age bracket for the primary householder has the lowest median household income of $60,026, with 1,383 households (26.2%) in this group.
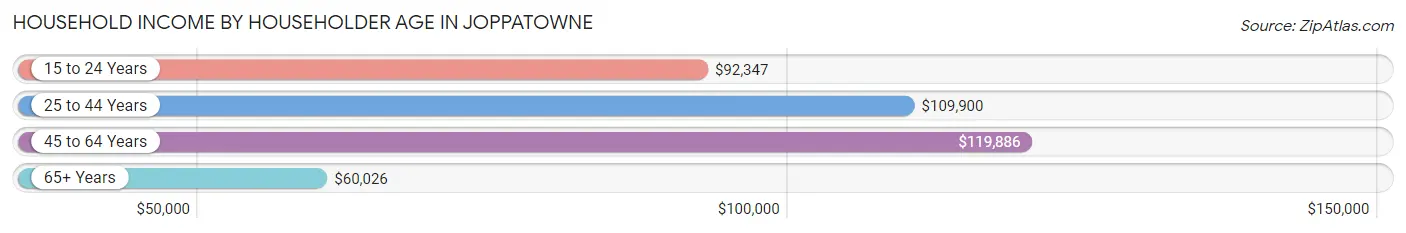
| Income Bracket | # Households | Median Income |
| 15 to 24 Years | 202 (3.8%) | $92,347 |
| 25 to 44 Years | 1,522 (28.8%) | $109,900 |
| 45 to 64 Years | 2,179 (41.2%) | $119,886 |
| 65+ Years | 1,383 (26.2%) | $60,026 |
| Total | 5,286 (100.0%) | $101,141 |
Poverty in Joppatowne
Income Below Poverty by Sex and Age in Joppatowne
With 7.3% poverty level for males and 10.6% for females among the residents of Joppatowne, 6 to 11 year old males and 25 to 34 year old females are the most vulnerable to poverty, with 142 males (62.3%) and 211 females (19.4%) in their respective age groups living below the poverty level.
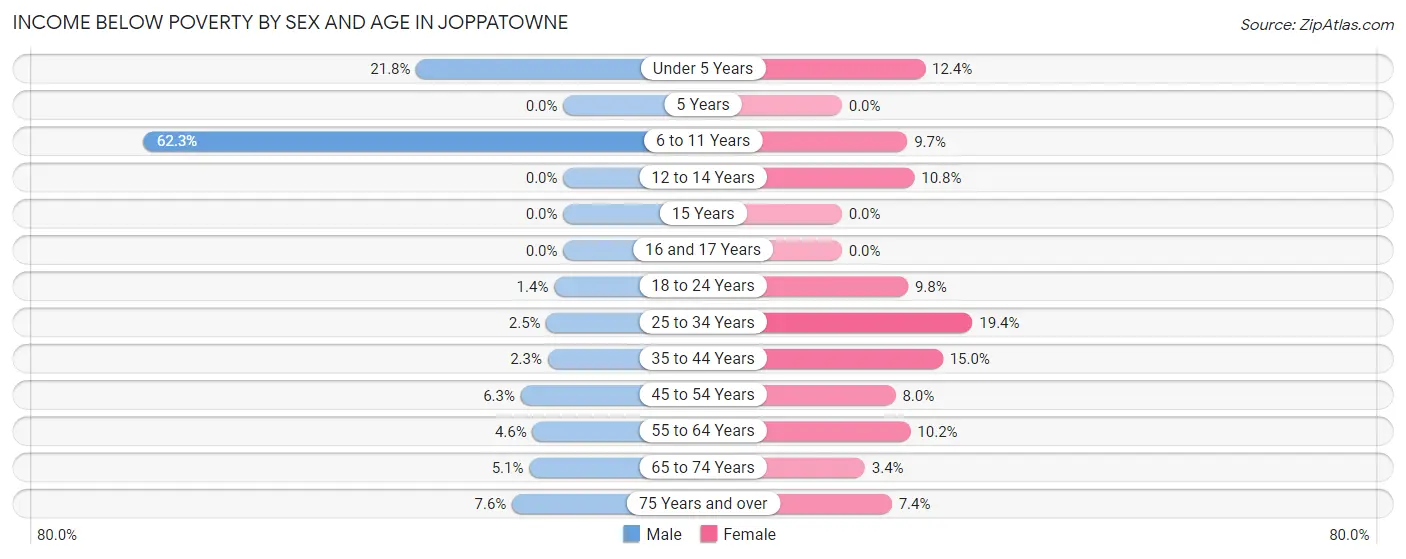
| Age Bracket | Male | Female |
| Under 5 Years | 105 (21.8%) | 44 (12.4%) |
| 5 Years | 0 (0.0%) | 0 (0.0%) |
| 6 to 11 Years | 142 (62.3%) | 38 (9.7%) |
| 12 to 14 Years | 0 (0.0%) | 21 (10.8%) |
| 15 Years | 0 (0.0%) | 0 (0.0%) |
| 16 and 17 Years | 0 (0.0%) | 0 (0.0%) |
| 18 to 24 Years | 7 (1.3%) | 51 (9.8%) |
| 25 to 34 Years | 21 (2.5%) | 211 (19.4%) |
| 35 to 44 Years | 23 (2.3%) | 130 (15.0%) |
| 45 to 54 Years | 76 (6.3%) | 72 (8.0%) |
| 55 to 64 Years | 36 (4.6%) | 109 (10.2%) |
| 65 to 74 Years | 31 (5.1%) | 23 (3.4%) |
| 75 Years and over | 32 (7.6%) | 41 (7.4%) |
| Total | 473 (7.3%) | 740 (10.6%) |
Income Above Poverty by Sex and Age in Joppatowne
According to the poverty statistics in Joppatowne, males aged 5 years and females aged 5 years are the age groups that are most secure financially, with 100.0% of males and 100.0% of females in these age groups living above the poverty line.
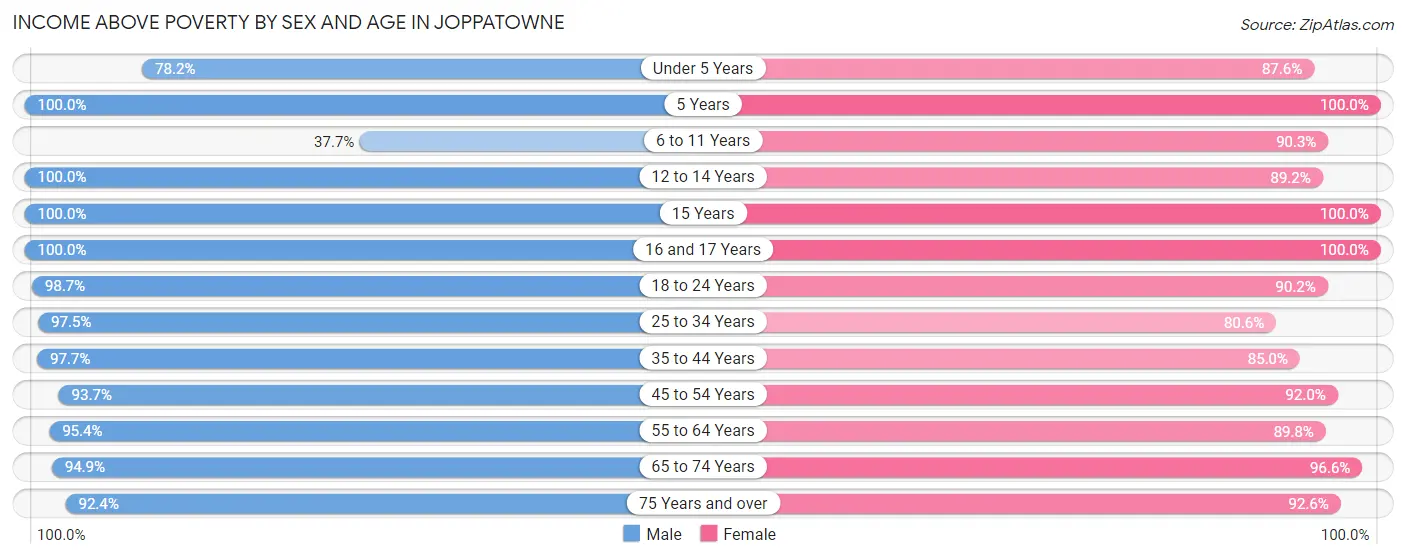
| Age Bracket | Male | Female |
| Under 5 Years | 376 (78.2%) | 312 (87.6%) |
| 5 Years | 41 (100.0%) | 171 (100.0%) |
| 6 to 11 Years | 86 (37.7%) | 353 (90.3%) |
| 12 to 14 Years | 142 (100.0%) | 174 (89.2%) |
| 15 Years | 24 (100.0%) | 154 (100.0%) |
| 16 and 17 Years | 143 (100.0%) | 20 (100.0%) |
| 18 to 24 Years | 510 (98.7%) | 468 (90.2%) |
| 25 to 34 Years | 814 (97.5%) | 877 (80.6%) |
| 35 to 44 Years | 973 (97.7%) | 738 (85.0%) |
| 45 to 54 Years | 1,126 (93.7%) | 831 (92.0%) |
| 55 to 64 Years | 752 (95.4%) | 961 (89.8%) |
| 65 to 74 Years | 582 (94.9%) | 649 (96.6%) |
| 75 Years and over | 389 (92.4%) | 512 (92.6%) |
| Total | 5,958 (92.6%) | 6,220 (89.4%) |
Income Below Poverty Among Married-Couple Families in Joppatowne
The poverty statistics for married-couple families in Joppatowne show that 2.7% or 80 of the total 2,934 families live below the poverty line. Families with 1 or 2 children have the highest poverty rate of 5.9%, comprising of 49 families. On the other hand, families with 3 or 4 children have the lowest poverty rate of 0.0%, which includes 0 families.
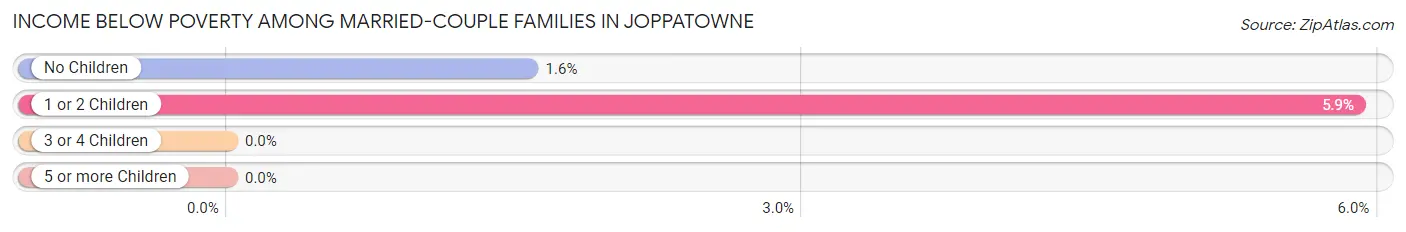
| Children | Above Poverty | Below Poverty |
| No Children | 1,944 (98.4%) | 31 (1.6%) |
| 1 or 2 Children | 783 (94.1%) | 49 (5.9%) |
| 3 or 4 Children | 127 (100.0%) | 0 (0.0%) |
| 5 or more Children | 0 (0.0%) | 0 (0.0%) |
| Total | 2,854 (97.3%) | 80 (2.7%) |
Income Below Poverty Among Single-Parent Households in Joppatowne
According to the poverty data in Joppatowne, 6.7% or 21 single-father households and 21.8% or 136 single-mother households are living below the poverty line. Among single-father households, those with 1 or 2 children have the highest poverty rate, with 21 households (10.5%) experiencing poverty. Likewise, among single-mother households, those with 5 or more children have the highest poverty rate, with 44 households (100.0%) falling below the poverty line.
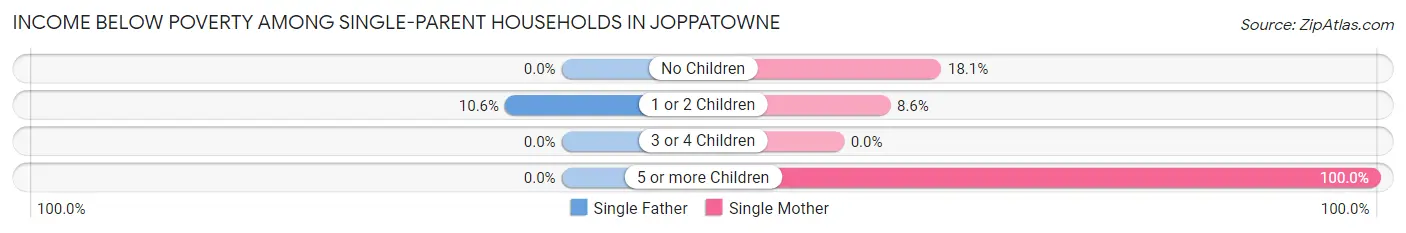
| Children | Single Father | Single Mother |
| No Children | 0 (0.0%) | 80 (18.1%) |
| 1 or 2 Children | 21 (10.5%) | 12 (8.6%) |
| 3 or 4 Children | 0 (0.0%) | 0 (0.0%) |
| 5 or more Children | 0 (0.0%) | 44 (100.0%) |
| Total | 21 (6.7%) | 136 (21.8%) |
Income Below Poverty Among Married-Couple vs Single-Parent Households in Joppatowne
The poverty data for Joppatowne shows that 80 of the married-couple family households (2.7%) and 157 of the single-parent households (16.7%) are living below the poverty level. Within the married-couple family households, those with 1 or 2 children have the highest poverty rate, with 49 households (5.9%) falling below the poverty line. Among the single-parent households, those with 5 or more children have the highest poverty rate, with 44 household (100.0%) living below poverty.
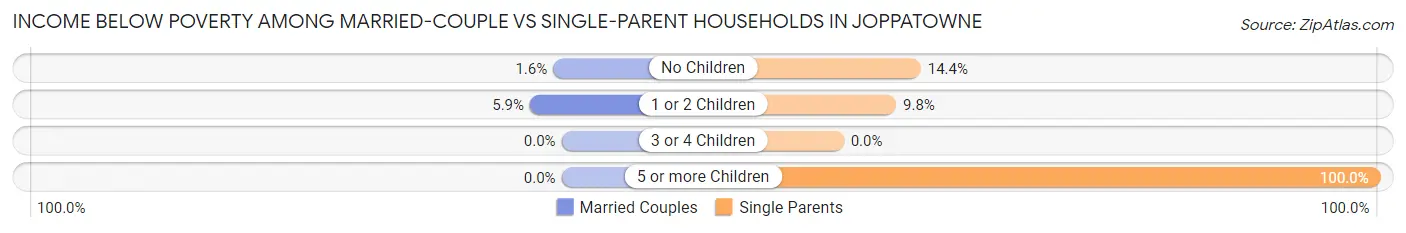
| Children | Married-Couple Families | Single-Parent Households |
| No Children | 31 (1.6%) | 80 (14.4%) |
| 1 or 2 Children | 49 (5.9%) | 33 (9.8%) |
| 3 or 4 Children | 0 (0.0%) | 0 (0.0%) |
| 5 or more Children | 0 (0.0%) | 44 (100.0%) |
| Total | 80 (2.7%) | 157 (16.7%) |
Race in Joppatowne
The most populous races in Joppatowne are White / Caucasian (9,779 | 73.0%), Black / African American (2,591 | 19.4%), and Hispanic or Latino (648 | 4.8%).
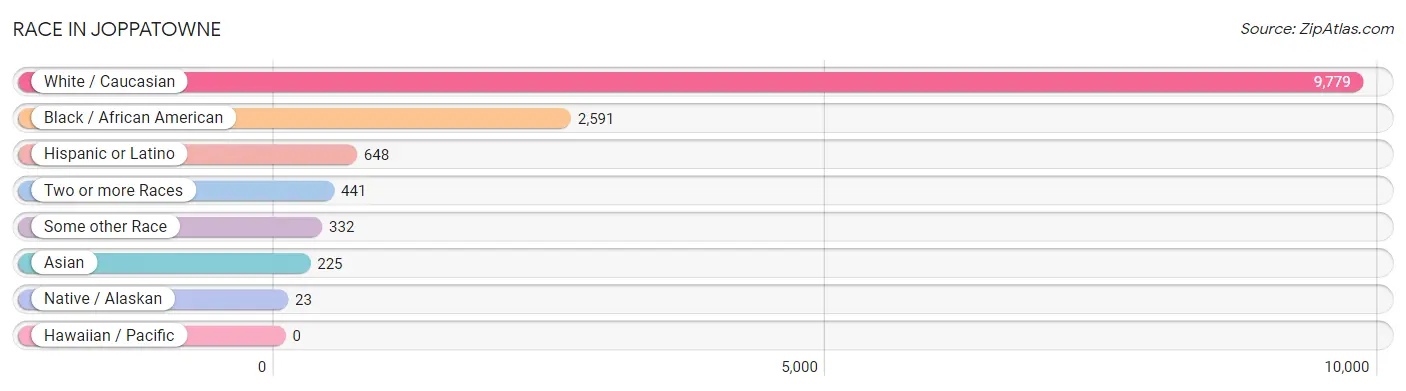
| Race | # Population | % Population |
| Asian | 225 | 1.7% |
| Black / African American | 2,591 | 19.4% |
| Hawaiian / Pacific | 0 | 0.0% |
| Hispanic or Latino | 648 | 4.8% |
| Native / Alaskan | 23 | 0.2% |
| White / Caucasian | 9,779 | 73.0% |
| Two or more Races | 441 | 3.3% |
| Some other Race | 332 | 2.5% |
| Total | 13,391 | 100.0% |
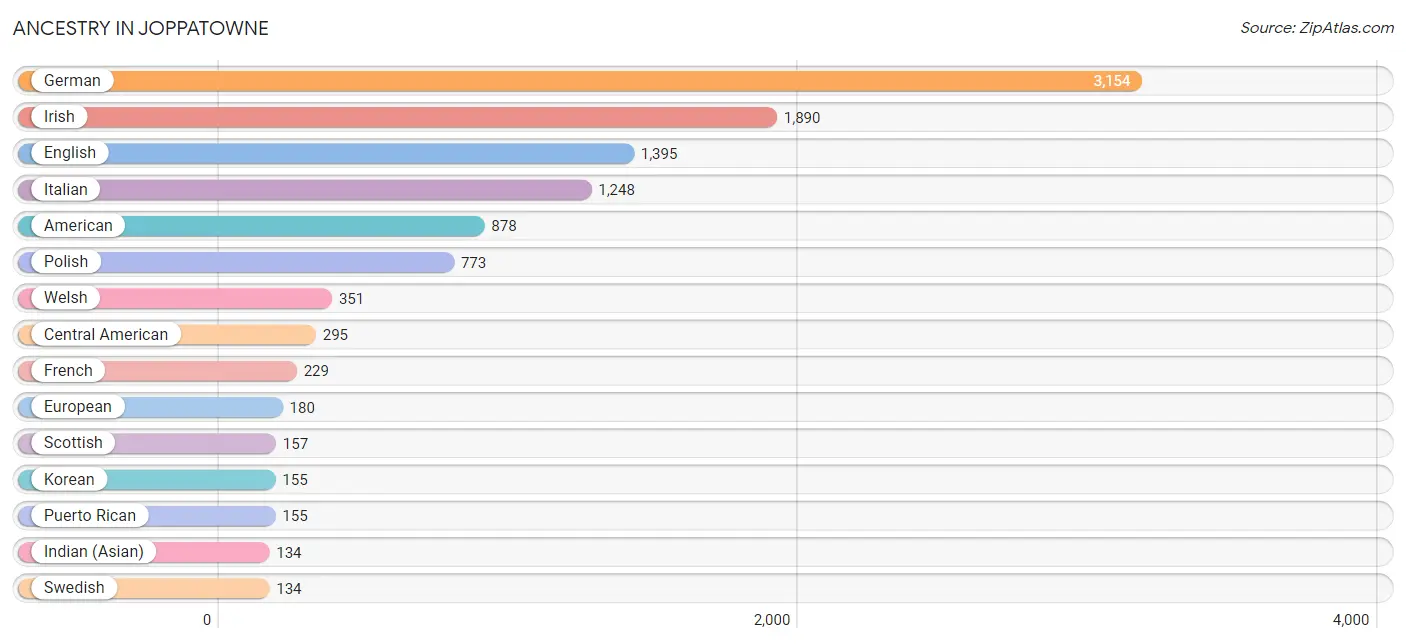
Ancestry in Joppatowne
The most populous ancestries reported in Joppatowne are German (3,154 | 23.5%), Irish (1,890 | 14.1%), English (1,395 | 10.4%), Italian (1,248 | 9.3%), and American (878 | 6.6%), together accounting for 64.0% of all Joppatowne residents.
| Ancestry | # Population | % Population |
| African | 53 | 0.4% |
| American | 878 | 6.6% |
| Arab | 55 | 0.4% |
| Blackfeet | 8 | 0.1% |
| British | 20 | 0.2% |
| Central American | 295 | 2.2% |
| Cherokee | 18 | 0.1% |
| Colombian | 8 | 0.1% |
| Croatian | 38 | 0.3% |
| Cuban | 30 | 0.2% |
| Czech | 94 | 0.7% |
| Czechoslovakian | 18 | 0.1% |
| Danish | 12 | 0.1% |
| Dominican | 26 | 0.2% |
| Dutch | 123 | 0.9% |
| Eastern European | 60 | 0.4% |
| Egyptian | 44 | 0.3% |
| English | 1,395 | 10.4% |
| European | 180 | 1.3% |
| French | 229 | 1.7% |
| French Canadian | 101 | 0.7% |
| German | 3,154 | 23.5% |
| Greek | 131 | 1.0% |
| Guatemalan | 33 | 0.3% |
| Honduran | 16 | 0.1% |
| Hungarian | 19 | 0.1% |
| Indian (Asian) | 134 | 1.0% |
| Irish | 1,890 | 14.1% |
| Italian | 1,248 | 9.3% |
| Jamaican | 43 | 0.3% |
| Korean | 155 | 1.2% |
| Latvian | 23 | 0.2% |
| Lebanese | 11 | 0.1% |
| Lithuanian | 88 | 0.7% |
| Mexican | 98 | 0.7% |
| Nicaraguan | 72 | 0.5% |
| Nigerian | 12 | 0.1% |
| Norwegian | 50 | 0.4% |
| Panamanian | 43 | 0.3% |
| Pennsylvania German | 18 | 0.1% |
| Polish | 773 | 5.8% |
| Puerto Rican | 155 | 1.2% |
| Russian | 35 | 0.3% |
| Salvadoran | 131 | 1.0% |
| Scandinavian | 30 | 0.2% |
| Scotch-Irish | 92 | 0.7% |
| Scottish | 157 | 1.2% |
| Slavic | 19 | 0.1% |
| Slovak | 17 | 0.1% |
| South American | 8 | 0.1% |
| Sri Lankan | 50 | 0.4% |
| Subsaharan African | 70 | 0.5% |
| Swedish | 134 | 1.0% |
| Swiss | 15 | 0.1% |
| Thai | 90 | 0.7% |
| Ukrainian | 14 | 0.1% |
| Welsh | 351 | 2.6% |
| West Indian | 39 | 0.3% | View All 58 Rows |
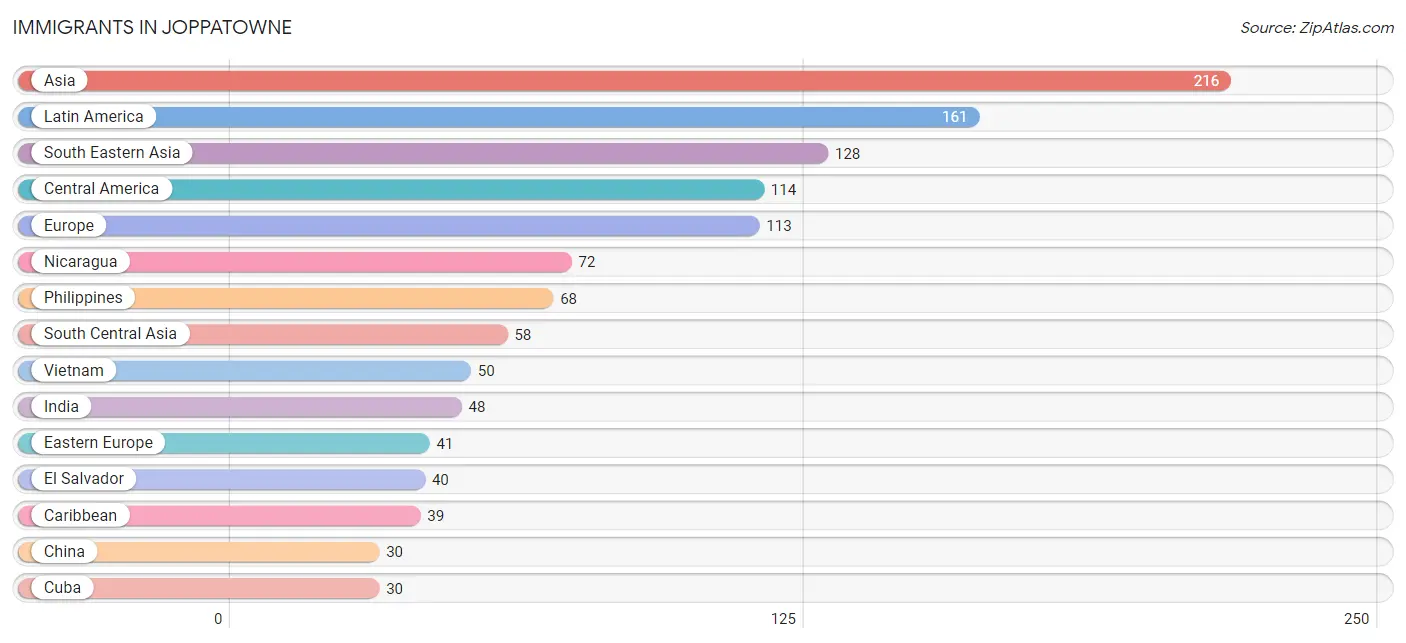
Immigrants in Joppatowne
The most numerous immigrant groups reported in Joppatowne came from Asia (216 | 1.6%), Latin America (161 | 1.2%), South Eastern Asia (128 | 1.0%), Central America (114 | 0.9%), and Europe (113 | 0.8%), together accounting for 5.5% of all Joppatowne residents.
| Immigration Origin | # Population | % Population |
| Africa | 28 | 0.2% |
| Asia | 216 | 1.6% |
| Belize | 2 | 0.0% |
| Caribbean | 39 | 0.3% |
| Central America | 114 | 0.9% |
| China | 30 | 0.2% |
| Colombia | 8 | 0.1% |
| Cuba | 30 | 0.2% |
| Czechoslovakia | 8 | 0.1% |
| Eastern Asia | 30 | 0.2% |
| Eastern Europe | 41 | 0.3% |
| El Salvador | 40 | 0.3% |
| England | 12 | 0.1% |
| Europe | 113 | 0.8% |
| Germany | 29 | 0.2% |
| Ghana | 28 | 0.2% |
| Greece | 16 | 0.1% |
| India | 48 | 0.4% |
| Latin America | 161 | 1.2% |
| Nepal | 10 | 0.1% |
| Nicaragua | 72 | 0.5% |
| Northern Europe | 27 | 0.2% |
| Philippines | 68 | 0.5% |
| Poland | 11 | 0.1% |
| Russia | 22 | 0.2% |
| South America | 8 | 0.1% |
| South Central Asia | 58 | 0.4% |
| South Eastern Asia | 128 | 1.0% |
| Southern Europe | 16 | 0.1% |
| Taiwan | 30 | 0.2% |
| Thailand | 10 | 0.1% |
| Trinidad and Tobago | 9 | 0.1% |
| Vietnam | 50 | 0.4% |
| Western Africa | 28 | 0.2% |
| Western Europe | 29 | 0.2% | View All 35 Rows |
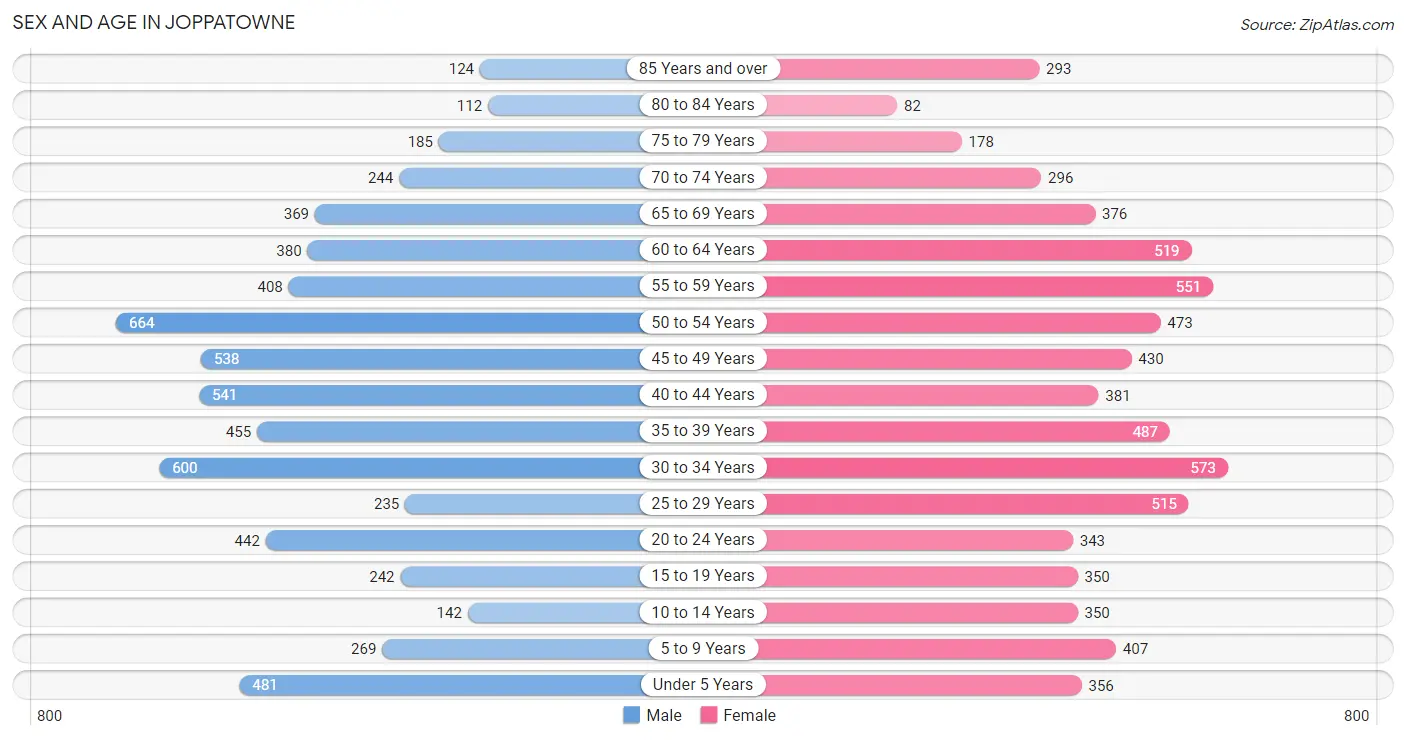
Sex and Age in Joppatowne
Sex and Age in Joppatowne
The most populous age groups in Joppatowne are 50 to 54 Years (664 | 10.3%) for men and 30 to 34 Years (573 | 8.2%) for women.
| Age Bracket | Male | Female |
| Under 5 Years | 481 (7.5%) | 356 (5.1%) |
| 5 to 9 Years | 269 (4.2%) | 407 (5.9%) |
| 10 to 14 Years | 142 (2.2%) | 350 (5.0%) |
| 15 to 19 Years | 242 (3.8%) | 350 (5.0%) |
| 20 to 24 Years | 442 (6.9%) | 343 (4.9%) |
| 25 to 29 Years | 235 (3.6%) | 515 (7.4%) |
| 30 to 34 Years | 600 (9.3%) | 573 (8.2%) |
| 35 to 39 Years | 455 (7.1%) | 487 (7.0%) |
| 40 to 44 Years | 541 (8.4%) | 381 (5.5%) |
| 45 to 49 Years | 538 (8.4%) | 430 (6.2%) |
| 50 to 54 Years | 664 (10.3%) | 473 (6.8%) |
| 55 to 59 Years | 408 (6.3%) | 551 (7.9%) |
| 60 to 64 Years | 380 (5.9%) | 519 (7.5%) |
| 65 to 69 Years | 369 (5.7%) | 376 (5.4%) |
| 70 to 74 Years | 244 (3.8%) | 296 (4.3%) |
| 75 to 79 Years | 185 (2.9%) | 178 (2.6%) |
| 80 to 84 Years | 112 (1.7%) | 82 (1.2%) |
| 85 Years and over | 124 (1.9%) | 293 (4.2%) |
| Total | 6,431 (100.0%) | 6,960 (100.0%) |
Families and Households in Joppatowne
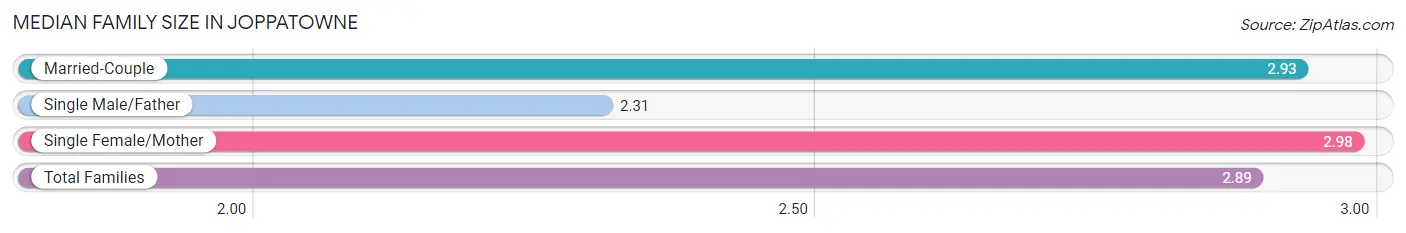
Median Family Size in Joppatowne
The median family size in Joppatowne is 2.89 persons per family, with single female/mother families (624 | 16.1%) accounting for the largest median family size of 2.98 persons per family. On the other hand, single male/father families (315 | 8.1%) represent the smallest median family size with 2.31 persons per family.
| Family Type | # Families | Family Size |
| Married-Couple | 2,934 (75.8%) | 2.93 |
| Single Male/Father | 315 (8.1%) | 2.31 |
| Single Female/Mother | 624 (16.1%) | 2.98 |
| Total Families | 3,873 (100.0%) | 2.89 |
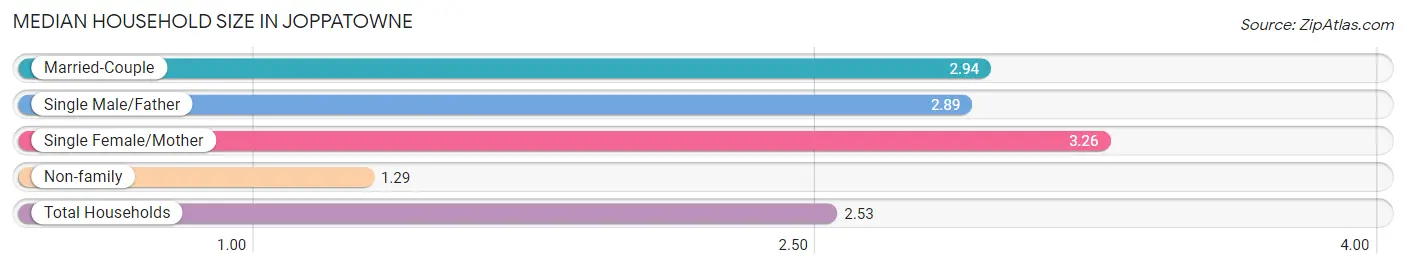
Median Household Size in Joppatowne
The median household size in Joppatowne is 2.53 persons per household, with single female/mother households (624 | 11.8%) accounting for the largest median household size of 3.26 persons per household. non-family households (1,413 | 26.7%) represent the smallest median household size with 1.29 persons per household.
| Household Type | # Households | Household Size |
| Married-Couple | 2,934 (55.5%) | 2.94 |
| Single Male/Father | 315 (6.0%) | 2.89 |
| Single Female/Mother | 624 (11.8%) | 3.26 |
| Non-family | 1,413 (26.7%) | 1.29 |
| Total Households | 5,286 (100.0%) | 2.53 |
Household Size by Marriage Status in Joppatowne
Out of a total of 5,286 households in Joppatowne, 3,873 (73.3%) are family households, while 1,413 (26.7%) are nonfamily households. The most numerous type of family households are 2-person households, comprising 1,980, and the most common type of nonfamily households are 1-person households, comprising 1,090.
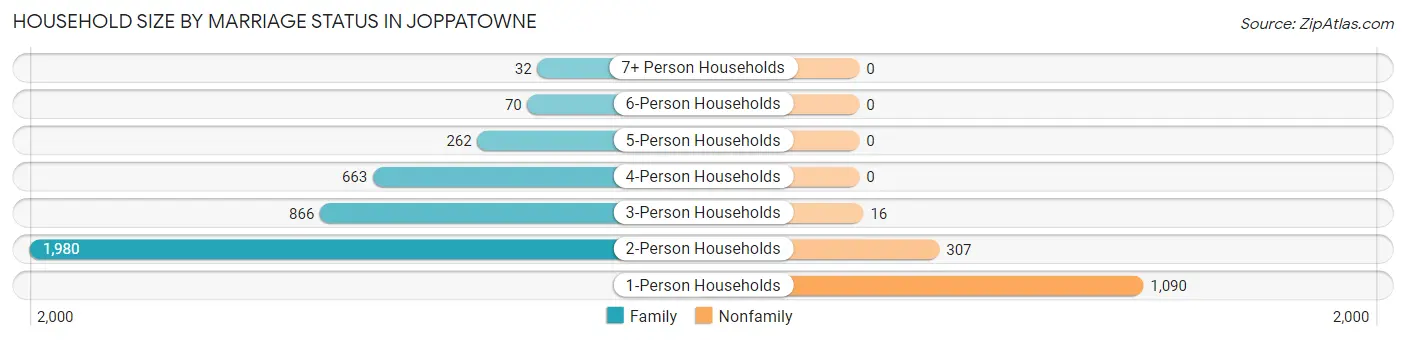
| Household Size | Family Households | Nonfamily Households |
| 1-Person Households | - | 1,090 (20.6%) |
| 2-Person Households | 1,980 (37.5%) | 307 (5.8%) |
| 3-Person Households | 866 (16.4%) | 16 (0.3%) |
| 4-Person Households | 663 (12.5%) | 0 (0.0%) |
| 5-Person Households | 262 (5.0%) | 0 (0.0%) |
| 6-Person Households | 70 (1.3%) | 0 (0.0%) |
| 7+ Person Households | 32 (0.6%) | 0 (0.0%) |
| Total | 3,873 (73.3%) | 1,413 (26.7%) |
Female Fertility in Joppatowne
Fertility by Age in Joppatowne
Average fertility rate in Joppatowne is 48.0 births per 1,000 women. Women in the age bracket of 20 to 34 years have the highest fertility rate with 80.0 births per 1,000 women. Women in the age bracket of 20 to 34 years acount for 73.3% of all women with births.
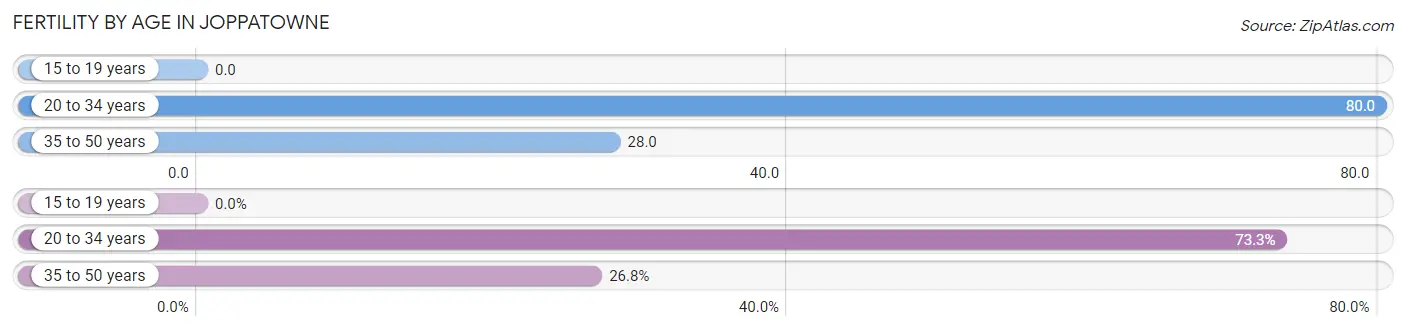
| Age Bracket | Women with Births | Births / 1,000 Women |
| 15 to 19 years | 0 (0.0%) | 0.0 |
| 20 to 34 years | 115 (73.3%) | 80.0 |
| 35 to 50 years | 42 (26.8%) | 28.0 |
| Total | 157 (100.0%) | 48.0 |
Fertility by Age by Marriage Status in Joppatowne
50.3% of women with births (157) in Joppatowne are married. The highest percentage of unmarried women with births falls into 20 to 34 years age bracket with 67.8% of them unmarried at the time of birth, while the lowest percentage of unmarried women with births belong to 35 to 50 years age bracket with 0.0% of them unmarried.
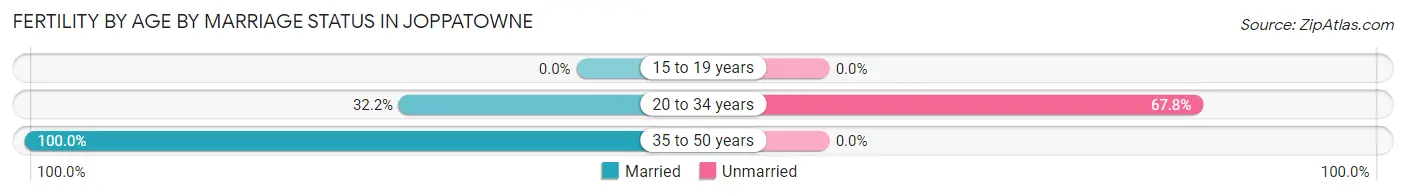
| Age Bracket | Married | Unmarried |
| 15 to 19 years | 0 (0.0%) | 0 (0.0%) |
| 20 to 34 years | 37 (32.2%) | 78 (67.8%) |
| 35 to 50 years | 42 (100.0%) | 0 (0.0%) |
| Total | 79 (50.3%) | 78 (49.7%) |
Fertility by Education in Joppatowne
Average fertility rate in Joppatowne is 48.0 births per 1,000 women. Women with the education attainment of high school diploma have the highest fertility rate of 89.0 births per 1,000 women, while women with the education attainment of less than high school have the lowest fertility at 20.0 births per 1,000 women. Women with the education attainment of high school diploma represent 58.0% of all women with births.
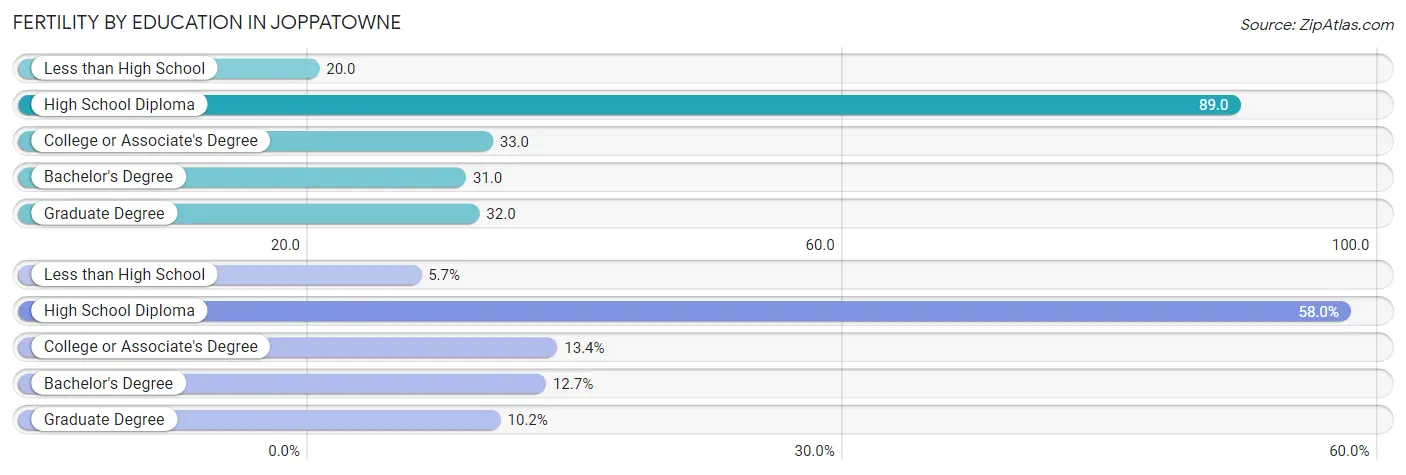
| Educational Attainment | Women with Births | Births / 1,000 Women |
| Less than High School | 9 (5.7%) | 20.0 |
| High School Diploma | 91 (58.0%) | 89.0 |
| College or Associate's Degree | 21 (13.4%) | 33.0 |
| Bachelor's Degree | 20 (12.7%) | 31.0 |
| Graduate Degree | 16 (10.2%) | 32.0 |
| Total | 157 (100.0%) | 48.0 |
Fertility by Education by Marriage Status in Joppatowne
49.7% of women with births in Joppatowne are unmarried. Women with the educational attainment of college or associate's degree are most likely to be married with 100.0% of them married at childbirth, while women with the educational attainment of less than high school are least likely to be married with 100.0% of them unmarried at childbirth.
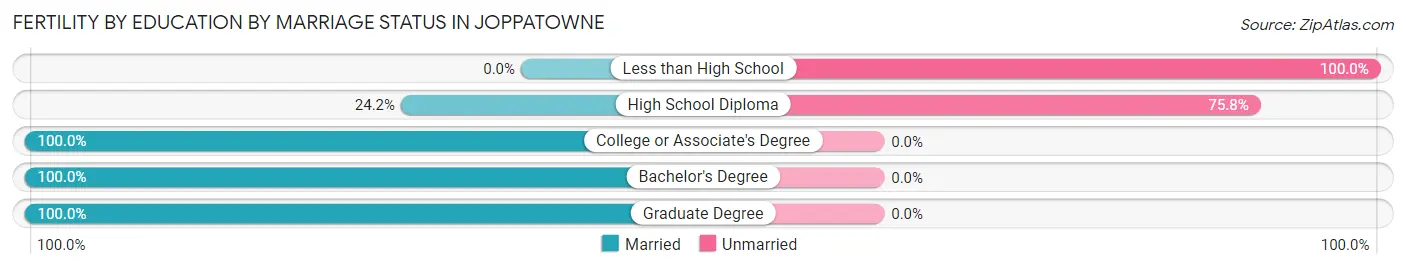
| Educational Attainment | Married | Unmarried |
| Less than High School | 0 (0.0%) | 9 (100.0%) |
| High School Diploma | 22 (24.2%) | 69 (75.8%) |
| College or Associate's Degree | 21 (100.0%) | 0 (0.0%) |
| Bachelor's Degree | 20 (100.0%) | 0 (0.0%) |
| Graduate Degree | 16 (100.0%) | 0 (0.0%) |
| Total | 79 (50.3%) | 78 (49.7%) |
Employment Characteristics in Joppatowne
Employment by Class of Employer in Joppatowne
Among the 7,310 employed individuals in Joppatowne, private company employees (4,906 | 67.1%), federal government employees (706 | 9.7%), and not-for-profit organizations (565 | 7.7%) make up the most common classes of employment.
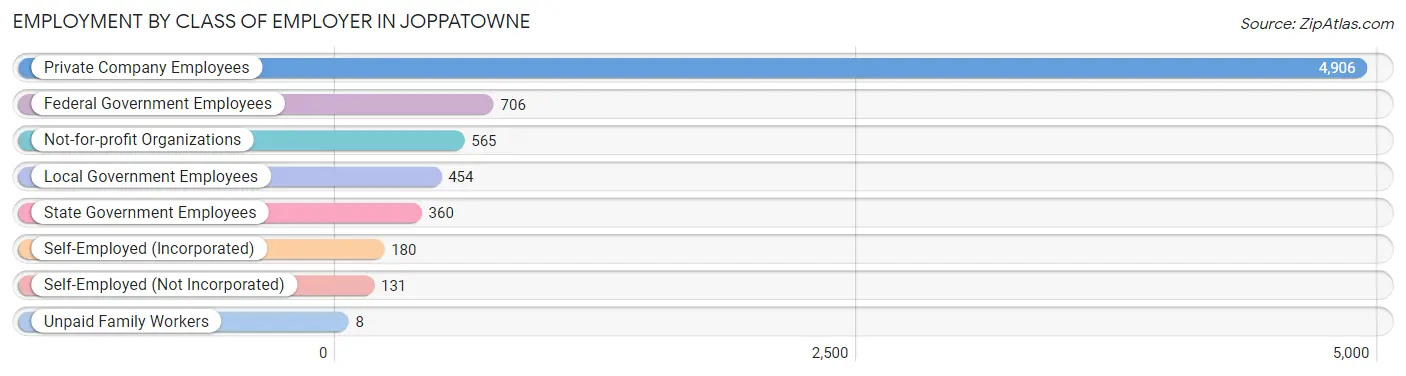
| Employer Class | # Employees | % Employees |
| Private Company Employees | 4,906 | 67.1% |
| Self-Employed (Incorporated) | 180 | 2.5% |
| Self-Employed (Not Incorporated) | 131 | 1.8% |
| Not-for-profit Organizations | 565 | 7.7% |
| Local Government Employees | 454 | 6.2% |
| State Government Employees | 360 | 4.9% |
| Federal Government Employees | 706 | 9.7% |
| Unpaid Family Workers | 8 | 0.1% |
| Total | 7,310 | 100.0% |
Employment Status by Age in Joppatowne
According to the labor force statistics for Joppatowne, out of the total population over 16 years of age (11,208), 70.6% or 7,913 individuals are in the labor force, with 5.1% or 404 of them unemployed. The age group with the highest labor force participation rate is 25 to 29 years, with 94.5% or 709 individuals in the labor force. Within the labor force, the 30 to 34 years age range has the highest percentage of unemployed individuals, with 10.1% or 105 of them being unemployed.
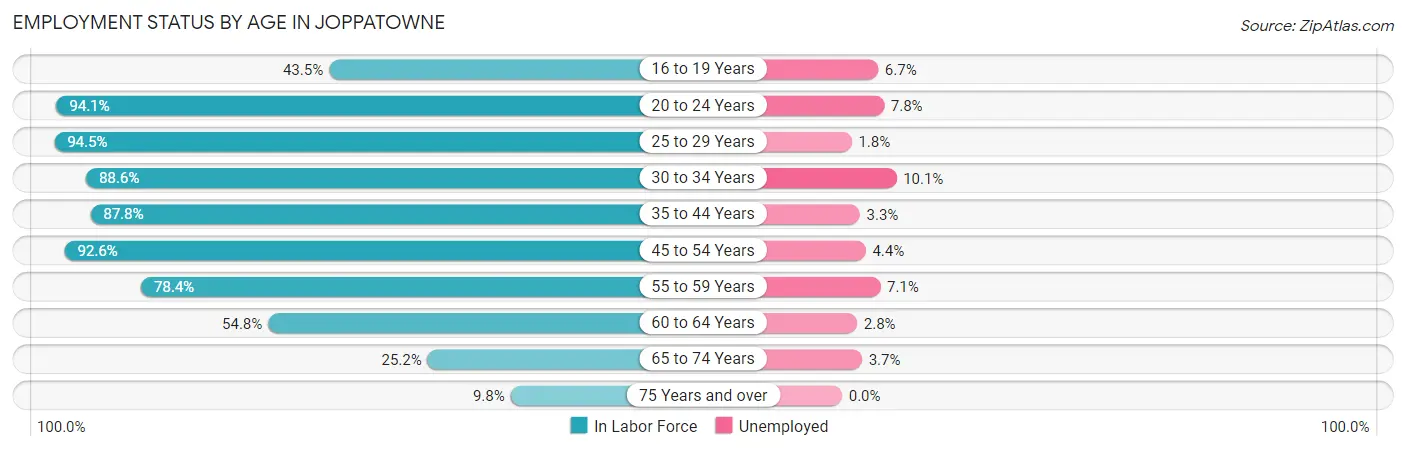
| Age Bracket | In Labor Force | Unemployed |
| 16 to 19 Years | 180 (43.5%) | 12 (6.7%) |
| 20 to 24 Years | 739 (94.1%) | 58 (7.8%) |
| 25 to 29 Years | 709 (94.5%) | 13 (1.8%) |
| 30 to 34 Years | 1,039 (88.6%) | 105 (10.1%) |
| 35 to 44 Years | 1,637 (87.8%) | 54 (3.3%) |
| 45 to 54 Years | 1,949 (92.6%) | 86 (4.4%) |
| 55 to 59 Years | 752 (78.4%) | 53 (7.1%) |
| 60 to 64 Years | 493 (54.8%) | 14 (2.8%) |
| 65 to 74 Years | 324 (25.2%) | 12 (3.7%) |
| 75 Years and over | 95 (9.8%) | 0 (0.0%) |
| Total | 7,913 (70.6%) | 404 (5.1%) |
Employment Status by Educational Attainment in Joppatowne
According to labor force statistics for Joppatowne, 84.9% of individuals (6,580) out of the total population between 25 and 64 years of age (7,750) are in the labor force, with 4.9% or 322 of them being unemployed. The group with the highest labor force participation rate are those with the educational attainment of less than high school, with 92.6% or 361 individuals in the labor force. Within the labor force, individuals with less than high school education have the highest percentage of unemployment, with 13.6% or 49 of them being unemployed.
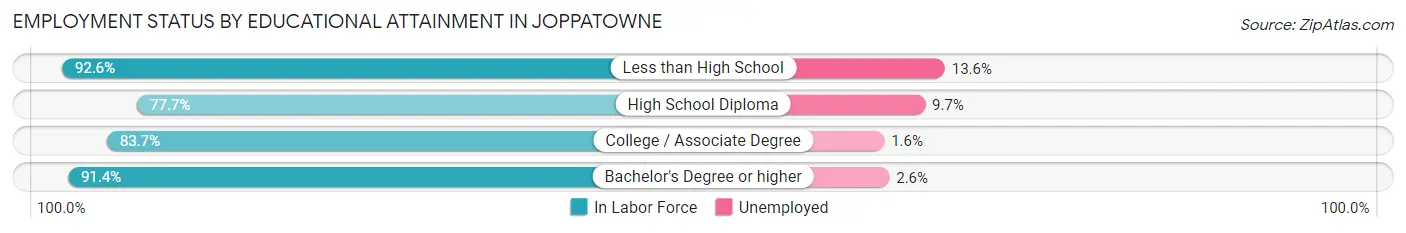
| Educational Attainment | In Labor Force | Unemployed |
| Less than High School | 361 (92.6%) | 53 (13.6%) |
| High School Diploma | 1,869 (77.7%) | 233 (9.7%) |
| College / Associate Degree | 1,938 (83.7%) | 37 (1.6%) |
| Bachelor's Degree or higher | 2,411 (91.4%) | 69 (2.6%) |
| Total | 6,580 (84.9%) | 380 (4.9%) |
Employment Occupations by Sex in Joppatowne
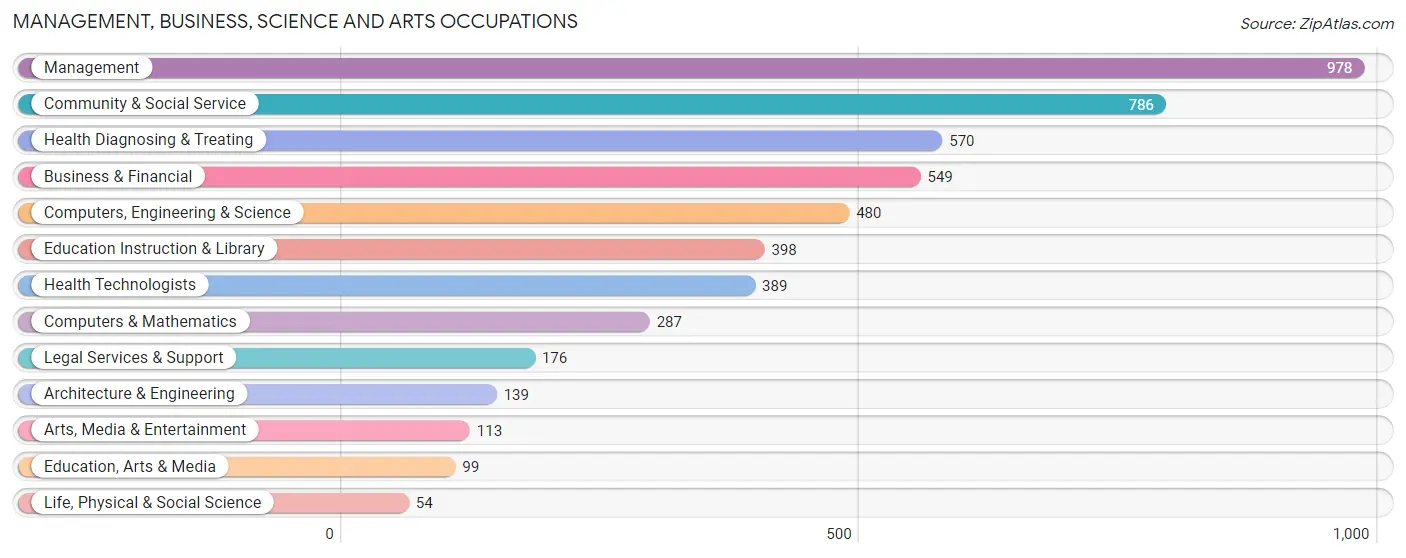
Management, Business, Science and Arts Occupations
The most common Management, Business, Science and Arts occupations in Joppatowne are Management (978 | 13.1%), Community & Social Service (786 | 10.5%), Health Diagnosing & Treating (570 | 7.6%), Business & Financial (549 | 7.4%), and Computers, Engineering & Science (480 | 6.4%).
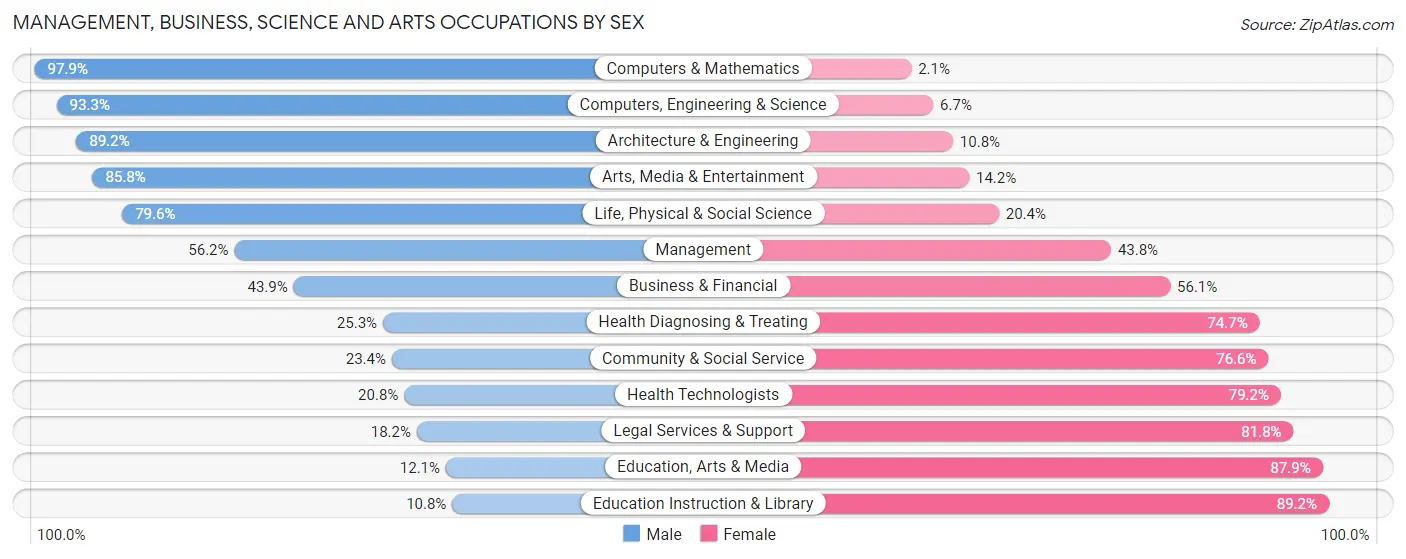
Management, Business, Science and Arts Occupations by Sex
Within the Management, Business, Science and Arts occupations in Joppatowne, the most male-oriented occupations are Computers & Mathematics (97.9%), Computers, Engineering & Science (93.3%), and Architecture & Engineering (89.2%), while the most female-oriented occupations are Education Instruction & Library (89.2%), Education, Arts & Media (87.9%), and Legal Services & Support (81.8%).
| Occupation | Male | Female |
| Management | 550 (56.2%) | 428 (43.8%) |
| Business & Financial | 241 (43.9%) | 308 (56.1%) |
| Computers, Engineering & Science | 448 (93.3%) | 32 (6.7%) |
| Computers & Mathematics | 281 (97.9%) | 6 (2.1%) |
| Architecture & Engineering | 124 (89.2%) | 15 (10.8%) |
| Life, Physical & Social Science | 43 (79.6%) | 11 (20.4%) |
| Community & Social Service | 184 (23.4%) | 602 (76.6%) |
| Education, Arts & Media | 12 (12.1%) | 87 (87.9%) |
| Legal Services & Support | 32 (18.2%) | 144 (81.8%) |
| Education Instruction & Library | 43 (10.8%) | 355 (89.2%) |
| Arts, Media & Entertainment | 97 (85.8%) | 16 (14.2%) |
| Health Diagnosing & Treating | 144 (25.3%) | 426 (74.7%) |
| Health Technologists | 81 (20.8%) | 308 (79.2%) |
| Total (Category) | 1,567 (46.6%) | 1,796 (53.4%) |
| Total (Overall) | 3,965 (53.2%) | 3,490 (46.8%) |
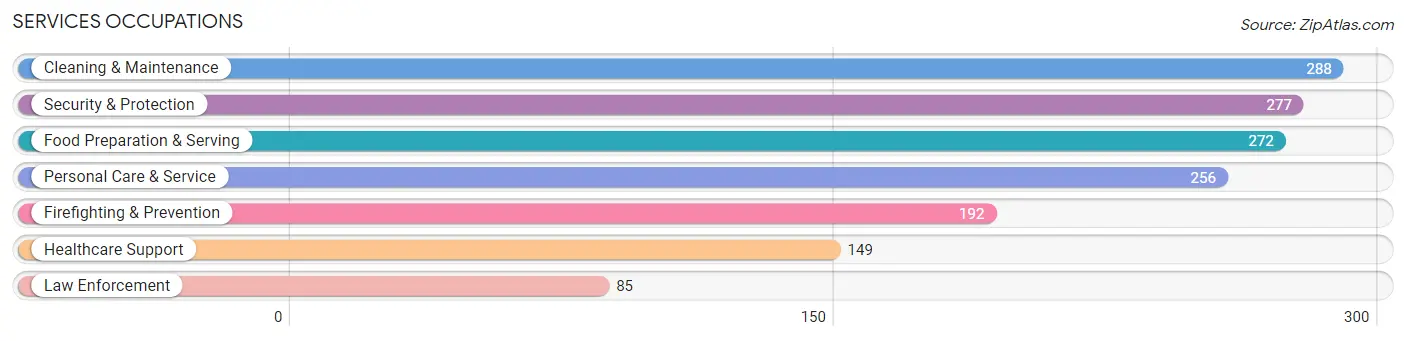
Services Occupations
The most common Services occupations in Joppatowne are Cleaning & Maintenance (288 | 3.9%), Security & Protection (277 | 3.7%), Food Preparation & Serving (272 | 3.6%), Personal Care & Service (256 | 3.4%), and Firefighting & Prevention (192 | 2.6%).
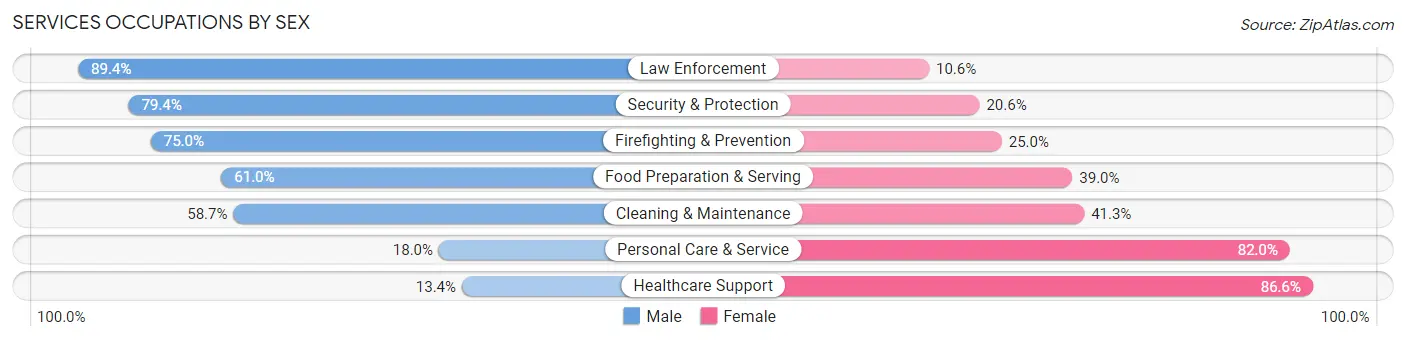
Services Occupations by Sex
Within the Services occupations in Joppatowne, the most male-oriented occupations are Law Enforcement (89.4%), Security & Protection (79.4%), and Firefighting & Prevention (75.0%), while the most female-oriented occupations are Healthcare Support (86.6%), Personal Care & Service (82.0%), and Cleaning & Maintenance (41.3%).
| Occupation | Male | Female |
| Healthcare Support | 20 (13.4%) | 129 (86.6%) |
| Security & Protection | 220 (79.4%) | 57 (20.6%) |
| Firefighting & Prevention | 144 (75.0%) | 48 (25.0%) |
| Law Enforcement | 76 (89.4%) | 9 (10.6%) |
| Food Preparation & Serving | 166 (61.0%) | 106 (39.0%) |
| Cleaning & Maintenance | 169 (58.7%) | 119 (41.3%) |
| Personal Care & Service | 46 (18.0%) | 210 (82.0%) |
| Total (Category) | 621 (50.0%) | 621 (50.0%) |
| Total (Overall) | 3,965 (53.2%) | 3,490 (46.8%) |
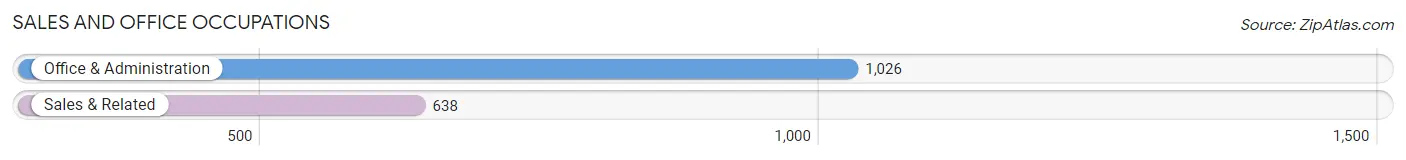
Sales and Office Occupations
The most common Sales and Office occupations in Joppatowne are Office & Administration (1,026 | 13.8%), and Sales & Related (638 | 8.6%).
Sales and Office Occupations by Sex
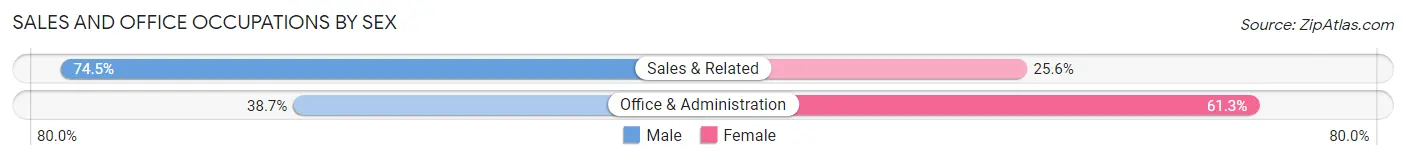
| Occupation | Male | Female |
| Sales & Related | 475 (74.5%) | 163 (25.6%) |
| Office & Administration | 397 (38.7%) | 629 (61.3%) |
| Total (Category) | 872 (52.4%) | 792 (47.6%) |
| Total (Overall) | 3,965 (53.2%) | 3,490 (46.8%) |
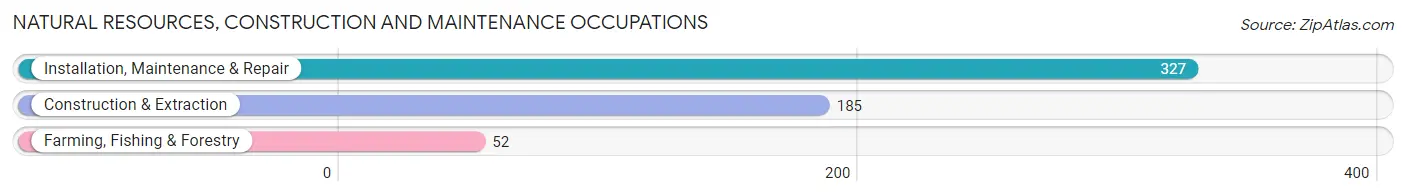
Natural Resources, Construction and Maintenance Occupations
The most common Natural Resources, Construction and Maintenance occupations in Joppatowne are Installation, Maintenance & Repair (327 | 4.4%), Construction & Extraction (185 | 2.5%), and Farming, Fishing & Forestry (52 | 0.7%).
Natural Resources, Construction and Maintenance Occupations by Sex
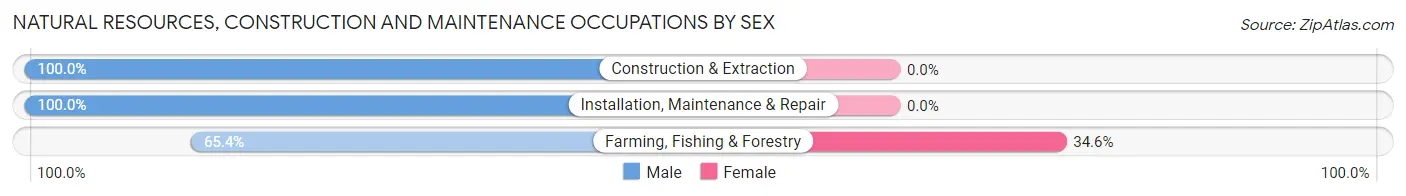
| Occupation | Male | Female |
| Farming, Fishing & Forestry | 34 (65.4%) | 18 (34.6%) |
| Construction & Extraction | 185 (100.0%) | 0 (0.0%) |
| Installation, Maintenance & Repair | 327 (100.0%) | 0 (0.0%) |
| Total (Category) | 546 (96.8%) | 18 (3.2%) |
| Total (Overall) | 3,965 (53.2%) | 3,490 (46.8%) |
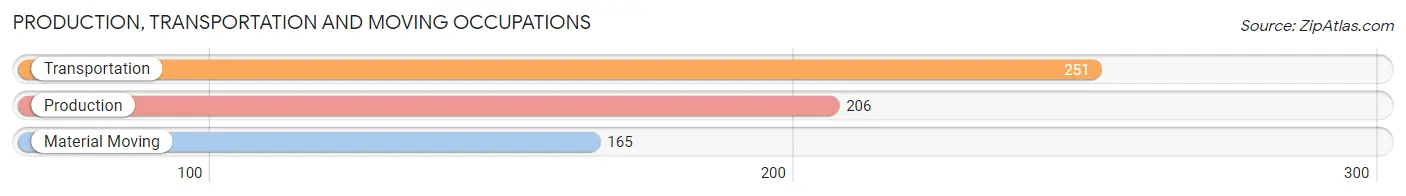
Production, Transportation and Moving Occupations
The most common Production, Transportation and Moving occupations in Joppatowne are Transportation (251 | 3.4%), Production (206 | 2.8%), and Material Moving (165 | 2.2%).
Production, Transportation and Moving Occupations by Sex
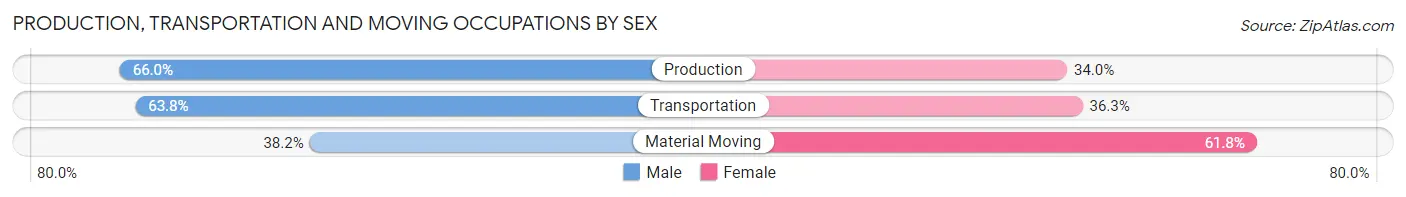
| Occupation | Male | Female |
| Production | 136 (66.0%) | 70 (34.0%) |
| Transportation | 160 (63.7%) | 91 (36.2%) |
| Material Moving | 63 (38.2%) | 102 (61.8%) |
| Total (Category) | 359 (57.7%) | 263 (42.3%) |
| Total (Overall) | 3,965 (53.2%) | 3,490 (46.8%) |
Employment Industries by Sex in Joppatowne
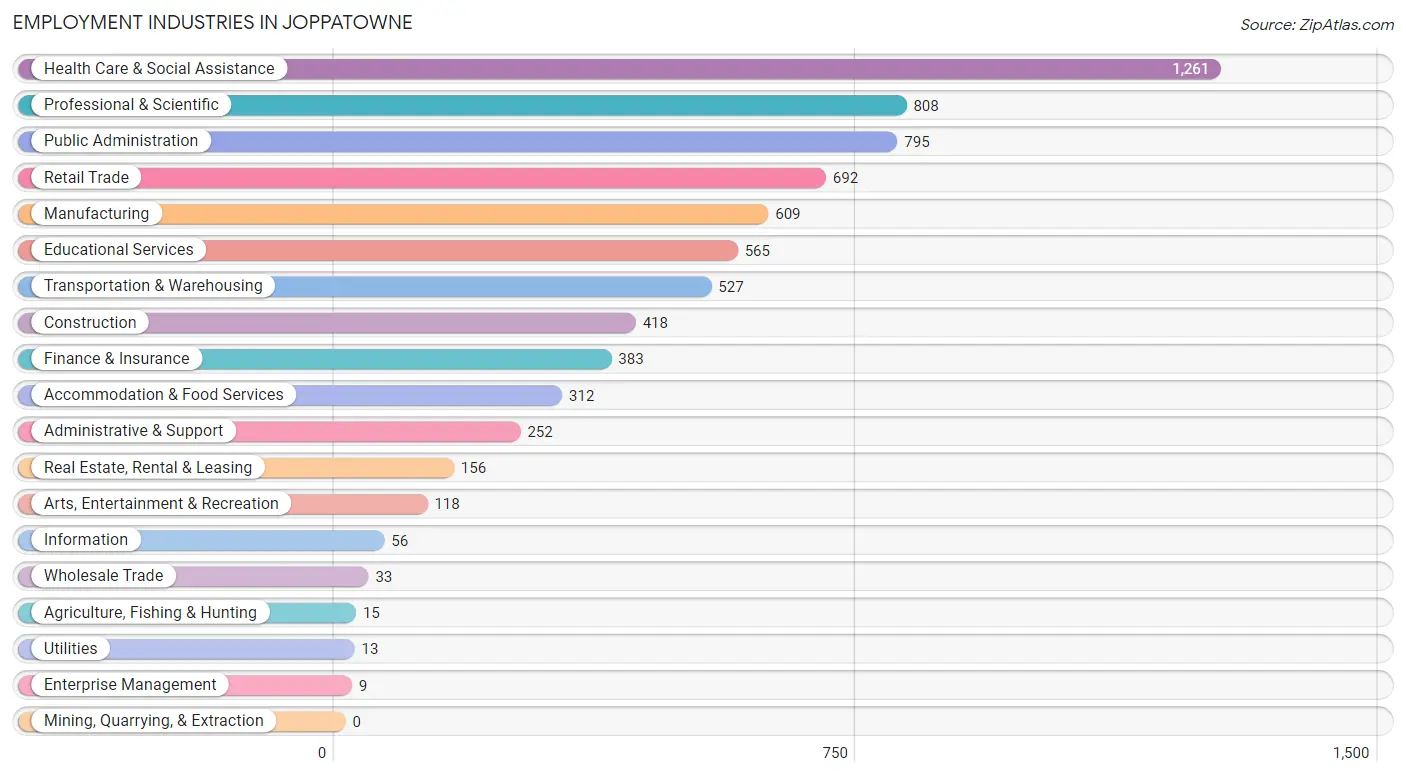
Employment Industries in Joppatowne
The major employment industries in Joppatowne include Health Care & Social Assistance (1,261 | 16.9%), Professional & Scientific (808 | 10.8%), Public Administration (795 | 10.7%), Retail Trade (692 | 9.3%), and Manufacturing (609 | 8.2%).
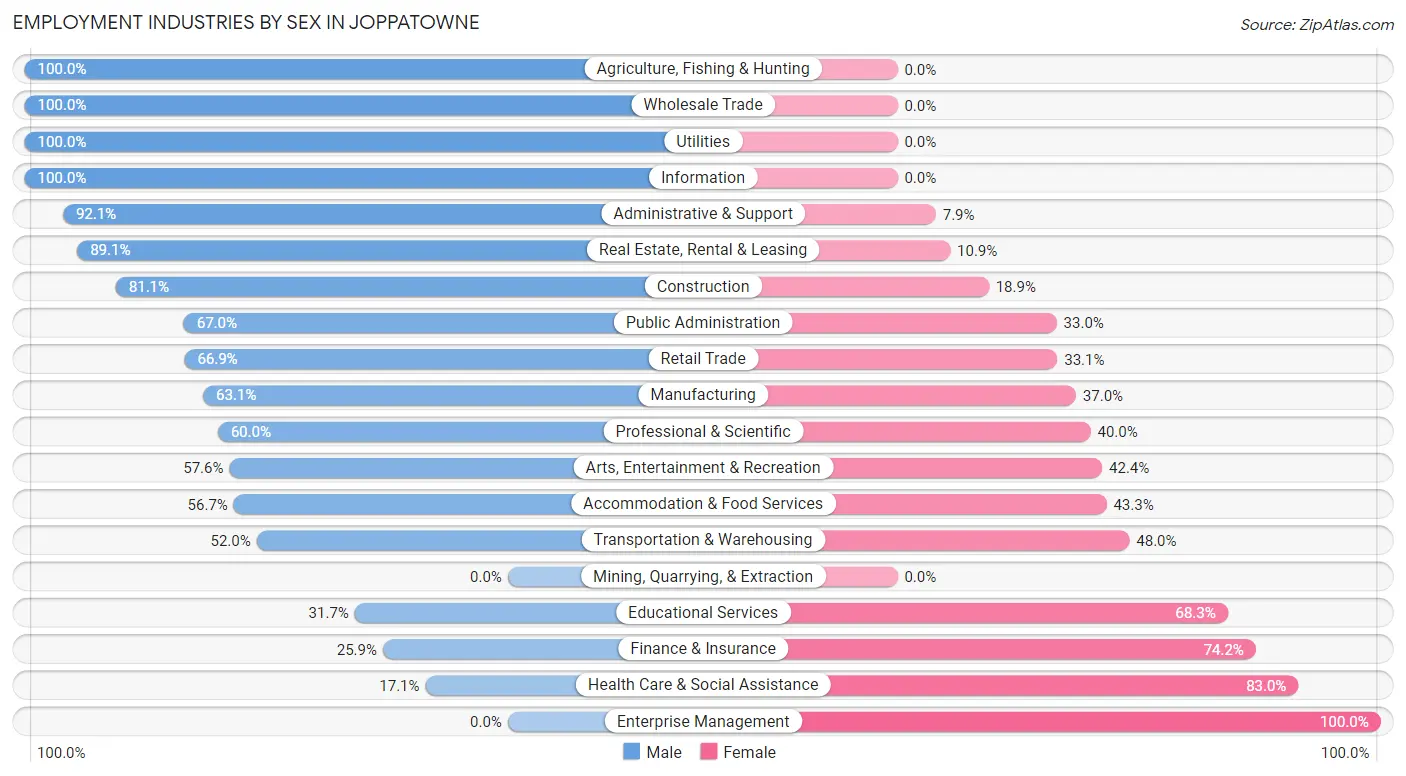
Employment Industries by Sex in Joppatowne
The Joppatowne industries that see more men than women are Agriculture, Fishing & Hunting (100.0%), Wholesale Trade (100.0%), and Utilities (100.0%), whereas the industries that tend to have a higher number of women are Enterprise Management (100.0%), Health Care & Social Assistance (83.0%), and Finance & Insurance (74.2%).
| Industry | Male | Female |
| Agriculture, Fishing & Hunting | 15 (100.0%) | 0 (0.0%) |
| Mining, Quarrying, & Extraction | 0 (0.0%) | 0 (0.0%) |
| Construction | 339 (81.1%) | 79 (18.9%) |
| Manufacturing | 384 (63.0%) | 225 (36.9%) |
| Wholesale Trade | 33 (100.0%) | 0 (0.0%) |
| Retail Trade | 463 (66.9%) | 229 (33.1%) |
| Transportation & Warehousing | 274 (52.0%) | 253 (48.0%) |
| Utilities | 13 (100.0%) | 0 (0.0%) |
| Information | 56 (100.0%) | 0 (0.0%) |
| Finance & Insurance | 99 (25.9%) | 284 (74.2%) |
| Real Estate, Rental & Leasing | 139 (89.1%) | 17 (10.9%) |
| Professional & Scientific | 485 (60.0%) | 323 (40.0%) |
| Enterprise Management | 0 (0.0%) | 9 (100.0%) |
| Administrative & Support | 232 (92.1%) | 20 (7.9%) |
| Educational Services | 179 (31.7%) | 386 (68.3%) |
| Health Care & Social Assistance | 215 (17.1%) | 1,046 (83.0%) |
| Arts, Entertainment & Recreation | 68 (57.6%) | 50 (42.4%) |
| Accommodation & Food Services | 177 (56.7%) | 135 (43.3%) |
| Public Administration | 533 (67.0%) | 262 (33.0%) |
| Total | 3,965 (53.2%) | 3,490 (46.8%) |
Education in Joppatowne
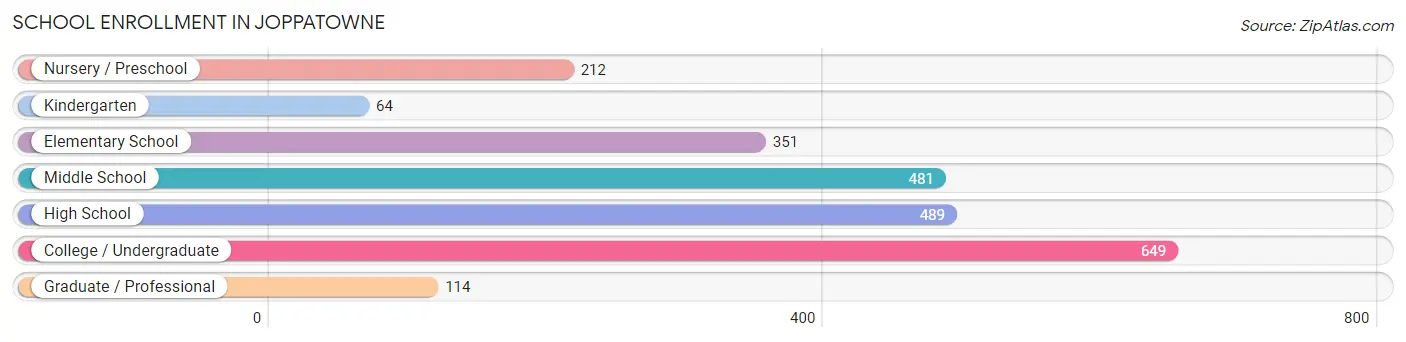
School Enrollment in Joppatowne
The most common levels of schooling among the 2,360 students in Joppatowne are college / undergraduate (649 | 27.5%), high school (489 | 20.7%), and middle school (481 | 20.4%).
| School Level | # Students | % Students |
| Nursery / Preschool | 212 | 9.0% |
| Kindergarten | 64 | 2.7% |
| Elementary School | 351 | 14.9% |
| Middle School | 481 | 20.4% |
| High School | 489 | 20.7% |
| College / Undergraduate | 649 | 27.5% |
| Graduate / Professional | 114 | 4.8% |
| Total | 2,360 | 100.0% |
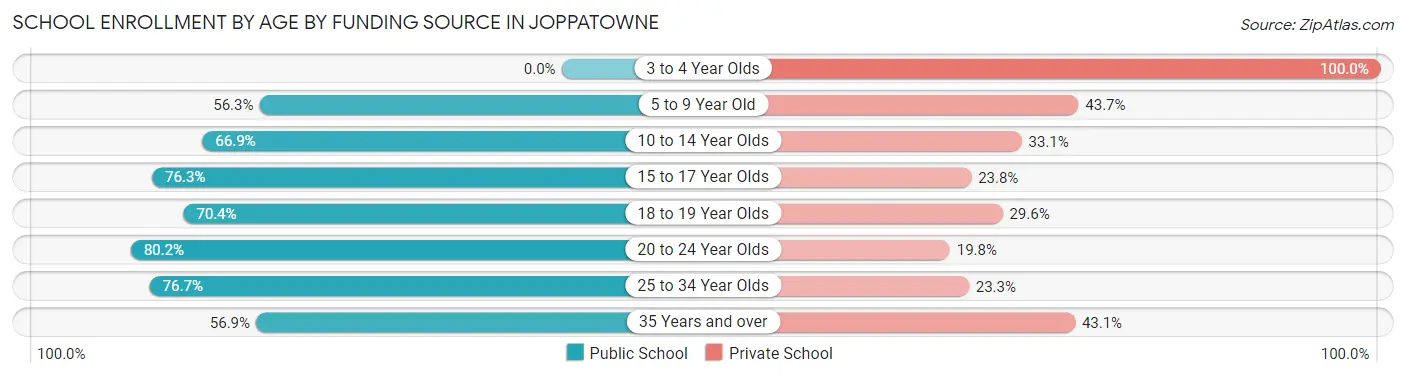
School Enrollment by Age by Funding Source in Joppatowne
Out of a total of 2,360 students who are enrolled in schools in Joppatowne, 812 (34.4%) attend a private institution, while the remaining 1,548 (65.6%) are enrolled in public schools. The age group of 3 to 4 year olds has the highest likelihood of being enrolled in private schools, with 55 (100.0% in the age bracket) enrolled. Conversely, the age group of 20 to 24 year olds has the lowest likelihood of being enrolled in a private school, with 207 (80.2% in the age bracket) attending a public institution.
| Age Bracket | Public School | Private School |
| 3 to 4 Year Olds | 0 (0.0%) | 55 (100.0%) |
| 5 to 9 Year Old | 322 (56.3%) | 250 (43.7%) |
| 10 to 14 Year Olds | 329 (66.9%) | 163 (33.1%) |
| 15 to 17 Year Olds | 260 (76.2%) | 81 (23.7%) |
| 18 to 19 Year Olds | 150 (70.4%) | 63 (29.6%) |
| 20 to 24 Year Olds | 207 (80.2%) | 51 (19.8%) |
| 25 to 34 Year Olds | 135 (76.7%) | 41 (23.3%) |
| 35 Years and over | 144 (56.9%) | 109 (43.1%) |
| Total | 1,548 (65.6%) | 812 (34.4%) |
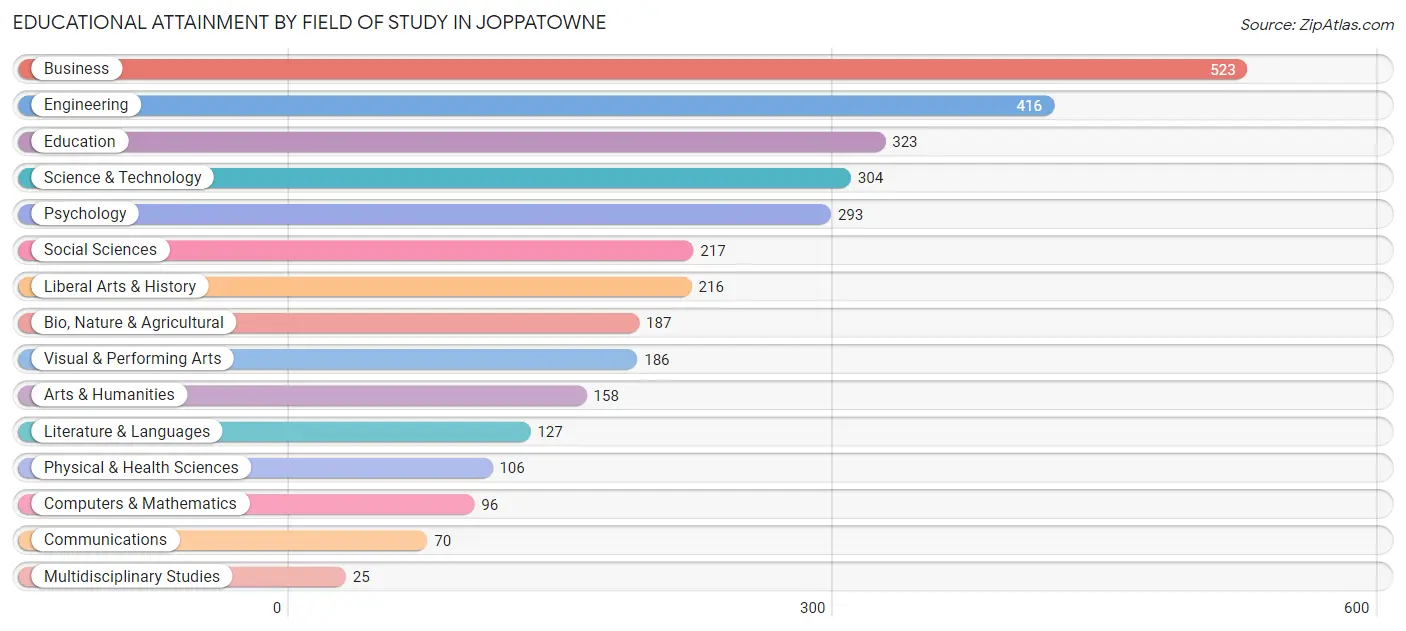
Educational Attainment by Field of Study in Joppatowne
Business (523 | 16.1%), engineering (416 | 12.8%), education (323 | 10.0%), science & technology (304 | 9.4%), and psychology (293 | 9.0%) are the most common fields of study among 3,247 individuals in Joppatowne who have obtained a bachelor's degree or higher.
| Field of Study | # Graduates | % Graduates |
| Computers & Mathematics | 96 | 3.0% |
| Bio, Nature & Agricultural | 187 | 5.8% |
| Physical & Health Sciences | 106 | 3.3% |
| Psychology | 293 | 9.0% |
| Social Sciences | 217 | 6.7% |
| Engineering | 416 | 12.8% |
| Multidisciplinary Studies | 25 | 0.8% |
| Science & Technology | 304 | 9.4% |
| Business | 523 | 16.1% |
| Education | 323 | 10.0% |
| Literature & Languages | 127 | 3.9% |
| Liberal Arts & History | 216 | 6.7% |
| Visual & Performing Arts | 186 | 5.7% |
| Communications | 70 | 2.2% |
| Arts & Humanities | 158 | 4.9% |
| Total | 3,247 | 100.0% |
Transportation & Commute in Joppatowne
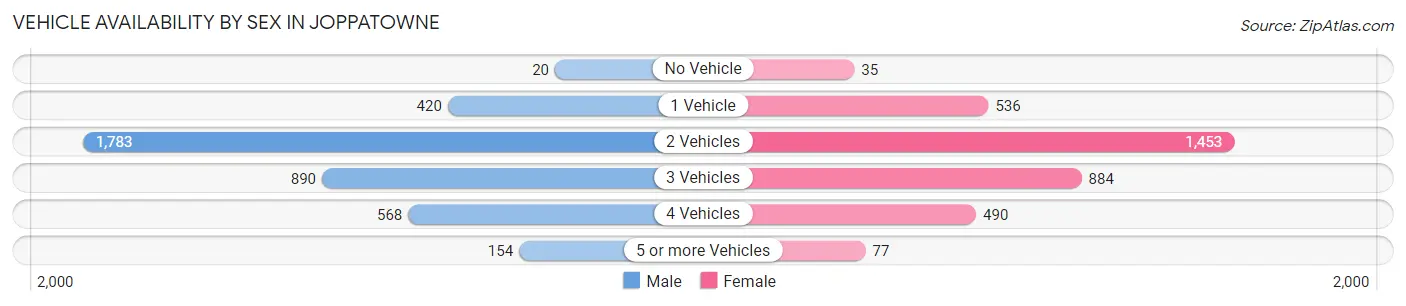
Vehicle Availability by Sex in Joppatowne
The most prevalent vehicle ownership categories in Joppatowne are males with 2 vehicles (1,783, accounting for 46.5%) and females with 2 vehicles (1,453, making up 51.3%).
| Vehicles Available | Male | Female |
| No Vehicle | 20 (0.5%) | 35 (1.0%) |
| 1 Vehicle | 420 (11.0%) | 536 (15.4%) |
| 2 Vehicles | 1,783 (46.5%) | 1,453 (41.8%) |
| 3 Vehicles | 890 (23.2%) | 884 (25.4%) |
| 4 Vehicles | 568 (14.8%) | 490 (14.1%) |
| 5 or more Vehicles | 154 (4.0%) | 77 (2.2%) |
| Total | 3,835 (100.0%) | 3,475 (100.0%) |
Commute Time in Joppatowne
The most frequently occuring commute durations in Joppatowne are 30 to 34 minutes (1,179 commuters, 17.5%), 45 to 59 minutes (1,037 commuters, 15.4%), and 20 to 24 minutes (1,028 commuters, 15.3%).
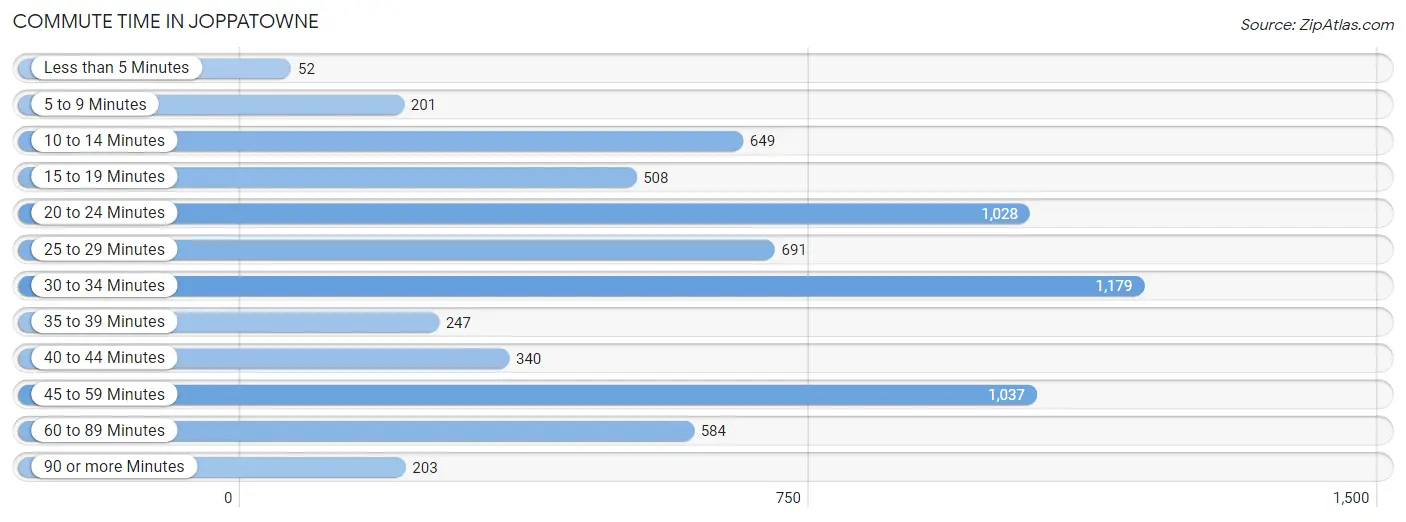
| Commute Time | # Commuters | % Commuters |
| Less than 5 Minutes | 52 | 0.8% |
| 5 to 9 Minutes | 201 | 3.0% |
| 10 to 14 Minutes | 649 | 9.7% |
| 15 to 19 Minutes | 508 | 7.6% |
| 20 to 24 Minutes | 1,028 | 15.3% |
| 25 to 29 Minutes | 691 | 10.3% |
| 30 to 34 Minutes | 1,179 | 17.5% |
| 35 to 39 Minutes | 247 | 3.7% |
| 40 to 44 Minutes | 340 | 5.1% |
| 45 to 59 Minutes | 1,037 | 15.4% |
| 60 to 89 Minutes | 584 | 8.7% |
| 90 or more Minutes | 203 | 3.0% |
Commute Time by Sex in Joppatowne
The most common commute times in Joppatowne are 45 to 59 minutes (716 commuters, 20.1%) for males and 20 to 24 minutes (595 commuters, 18.8%) for females.
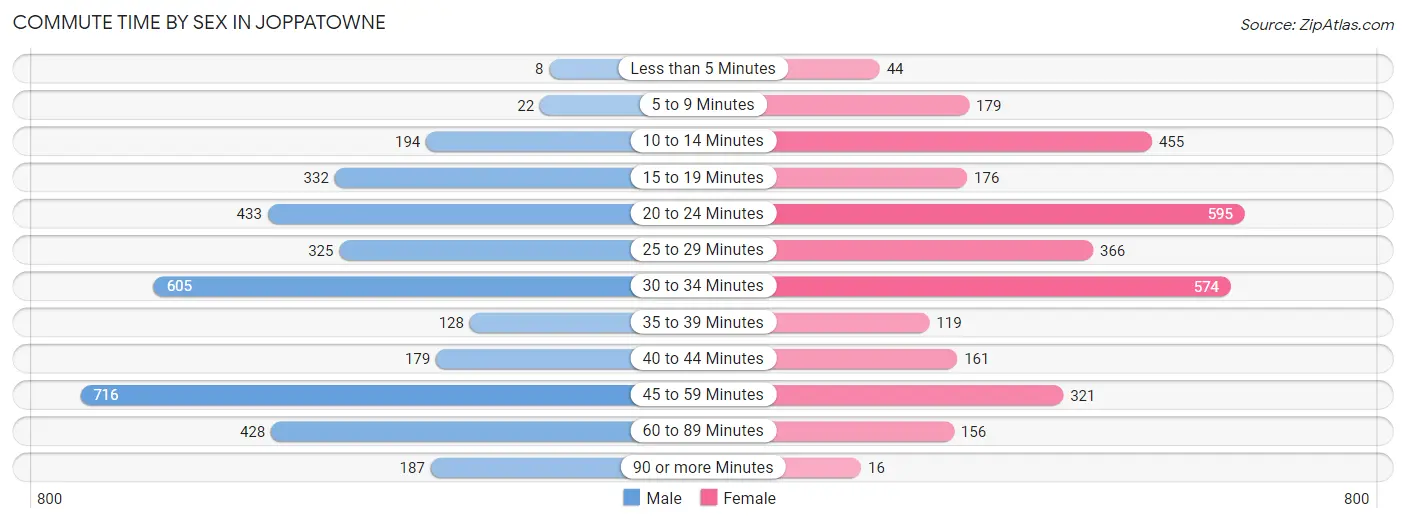
| Commute Time | Male | Female |
| Less than 5 Minutes | 8 (0.2%) | 44 (1.4%) |
| 5 to 9 Minutes | 22 (0.6%) | 179 (5.7%) |
| 10 to 14 Minutes | 194 (5.4%) | 455 (14.4%) |
| 15 to 19 Minutes | 332 (9.3%) | 176 (5.6%) |
| 20 to 24 Minutes | 433 (12.2%) | 595 (18.8%) |
| 25 to 29 Minutes | 325 (9.1%) | 366 (11.6%) |
| 30 to 34 Minutes | 605 (17.0%) | 574 (18.1%) |
| 35 to 39 Minutes | 128 (3.6%) | 119 (3.8%) |
| 40 to 44 Minutes | 179 (5.0%) | 161 (5.1%) |
| 45 to 59 Minutes | 716 (20.1%) | 321 (10.2%) |
| 60 to 89 Minutes | 428 (12.0%) | 156 (4.9%) |
| 90 or more Minutes | 187 (5.3%) | 16 (0.5%) |
Time of Departure to Work by Sex in Joppatowne
The most frequent times of departure to work in Joppatowne are 7:00 AM to 7:29 AM (549, 15.4%) for males and 7:30 AM to 7:59 AM (515, 16.3%) for females.
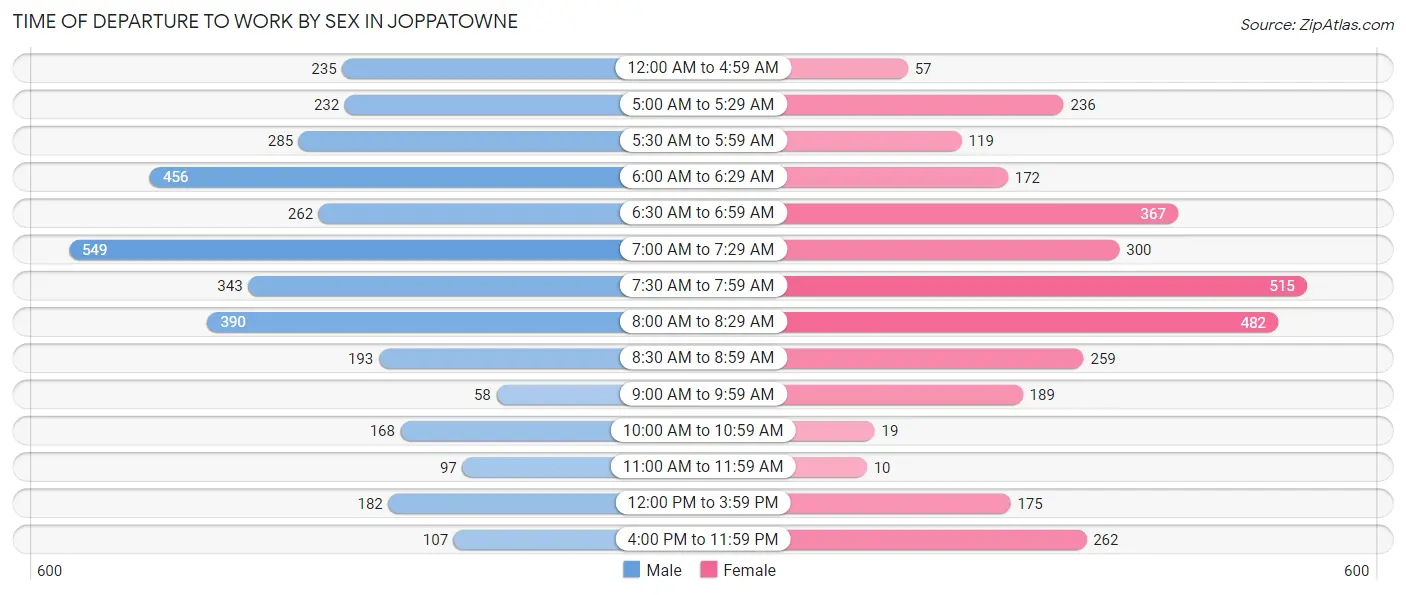
| Time of Departure | Male | Female |
| 12:00 AM to 4:59 AM | 235 (6.6%) | 57 (1.8%) |
| 5:00 AM to 5:29 AM | 232 (6.5%) | 236 (7.5%) |
| 5:30 AM to 5:59 AM | 285 (8.0%) | 119 (3.8%) |
| 6:00 AM to 6:29 AM | 456 (12.8%) | 172 (5.4%) |
| 6:30 AM to 6:59 AM | 262 (7.4%) | 367 (11.6%) |
| 7:00 AM to 7:29 AM | 549 (15.4%) | 300 (9.5%) |
| 7:30 AM to 7:59 AM | 343 (9.6%) | 515 (16.3%) |
| 8:00 AM to 8:29 AM | 390 (11.0%) | 482 (15.2%) |
| 8:30 AM to 8:59 AM | 193 (5.4%) | 259 (8.2%) |
| 9:00 AM to 9:59 AM | 58 (1.6%) | 189 (6.0%) |
| 10:00 AM to 10:59 AM | 168 (4.7%) | 19 (0.6%) |
| 11:00 AM to 11:59 AM | 97 (2.7%) | 10 (0.3%) |
| 12:00 PM to 3:59 PM | 182 (5.1%) | 175 (5.5%) |
| 4:00 PM to 11:59 PM | 107 (3.0%) | 262 (8.3%) |
| Total | 3,557 (100.0%) | 3,162 (100.0%) |
Housing Occupancy in Joppatowne
Occupancy by Ownership in Joppatowne
Of the total 5,286 dwellings in Joppatowne, owner-occupied units account for 4,107 (77.7%), while renter-occupied units make up 1,179 (22.3%).
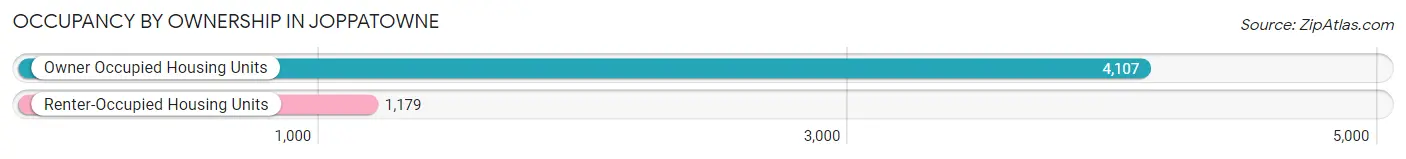
| Occupancy | # Housing Units | % Housing Units |
| Owner Occupied Housing Units | 4,107 | 77.7% |
| Renter-Occupied Housing Units | 1,179 | 22.3% |
| Total Occupied Housing Units | 5,286 | 100.0% |
Occupancy by Household Size in Joppatowne
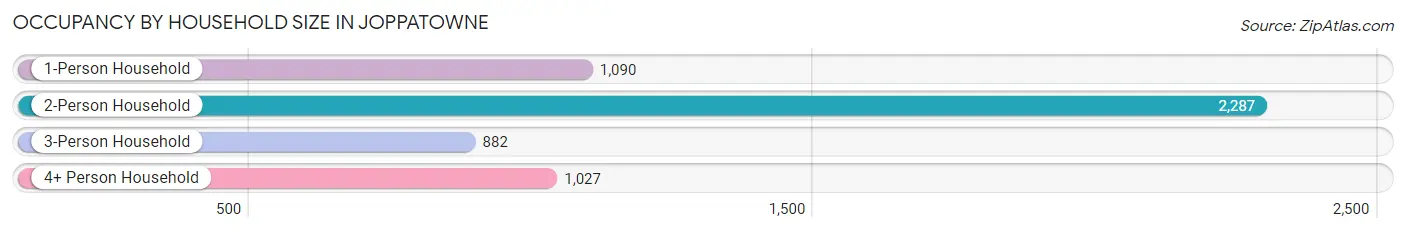
| Household Size | # Housing Units | % Housing Units |
| 1-Person Household | 1,090 | 20.6% |
| 2-Person Household | 2,287 | 43.3% |
| 3-Person Household | 882 | 16.7% |
| 4+ Person Household | 1,027 | 19.4% |
| Total Housing Units | 5,286 | 100.0% |
Occupancy by Ownership by Household Size in Joppatowne
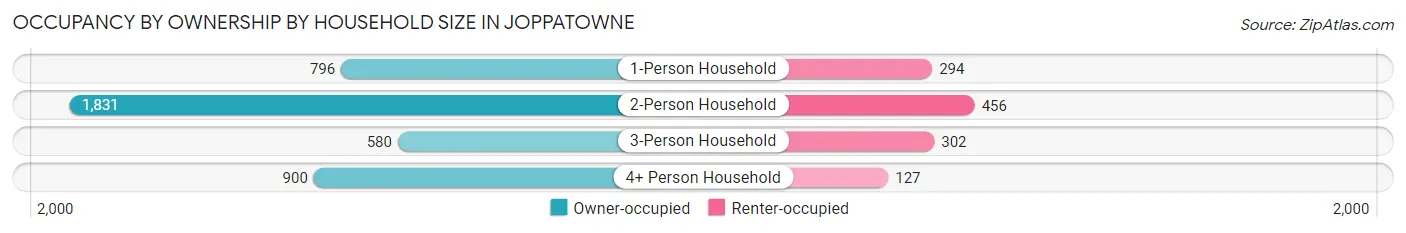
| Household Size | Owner-occupied | Renter-occupied |
| 1-Person Household | 796 (73.0%) | 294 (27.0%) |
| 2-Person Household | 1,831 (80.1%) | 456 (19.9%) |
| 3-Person Household | 580 (65.8%) | 302 (34.2%) |
| 4+ Person Household | 900 (87.6%) | 127 (12.4%) |
| Total Housing Units | 4,107 (77.7%) | 1,179 (22.3%) |
Occupancy by Educational Attainment in Joppatowne
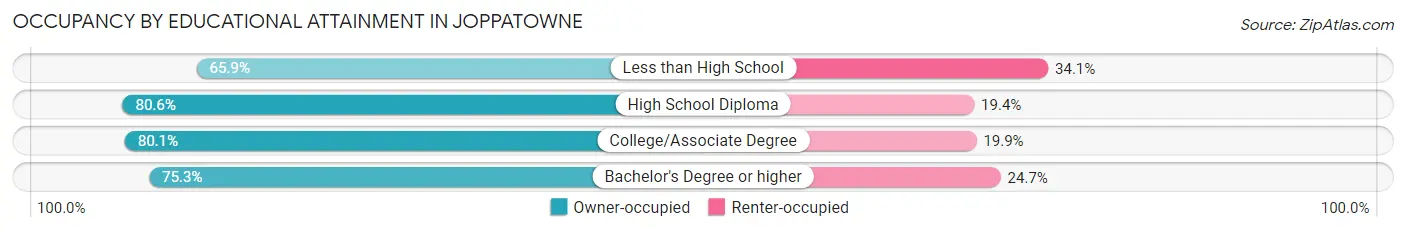
| Household Size | Owner-occupied | Renter-occupied |
| Less than High School | 203 (65.9%) | 105 (34.1%) |
| High School Diploma | 1,037 (80.6%) | 250 (19.4%) |
| College/Associate Degree | 1,451 (80.1%) | 360 (19.9%) |
| Bachelor's Degree or higher | 1,416 (75.3%) | 464 (24.7%) |
Occupancy by Age of Householder in Joppatowne
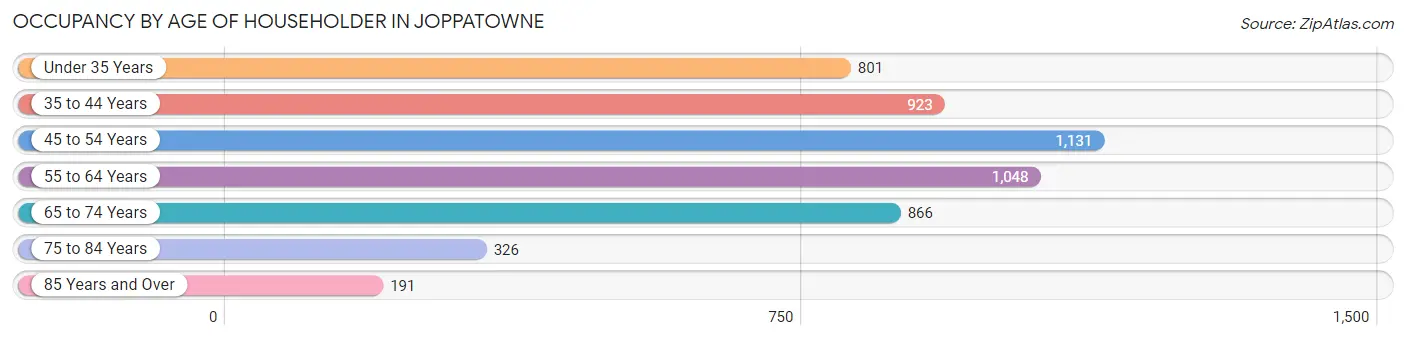
| Age Bracket | # Households | % Households |
| Under 35 Years | 801 | 15.1% |
| 35 to 44 Years | 923 | 17.5% |
| 45 to 54 Years | 1,131 | 21.4% |
| 55 to 64 Years | 1,048 | 19.8% |
| 65 to 74 Years | 866 | 16.4% |
| 75 to 84 Years | 326 | 6.2% |
| 85 Years and Over | 191 | 3.6% |
| Total | 5,286 | 100.0% |
Housing Finances in Joppatowne
Median Income by Occupancy in Joppatowne
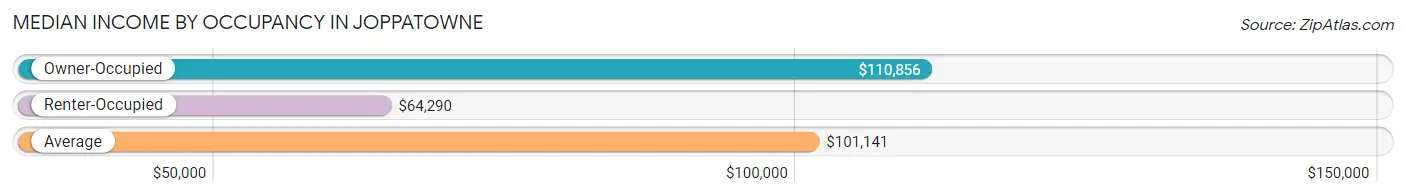
| Occupancy Type | # Households | Median Income |
| Owner-Occupied | 4,107 (77.7%) | $110,856 |
| Renter-Occupied | 1,179 (22.3%) | $64,290 |
| Average | 5,286 (100.0%) | $101,141 |
Occupancy by Householder Income Bracket in Joppatowne
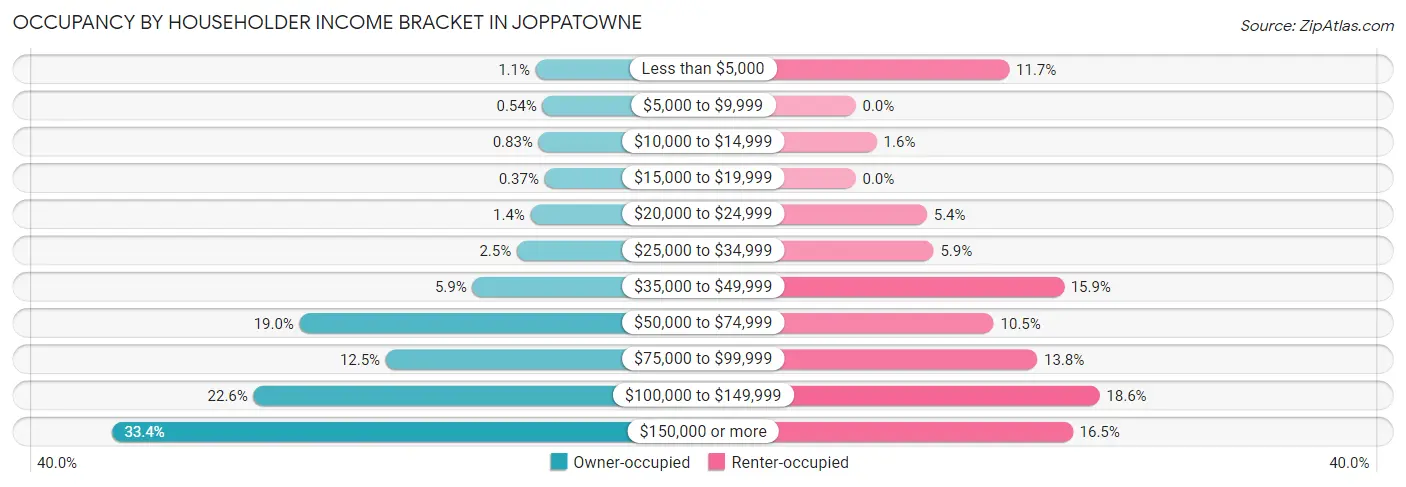
| Income Bracket | Owner-occupied | Renter-occupied |
| Less than $5,000 | 43 (1.1%) | 138 (11.7%) |
| $5,000 to $9,999 | 22 (0.5%) | 0 (0.0%) |
| $10,000 to $14,999 | 34 (0.8%) | 19 (1.6%) |
| $15,000 to $19,999 | 15 (0.4%) | 0 (0.0%) |
| $20,000 to $24,999 | 59 (1.4%) | 64 (5.4%) |
| $25,000 to $34,999 | 102 (2.5%) | 70 (5.9%) |
| $35,000 to $49,999 | 241 (5.9%) | 187 (15.9%) |
| $50,000 to $74,999 | 782 (19.0%) | 124 (10.5%) |
| $75,000 to $99,999 | 512 (12.5%) | 163 (13.8%) |
| $100,000 to $149,999 | 926 (22.6%) | 219 (18.6%) |
| $150,000 or more | 1,371 (33.4%) | 195 (16.5%) |
| Total | 4,107 (100.0%) | 1,179 (100.0%) |
Monthly Housing Cost Tiers in Joppatowne
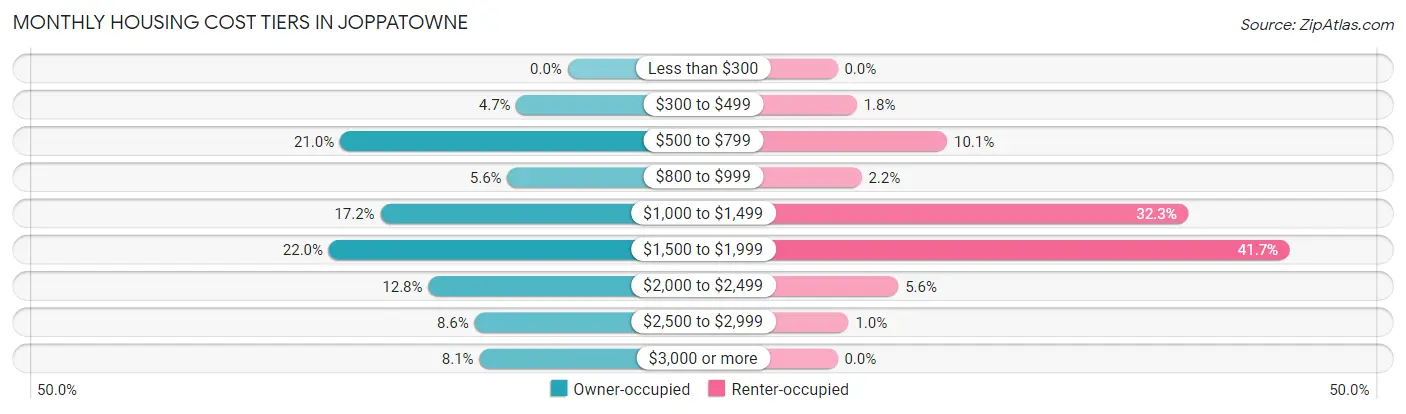
| Monthly Cost | Owner-occupied | Renter-occupied |
| Less than $300 | 0 (0.0%) | 0 (0.0%) |
| $300 to $499 | 194 (4.7%) | 21 (1.8%) |
| $500 to $799 | 861 (21.0%) | 119 (10.1%) |
| $800 to $999 | 228 (5.6%) | 26 (2.2%) |
| $1,000 to $1,499 | 708 (17.2%) | 381 (32.3%) |
| $1,500 to $1,999 | 903 (22.0%) | 491 (41.6%) |
| $2,000 to $2,499 | 527 (12.8%) | 66 (5.6%) |
| $2,500 to $2,999 | 352 (8.6%) | 12 (1.0%) |
| $3,000 or more | 334 (8.1%) | 0 (0.0%) |
| Total | 4,107 (100.0%) | 1,179 (100.0%) |
Physical Housing Characteristics in Joppatowne
Housing Structures in Joppatowne
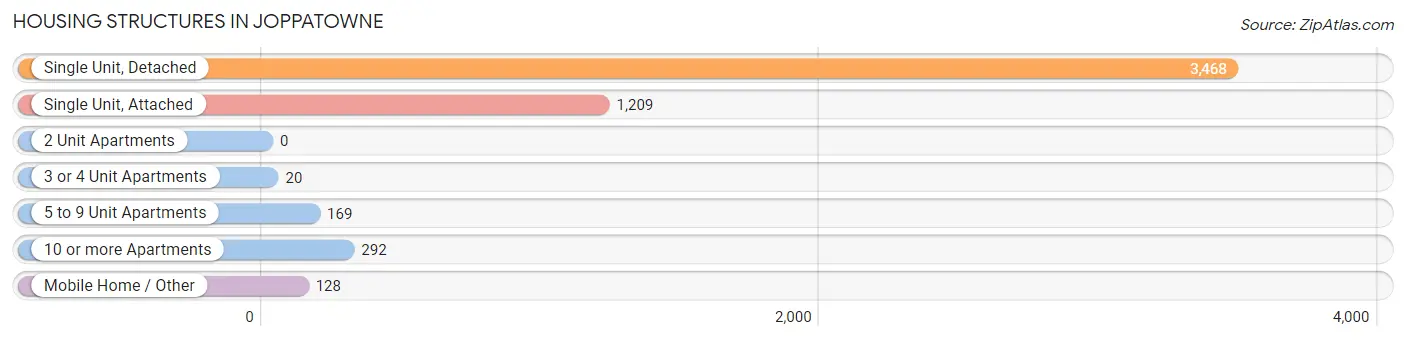
| Structure Type | # Housing Units | % Housing Units |
| Single Unit, Detached | 3,468 | 65.6% |
| Single Unit, Attached | 1,209 | 22.9% |
| 2 Unit Apartments | 0 | 0.0% |
| 3 or 4 Unit Apartments | 20 | 0.4% |
| 5 to 9 Unit Apartments | 169 | 3.2% |
| 10 or more Apartments | 292 | 5.5% |
| Mobile Home / Other | 128 | 2.4% |
| Total | 5,286 | 100.0% |
Housing Structures by Occupancy in Joppatowne
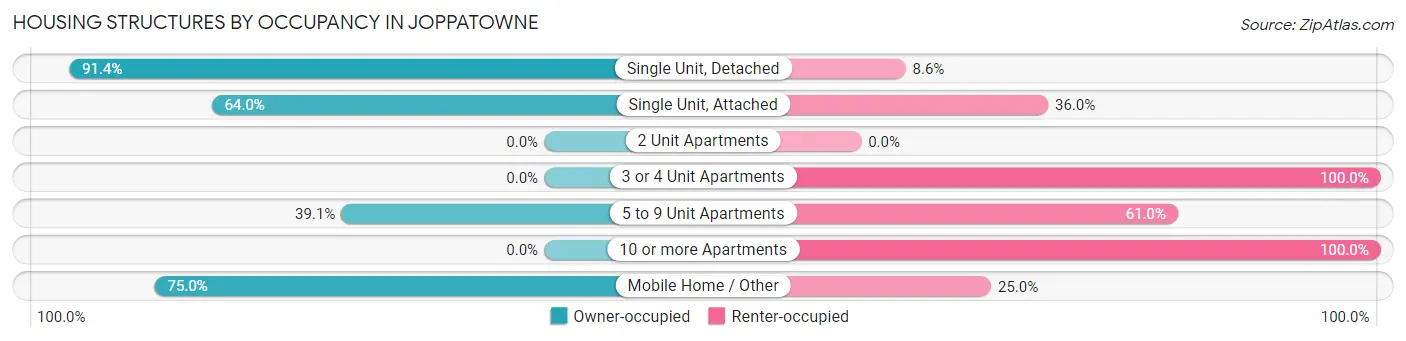
| Structure Type | Owner-occupied | Renter-occupied |
| Single Unit, Detached | 3,171 (91.4%) | 297 (8.6%) |
| Single Unit, Attached | 774 (64.0%) | 435 (36.0%) |
| 2 Unit Apartments | 0 (0.0%) | 0 (0.0%) |
| 3 or 4 Unit Apartments | 0 (0.0%) | 20 (100.0%) |
| 5 to 9 Unit Apartments | 66 (39.1%) | 103 (61.0%) |
| 10 or more Apartments | 0 (0.0%) | 292 (100.0%) |
| Mobile Home / Other | 96 (75.0%) | 32 (25.0%) |
| Total | 4,107 (77.7%) | 1,179 (22.3%) |
Housing Structures by Number of Rooms in Joppatowne
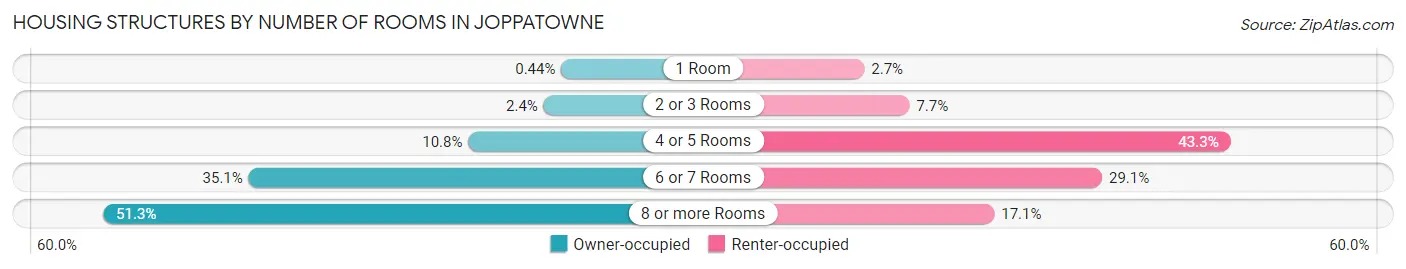
| Number of Rooms | Owner-occupied | Renter-occupied |
| 1 Room | 18 (0.4%) | 32 (2.7%) |
| 2 or 3 Rooms | 98 (2.4%) | 91 (7.7%) |
| 4 or 5 Rooms | 442 (10.8%) | 511 (43.3%) |
| 6 or 7 Rooms | 1,443 (35.1%) | 343 (29.1%) |
| 8 or more Rooms | 2,106 (51.3%) | 202 (17.1%) |
| Total | 4,107 (100.0%) | 1,179 (100.0%) |
Housing Structure by Heating Type in Joppatowne
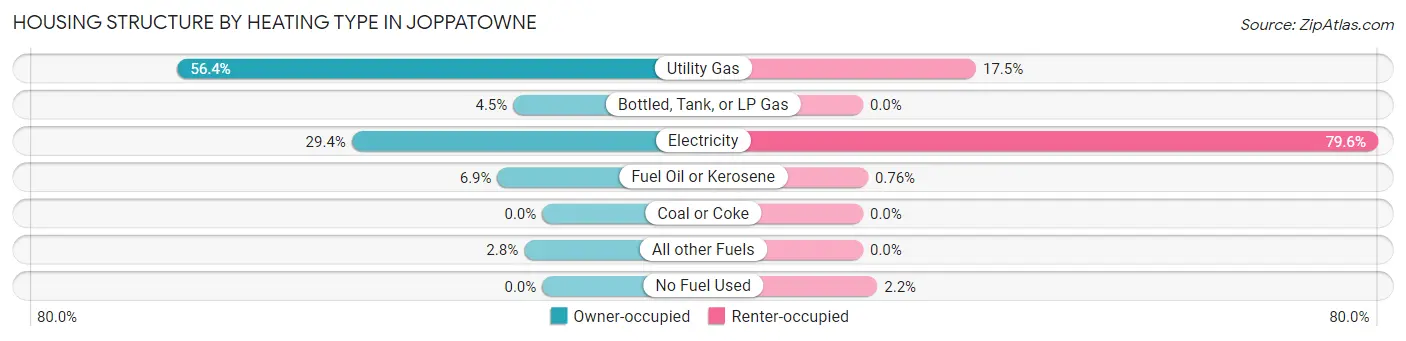
| Heating Type | Owner-occupied | Renter-occupied |
| Utility Gas | 2,315 (56.4%) | 206 (17.5%) |
| Bottled, Tank, or LP Gas | 184 (4.5%) | 0 (0.0%) |
| Electricity | 1,209 (29.4%) | 938 (79.6%) |
| Fuel Oil or Kerosene | 284 (6.9%) | 9 (0.8%) |
| Coal or Coke | 0 (0.0%) | 0 (0.0%) |
| All other Fuels | 115 (2.8%) | 0 (0.0%) |
| No Fuel Used | 0 (0.0%) | 26 (2.2%) |
| Total | 4,107 (100.0%) | 1,179 (100.0%) |
Household Vehicle Usage in Joppatowne
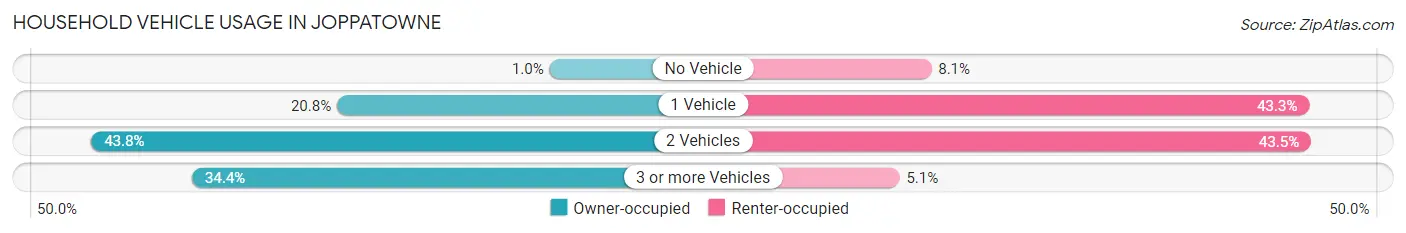
| Vehicles per Household | Owner-occupied | Renter-occupied |
| No Vehicle | 41 (1.0%) | 95 (8.1%) |
| 1 Vehicle | 856 (20.8%) | 511 (43.3%) |
| 2 Vehicles | 1,798 (43.8%) | 513 (43.5%) |
| 3 or more Vehicles | 1,412 (34.4%) | 60 (5.1%) |
| Total | 4,107 (100.0%) | 1,179 (100.0%) |
Real Estate & Mortgages in Joppatowne
Real Estate and Mortgage Overview in Joppatowne
| Characteristic | Without Mortgage | With Mortgage |
| Housing Units | 1,371 | 2,736 |
| Median Property Value | $303,200 | $310,300 |
| Median Household Income | $80,572 | $978 |
| Monthly Housing Costs | $633 | $334 |
| Real Estate Taxes | $2,772 | $36 |
Property Value by Mortgage Status in Joppatowne
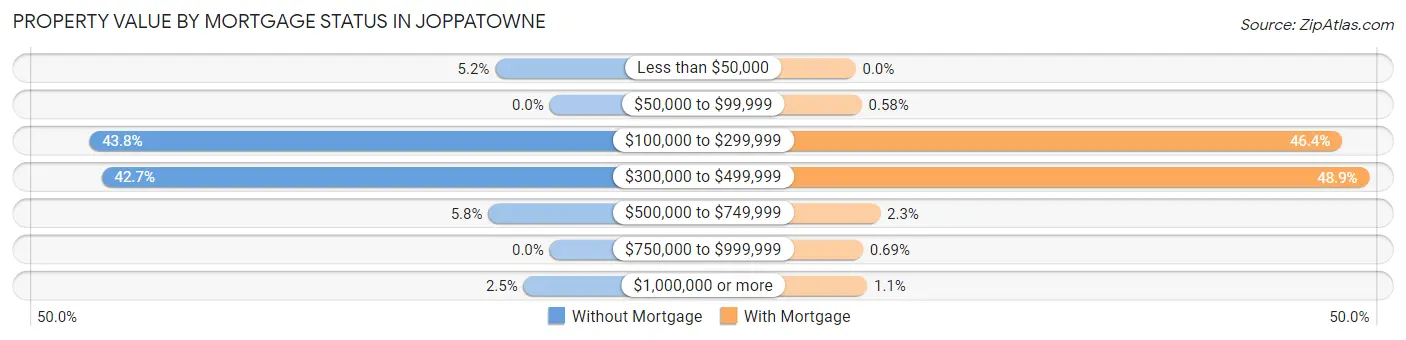
| Property Value | Without Mortgage | With Mortgage |
| Less than $50,000 | 71 (5.2%) | 0 (0.0%) |
| $50,000 to $99,999 | 0 (0.0%) | 16 (0.6%) |
| $100,000 to $299,999 | 601 (43.8%) | 1,268 (46.4%) |
| $300,000 to $499,999 | 585 (42.7%) | 1,339 (48.9%) |
| $500,000 to $749,999 | 80 (5.8%) | 64 (2.3%) |
| $750,000 to $999,999 | 0 (0.0%) | 19 (0.7%) |
| $1,000,000 or more | 34 (2.5%) | 30 (1.1%) |
| Total | 1,371 (100.0%) | 2,736 (100.0%) |
Household Income by Mortgage Status in Joppatowne
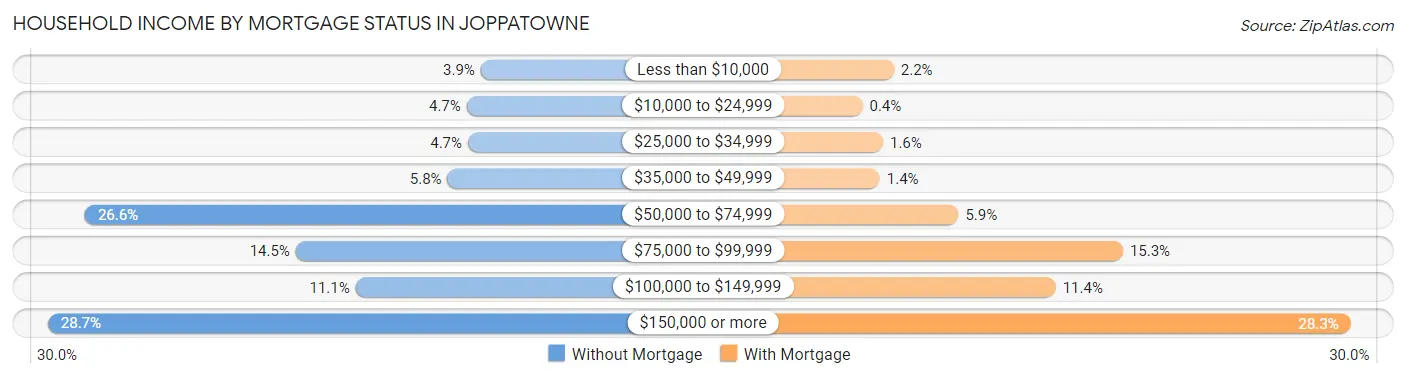
| Household Income | Without Mortgage | With Mortgage |
| Less than $10,000 | 54 (3.9%) | 60 (2.2%) |
| $10,000 to $24,999 | 65 (4.7%) | 11 (0.4%) |
| $25,000 to $34,999 | 64 (4.7%) | 43 (1.6%) |
| $35,000 to $49,999 | 80 (5.8%) | 38 (1.4%) |
| $50,000 to $74,999 | 364 (26.6%) | 161 (5.9%) |
| $75,000 to $99,999 | 199 (14.5%) | 418 (15.3%) |
| $100,000 to $149,999 | 152 (11.1%) | 313 (11.4%) |
| $150,000 or more | 393 (28.7%) | 774 (28.3%) |
| Total | 1,371 (100.0%) | 2,736 (100.0%) |
Property Value to Household Income Ratio in Joppatowne
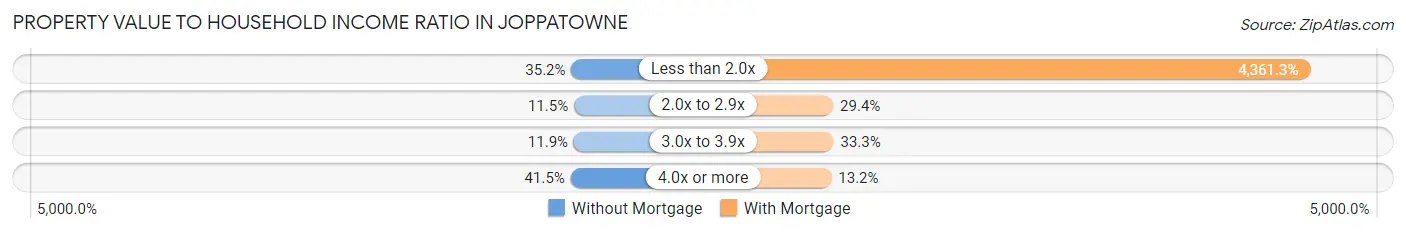
| Value-to-Income Ratio | Without Mortgage | With Mortgage |
| Less than 2.0x | 482 (35.2%) | 119,325 (4,361.3%) |
| 2.0x to 2.9x | 157 (11.5%) | 803 (29.3%) |
| 3.0x to 3.9x | 163 (11.9%) | 911 (33.3%) |
| 4.0x or more | 569 (41.5%) | 360 (13.2%) |
| Total | 1,371 (100.0%) | 2,736 (100.0%) |
Real Estate Taxes by Mortgage Status in Joppatowne
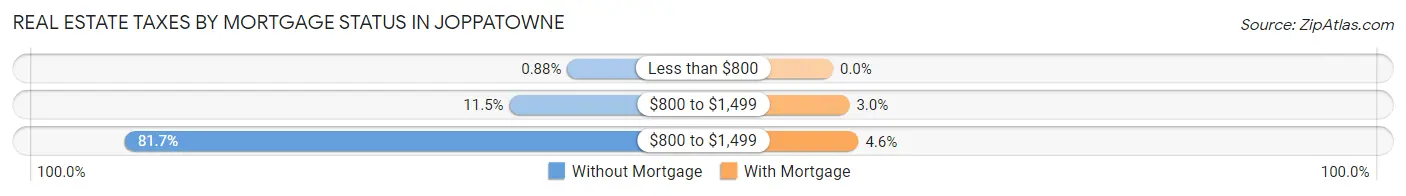
| Property Taxes | Without Mortgage | With Mortgage |
| Less than $800 | 12 (0.9%) | 0 (0.0%) |
| $800 to $1,499 | 157 (11.5%) | 82 (3.0%) |
| $800 to $1,499 | 1,120 (81.7%) | 127 (4.6%) |
| Total | 1,371 (100.0%) | 2,736 (100.0%) |
Health & Disability in Joppatowne
Health Insurance Coverage by Age in Joppatowne
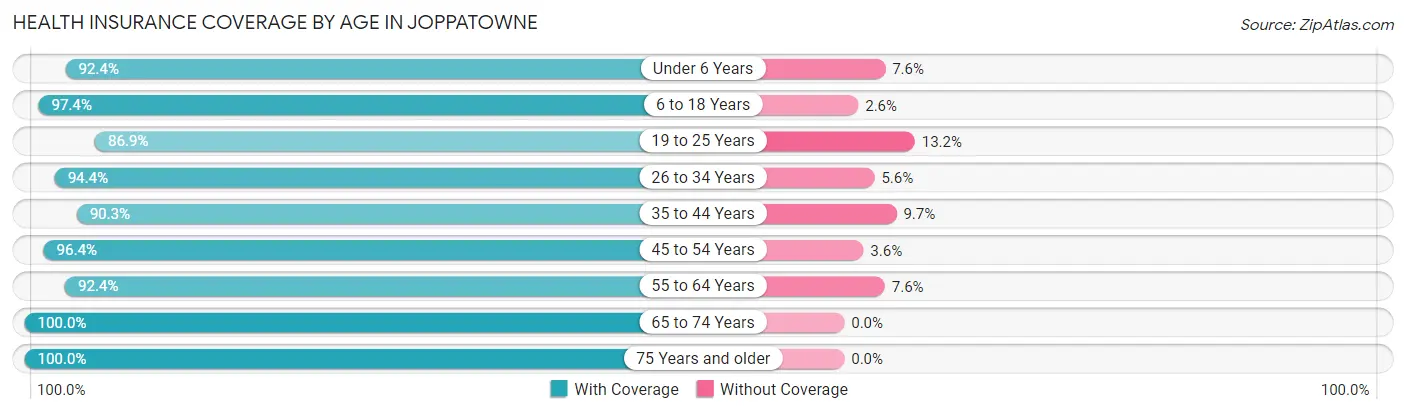
| Age Bracket | With Coverage | Without Coverage |
| Under 6 Years | 969 (92.4%) | 80 (7.6%) |
| 6 to 18 Years | 1,379 (97.4%) | 37 (2.6%) |
| 19 to 25 Years | 892 (86.9%) | 135 (13.2%) |
| 26 to 34 Years | 1,711 (94.4%) | 102 (5.6%) |
| 35 to 44 Years | 1,660 (90.3%) | 179 (9.7%) |
| 45 to 54 Years | 2,030 (96.4%) | 75 (3.6%) |
| 55 to 64 Years | 1,687 (92.4%) | 138 (7.6%) |
| 65 to 74 Years | 1,285 (100.0%) | 0 (0.0%) |
| 75 Years and older | 974 (100.0%) | 0 (0.0%) |
| Total | 12,587 (94.4%) | 746 (5.6%) |
Health Insurance Coverage by Citizenship Status in Joppatowne
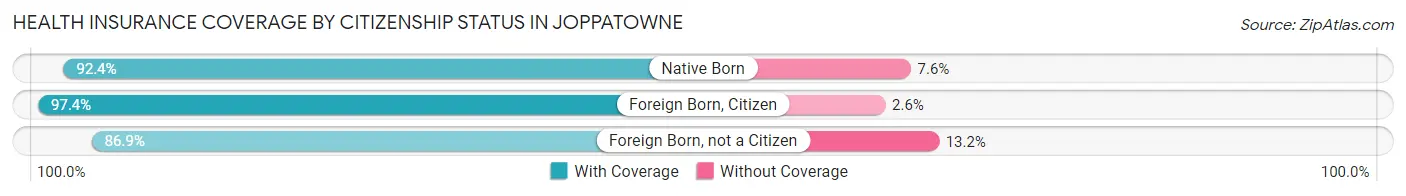
| Citizenship Status | With Coverage | Without Coverage |
| Native Born | 969 (92.4%) | 80 (7.6%) |
| Foreign Born, Citizen | 1,379 (97.4%) | 37 (2.6%) |
| Foreign Born, not a Citizen | 892 (86.9%) | 135 (13.2%) |
Health Insurance Coverage by Household Income in Joppatowne
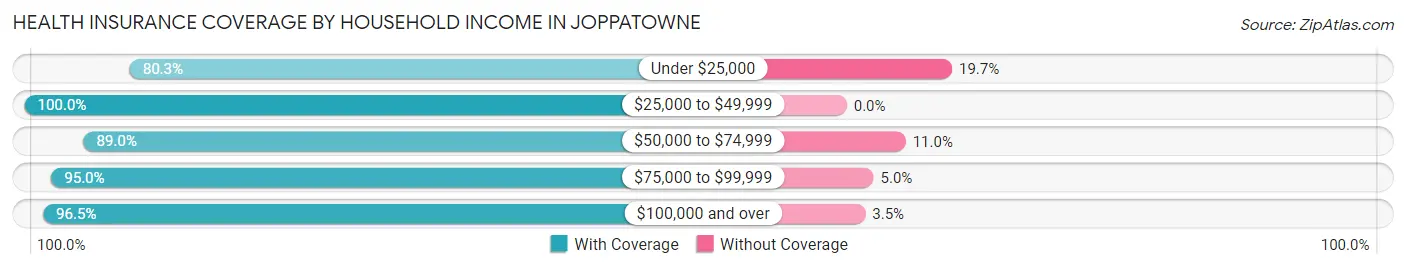
| Household Income | With Coverage | Without Coverage |
| Under $25,000 | 696 (80.3%) | 171 (19.7%) |
| $25,000 to $49,999 | 1,137 (100.0%) | 0 (0.0%) |
| $50,000 to $74,999 | 1,830 (89.0%) | 227 (11.0%) |
| $75,000 to $99,999 | 1,569 (95.0%) | 83 (5.0%) |
| $100,000 and over | 7,355 (96.5%) | 265 (3.5%) |
Public vs Private Health Insurance Coverage by Age in Joppatowne
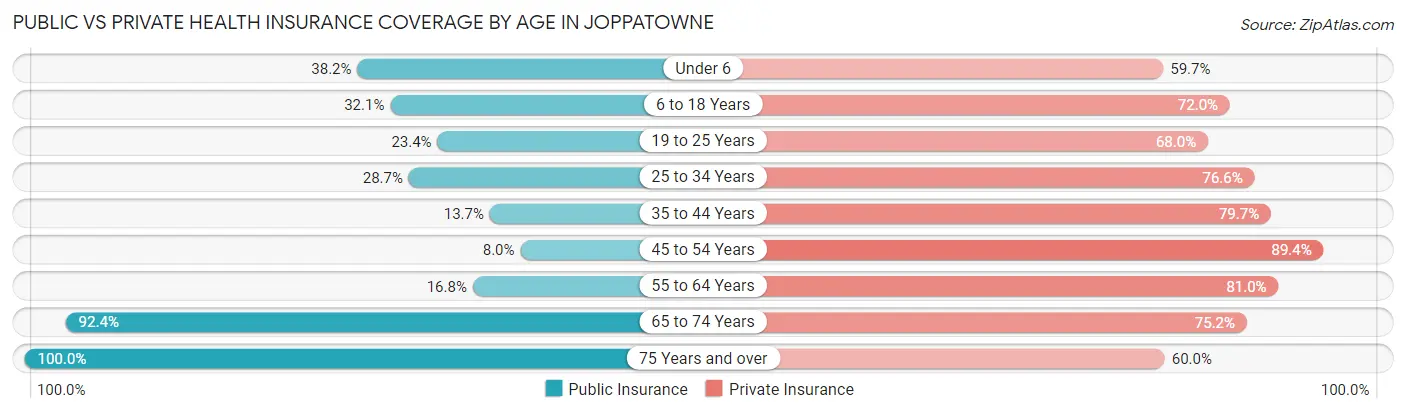
| Age Bracket | Public Insurance | Private Insurance |
| Under 6 | 401 (38.2%) | 626 (59.7%) |
| 6 to 18 Years | 455 (32.1%) | 1,020 (72.0%) |
| 19 to 25 Years | 240 (23.4%) | 698 (68.0%) |
| 25 to 34 Years | 520 (28.7%) | 1,389 (76.6%) |
| 35 to 44 Years | 251 (13.7%) | 1,465 (79.7%) |
| 45 to 54 Years | 168 (8.0%) | 1,882 (89.4%) |
| 55 to 64 Years | 307 (16.8%) | 1,479 (81.0%) |
| 65 to 74 Years | 1,187 (92.4%) | 966 (75.2%) |
| 75 Years and over | 974 (100.0%) | 584 (60.0%) |
| Total | 4,503 (33.8%) | 10,109 (75.8%) |
Disability Status by Sex by Age in Joppatowne
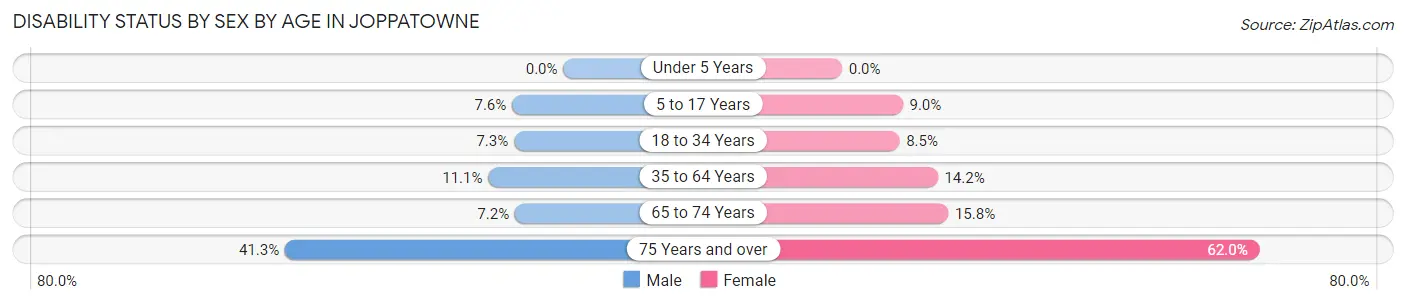
| Age Bracket | Male | Female |
| Under 5 Years | 0 (0.0%) | 0 (0.0%) |
| 5 to 17 Years | 44 (7.6%) | 84 (9.0%) |
| 18 to 34 Years | 99 (7.3%) | 137 (8.5%) |
| 35 to 64 Years | 330 (11.1%) | 399 (14.2%) |
| 65 to 74 Years | 44 (7.2%) | 106 (15.8%) |
| 75 Years and over | 174 (41.3%) | 343 (62.0%) |
Disability Class by Sex by Age in Joppatowne
Disability Class: Hearing Difficulty
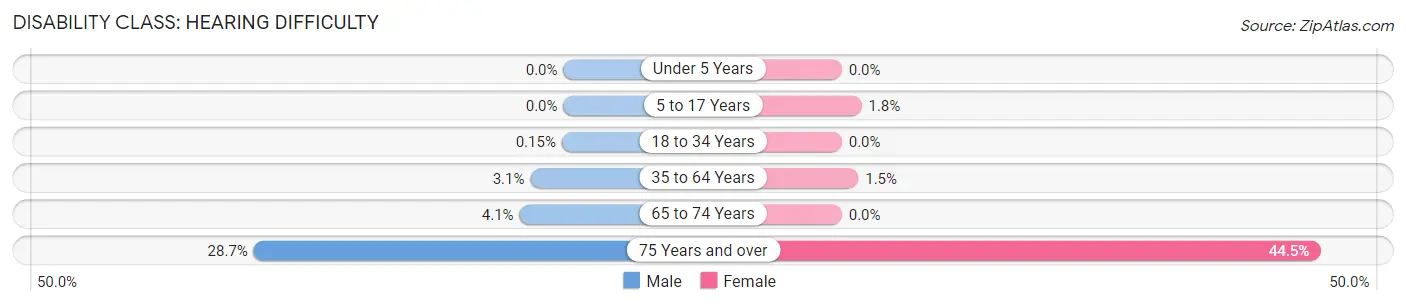
| Age Bracket | Male | Female |
| Under 5 Years | 0 (0.0%) | 0 (0.0%) |
| 5 to 17 Years | 0 (0.0%) | 17 (1.8%) |
| 18 to 34 Years | 2 (0.2%) | 0 (0.0%) |
| 35 to 64 Years | 91 (3.1%) | 43 (1.5%) |
| 65 to 74 Years | 25 (4.1%) | 0 (0.0%) |
| 75 Years and over | 121 (28.7%) | 246 (44.5%) |
Disability Class: Vision Difficulty
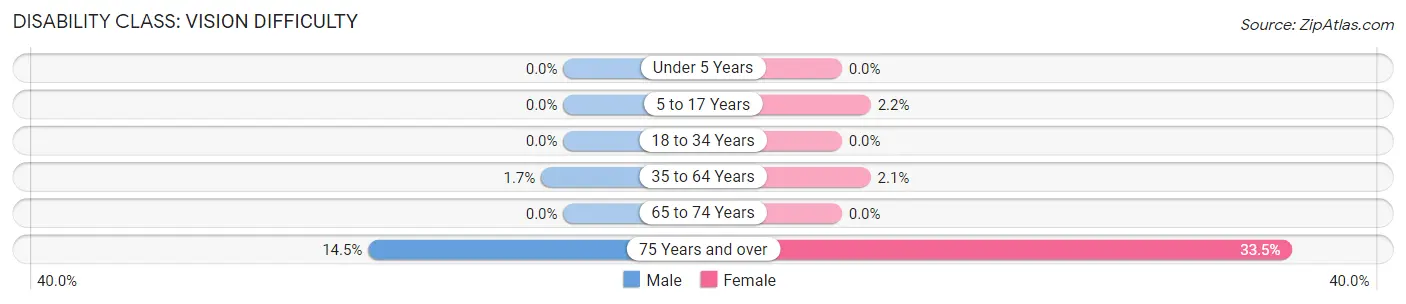
| Age Bracket | Male | Female |
| Under 5 Years | 0 (0.0%) | 0 (0.0%) |
| 5 to 17 Years | 0 (0.0%) | 20 (2.1%) |
| 18 to 34 Years | 0 (0.0%) | 0 (0.0%) |
| 35 to 64 Years | 49 (1.7%) | 60 (2.1%) |
| 65 to 74 Years | 0 (0.0%) | 0 (0.0%) |
| 75 Years and over | 61 (14.5%) | 185 (33.5%) |
Disability Class: Cognitive Difficulty
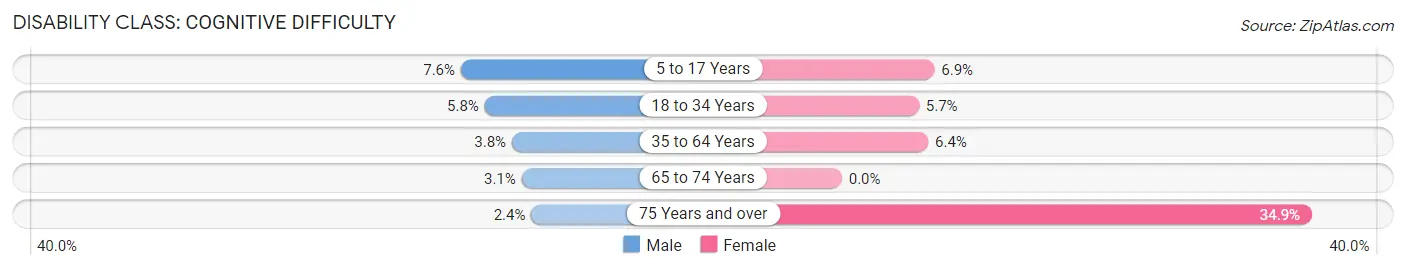
| Age Bracket | Male | Female |
| 5 to 17 Years | 44 (7.6%) | 64 (6.9%) |
| 18 to 34 Years | 79 (5.8%) | 92 (5.7%) |
| 35 to 64 Years | 113 (3.8%) | 180 (6.4%) |
| 65 to 74 Years | 19 (3.1%) | 0 (0.0%) |
| 75 Years and over | 10 (2.4%) | 193 (34.9%) |
Disability Class: Ambulatory Difficulty
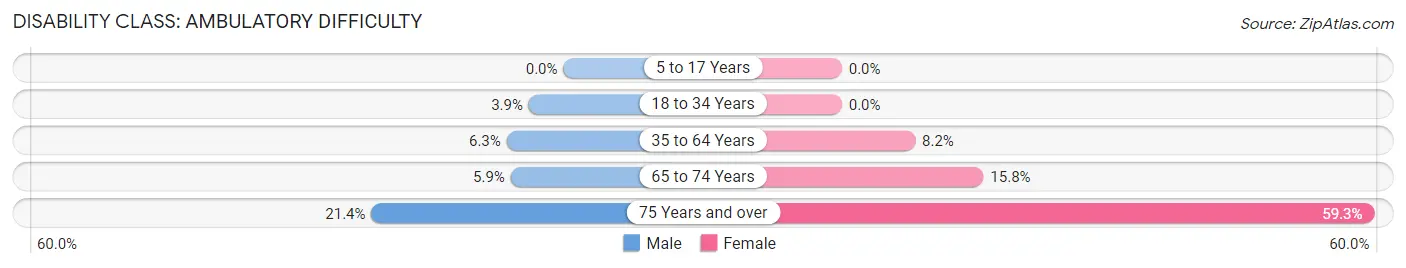
| Age Bracket | Male | Female |
| 5 to 17 Years | 0 (0.0%) | 0 (0.0%) |
| 18 to 34 Years | 52 (3.8%) | 0 (0.0%) |
| 35 to 64 Years | 187 (6.3%) | 229 (8.2%) |
| 65 to 74 Years | 36 (5.9%) | 106 (15.8%) |
| 75 Years and over | 90 (21.4%) | 328 (59.3%) |
Disability Class: Self-Care Difficulty
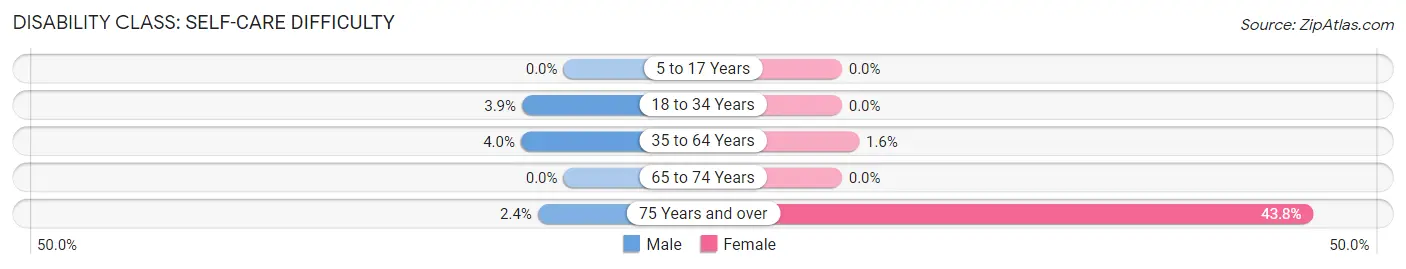
| Age Bracket | Male | Female |
| 5 to 17 Years | 0 (0.0%) | 0 (0.0%) |
| 18 to 34 Years | 52 (3.8%) | 0 (0.0%) |
| 35 to 64 Years | 117 (4.0%) | 45 (1.6%) |
| 65 to 74 Years | 0 (0.0%) | 0 (0.0%) |
| 75 Years and over | 10 (2.4%) | 242 (43.8%) |
Technology Access in Joppatowne
Computing Device Access in Joppatowne
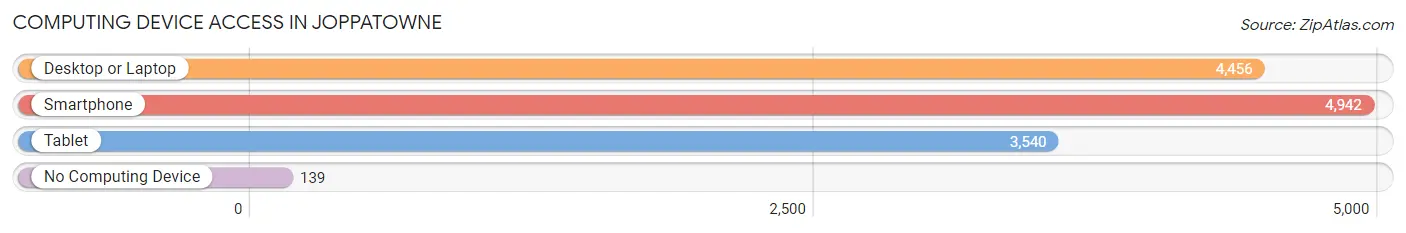
| Device Type | # Households | % Households |
| Desktop or Laptop | 4,456 | 84.3% |
| Smartphone | 4,942 | 93.5% |
| Tablet | 3,540 | 67.0% |
| No Computing Device | 139 | 2.6% |
| Total | 5,286 | 100.0% |
Internet Access in Joppatowne
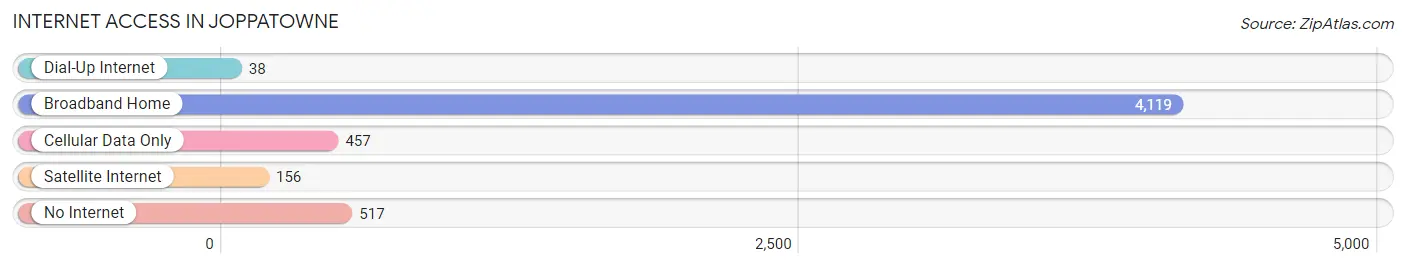
| Internet Type | # Households | % Households |
| Dial-Up Internet | 38 | 0.7% |
| Broadband Home | 4,119 | 77.9% |
| Cellular Data Only | 457 | 8.6% |
| Satellite Internet | 156 | 2.9% |
| No Internet | 517 | 9.8% |
| Total | 5,286 | 100.0% |
Joppatowne Summary
Joppatowne, Maryland is a small unincorporated community located in Harford County, Maryland. It is situated along the banks of the Bush River, approximately 10 miles northeast of Baltimore. The community is bordered by the towns of Edgewood, Abingdon, and Bel Air. Joppatowne is a diverse community with a population of approximately 8,000 people.
History
The area that is now Joppatowne was first settled in the late 1600s by German and English immigrants. The area was originally known as Joppa, after the biblical city of Joppa. The name was later changed to Joppatowne in the early 1800s. The community was largely agricultural, with many of the residents working as farmers.
In the late 1800s, the area began to experience rapid growth due to the development of the Chesapeake and Delaware Canal. The canal provided a direct route from the Chesapeake Bay to the Delaware River, and allowed for the transportation of goods and people. This led to the development of several industries in the area, including a paper mill, a brickyard, and a cannery.
Geography
Joppatowne is located in Harford County, Maryland. It is situated along the banks of the Bush River, approximately 10 miles northeast of Baltimore. The community is bordered by the towns of Edgewood, Abingdon, and Bel Air. The area is mostly flat, with some rolling hills. The climate is temperate, with hot summers and cold winters.
Economy
The economy of Joppatowne is largely based on the service industry. The area is home to several retail stores, restaurants, and other businesses. The community is also home to a number of manufacturing and industrial businesses, including a paper mill, a brickyard, and a cannery.
Demographics
As of the 2010 census, the population of Joppatowne was 8,000. The racial makeup of the community was 79.3% White, 14.2% African American, 2.2% Asian, and 4.3% other. The median household income was $50,000, and the median home value was $200,000.
Joppatowne is a diverse community with a rich history and a vibrant economy. The area is home to a variety of businesses, and the population is diverse. The community is a great place to live, work, and play.
Common Questions
What is Per Capita Income in Joppatowne?
Per Capita income in Joppatowne is $49,644.
What is the Median Family Income in Joppatowne?
Median Family Income in Joppatowne is $110,709.
What is the Median Household income in Joppatowne?
Median Household Income in Joppatowne is $101,141.
What is Income or Wage Gap in Joppatowne?
Income or Wage Gap in Joppatowne is 33.9%.
Women in Joppatowne earn 66.1 cents for every dollar earned by a man.
What is Inequality or Gini Index in Joppatowne?
Inequality or Gini Index in Joppatowne is 0.40.
What is the Total Population of Joppatowne?
Total Population of Joppatowne is 13,391.
What is the Total Male Population of Joppatowne?
Total Male Population of Joppatowne is 6,431.
What is the Total Female Population of Joppatowne?
Total Female Population of Joppatowne is 6,960.
What is the Ratio of Males per 100 Females in Joppatowne?
There are 92.40 Males per 100 Females in Joppatowne.
What is the Ratio of Females per 100 Males in Joppatowne?
There are 108.23 Females per 100 Males in Joppatowne.
What is the Median Population Age in Joppatowne?
Median Population Age in Joppatowne is 42.6 Years.
What is the Average Family Size in Joppatowne
Average Family Size in Joppatowne is 2.9 People.
What is the Average Household Size in Joppatowne
Average Household Size in Joppatowne is 2.5 People.
How Large is the Labor Force in Joppatowne?
There are 7,913 People in the Labor Forcein in Joppatowne.
What is the Percentage of People in the Labor Force in Joppatowne?
70.6% of People are in the Labor Force in Joppatowne.
What is the Unemployment Rate in Joppatowne?
Unemployment Rate in Joppatowne is 5.1%.