Pleasant Hills, MD Map & Demographics
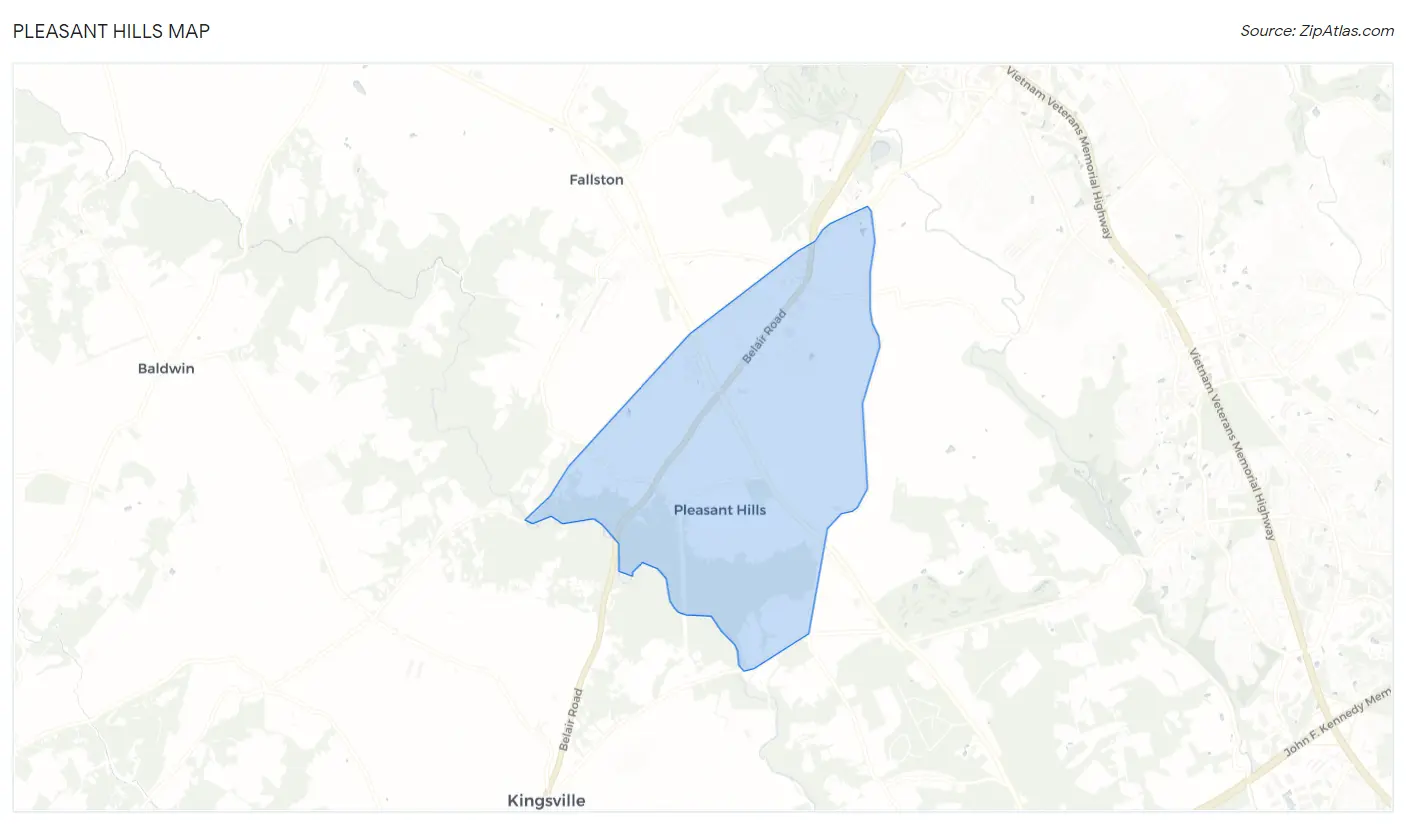
Pleasant Hills Map
Pleasant Hills Overview
$62,492
PER CAPITA INCOME
$146,923
AVG FAMILY INCOME
$138,531
AVG HOUSEHOLD INCOME
36.9%
WAGE / INCOME GAP [ % ]
63.1¢/ $1
WAGE / INCOME GAP [ $ ]
0.36
INEQUALITY / GINI INDEX
3,925
TOTAL POPULATION
1,965
MALE POPULATION
1,960
FEMALE POPULATION
100.26
MALES / 100 FEMALES
99.75
FEMALES / 100 MALES
46.9
MEDIAN AGE
3.1
AVG FAMILY SIZE
2.6
AVG HOUSEHOLD SIZE
1,998
LABOR FORCE [ PEOPLE ]
63.5%
PERCENT IN LABOR FORCE
2.5%
UNEMPLOYMENT RATE
Income in Pleasant Hills
Income Overview in Pleasant Hills
Per Capita Income in Pleasant Hills is $62,492, while median incomes of families and households are $146,923 and $138,531 respectively.
| Characteristic | Number | Measure |
| Per Capita Income | 3,925 | $62,492 |
| Median Family Income | 1,090 | $146,923 |
| Mean Family Income | 1,090 | $179,598 |
| Median Household Income | 1,493 | $138,531 |
| Mean Household Income | 1,493 | $162,545 |
| Income Deficit | 1,090 | $0 |
| Wage / Income Gap (%) | 3,925 | 36.90% |
| Wage / Income Gap ($) | 3,925 | 63.10¢ per $1 |
| Gini / Inequality Index | 3,925 | 0.36 |
Earnings by Sex in Pleasant Hills
Average Earnings in Pleasant Hills are $70,565, $88,750 for men and $56,000 for women, a difference of 36.9%.
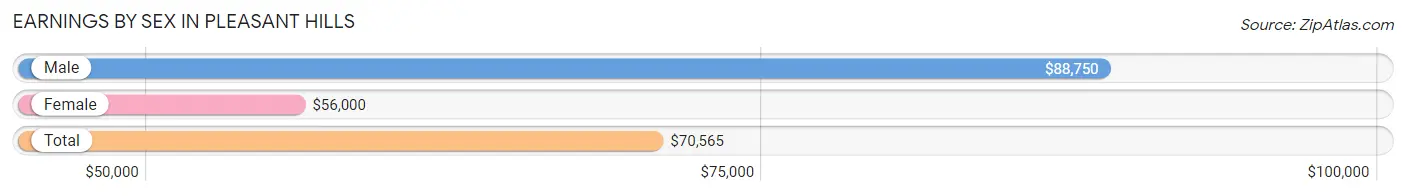
| Sex | Number | Average Earnings |
| Male | 1,184 (58.1%) | $88,750 |
| Female | 854 (41.9%) | $56,000 |
| Total | 2,038 (100.0%) | $70,565 |
Earnings by Sex by Income Bracket in Pleasant Hills
The most common earnings brackets in Pleasant Hills are $100,000+ for men (542 | 45.8%) and $100,000+ for women (202 | 23.6%).
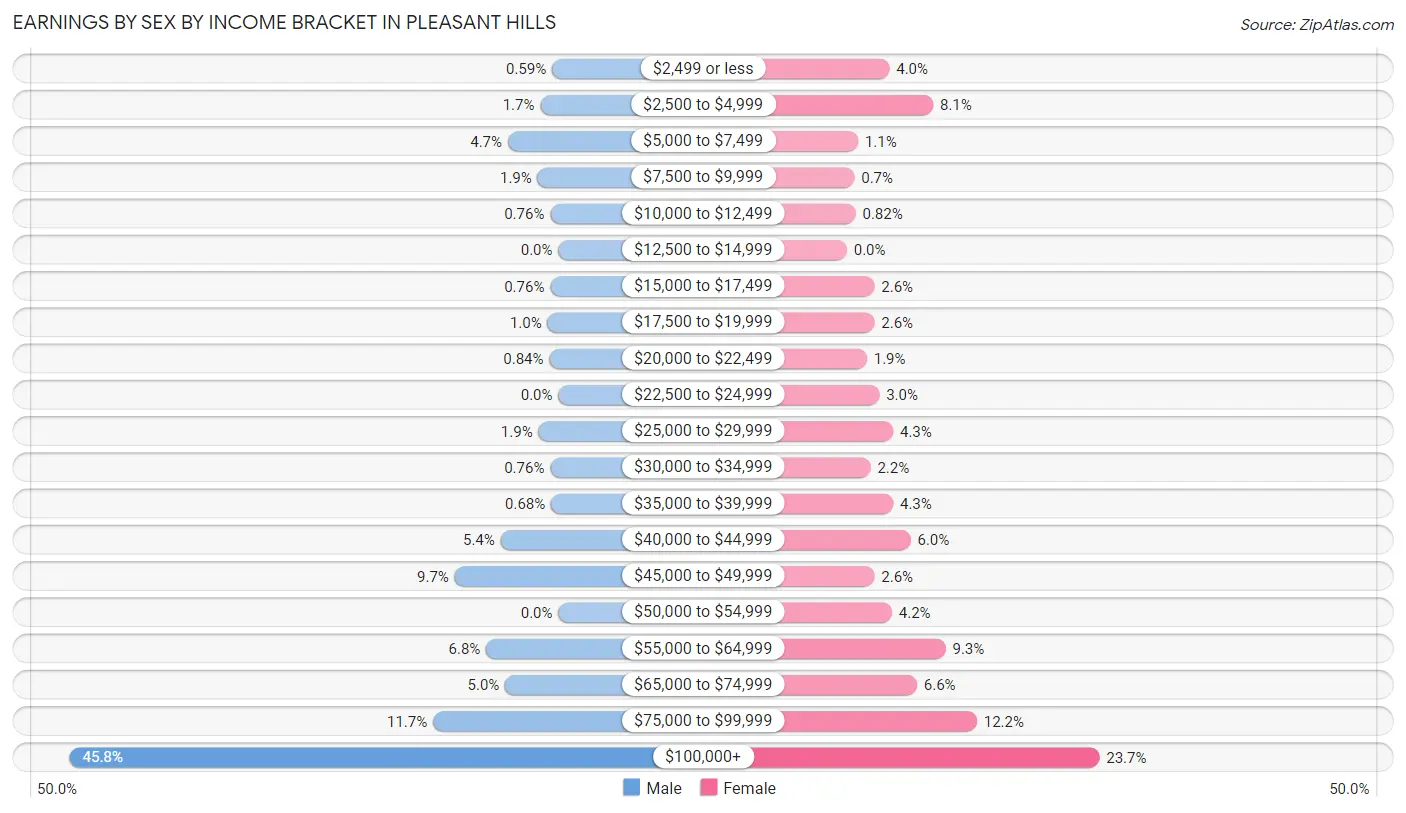
| Income | Male | Female |
| $2,499 or less | 7 (0.6%) | 34 (4.0%) |
| $2,500 to $4,999 | 20 (1.7%) | 69 (8.1%) |
| $5,000 to $7,499 | 56 (4.7%) | 9 (1.1%) |
| $7,500 to $9,999 | 23 (1.9%) | 6 (0.7%) |
| $10,000 to $12,499 | 9 (0.8%) | 7 (0.8%) |
| $12,500 to $14,999 | 0 (0.0%) | 0 (0.0%) |
| $15,000 to $17,499 | 9 (0.8%) | 22 (2.6%) |
| $17,500 to $19,999 | 12 (1.0%) | 22 (2.6%) |
| $20,000 to $22,499 | 10 (0.8%) | 16 (1.9%) |
| $22,500 to $24,999 | 0 (0.0%) | 26 (3.0%) |
| $25,000 to $29,999 | 22 (1.9%) | 37 (4.3%) |
| $30,000 to $34,999 | 9 (0.8%) | 19 (2.2%) |
| $35,000 to $39,999 | 8 (0.7%) | 37 (4.3%) |
| $40,000 to $44,999 | 64 (5.4%) | 51 (6.0%) |
| $45,000 to $49,999 | 115 (9.7%) | 22 (2.6%) |
| $50,000 to $54,999 | 0 (0.0%) | 36 (4.2%) |
| $55,000 to $64,999 | 80 (6.8%) | 79 (9.2%) |
| $65,000 to $74,999 | 59 (5.0%) | 56 (6.6%) |
| $75,000 to $99,999 | 139 (11.7%) | 104 (12.2%) |
| $100,000+ | 542 (45.8%) | 202 (23.6%) |
| Total | 1,184 (100.0%) | 854 (100.0%) |
Earnings by Sex by Educational Attainment in Pleasant Hills
Average earnings in Pleasant Hills are $106,313 for men and $58,409 for women, a difference of 45.1%. Men with an educational attainment of bachelor's degree enjoy the highest average annual earnings of $130,341, while those with high school diploma education earn the least with $64,632. Women with an educational attainment of graduate degree earn the most with the average annual earnings of $104,306, while those with high school diploma education have the smallest earnings of $25,556.
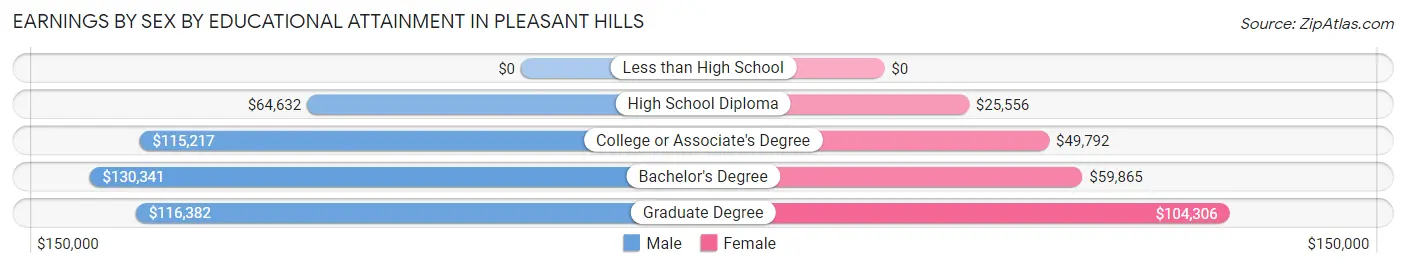
| Educational Attainment | Male Income | Female Income |
| Less than High School | - | - |
| High School Diploma | $64,632 | $25,556 |
| College or Associate's Degree | $115,217 | $49,792 |
| Bachelor's Degree | $130,341 | $59,865 |
| Graduate Degree | $116,382 | $104,306 |
| Total | $106,313 | $58,409 |
Family Income in Pleasant Hills
Family Income Brackets in Pleasant Hills
According to the Pleasant Hills family income data, there are 308 families falling into the $100,000 to $149,999 income range, which is the most common income bracket and makes up 28.3% of all families.
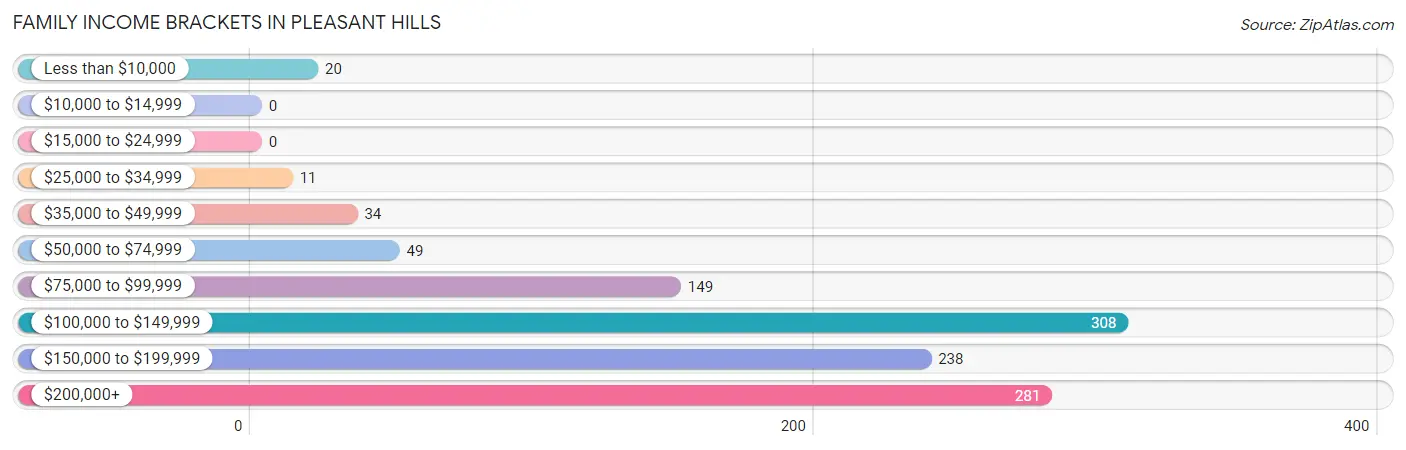
| Income Bracket | # Families | % Families |
| Less than $10,000 | 20 | 1.8% |
| $10,000 to $14,999 | 0 | 0.0% |
| $15,000 to $24,999 | 0 | 0.0% |
| $25,000 to $34,999 | 11 | 1.0% |
| $35,000 to $49,999 | 34 | 3.1% |
| $50,000 to $74,999 | 49 | 4.5% |
| $75,000 to $99,999 | 149 | 13.7% |
| $100,000 to $149,999 | 308 | 28.3% |
| $150,000 to $199,999 | 238 | 21.8% |
| $200,000+ | 281 | 25.8% |
Family Income by Famaliy Size in Pleasant Hills
3-person families (189 | 17.3%) account for the highest median family income in Pleasant Hills with $250,001 per family, while 3-person families (189 | 17.3%) have the highest median income of $83,334 per family member.
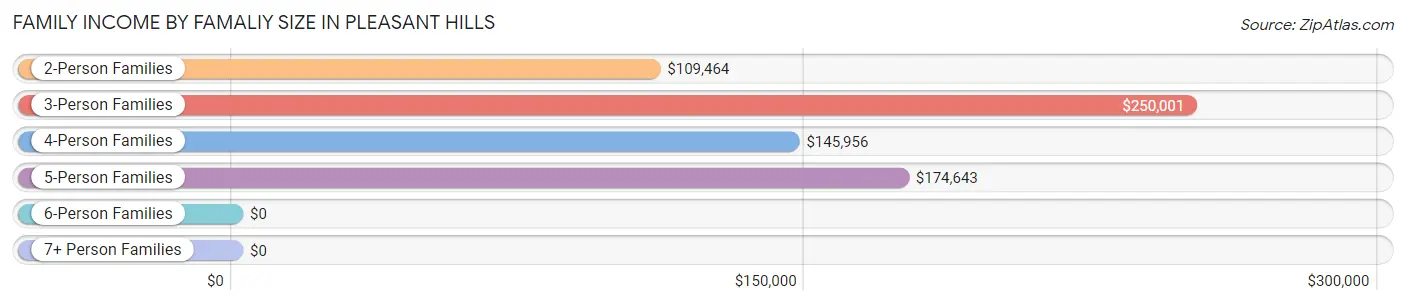
| Income Bracket | # Families | Median Income |
| 2-Person Families | 482 (44.2%) | $109,464 |
| 3-Person Families | 189 (17.3%) | $250,001 |
| 4-Person Families | 276 (25.3%) | $145,956 |
| 5-Person Families | 132 (12.1%) | $174,643 |
| 6-Person Families | 11 (1.0%) | $0 |
| 7+ Person Families | 0 (0.0%) | $0 |
| Total | 1,090 (100.0%) | $146,923 |
Family Income by Number of Earners in Pleasant Hills
The median family income in Pleasant Hills is $146,923, with families comprising 2 earners (497) having the highest median family income of $188,424, while families with no earners (239) have the lowest median family income of $107,634, accounting for 45.6% and 21.9% of families, respectively.
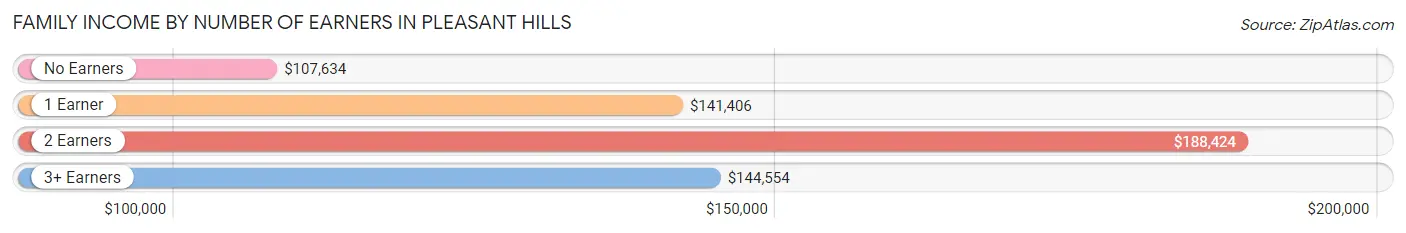
| Number of Earners | # Families | Median Income |
| No Earners | 239 (21.9%) | $107,634 |
| 1 Earner | 213 (19.5%) | $141,406 |
| 2 Earners | 497 (45.6%) | $188,424 |
| 3+ Earners | 141 (12.9%) | $144,554 |
| Total | 1,090 (100.0%) | $146,923 |
Household Income in Pleasant Hills
Household Income Brackets in Pleasant Hills
With 396 households falling in the category, the $100,000 to $149,999 income range is the most frequent in Pleasant Hills, accounting for 26.5% of all households.
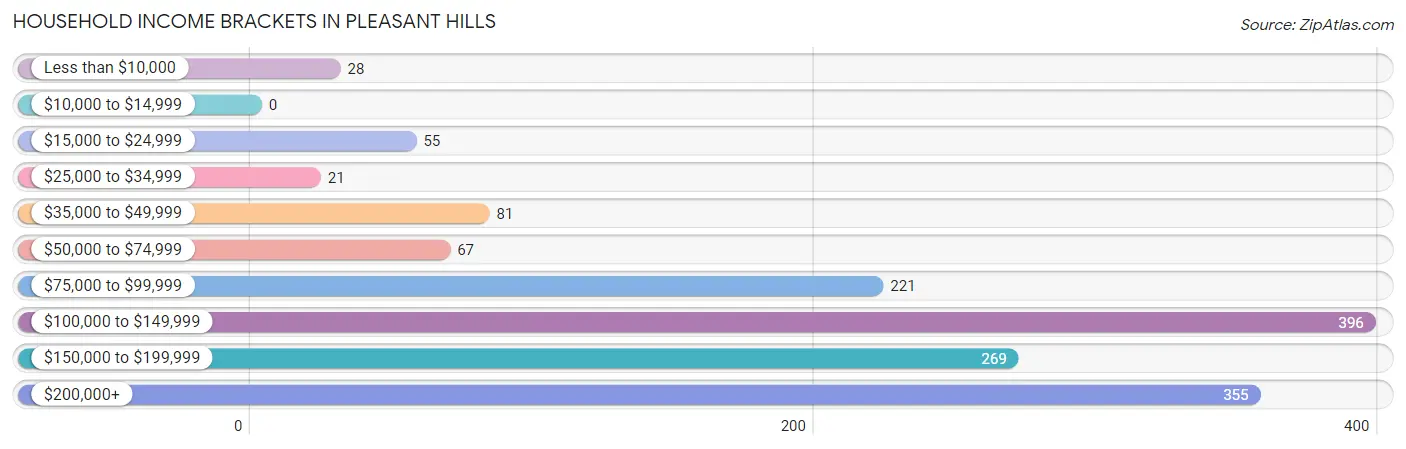
| Income Bracket | # Households | % Households |
| Less than $10,000 | 28 | 1.9% |
| $10,000 to $14,999 | 0 | 0.0% |
| $15,000 to $24,999 | 55 | 3.7% |
| $25,000 to $34,999 | 21 | 1.4% |
| $35,000 to $49,999 | 81 | 5.4% |
| $50,000 to $74,999 | 67 | 4.5% |
| $75,000 to $99,999 | 221 | 14.8% |
| $100,000 to $149,999 | 396 | 26.5% |
| $150,000 to $199,999 | 269 | 18.0% |
| $200,000+ | 355 | 23.8% |
Household Income by Householder Age in Pleasant Hills
The median household income in Pleasant Hills is $138,531, with the highest median household income of $174,464 found in the 25 to 44 years age bracket for the primary householder. A total of 352 households (23.6%) fall into this category.
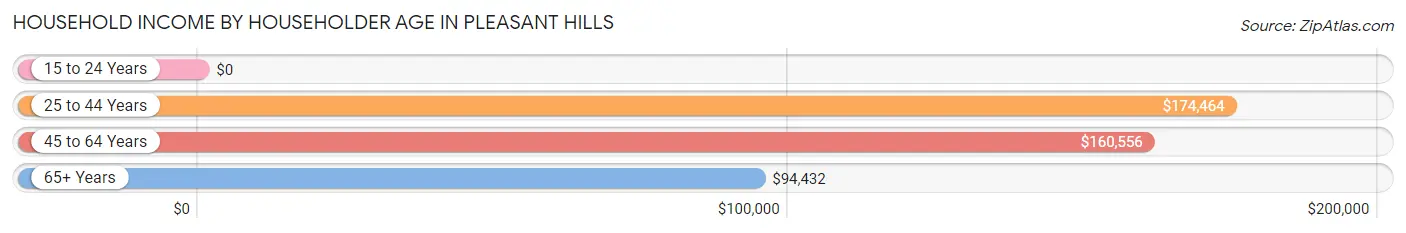
| Income Bracket | # Households | Median Income |
| 15 to 24 Years | 0 (0.0%) | $0 |
| 25 to 44 Years | 352 (23.6%) | $174,464 |
| 45 to 64 Years | 514 (34.4%) | $160,556 |
| 65+ Years | 627 (42.0%) | $94,432 |
| Total | 1,493 (100.0%) | $138,531 |
Poverty in Pleasant Hills
Income Below Poverty by Sex and Age in Pleasant Hills
With 2.9% poverty level for males and 2.0% for females among the residents of Pleasant Hills, 15 year old males and 25 to 34 year old females are the most vulnerable to poverty, with 9 males (100.0%) and 17 females (18.3%) in their respective age groups living below the poverty level.
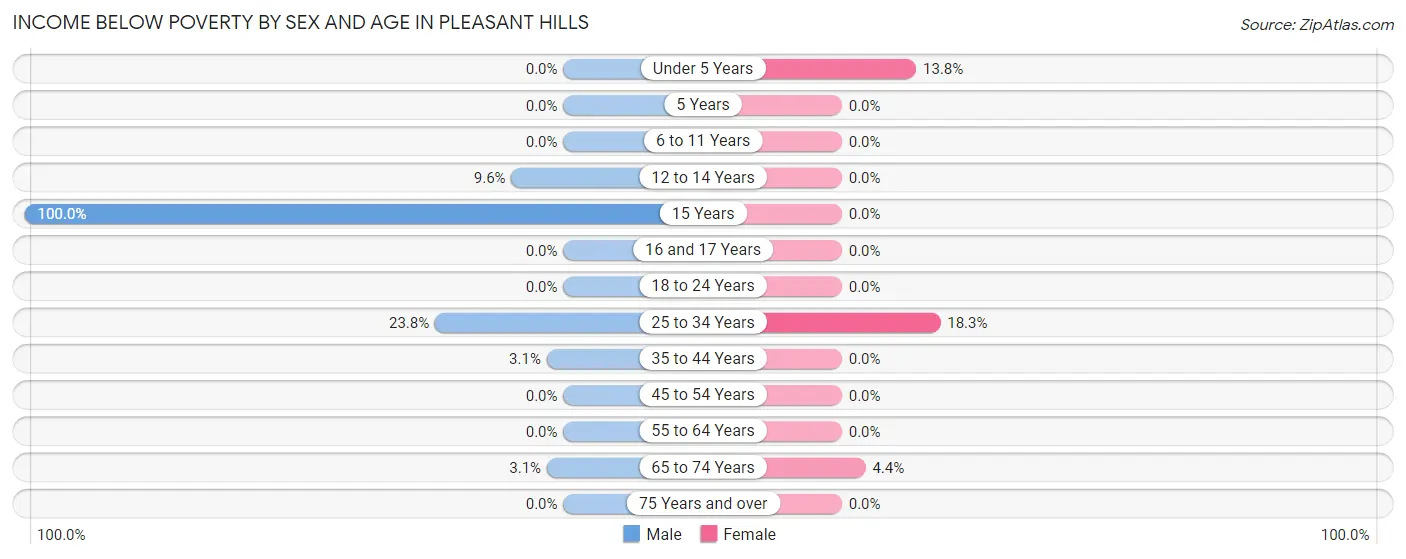
| Age Bracket | Male | Female |
| Under 5 Years | 0 (0.0%) | 8 (13.8%) |
| 5 Years | 0 (0.0%) | 0 (0.0%) |
| 6 to 11 Years | 0 (0.0%) | 0 (0.0%) |
| 12 to 14 Years | 8 (9.6%) | 0 (0.0%) |
| 15 Years | 9 (100.0%) | 0 (0.0%) |
| 16 and 17 Years | 0 (0.0%) | 0 (0.0%) |
| 18 to 24 Years | 0 (0.0%) | 0 (0.0%) |
| 25 to 34 Years | 20 (23.8%) | 17 (18.3%) |
| 35 to 44 Years | 12 (3.1%) | 0 (0.0%) |
| 45 to 54 Years | 0 (0.0%) | 0 (0.0%) |
| 55 to 64 Years | 0 (0.0%) | 0 (0.0%) |
| 65 to 74 Years | 8 (3.0%) | 15 (4.4%) |
| 75 Years and over | 0 (0.0%) | 0 (0.0%) |
| Total | 57 (2.9%) | 40 (2.0%) |
Income Above Poverty by Sex and Age in Pleasant Hills
According to the poverty statistics in Pleasant Hills, males aged under 5 years and females aged 5 years are the age groups that are most secure financially, with 100.0% of males and 100.0% of females in these age groups living above the poverty line.
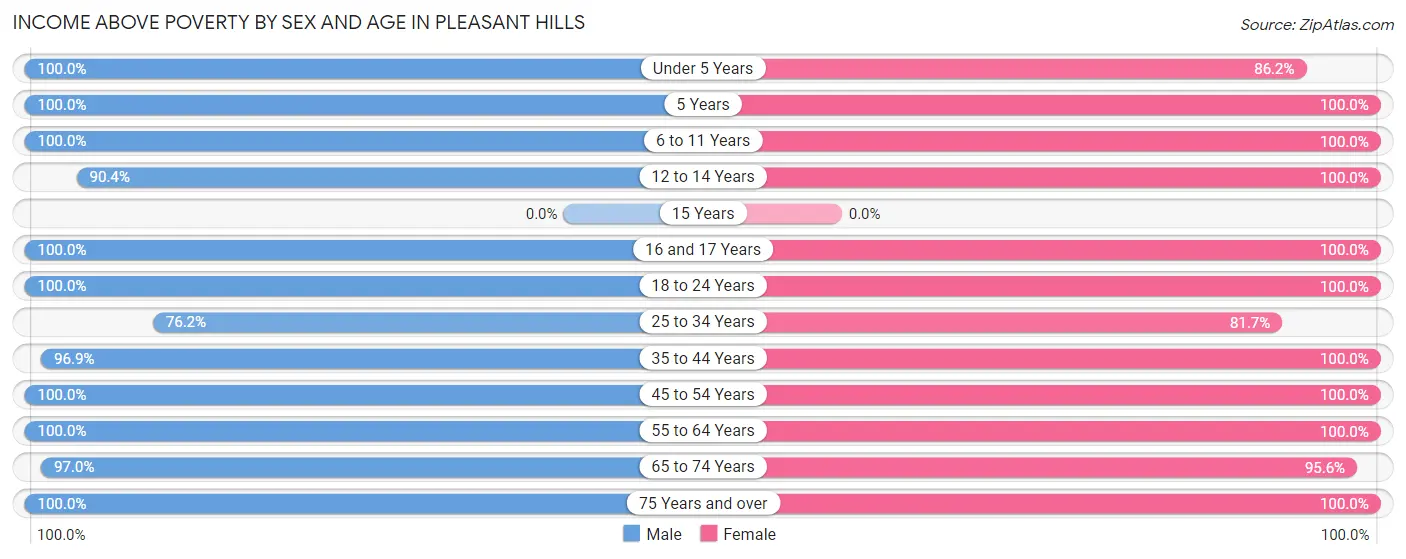
| Age Bracket | Male | Female |
| Under 5 Years | 97 (100.0%) | 50 (86.2%) |
| 5 Years | 44 (100.0%) | 29 (100.0%) |
| 6 to 11 Years | 170 (100.0%) | 208 (100.0%) |
| 12 to 14 Years | 75 (90.4%) | 81 (100.0%) |
| 15 Years | 0 (0.0%) | 0 (0.0%) |
| 16 and 17 Years | 33 (100.0%) | 47 (100.0%) |
| 18 to 24 Years | 136 (100.0%) | 84 (100.0%) |
| 25 to 34 Years | 64 (76.2%) | 76 (81.7%) |
| 35 to 44 Years | 378 (96.9%) | 295 (100.0%) |
| 45 to 54 Years | 254 (100.0%) | 190 (100.0%) |
| 55 to 64 Years | 282 (100.0%) | 296 (100.0%) |
| 65 to 74 Years | 254 (97.0%) | 327 (95.6%) |
| 75 Years and over | 121 (100.0%) | 237 (100.0%) |
| Total | 1,908 (97.1%) | 1,920 (98.0%) |
Income Below Poverty Among Married-Couple Families in Pleasant Hills
The poverty statistics for married-couple families in Pleasant Hills show that 1.9% or 20 of the total 1,024 families live below the poverty line. Families with 3 or 4 children have the highest poverty rate of 15.6%, comprising of 12 families. On the other hand, families with 1 or 2 children have the lowest poverty rate of 0.0%, which includes 0 families.
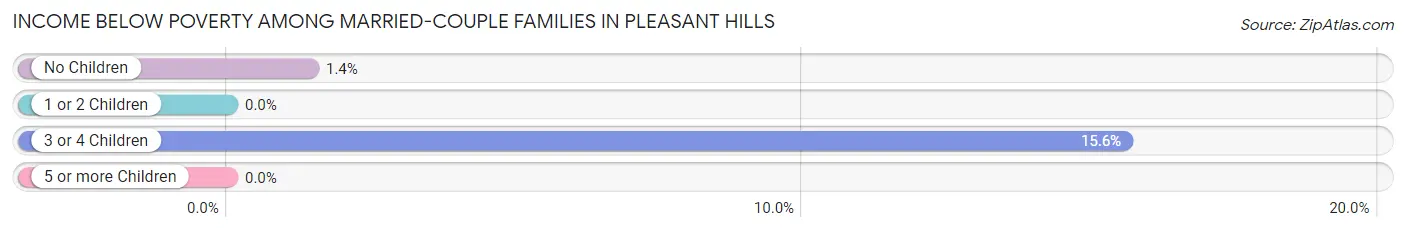
| Children | Above Poverty | Below Poverty |
| No Children | 560 (98.6%) | 8 (1.4%) |
| 1 or 2 Children | 379 (100.0%) | 0 (0.0%) |
| 3 or 4 Children | 65 (84.4%) | 12 (15.6%) |
| 5 or more Children | 0 (0.0%) | 0 (0.0%) |
| Total | 1,004 (98.1%) | 20 (1.9%) |
Income Below Poverty Among Single-Parent Households in Pleasant Hills
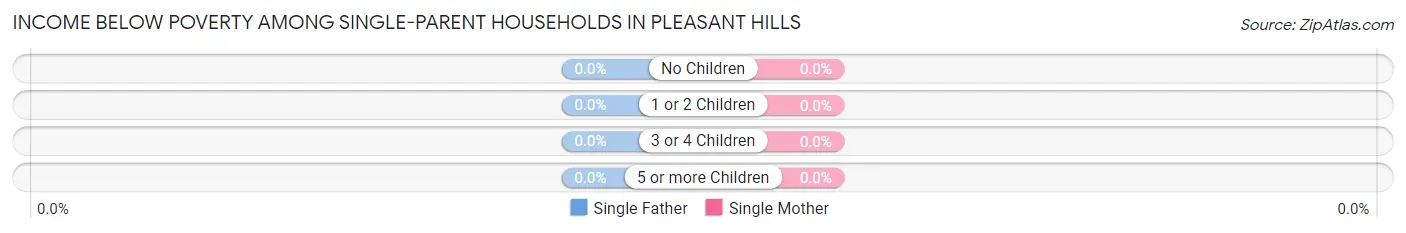
| Children | Single Father | Single Mother |
| No Children | 0 (0.0%) | 0 (0.0%) |
| 1 or 2 Children | 0 (0.0%) | 0 (0.0%) |
| 3 or 4 Children | 0 (0.0%) | 0 (0.0%) |
| 5 or more Children | 0 (0.0%) | 0 (0.0%) |
| Total | 0 (0.0%) | 0 (0.0%) |
Income Below Poverty Among Married-Couple vs Single-Parent Households in Pleasant Hills
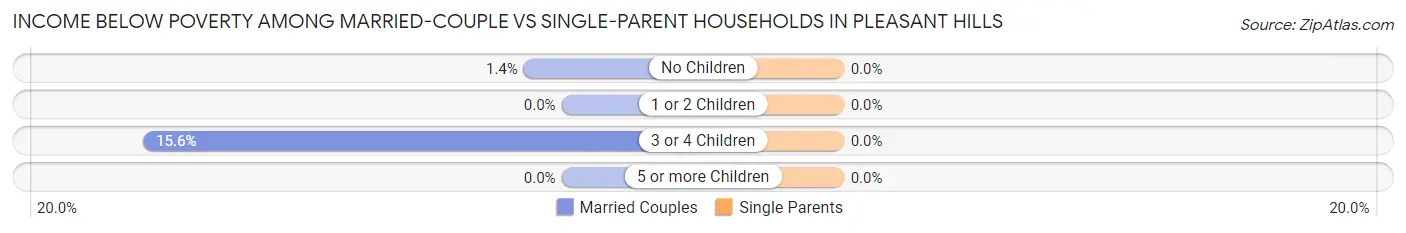
| Children | Married-Couple Families | Single-Parent Households |
| No Children | 8 (1.4%) | 0 (0.0%) |
| 1 or 2 Children | 0 (0.0%) | 0 (0.0%) |
| 3 or 4 Children | 12 (15.6%) | 0 (0.0%) |
| 5 or more Children | 0 (0.0%) | 0 (0.0%) |
| Total | 20 (1.9%) | 0 (0.0%) |
Race in Pleasant Hills
The most populous races in Pleasant Hills are White / Caucasian (3,384 | 86.2%), Asian (351 | 8.9%), and Hispanic or Latino (109 | 2.8%).
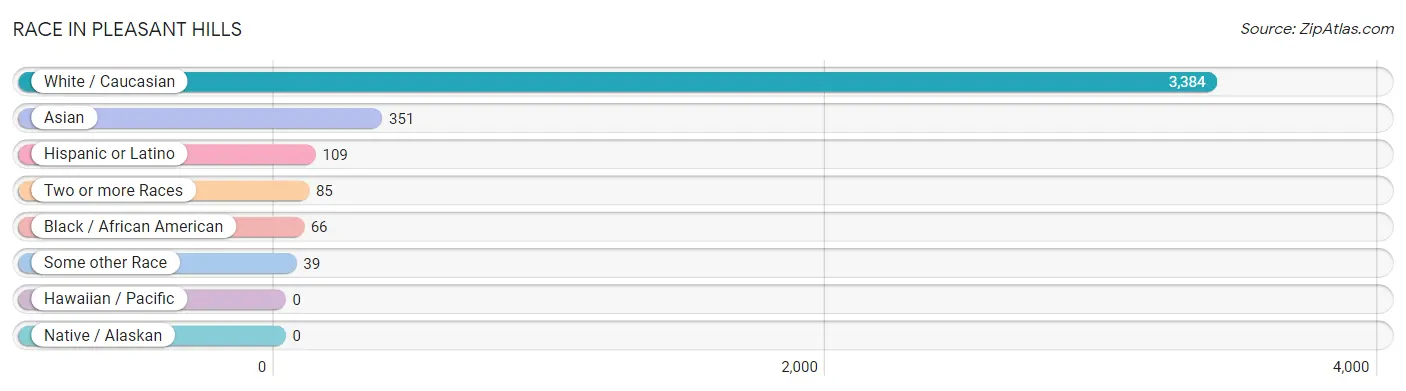
| Race | # Population | % Population |
| Asian | 351 | 8.9% |
| Black / African American | 66 | 1.7% |
| Hawaiian / Pacific | 0 | 0.0% |
| Hispanic or Latino | 109 | 2.8% |
| Native / Alaskan | 0 | 0.0% |
| White / Caucasian | 3,384 | 86.2% |
| Two or more Races | 85 | 2.2% |
| Some other Race | 39 | 1.0% |
| Total | 3,925 | 100.0% |
Ancestry in Pleasant Hills
The most populous ancestries reported in Pleasant Hills are German (1,040 | 26.5%), Irish (626 | 16.0%), Italian (503 | 12.8%), English (372 | 9.5%), and Polish (200 | 5.1%), together accounting for 69.9% of all Pleasant Hills residents.
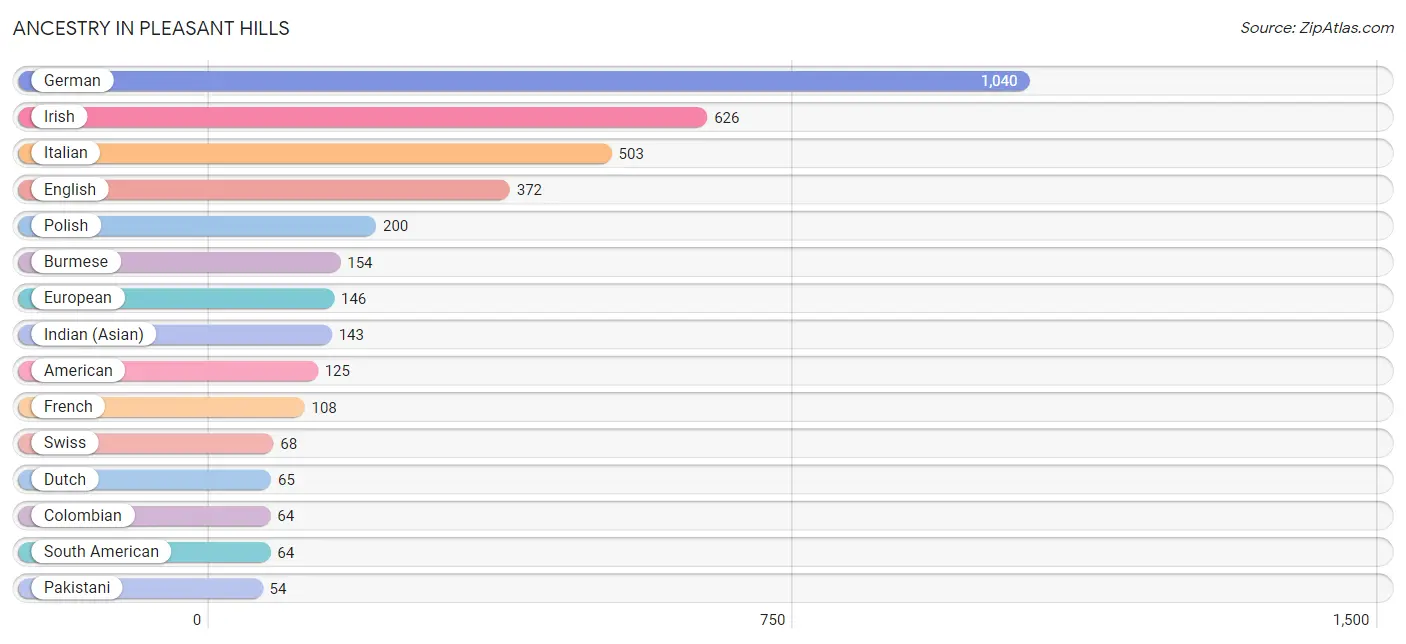
| Ancestry | # Population | % Population |
| American | 125 | 3.2% |
| Arab | 13 | 0.3% |
| Austrian | 20 | 0.5% |
| Belgian | 10 | 0.3% |
| Blackfeet | 32 | 0.8% |
| Brazilian | 10 | 0.3% |
| British | 25 | 0.6% |
| Burmese | 154 | 3.9% |
| Canadian | 9 | 0.2% |
| Cherokee | 9 | 0.2% |
| Colombian | 64 | 1.6% |
| Croatian | 8 | 0.2% |
| Cuban | 21 | 0.5% |
| Czech | 21 | 0.5% |
| Czechoslovakian | 6 | 0.2% |
| Dutch | 65 | 1.7% |
| English | 372 | 9.5% |
| European | 146 | 3.7% |
| Finnish | 27 | 0.7% |
| French | 108 | 2.8% |
| German | 1,040 | 26.5% |
| Greek | 35 | 0.9% |
| Hungarian | 9 | 0.2% |
| Indian (Asian) | 143 | 3.6% |
| Irish | 626 | 16.0% |
| Italian | 503 | 12.8% |
| Lithuanian | 22 | 0.6% |
| Northern European | 27 | 0.7% |
| Pakistani | 54 | 1.4% |
| Polish | 200 | 5.1% |
| Puerto Rican | 24 | 0.6% |
| Russian | 6 | 0.2% |
| Scottish | 38 | 1.0% |
| South American | 64 | 1.6% |
| Swedish | 10 | 0.3% |
| Swiss | 68 | 1.7% |
| Ukrainian | 28 | 0.7% |
| Welsh | 20 | 0.5% | View All 38 Rows |
Immigrants in Pleasant Hills
The most numerous immigrant groups reported in Pleasant Hills came from Asia (157 | 4.0%), Eastern Asia (136 | 3.5%), China (88 | 2.2%), Korea (48 | 1.2%), and Europe (30 | 0.8%), together accounting for 11.7% of all Pleasant Hills residents.
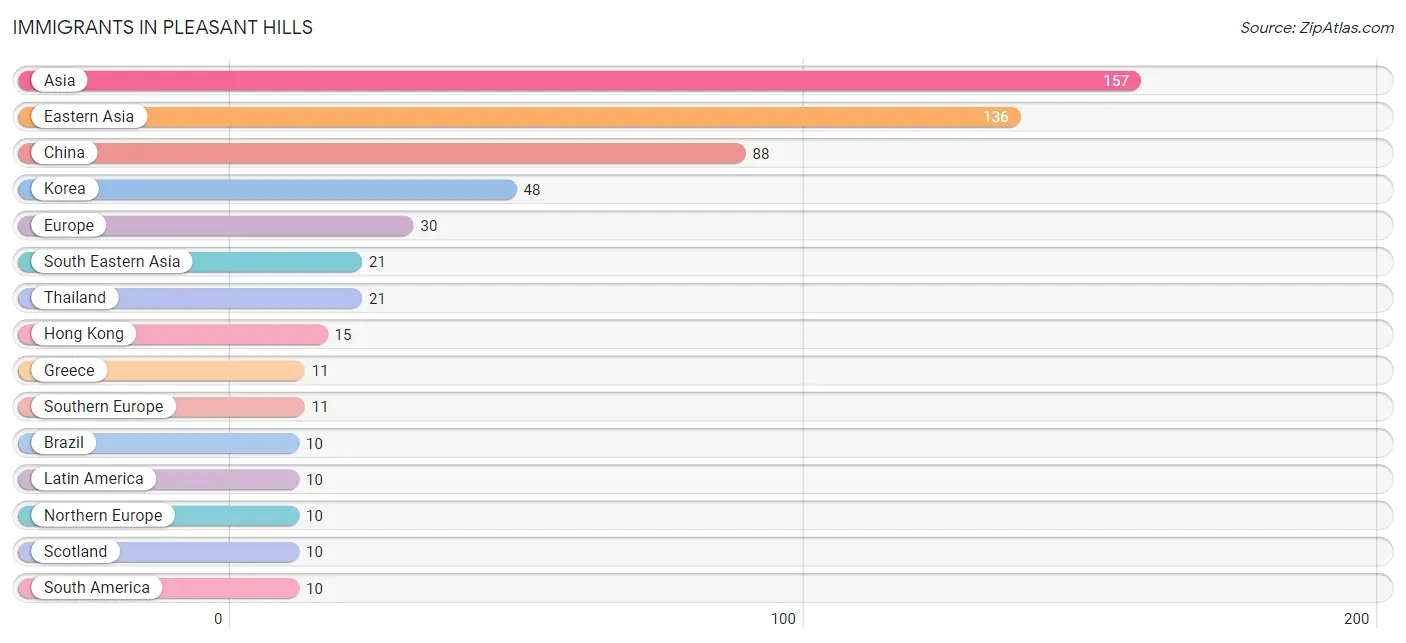
| Immigration Origin | # Population | % Population |
| Asia | 157 | 4.0% |
| Brazil | 10 | 0.3% |
| China | 88 | 2.2% |
| Eastern Asia | 136 | 3.5% |
| Eastern Europe | 9 | 0.2% |
| Europe | 30 | 0.8% |
| Greece | 11 | 0.3% |
| Hong Kong | 15 | 0.4% |
| Korea | 48 | 1.2% |
| Latin America | 10 | 0.3% |
| Northern Europe | 10 | 0.3% |
| Scotland | 10 | 0.3% |
| South America | 10 | 0.3% |
| South Eastern Asia | 21 | 0.5% |
| Southern Europe | 11 | 0.3% |
| Thailand | 21 | 0.5% |
| Ukraine | 9 | 0.2% | View All 17 Rows |
Sex and Age in Pleasant Hills
Sex and Age in Pleasant Hills
The most populous age groups in Pleasant Hills are 40 to 44 Years (263 | 13.4%) for men and 70 to 74 Years (206 | 10.5%) for women.
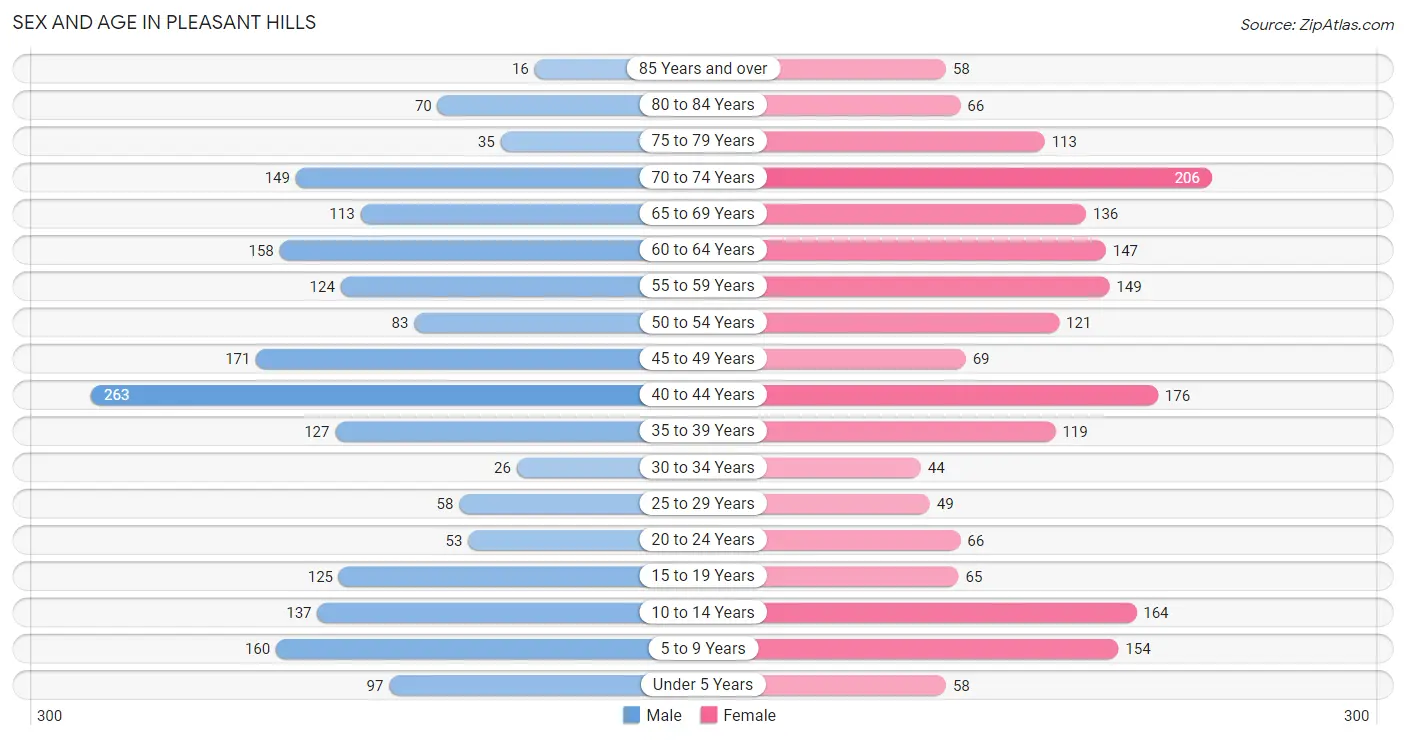
| Age Bracket | Male | Female |
| Under 5 Years | 97 (4.9%) | 58 (3.0%) |
| 5 to 9 Years | 160 (8.1%) | 154 (7.9%) |
| 10 to 14 Years | 137 (7.0%) | 164 (8.4%) |
| 15 to 19 Years | 125 (6.4%) | 65 (3.3%) |
| 20 to 24 Years | 53 (2.7%) | 66 (3.4%) |
| 25 to 29 Years | 58 (2.9%) | 49 (2.5%) |
| 30 to 34 Years | 26 (1.3%) | 44 (2.2%) |
| 35 to 39 Years | 127 (6.5%) | 119 (6.1%) |
| 40 to 44 Years | 263 (13.4%) | 176 (9.0%) |
| 45 to 49 Years | 171 (8.7%) | 69 (3.5%) |
| 50 to 54 Years | 83 (4.2%) | 121 (6.2%) |
| 55 to 59 Years | 124 (6.3%) | 149 (7.6%) |
| 60 to 64 Years | 158 (8.0%) | 147 (7.5%) |
| 65 to 69 Years | 113 (5.8%) | 136 (6.9%) |
| 70 to 74 Years | 149 (7.6%) | 206 (10.5%) |
| 75 to 79 Years | 35 (1.8%) | 113 (5.8%) |
| 80 to 84 Years | 70 (3.6%) | 66 (3.4%) |
| 85 Years and over | 16 (0.8%) | 58 (3.0%) |
| Total | 1,965 (100.0%) | 1,960 (100.0%) |
Families and Households in Pleasant Hills
Median Family Size in Pleasant Hills
The median family size in Pleasant Hills is 3.14 persons per family, with single female/mother families (49 | 4.5%) accounting for the largest median family size of 3.65 persons per family. On the other hand, single male/father families (17 | 1.6%) represent the smallest median family size with 2.12 persons per family.
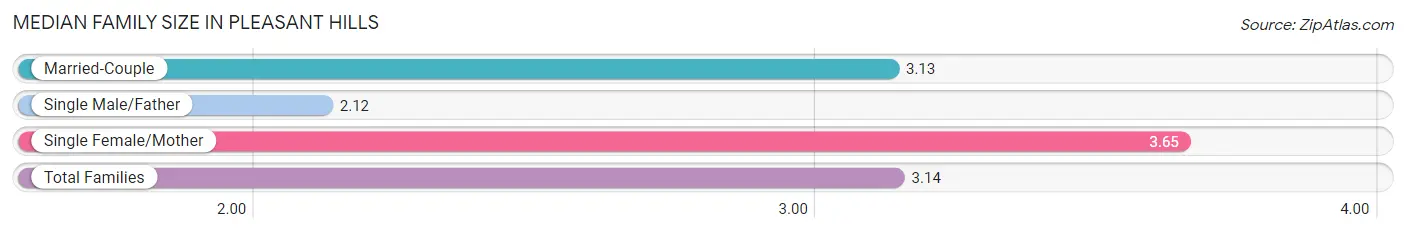
| Family Type | # Families | Family Size |
| Married-Couple | 1,024 (93.9%) | 3.13 |
| Single Male/Father | 17 (1.6%) | 2.12 |
| Single Female/Mother | 49 (4.5%) | 3.65 |
| Total Families | 1,090 (100.0%) | 3.14 |
Median Household Size in Pleasant Hills
The median household size in Pleasant Hills is 2.63 persons per household, with single female/mother households (49 | 3.3%) accounting for the largest median household size of 4.27 persons per household. non-family households (403 | 27.0%) represent the smallest median household size with 1.11 persons per household.
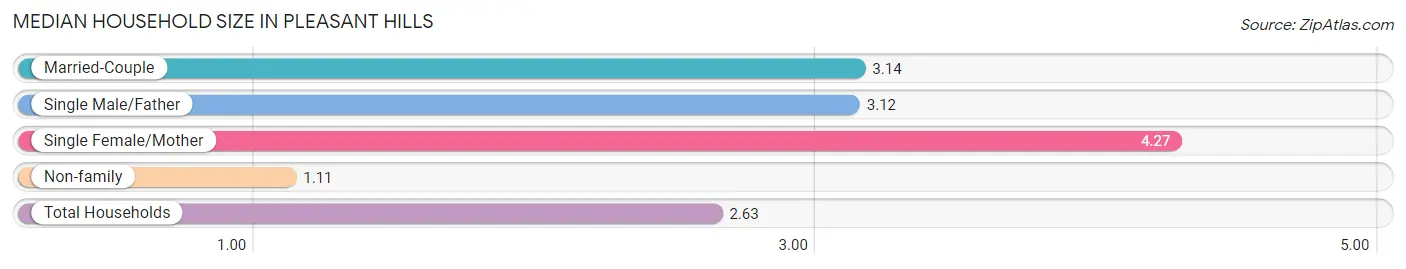
| Household Type | # Households | Household Size |
| Married-Couple | 1,024 (68.6%) | 3.14 |
| Single Male/Father | 17 (1.1%) | 3.12 |
| Single Female/Mother | 49 (3.3%) | 4.27 |
| Non-family | 403 (27.0%) | 1.11 |
| Total Households | 1,493 (100.0%) | 2.63 |
Household Size by Marriage Status in Pleasant Hills
Out of a total of 1,493 households in Pleasant Hills, 1,090 (73.0%) are family households, while 403 (27.0%) are nonfamily households. The most numerous type of family households are 2-person households, comprising 450, and the most common type of nonfamily households are 1-person households, comprising 354.
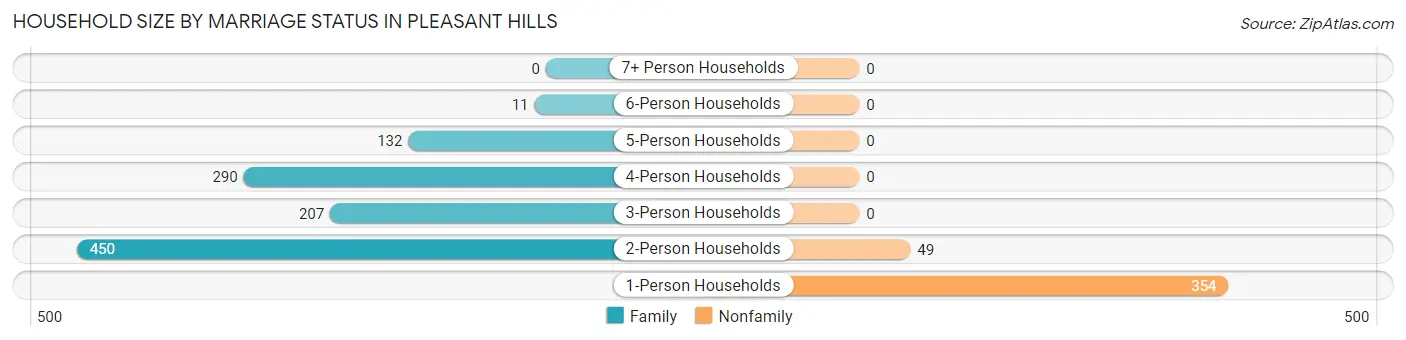
| Household Size | Family Households | Nonfamily Households |
| 1-Person Households | - | 354 (23.7%) |
| 2-Person Households | 450 (30.1%) | 49 (3.3%) |
| 3-Person Households | 207 (13.9%) | 0 (0.0%) |
| 4-Person Households | 290 (19.4%) | 0 (0.0%) |
| 5-Person Households | 132 (8.8%) | 0 (0.0%) |
| 6-Person Households | 11 (0.7%) | 0 (0.0%) |
| 7+ Person Households | 0 (0.0%) | 0 (0.0%) |
| Total | 1,090 (73.0%) | 403 (27.0%) |
Female Fertility in Pleasant Hills
Fertility by Age in Pleasant Hills
Average fertility rate in Pleasant Hills is 39.0 births per 1,000 women. Women in the age bracket of 35 to 50 years have the highest fertility rate with 61.0 births per 1,000 women. Women in the age bracket of 35 to 50 years acount for 100.0% of all women with births.
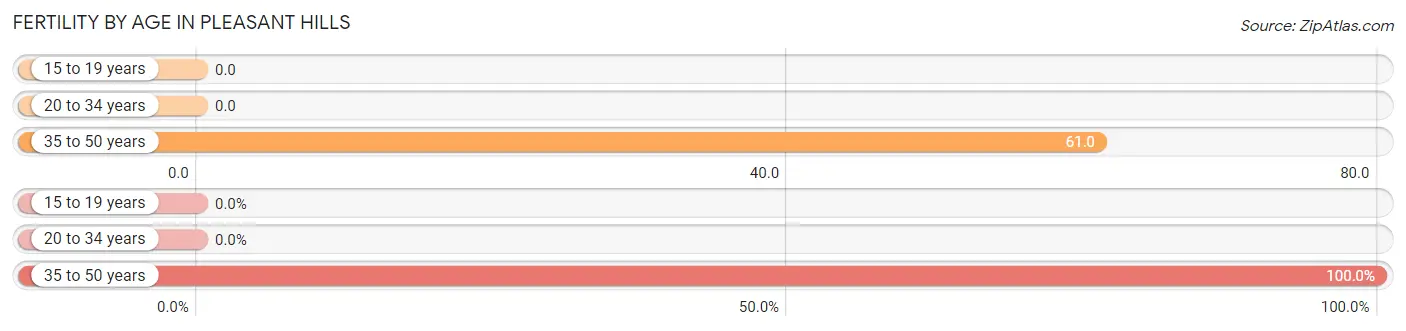
| Age Bracket | Women with Births | Births / 1,000 Women |
| 15 to 19 years | 0 (0.0%) | 0.0 |
| 20 to 34 years | 0 (0.0%) | 0.0 |
| 35 to 50 years | 24 (100.0%) | 61.0 |
| Total | 24 (100.0%) | 39.0 |
Fertility by Age by Marriage Status in Pleasant Hills
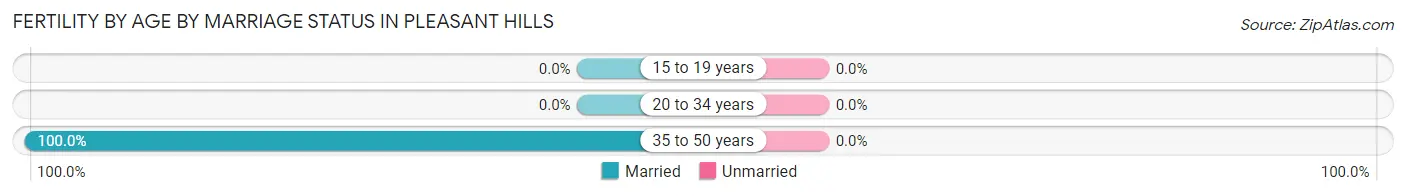
| Age Bracket | Married | Unmarried |
| 15 to 19 years | 0 (0.0%) | 0 (0.0%) |
| 20 to 34 years | 0 (0.0%) | 0 (0.0%) |
| 35 to 50 years | 24 (100.0%) | 0 (0.0%) |
| Total | 24 (100.0%) | 0 (0.0%) |
Fertility by Education in Pleasant Hills
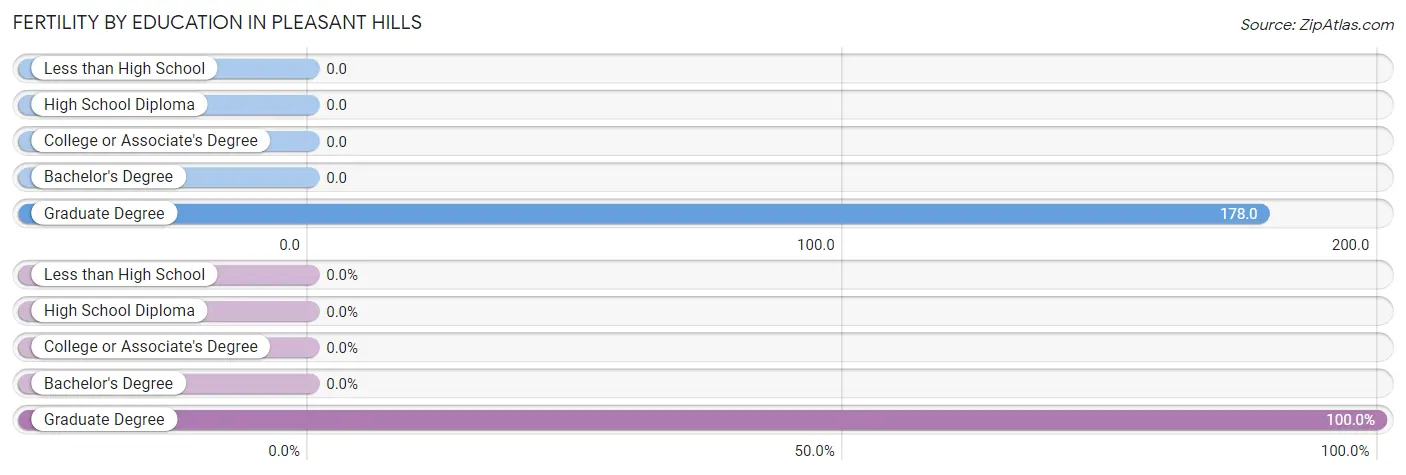
| Educational Attainment | Women with Births | Births / 1,000 Women |
| Less than High School | 0 (0.0%) | 0.0 |
| High School Diploma | 0 (0.0%) | 0.0 |
| College or Associate's Degree | 0 (0.0%) | 0.0 |
| Bachelor's Degree | 0 (0.0%) | 0.0 |
| Graduate Degree | 24 (100.0%) | 178.0 |
| Total | 24 (100.0%) | 39.0 |
Fertility by Education by Marriage Status in Pleasant Hills
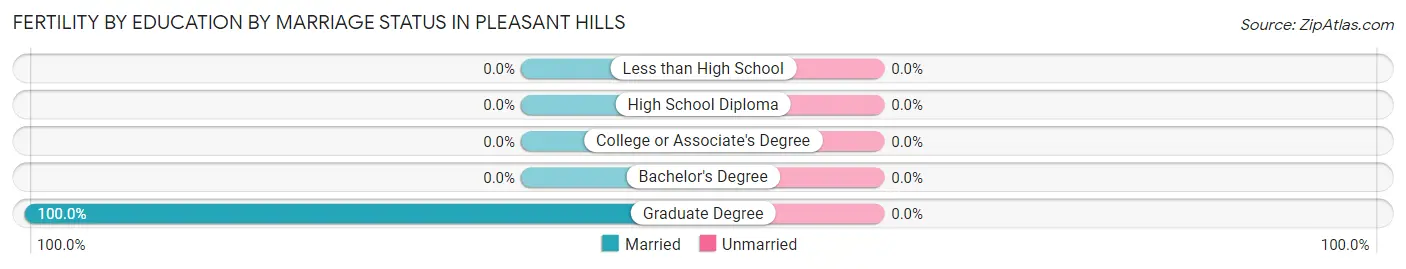
| Educational Attainment | Married | Unmarried |
| Less than High School | 0 (0.0%) | 0 (0.0%) |
| High School Diploma | 0 (0.0%) | 0 (0.0%) |
| College or Associate's Degree | 0 (0.0%) | 0 (0.0%) |
| Bachelor's Degree | 0 (0.0%) | 0 (0.0%) |
| Graduate Degree | 24 (100.0%) | 0 (0.0%) |
| Total | 24 (100.0%) | 0 (0.0%) |
Employment Characteristics in Pleasant Hills
Employment by Class of Employer in Pleasant Hills
Among the 1,930 employed individuals in Pleasant Hills, private company employees (1,179 | 61.1%), federal government employees (238 | 12.3%), and local government employees (143 | 7.4%) make up the most common classes of employment.
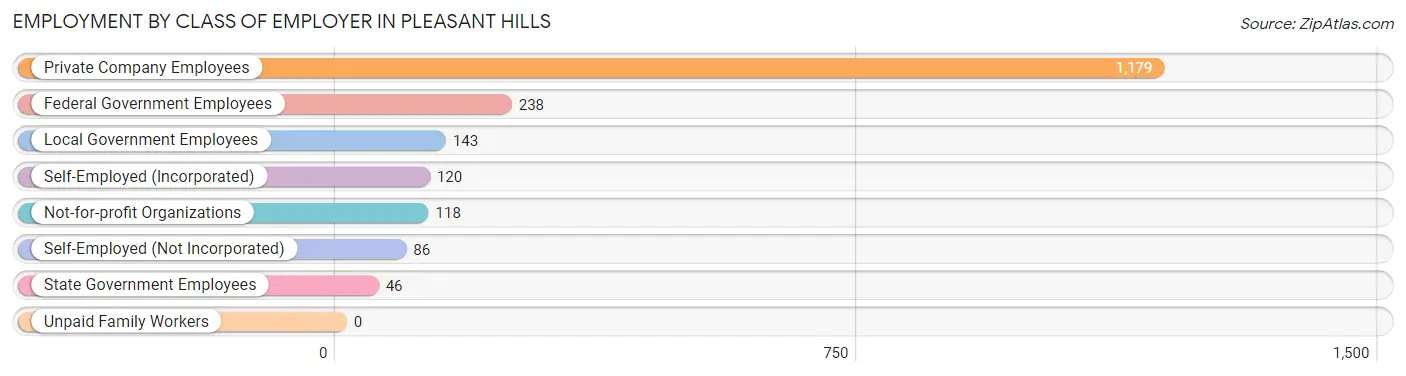
| Employer Class | # Employees | % Employees |
| Private Company Employees | 1,179 | 61.1% |
| Self-Employed (Incorporated) | 120 | 6.2% |
| Self-Employed (Not Incorporated) | 86 | 4.5% |
| Not-for-profit Organizations | 118 | 6.1% |
| Local Government Employees | 143 | 7.4% |
| State Government Employees | 46 | 2.4% |
| Federal Government Employees | 238 | 12.3% |
| Unpaid Family Workers | 0 | 0.0% |
| Total | 1,930 | 100.0% |
Employment Status by Age in Pleasant Hills
According to the labor force statistics for Pleasant Hills, out of the total population over 16 years of age (3,146), 63.5% or 1,998 individuals are in the labor force, with 2.5% or 50 of them unemployed. The age group with the highest labor force participation rate is 25 to 29 years, with 100.0% or 107 individuals in the labor force. Within the labor force, the 65 to 74 years age range has the highest percentage of unemployed individuals, with 14.5% or 24 of them being unemployed.
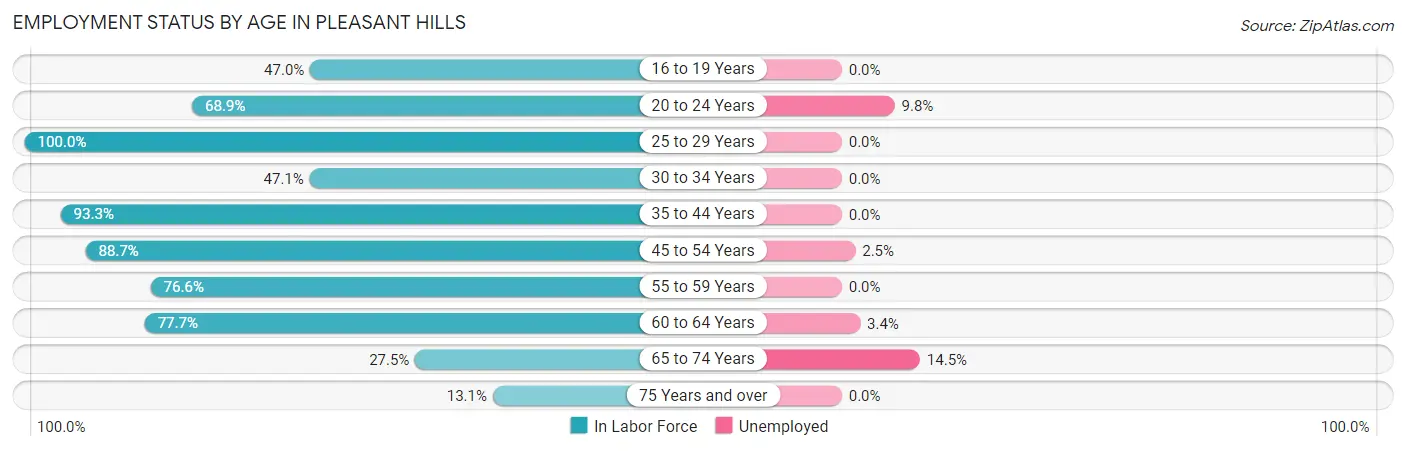
| Age Bracket | In Labor Force | Unemployed |
| 16 to 19 Years | 85 (47.0%) | 0 (0.0%) |
| 20 to 24 Years | 82 (68.9%) | 8 (9.8%) |
| 25 to 29 Years | 107 (100.0%) | 0 (0.0%) |
| 30 to 34 Years | 33 (47.1%) | 0 (0.0%) |
| 35 to 44 Years | 639 (93.3%) | 0 (0.0%) |
| 45 to 54 Years | 394 (88.7%) | 10 (2.5%) |
| 55 to 59 Years | 209 (76.6%) | 0 (0.0%) |
| 60 to 64 Years | 237 (77.7%) | 8 (3.4%) |
| 65 to 74 Years | 166 (27.5%) | 24 (14.5%) |
| 75 Years and over | 47 (13.1%) | 0 (0.0%) |
| Total | 1,998 (63.5%) | 50 (2.5%) |
Employment Status by Educational Attainment in Pleasant Hills
According to labor force statistics for Pleasant Hills, 85.9% of individuals (1,618) out of the total population between 25 and 64 years of age (1,884) are in the labor force, with 1.1% or 18 of them being unemployed. The group with the highest labor force participation rate are those with the educational attainment of bachelor's degree or higher, with 88.0% or 977 individuals in the labor force. Within the labor force, individuals with bachelor's degree or higher education have the highest percentage of unemployment, with 1.9% or 19 of them being unemployed.
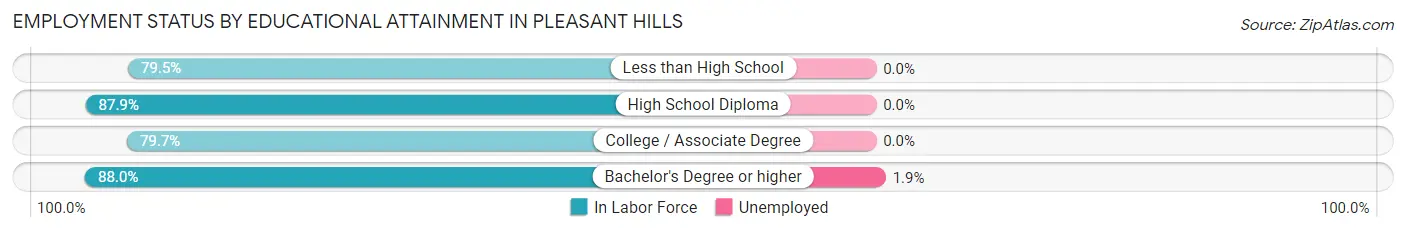
| Educational Attainment | In Labor Force | Unemployed |
| Less than High School | 31 (79.5%) | 0 (0.0%) |
| High School Diploma | 270 (87.9%) | 0 (0.0%) |
| College / Associate Degree | 341 (79.7%) | 0 (0.0%) |
| Bachelor's Degree or higher | 977 (88.0%) | 21 (1.9%) |
| Total | 1,618 (85.9%) | 21 (1.1%) |
Employment Occupations by Sex in Pleasant Hills
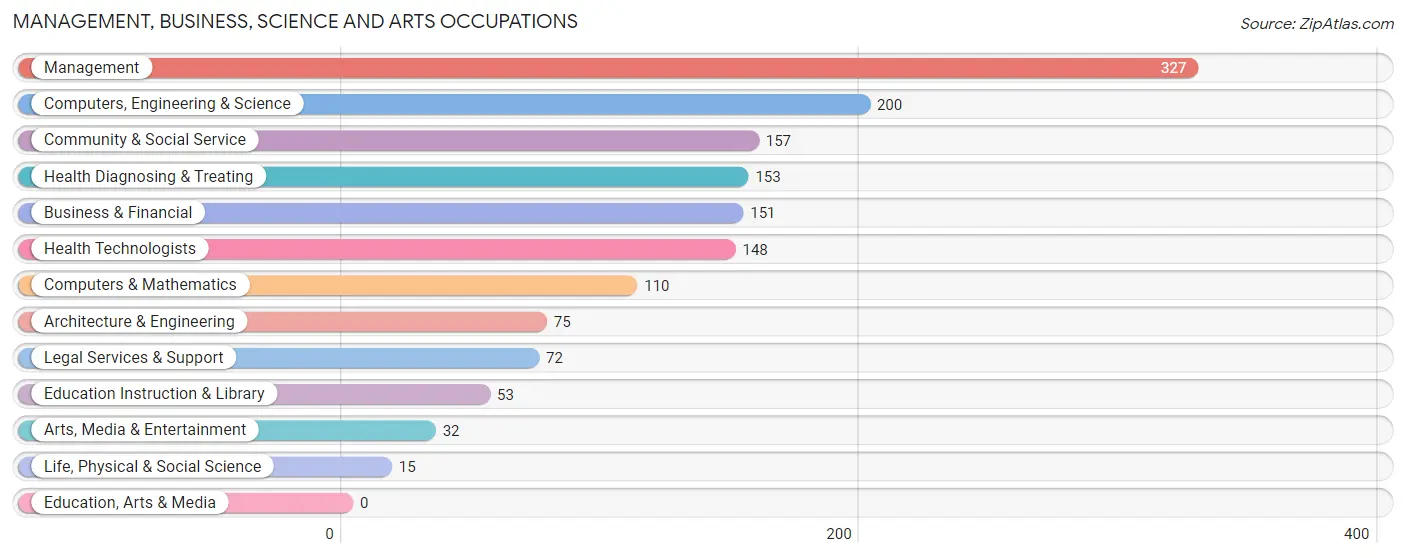
Management, Business, Science and Arts Occupations
The most common Management, Business, Science and Arts occupations in Pleasant Hills are Management (327 | 16.9%), Computers, Engineering & Science (200 | 10.3%), Community & Social Service (157 | 8.1%), Health Diagnosing & Treating (153 | 7.9%), and Business & Financial (151 | 7.8%).
Management, Business, Science and Arts Occupations by Sex
Within the Management, Business, Science and Arts occupations in Pleasant Hills, the most male-oriented occupations are Computers & Mathematics (90.9%), Computers, Engineering & Science (75.5%), and Life, Physical & Social Science (66.7%), while the most female-oriented occupations are Health Diagnosing & Treating (90.8%), Health Technologists (90.5%), and Education Instruction & Library (83.0%).
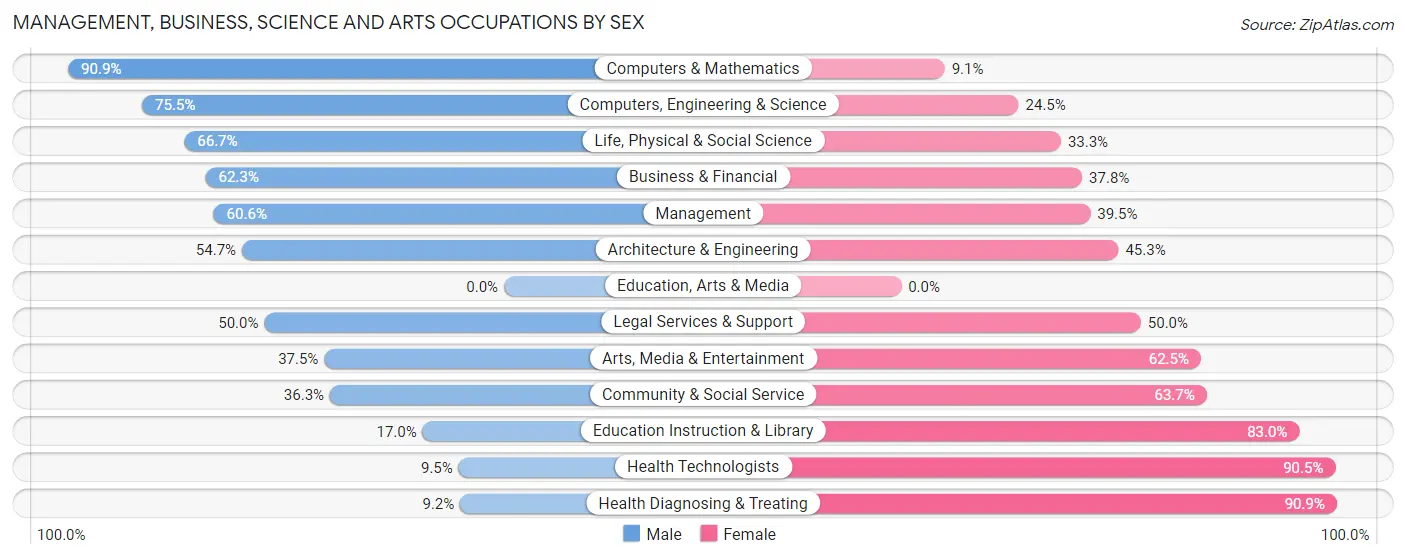
| Occupation | Male | Female |
| Management | 198 (60.6%) | 129 (39.5%) |
| Business & Financial | 94 (62.3%) | 57 (37.8%) |
| Computers, Engineering & Science | 151 (75.5%) | 49 (24.5%) |
| Computers & Mathematics | 100 (90.9%) | 10 (9.1%) |
| Architecture & Engineering | 41 (54.7%) | 34 (45.3%) |
| Life, Physical & Social Science | 10 (66.7%) | 5 (33.3%) |
| Community & Social Service | 57 (36.3%) | 100 (63.7%) |
| Education, Arts & Media | 0 (0.0%) | 0 (0.0%) |
| Legal Services & Support | 36 (50.0%) | 36 (50.0%) |
| Education Instruction & Library | 9 (17.0%) | 44 (83.0%) |
| Arts, Media & Entertainment | 12 (37.5%) | 20 (62.5%) |
| Health Diagnosing & Treating | 14 (9.1%) | 139 (90.8%) |
| Health Technologists | 14 (9.5%) | 134 (90.5%) |
| Total (Category) | 514 (52.0%) | 474 (48.0%) |
| Total (Overall) | 1,142 (58.9%) | 798 (41.1%) |
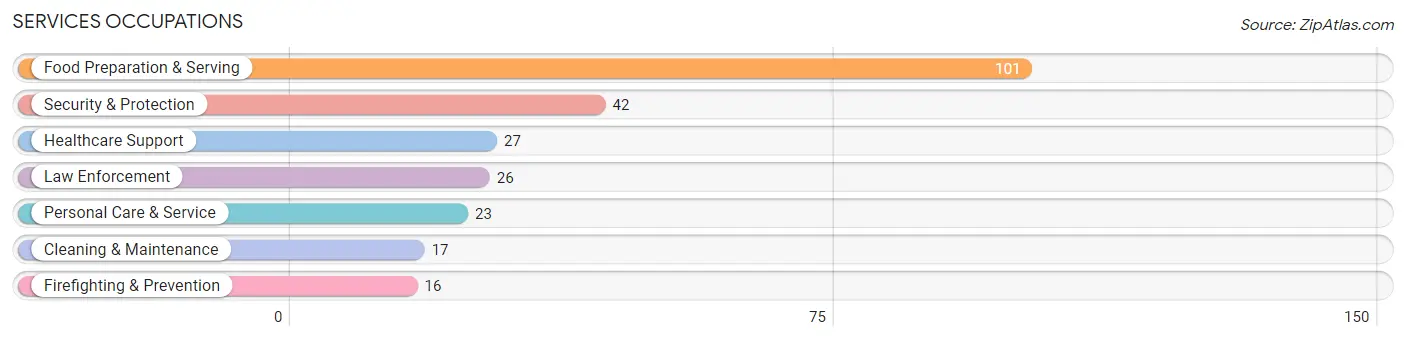
Services Occupations
The most common Services occupations in Pleasant Hills are Food Preparation & Serving (101 | 5.2%), Security & Protection (42 | 2.2%), Healthcare Support (27 | 1.4%), Law Enforcement (26 | 1.3%), and Personal Care & Service (23 | 1.2%).
Services Occupations by Sex
Within the Services occupations in Pleasant Hills, the most male-oriented occupations are Security & Protection (100.0%), Firefighting & Prevention (100.0%), and Law Enforcement (100.0%), while the most female-oriented occupations are Personal Care & Service (100.0%), Healthcare Support (51.8%), and Cleaning & Maintenance (47.1%).
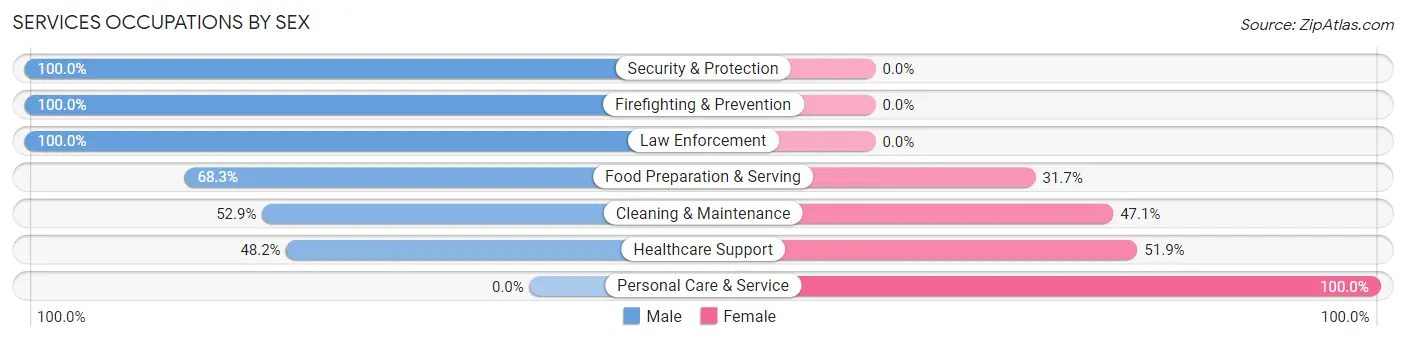
| Occupation | Male | Female |
| Healthcare Support | 13 (48.1%) | 14 (51.8%) |
| Security & Protection | 42 (100.0%) | 0 (0.0%) |
| Firefighting & Prevention | 16 (100.0%) | 0 (0.0%) |
| Law Enforcement | 26 (100.0%) | 0 (0.0%) |
| Food Preparation & Serving | 69 (68.3%) | 32 (31.7%) |
| Cleaning & Maintenance | 9 (52.9%) | 8 (47.1%) |
| Personal Care & Service | 0 (0.0%) | 23 (100.0%) |
| Total (Category) | 133 (63.3%) | 77 (36.7%) |
| Total (Overall) | 1,142 (58.9%) | 798 (41.1%) |
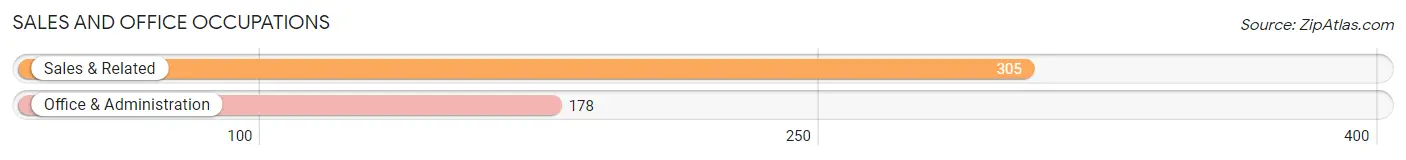
Sales and Office Occupations
The most common Sales and Office occupations in Pleasant Hills are Sales & Related (305 | 15.7%), and Office & Administration (178 | 9.2%).
Sales and Office Occupations by Sex
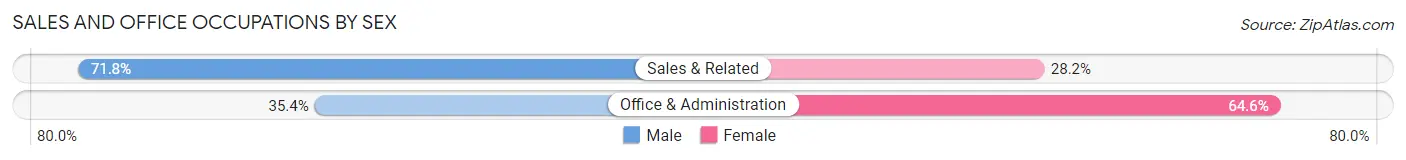
| Occupation | Male | Female |
| Sales & Related | 219 (71.8%) | 86 (28.2%) |
| Office & Administration | 63 (35.4%) | 115 (64.6%) |
| Total (Category) | 282 (58.4%) | 201 (41.6%) |
| Total (Overall) | 1,142 (58.9%) | 798 (41.1%) |
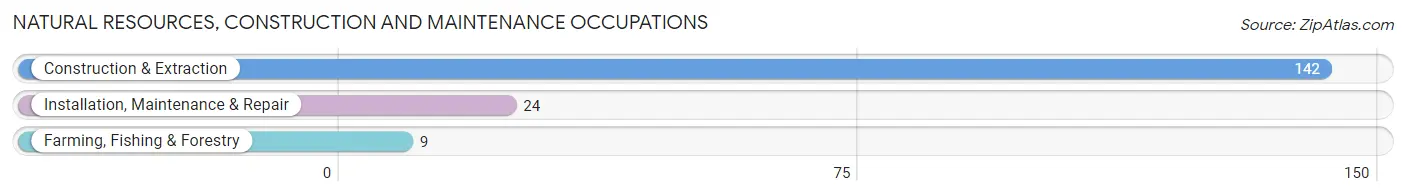
Natural Resources, Construction and Maintenance Occupations
The most common Natural Resources, Construction and Maintenance occupations in Pleasant Hills are Construction & Extraction (142 | 7.3%), Installation, Maintenance & Repair (24 | 1.2%), and Farming, Fishing & Forestry (9 | 0.5%).
Natural Resources, Construction and Maintenance Occupations by Sex
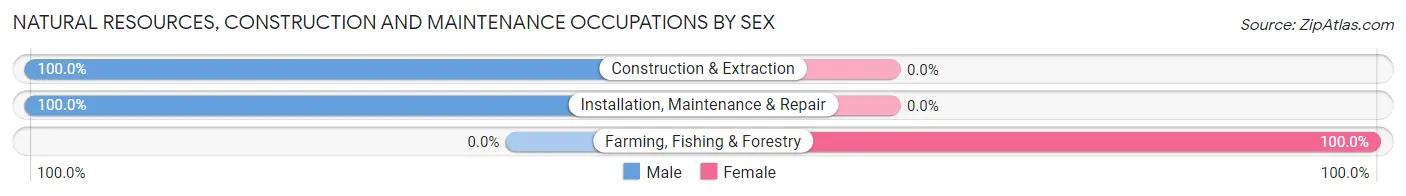
| Occupation | Male | Female |
| Farming, Fishing & Forestry | 0 (0.0%) | 9 (100.0%) |
| Construction & Extraction | 142 (100.0%) | 0 (0.0%) |
| Installation, Maintenance & Repair | 24 (100.0%) | 0 (0.0%) |
| Total (Category) | 166 (94.9%) | 9 (5.1%) |
| Total (Overall) | 1,142 (58.9%) | 798 (41.1%) |
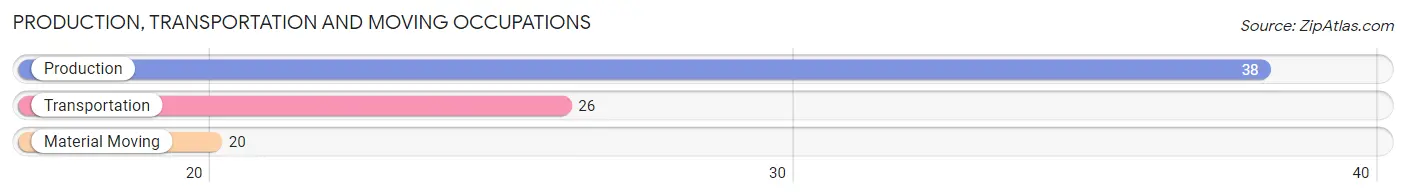
Production, Transportation and Moving Occupations
The most common Production, Transportation and Moving occupations in Pleasant Hills are Production (38 | 2.0%), Transportation (26 | 1.3%), and Material Moving (20 | 1.0%).
Production, Transportation and Moving Occupations by Sex
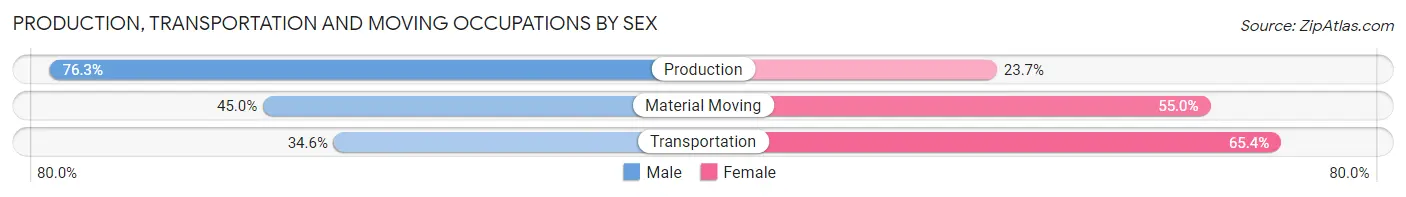
| Occupation | Male | Female |
| Production | 29 (76.3%) | 9 (23.7%) |
| Transportation | 9 (34.6%) | 17 (65.4%) |
| Material Moving | 9 (45.0%) | 11 (55.0%) |
| Total (Category) | 47 (55.9%) | 37 (44.1%) |
| Total (Overall) | 1,142 (58.9%) | 798 (41.1%) |
Employment Industries by Sex in Pleasant Hills
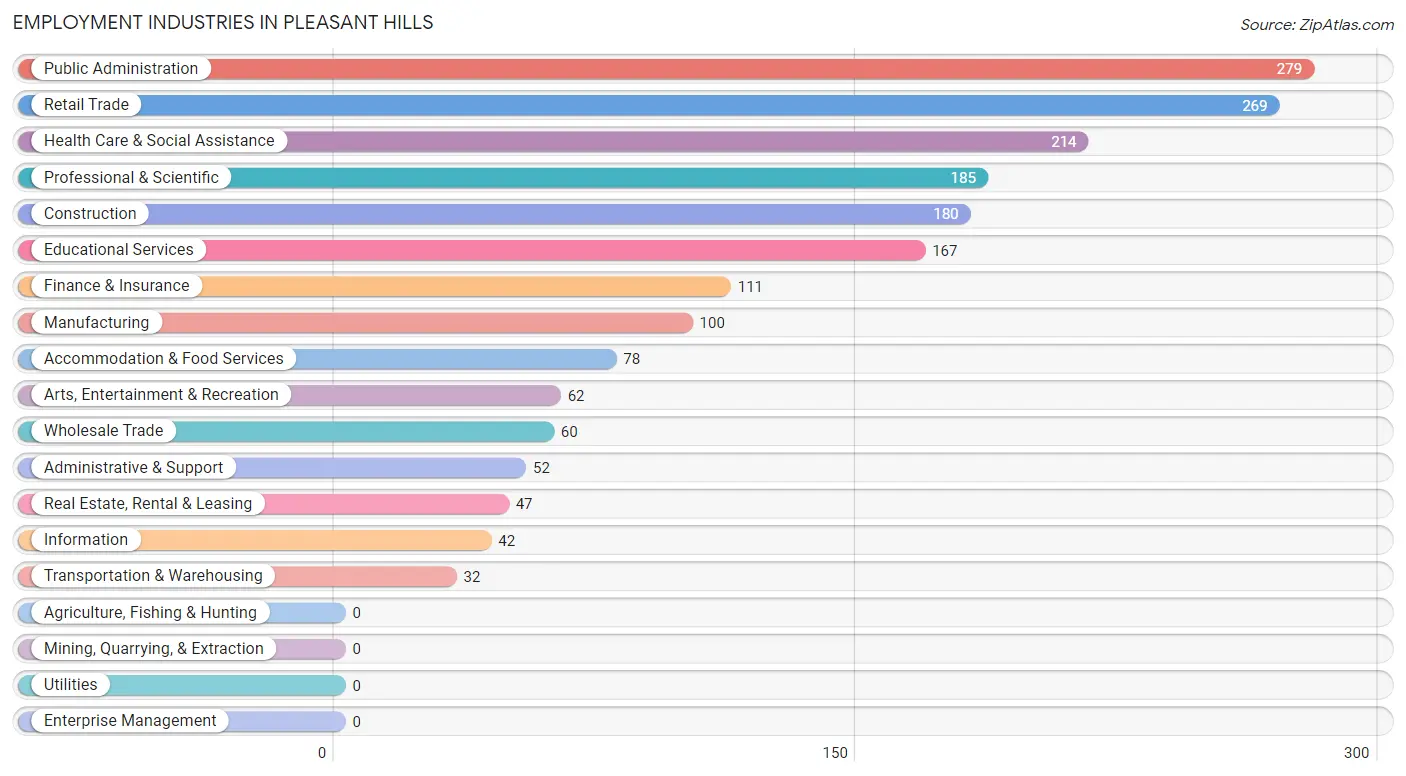
Employment Industries in Pleasant Hills
The major employment industries in Pleasant Hills include Public Administration (279 | 14.4%), Retail Trade (269 | 13.9%), Health Care & Social Assistance (214 | 11.0%), Professional & Scientific (185 | 9.5%), and Construction (180 | 9.3%).
Employment Industries by Sex in Pleasant Hills
The Pleasant Hills industries that see more men than women are Construction (100.0%), Wholesale Trade (100.0%), and Accommodation & Food Services (88.5%), whereas the industries that tend to have a higher number of women are Information (100.0%), Educational Services (85.6%), and Health Care & Social Assistance (76.6%).
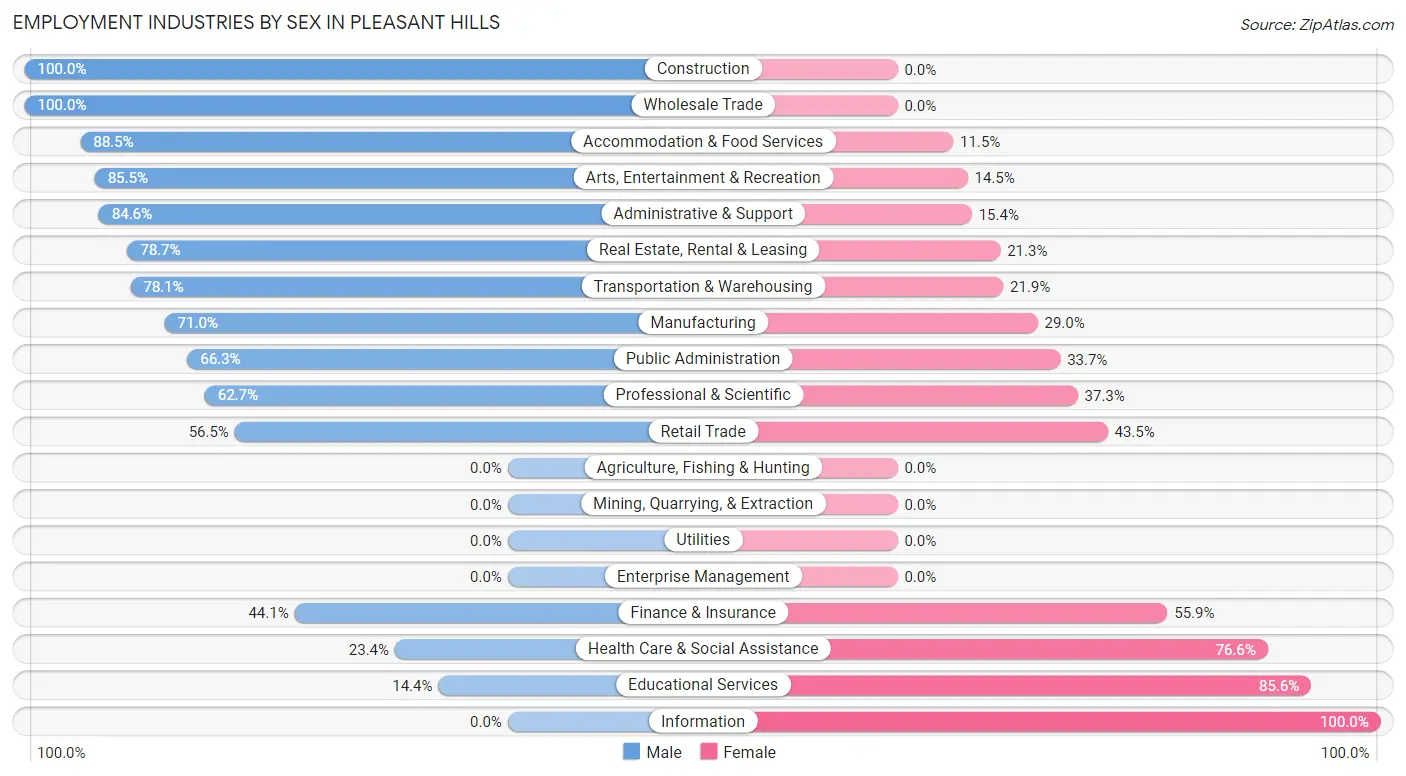
| Industry | Male | Female |
| Agriculture, Fishing & Hunting | 0 (0.0%) | 0 (0.0%) |
| Mining, Quarrying, & Extraction | 0 (0.0%) | 0 (0.0%) |
| Construction | 180 (100.0%) | 0 (0.0%) |
| Manufacturing | 71 (71.0%) | 29 (29.0%) |
| Wholesale Trade | 60 (100.0%) | 0 (0.0%) |
| Retail Trade | 152 (56.5%) | 117 (43.5%) |
| Transportation & Warehousing | 25 (78.1%) | 7 (21.9%) |
| Utilities | 0 (0.0%) | 0 (0.0%) |
| Information | 0 (0.0%) | 42 (100.0%) |
| Finance & Insurance | 49 (44.1%) | 62 (55.9%) |
| Real Estate, Rental & Leasing | 37 (78.7%) | 10 (21.3%) |
| Professional & Scientific | 116 (62.7%) | 69 (37.3%) |
| Enterprise Management | 0 (0.0%) | 0 (0.0%) |
| Administrative & Support | 44 (84.6%) | 8 (15.4%) |
| Educational Services | 24 (14.4%) | 143 (85.6%) |
| Health Care & Social Assistance | 50 (23.4%) | 164 (76.6%) |
| Arts, Entertainment & Recreation | 53 (85.5%) | 9 (14.5%) |
| Accommodation & Food Services | 69 (88.5%) | 9 (11.5%) |
| Public Administration | 185 (66.3%) | 94 (33.7%) |
| Total | 1,142 (58.9%) | 798 (41.1%) |
Education in Pleasant Hills
School Enrollment in Pleasant Hills
The most common levels of schooling among the 932 students in Pleasant Hills are elementary school (277 | 29.7%), middle school (213 | 22.9%), and high school (167 | 17.9%).
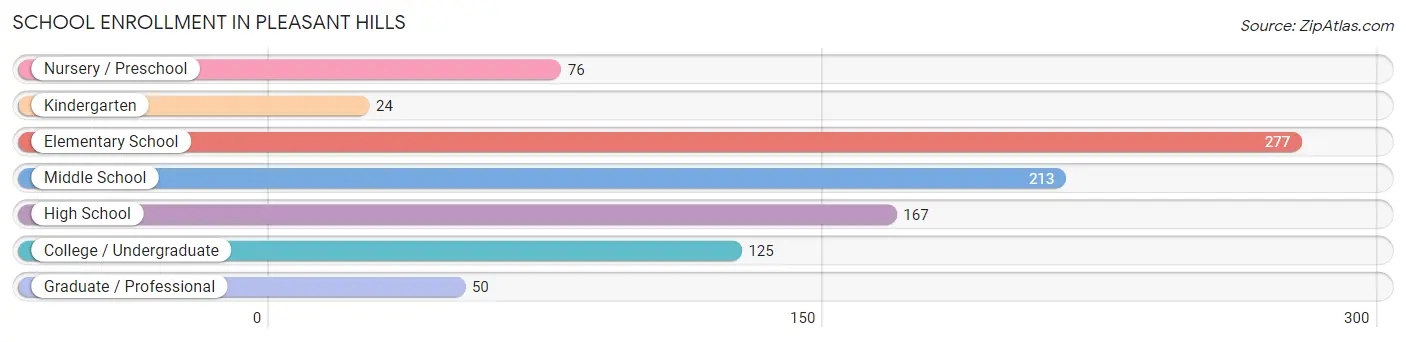
| School Level | # Students | % Students |
| Nursery / Preschool | 76 | 8.2% |
| Kindergarten | 24 | 2.6% |
| Elementary School | 277 | 29.7% |
| Middle School | 213 | 22.9% |
| High School | 167 | 17.9% |
| College / Undergraduate | 125 | 13.4% |
| Graduate / Professional | 50 | 5.4% |
| Total | 932 | 100.0% |
School Enrollment by Age by Funding Source in Pleasant Hills
Out of a total of 932 students who are enrolled in schools in Pleasant Hills, 296 (31.8%) attend a private institution, while the remaining 636 (68.2%) are enrolled in public schools. The age group of 3 to 4 year olds has the highest likelihood of being enrolled in private schools, with 47 (100.0% in the age bracket) enrolled. Conversely, the age group of 20 to 24 year olds has the lowest likelihood of being enrolled in a private school, with 61 (100.0% in the age bracket) attending a public institution.
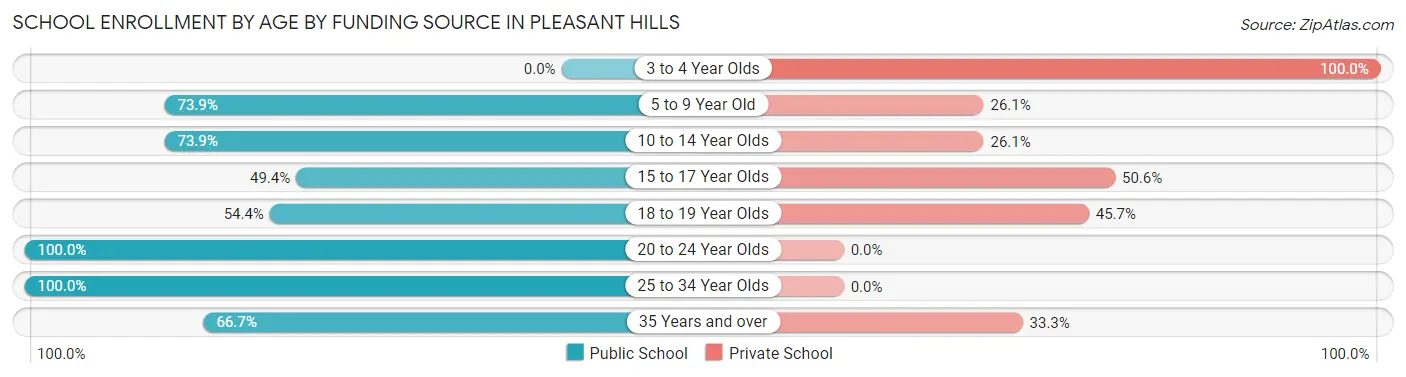
| Age Bracket | Public School | Private School |
| 3 to 4 Year Olds | 0 (0.0%) | 47 (100.0%) |
| 5 to 9 Year Old | 210 (73.9%) | 74 (26.1%) |
| 10 to 14 Year Olds | 210 (73.9%) | 74 (26.1%) |
| 15 to 17 Year Olds | 44 (49.4%) | 45 (50.6%) |
| 18 to 19 Year Olds | 50 (54.3%) | 42 (45.7%) |
| 20 to 24 Year Olds | 61 (100.0%) | 0 (0.0%) |
| 25 to 34 Year Olds | 33 (100.0%) | 0 (0.0%) |
| 35 Years and over | 28 (66.7%) | 14 (33.3%) |
| Total | 636 (68.2%) | 296 (31.8%) |
Educational Attainment by Field of Study in Pleasant Hills
Business (427 | 24.6%), engineering (200 | 11.6%), science & technology (192 | 11.1%), social sciences (131 | 7.6%), and bio, nature & agricultural (130 | 7.5%) are the most common fields of study among 1,732 individuals in Pleasant Hills who have obtained a bachelor's degree or higher.
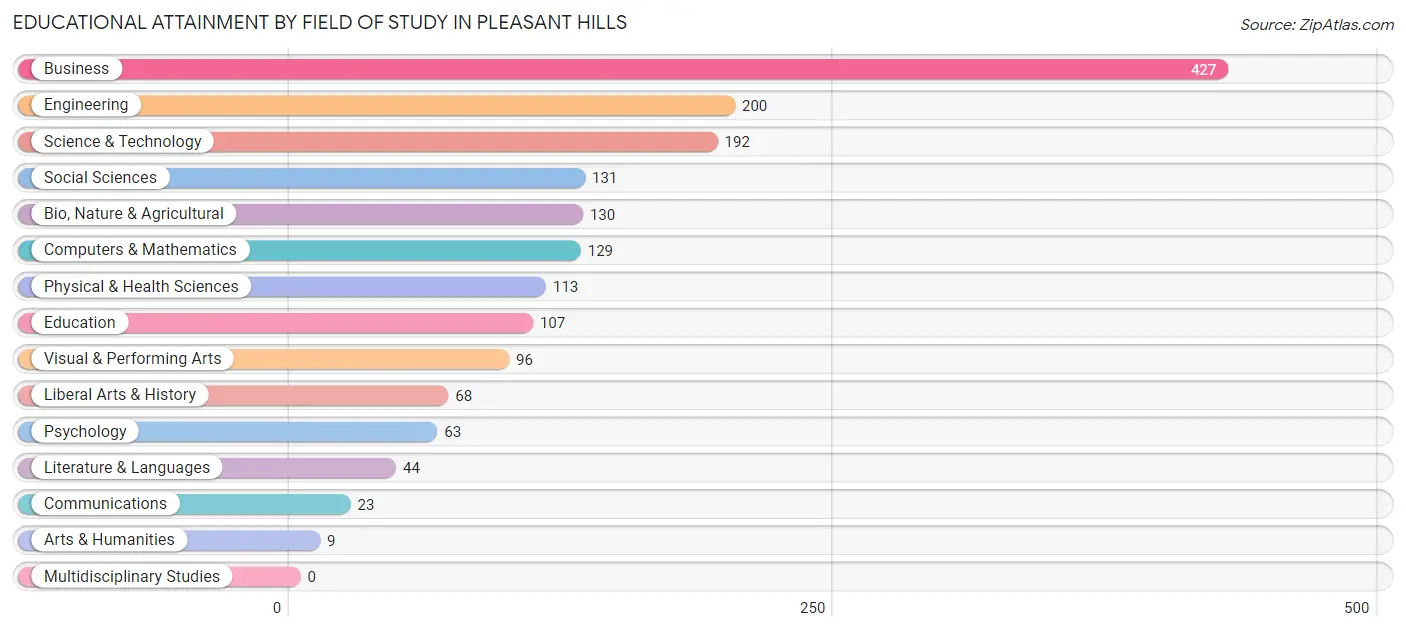
| Field of Study | # Graduates | % Graduates |
| Computers & Mathematics | 129 | 7.4% |
| Bio, Nature & Agricultural | 130 | 7.5% |
| Physical & Health Sciences | 113 | 6.5% |
| Psychology | 63 | 3.6% |
| Social Sciences | 131 | 7.6% |
| Engineering | 200 | 11.6% |
| Multidisciplinary Studies | 0 | 0.0% |
| Science & Technology | 192 | 11.1% |
| Business | 427 | 24.6% |
| Education | 107 | 6.2% |
| Literature & Languages | 44 | 2.5% |
| Liberal Arts & History | 68 | 3.9% |
| Visual & Performing Arts | 96 | 5.5% |
| Communications | 23 | 1.3% |
| Arts & Humanities | 9 | 0.5% |
| Total | 1,732 | 100.0% |
Transportation & Commute in Pleasant Hills
Vehicle Availability by Sex in Pleasant Hills
The most prevalent vehicle ownership categories in Pleasant Hills are males with 2 vehicles (473, accounting for 41.8%) and females with 2 vehicles (337, making up 59.3%).
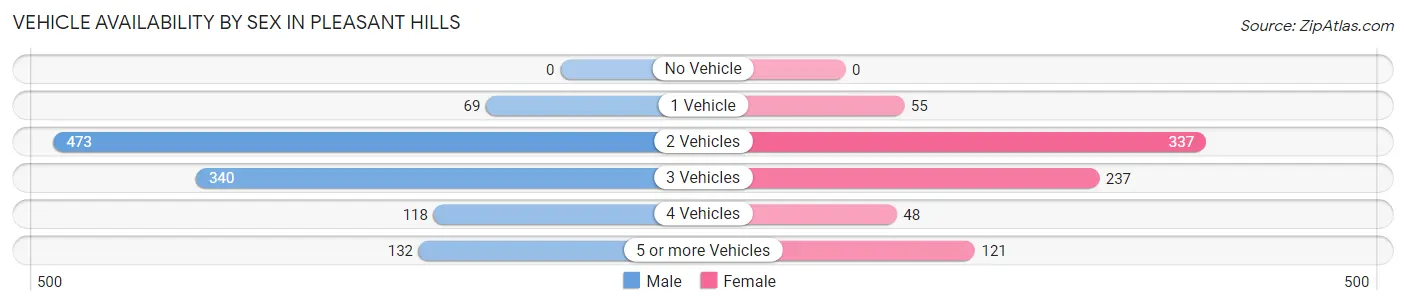
| Vehicles Available | Male | Female |
| No Vehicle | 0 (0.0%) | 0 (0.0%) |
| 1 Vehicle | 69 (6.1%) | 55 (6.9%) |
| 2 Vehicles | 473 (41.8%) | 337 (42.2%) |
| 3 Vehicles | 340 (30.0%) | 237 (29.7%) |
| 4 Vehicles | 118 (10.4%) | 48 (6.0%) |
| 5 or more Vehicles | 132 (11.7%) | 121 (15.2%) |
| Total | 1,132 (100.0%) | 798 (100.0%) |
Commute Time in Pleasant Hills
The most frequently occuring commute durations in Pleasant Hills are 30 to 34 minutes (344 commuters, 21.1%), 45 to 59 minutes (286 commuters, 17.5%), and 15 to 19 minutes (226 commuters, 13.8%).
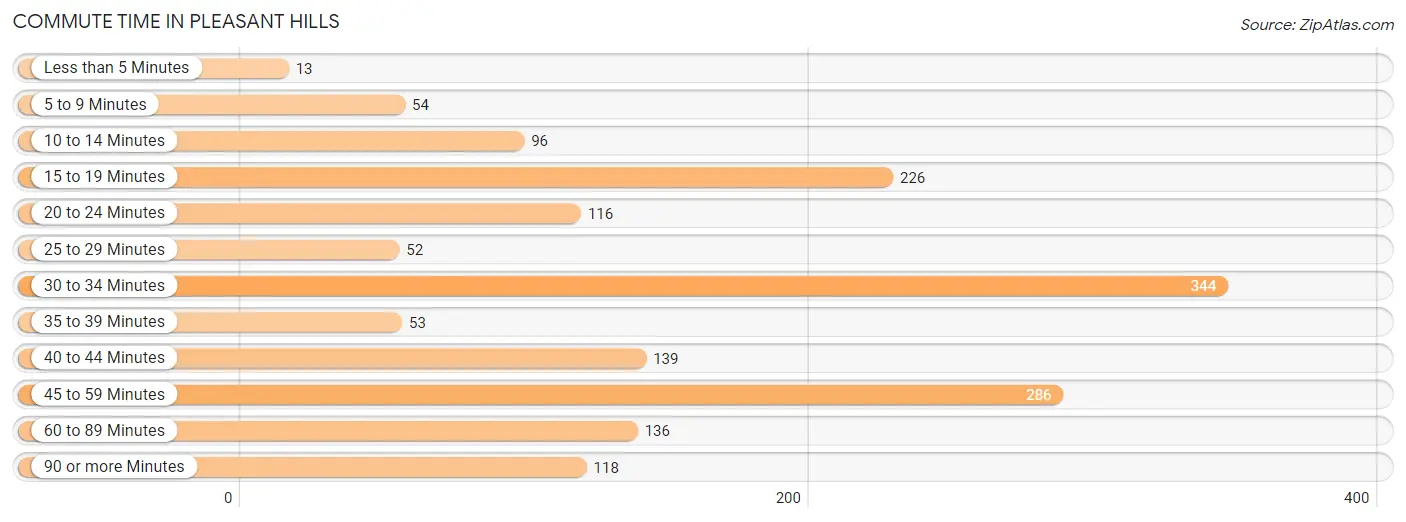
| Commute Time | # Commuters | % Commuters |
| Less than 5 Minutes | 13 | 0.8% |
| 5 to 9 Minutes | 54 | 3.3% |
| 10 to 14 Minutes | 96 | 5.9% |
| 15 to 19 Minutes | 226 | 13.8% |
| 20 to 24 Minutes | 116 | 7.1% |
| 25 to 29 Minutes | 52 | 3.2% |
| 30 to 34 Minutes | 344 | 21.1% |
| 35 to 39 Minutes | 53 | 3.3% |
| 40 to 44 Minutes | 139 | 8.5% |
| 45 to 59 Minutes | 286 | 17.5% |
| 60 to 89 Minutes | 136 | 8.3% |
| 90 or more Minutes | 118 | 7.2% |
Commute Time by Sex in Pleasant Hills
The most common commute times in Pleasant Hills are 30 to 34 minutes (212 commuters, 22.2%) for males and 30 to 34 minutes (132 commuters, 19.5%) for females.
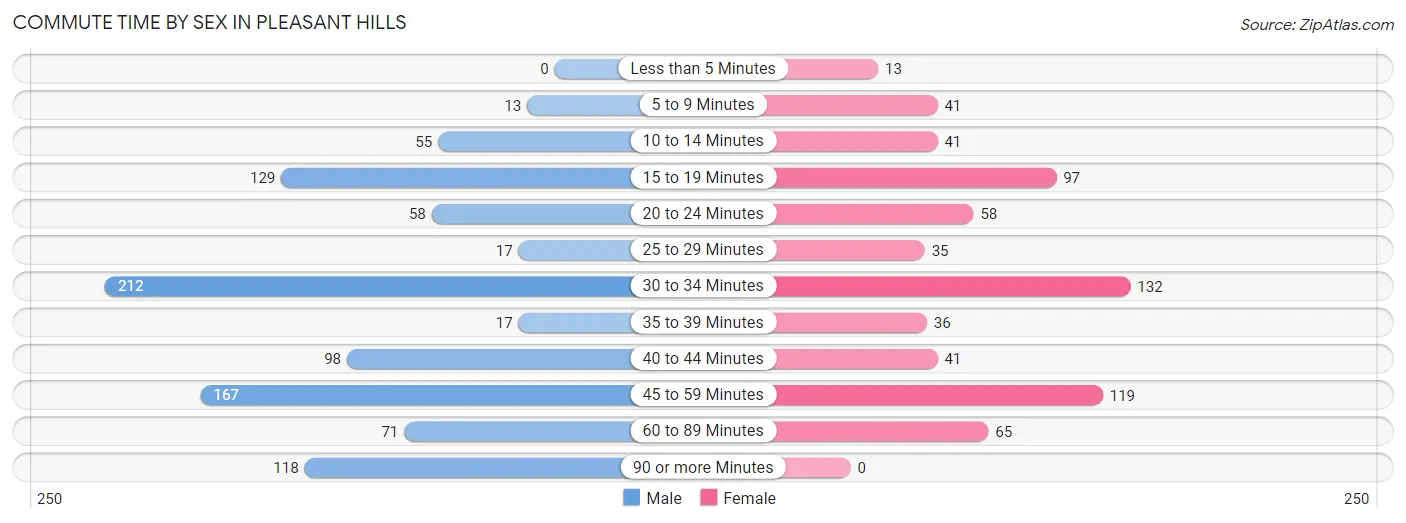
| Commute Time | Male | Female |
| Less than 5 Minutes | 0 (0.0%) | 13 (1.9%) |
| 5 to 9 Minutes | 13 (1.4%) | 41 (6.0%) |
| 10 to 14 Minutes | 55 (5.8%) | 41 (6.0%) |
| 15 to 19 Minutes | 129 (13.5%) | 97 (14.3%) |
| 20 to 24 Minutes | 58 (6.1%) | 58 (8.6%) |
| 25 to 29 Minutes | 17 (1.8%) | 35 (5.2%) |
| 30 to 34 Minutes | 212 (22.2%) | 132 (19.5%) |
| 35 to 39 Minutes | 17 (1.8%) | 36 (5.3%) |
| 40 to 44 Minutes | 98 (10.3%) | 41 (6.0%) |
| 45 to 59 Minutes | 167 (17.5%) | 119 (17.5%) |
| 60 to 89 Minutes | 71 (7.4%) | 65 (9.6%) |
| 90 or more Minutes | 118 (12.4%) | 0 (0.0%) |
Time of Departure to Work by Sex in Pleasant Hills
The most frequent times of departure to work in Pleasant Hills are 6:00 AM to 6:29 AM (211, 22.1%) for males and 7:30 AM to 7:59 AM (176, 26.0%) for females.
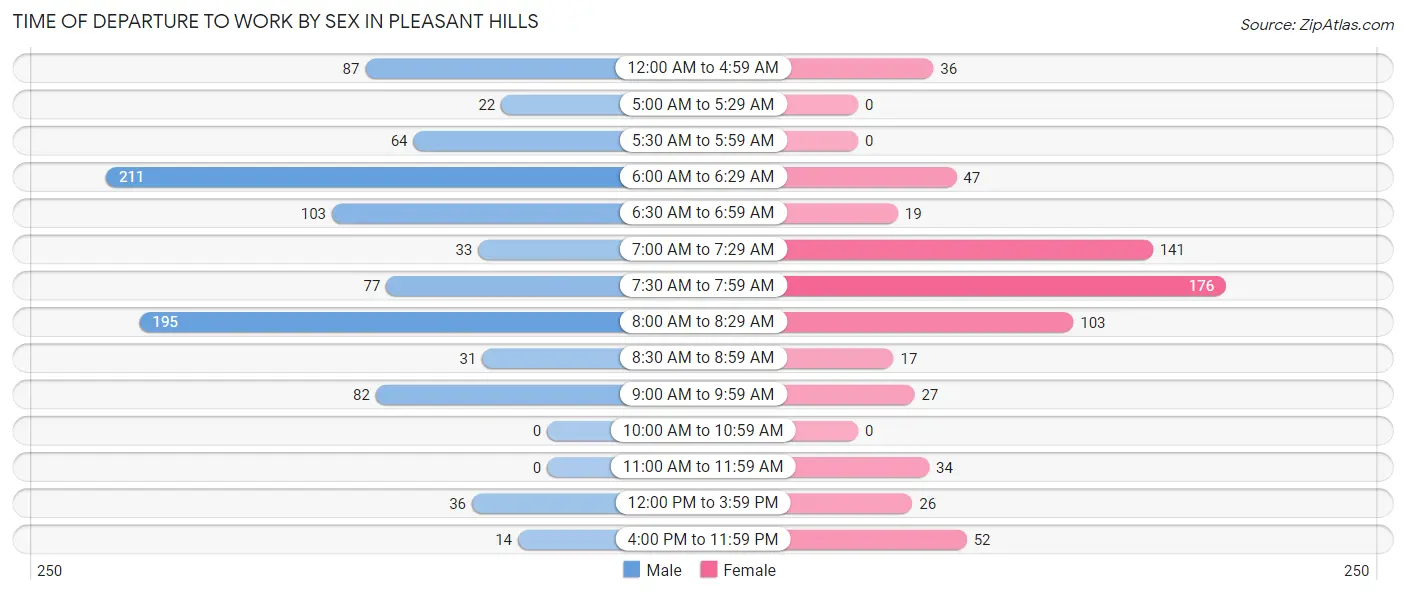
| Time of Departure | Male | Female |
| 12:00 AM to 4:59 AM | 87 (9.1%) | 36 (5.3%) |
| 5:00 AM to 5:29 AM | 22 (2.3%) | 0 (0.0%) |
| 5:30 AM to 5:59 AM | 64 (6.7%) | 0 (0.0%) |
| 6:00 AM to 6:29 AM | 211 (22.1%) | 47 (6.9%) |
| 6:30 AM to 6:59 AM | 103 (10.8%) | 19 (2.8%) |
| 7:00 AM to 7:29 AM | 33 (3.5%) | 141 (20.8%) |
| 7:30 AM to 7:59 AM | 77 (8.1%) | 176 (26.0%) |
| 8:00 AM to 8:29 AM | 195 (20.4%) | 103 (15.2%) |
| 8:30 AM to 8:59 AM | 31 (3.3%) | 17 (2.5%) |
| 9:00 AM to 9:59 AM | 82 (8.6%) | 27 (4.0%) |
| 10:00 AM to 10:59 AM | 0 (0.0%) | 0 (0.0%) |
| 11:00 AM to 11:59 AM | 0 (0.0%) | 34 (5.0%) |
| 12:00 PM to 3:59 PM | 36 (3.8%) | 26 (3.8%) |
| 4:00 PM to 11:59 PM | 14 (1.5%) | 52 (7.7%) |
| Total | 955 (100.0%) | 678 (100.0%) |
Housing Occupancy in Pleasant Hills
Occupancy by Ownership in Pleasant Hills
Of the total 1,493 dwellings in Pleasant Hills, owner-occupied units account for 1,424 (95.4%), while renter-occupied units make up 69 (4.6%).
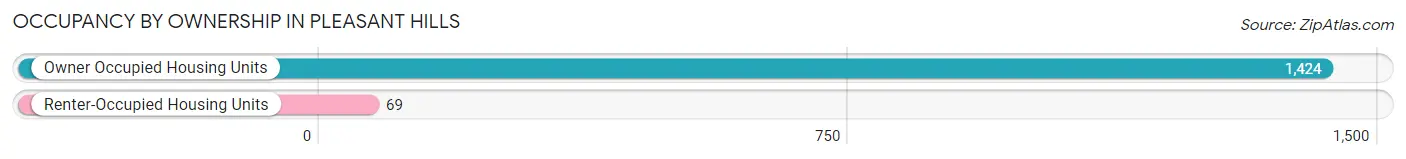
| Occupancy | # Housing Units | % Housing Units |
| Owner Occupied Housing Units | 1,424 | 95.4% |
| Renter-Occupied Housing Units | 69 | 4.6% |
| Total Occupied Housing Units | 1,493 | 100.0% |
Occupancy by Household Size in Pleasant Hills
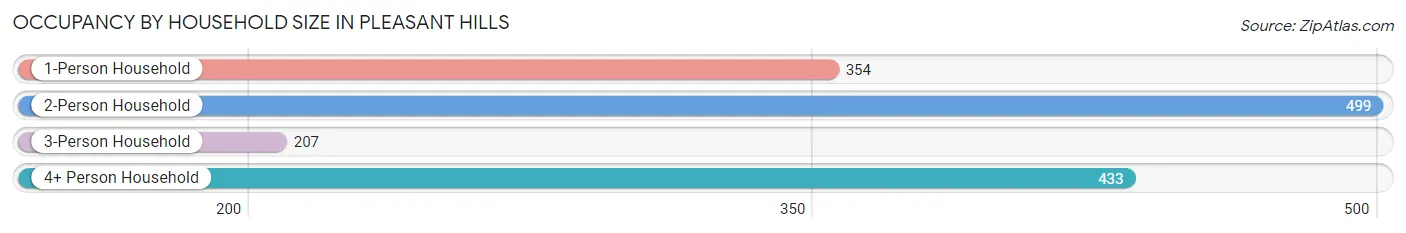
| Household Size | # Housing Units | % Housing Units |
| 1-Person Household | 354 | 23.7% |
| 2-Person Household | 499 | 33.4% |
| 3-Person Household | 207 | 13.9% |
| 4+ Person Household | 433 | 29.0% |
| Total Housing Units | 1,493 | 100.0% |
Occupancy by Ownership by Household Size in Pleasant Hills
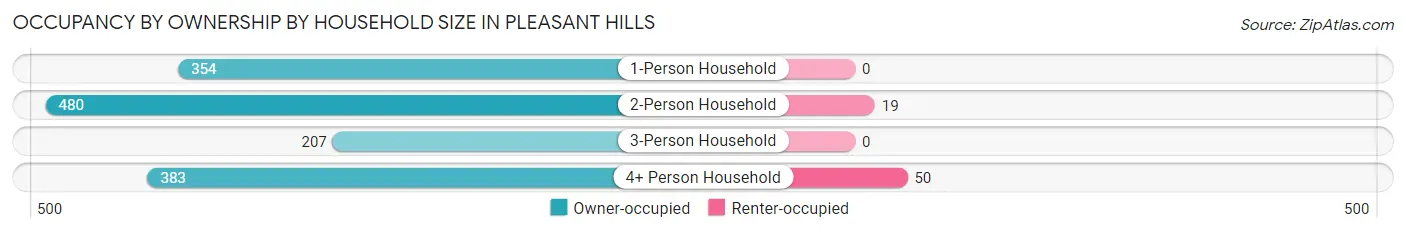
| Household Size | Owner-occupied | Renter-occupied |
| 1-Person Household | 354 (100.0%) | 0 (0.0%) |
| 2-Person Household | 480 (96.2%) | 19 (3.8%) |
| 3-Person Household | 207 (100.0%) | 0 (0.0%) |
| 4+ Person Household | 383 (88.4%) | 50 (11.6%) |
| Total Housing Units | 1,424 (95.4%) | 69 (4.6%) |
Occupancy by Educational Attainment in Pleasant Hills
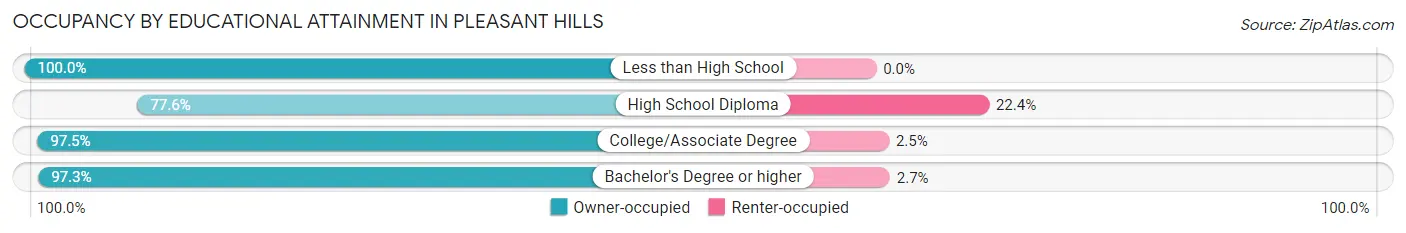
| Household Size | Owner-occupied | Renter-occupied |
| Less than High School | 29 (100.0%) | 0 (0.0%) |
| High School Diploma | 118 (77.6%) | 34 (22.4%) |
| College/Associate Degree | 345 (97.5%) | 9 (2.5%) |
| Bachelor's Degree or higher | 932 (97.3%) | 26 (2.7%) |
Occupancy by Age of Householder in Pleasant Hills
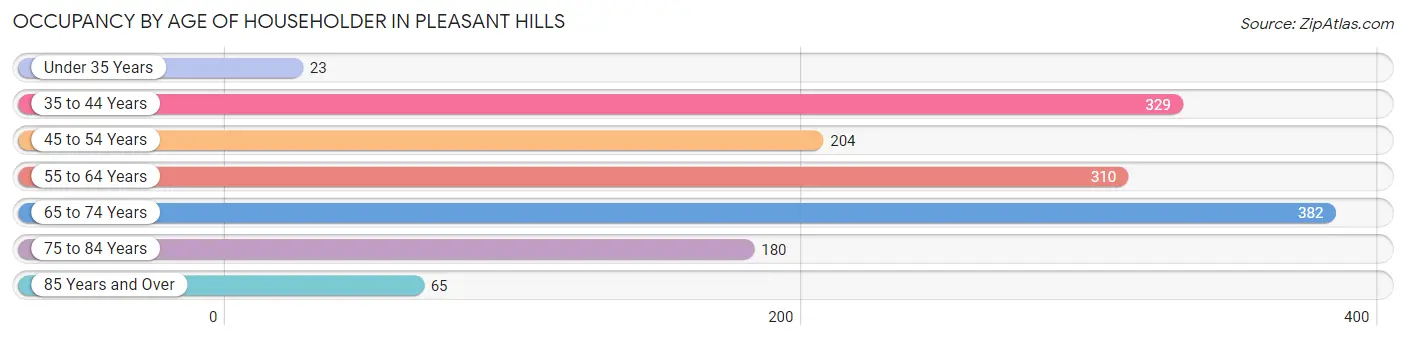
| Age Bracket | # Households | % Households |
| Under 35 Years | 23 | 1.5% |
| 35 to 44 Years | 329 | 22.0% |
| 45 to 54 Years | 204 | 13.7% |
| 55 to 64 Years | 310 | 20.8% |
| 65 to 74 Years | 382 | 25.6% |
| 75 to 84 Years | 180 | 12.1% |
| 85 Years and Over | 65 | 4.3% |
| Total | 1,493 | 100.0% |
Housing Finances in Pleasant Hills
Median Income by Occupancy in Pleasant Hills
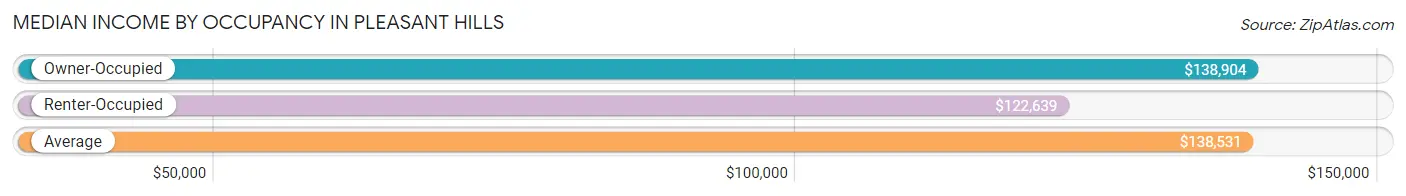
| Occupancy Type | # Households | Median Income |
| Owner-Occupied | 1,424 (95.4%) | $138,904 |
| Renter-Occupied | 69 (4.6%) | $122,639 |
| Average | 1,493 (100.0%) | $138,531 |
Occupancy by Householder Income Bracket in Pleasant Hills
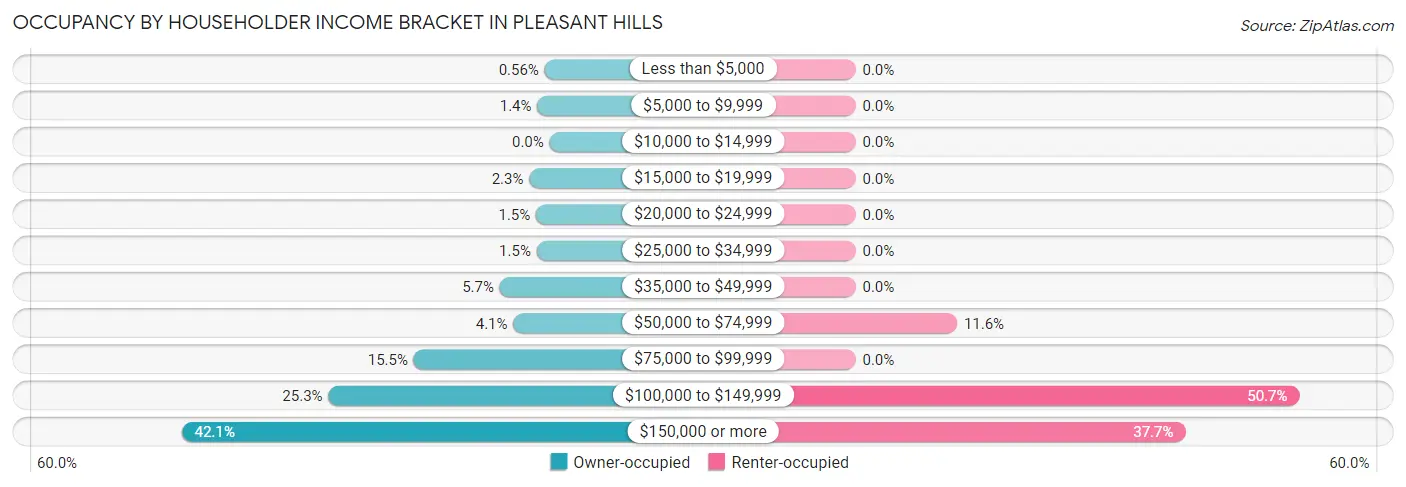
| Income Bracket | Owner-occupied | Renter-occupied |
| Less than $5,000 | 8 (0.6%) | 0 (0.0%) |
| $5,000 to $9,999 | 20 (1.4%) | 0 (0.0%) |
| $10,000 to $14,999 | 0 (0.0%) | 0 (0.0%) |
| $15,000 to $19,999 | 33 (2.3%) | 0 (0.0%) |
| $20,000 to $24,999 | 22 (1.5%) | 0 (0.0%) |
| $25,000 to $34,999 | 21 (1.5%) | 0 (0.0%) |
| $35,000 to $49,999 | 81 (5.7%) | 0 (0.0%) |
| $50,000 to $74,999 | 59 (4.1%) | 8 (11.6%) |
| $75,000 to $99,999 | 221 (15.5%) | 0 (0.0%) |
| $100,000 to $149,999 | 360 (25.3%) | 35 (50.7%) |
| $150,000 or more | 599 (42.1%) | 26 (37.7%) |
| Total | 1,424 (100.0%) | 69 (100.0%) |
Monthly Housing Cost Tiers in Pleasant Hills
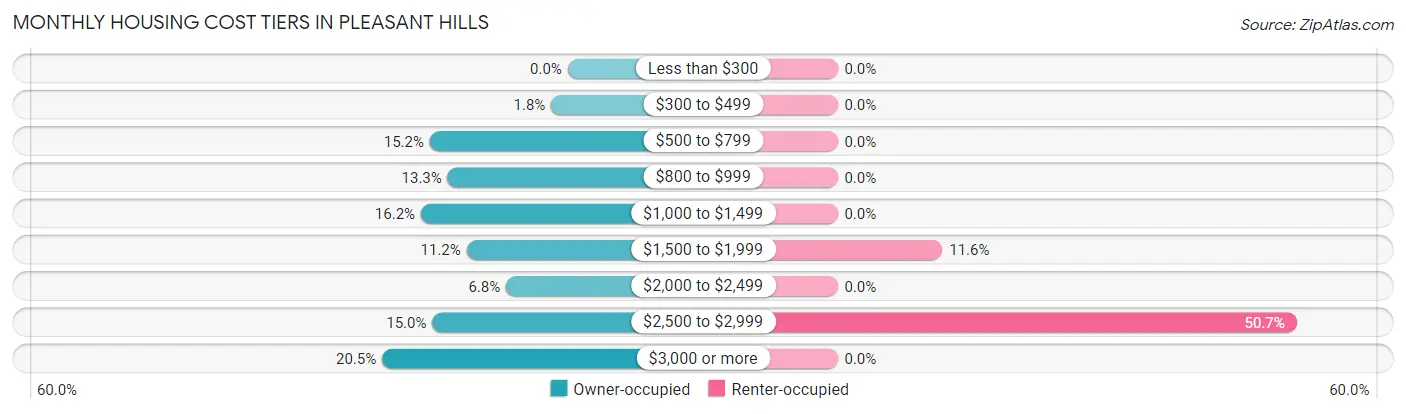
| Monthly Cost | Owner-occupied | Renter-occupied |
| Less than $300 | 0 (0.0%) | 0 (0.0%) |
| $300 to $499 | 26 (1.8%) | 0 (0.0%) |
| $500 to $799 | 217 (15.2%) | 0 (0.0%) |
| $800 to $999 | 189 (13.3%) | 0 (0.0%) |
| $1,000 to $1,499 | 231 (16.2%) | 0 (0.0%) |
| $1,500 to $1,999 | 159 (11.2%) | 8 (11.6%) |
| $2,000 to $2,499 | 97 (6.8%) | 0 (0.0%) |
| $2,500 to $2,999 | 213 (15.0%) | 35 (50.7%) |
| $3,000 or more | 292 (20.5%) | 0 (0.0%) |
| Total | 1,424 (100.0%) | 69 (100.0%) |
Physical Housing Characteristics in Pleasant Hills
Housing Structures in Pleasant Hills
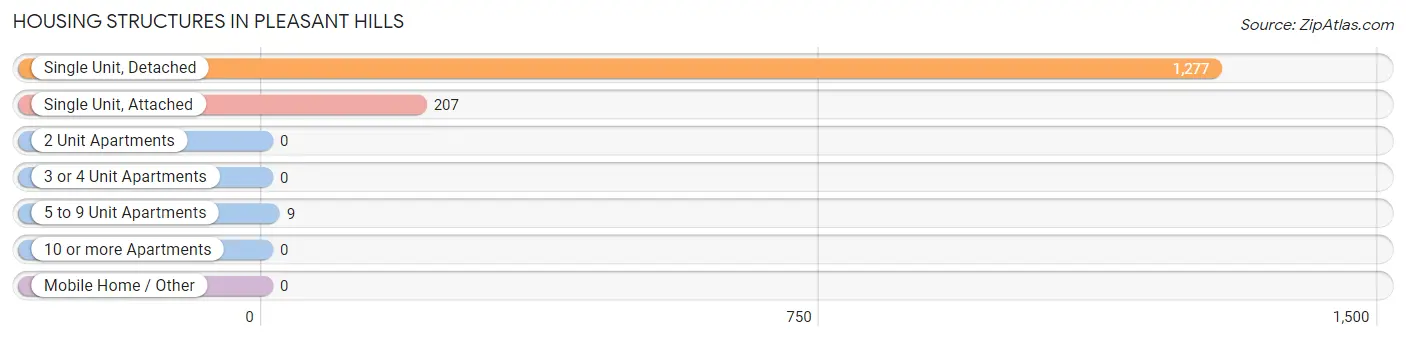
| Structure Type | # Housing Units | % Housing Units |
| Single Unit, Detached | 1,277 | 85.5% |
| Single Unit, Attached | 207 | 13.9% |
| 2 Unit Apartments | 0 | 0.0% |
| 3 or 4 Unit Apartments | 0 | 0.0% |
| 5 to 9 Unit Apartments | 9 | 0.6% |
| 10 or more Apartments | 0 | 0.0% |
| Mobile Home / Other | 0 | 0.0% |
| Total | 1,493 | 100.0% |
Housing Structures by Occupancy in Pleasant Hills
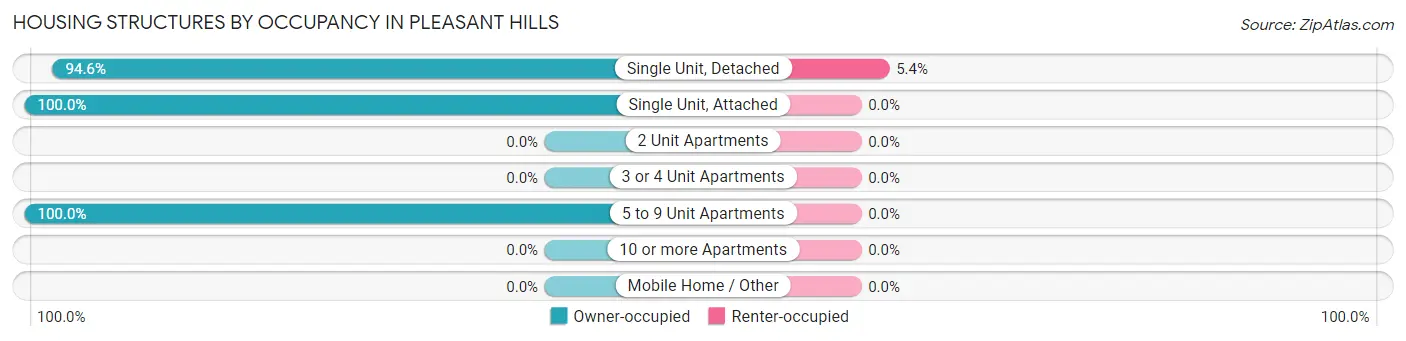
| Structure Type | Owner-occupied | Renter-occupied |
| Single Unit, Detached | 1,208 (94.6%) | 69 (5.4%) |
| Single Unit, Attached | 207 (100.0%) | 0 (0.0%) |
| 2 Unit Apartments | 0 (0.0%) | 0 (0.0%) |
| 3 or 4 Unit Apartments | 0 (0.0%) | 0 (0.0%) |
| 5 to 9 Unit Apartments | 9 (100.0%) | 0 (0.0%) |
| 10 or more Apartments | 0 (0.0%) | 0 (0.0%) |
| Mobile Home / Other | 0 (0.0%) | 0 (0.0%) |
| Total | 1,424 (95.4%) | 69 (4.6%) |
Housing Structures by Number of Rooms in Pleasant Hills
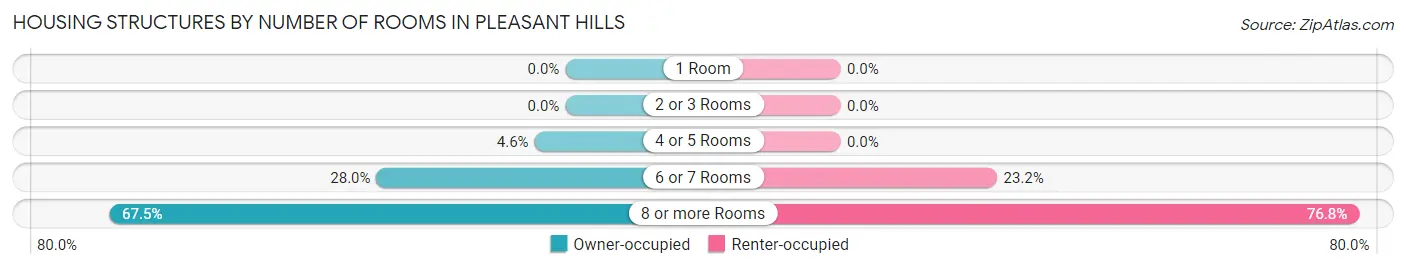
| Number of Rooms | Owner-occupied | Renter-occupied |
| 1 Room | 0 (0.0%) | 0 (0.0%) |
| 2 or 3 Rooms | 0 (0.0%) | 0 (0.0%) |
| 4 or 5 Rooms | 65 (4.6%) | 0 (0.0%) |
| 6 or 7 Rooms | 398 (28.0%) | 16 (23.2%) |
| 8 or more Rooms | 961 (67.5%) | 53 (76.8%) |
| Total | 1,424 (100.0%) | 69 (100.0%) |
Housing Structure by Heating Type in Pleasant Hills
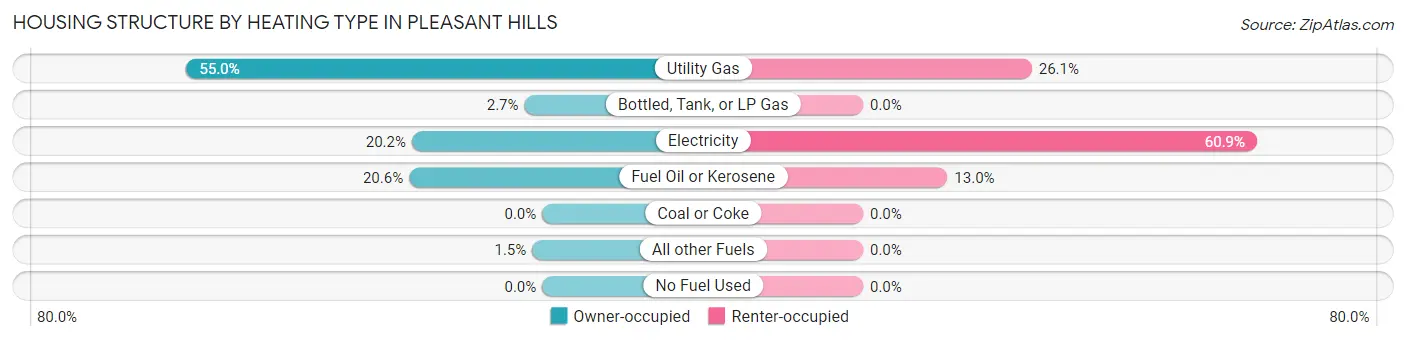
| Heating Type | Owner-occupied | Renter-occupied |
| Utility Gas | 783 (55.0%) | 18 (26.1%) |
| Bottled, Tank, or LP Gas | 39 (2.7%) | 0 (0.0%) |
| Electricity | 287 (20.2%) | 42 (60.9%) |
| Fuel Oil or Kerosene | 293 (20.6%) | 9 (13.0%) |
| Coal or Coke | 0 (0.0%) | 0 (0.0%) |
| All other Fuels | 22 (1.5%) | 0 (0.0%) |
| No Fuel Used | 0 (0.0%) | 0 (0.0%) |
| Total | 1,424 (100.0%) | 69 (100.0%) |
Household Vehicle Usage in Pleasant Hills
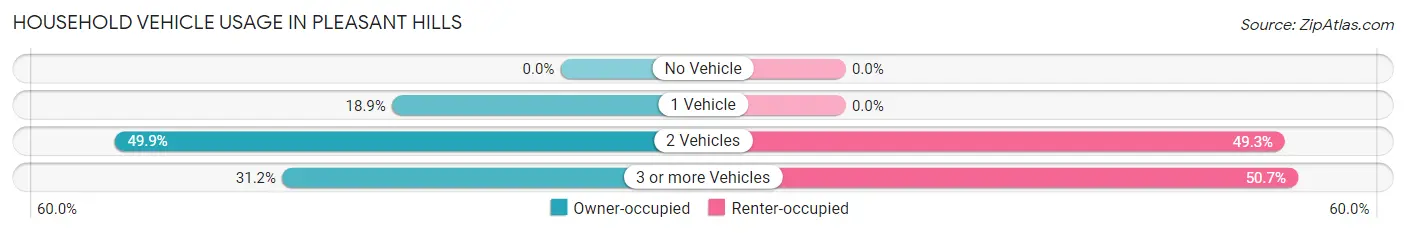
| Vehicles per Household | Owner-occupied | Renter-occupied |
| No Vehicle | 0 (0.0%) | 0 (0.0%) |
| 1 Vehicle | 269 (18.9%) | 0 (0.0%) |
| 2 Vehicles | 711 (49.9%) | 34 (49.3%) |
| 3 or more Vehicles | 444 (31.2%) | 35 (50.7%) |
| Total | 1,424 (100.0%) | 69 (100.0%) |
Real Estate & Mortgages in Pleasant Hills
Real Estate and Mortgage Overview in Pleasant Hills
| Characteristic | Without Mortgage | With Mortgage |
| Housing Units | 582 | 842 |
| Median Property Value | $425,900 | $474,900 |
| Median Household Income | $117,833 | $409 |
| Monthly Housing Costs | $840 | $292 |
| Real Estate Taxes | $4,341 | $27 |
Property Value by Mortgage Status in Pleasant Hills
| Property Value | Without Mortgage | With Mortgage |
| Less than $50,000 | 7 (1.2%) | 8 (0.9%) |
| $50,000 to $99,999 | 0 (0.0%) | 0 (0.0%) |
| $100,000 to $299,999 | 19 (3.3%) | 74 (8.8%) |
| $300,000 to $499,999 | 425 (73.0%) | 419 (49.8%) |
| $500,000 to $749,999 | 101 (17.3%) | 315 (37.4%) |
| $750,000 to $999,999 | 22 (3.8%) | 9 (1.1%) |
| $1,000,000 or more | 8 (1.4%) | 17 (2.0%) |
| Total | 582 (100.0%) | 842 (100.0%) |
Household Income by Mortgage Status in Pleasant Hills
| Household Income | Without Mortgage | With Mortgage |
| Less than $10,000 | 16 (2.8%) | 6 (0.7%) |
| $10,000 to $24,999 | 33 (5.7%) | 12 (1.4%) |
| $25,000 to $34,999 | 21 (3.6%) | 22 (2.6%) |
| $35,000 to $49,999 | 62 (10.6%) | 0 (0.0%) |
| $50,000 to $74,999 | 0 (0.0%) | 19 (2.3%) |
| $75,000 to $99,999 | 135 (23.2%) | 59 (7.0%) |
| $100,000 to $149,999 | 125 (21.5%) | 86 (10.2%) |
| $150,000 or more | 190 (32.7%) | 235 (27.9%) |
| Total | 582 (100.0%) | 842 (100.0%) |
Property Value to Household Income Ratio in Pleasant Hills
| Value-to-Income Ratio | Without Mortgage | With Mortgage |
| Less than 2.0x | 78 (13.4%) | 146,786 (17,433.0%) |
| 2.0x to 2.9x | 124 (21.3%) | 180 (21.4%) |
| 3.0x to 3.9x | 56 (9.6%) | 246 (29.2%) |
| 4.0x or more | 324 (55.7%) | 196 (23.3%) |
| Total | 582 (100.0%) | 842 (100.0%) |
Real Estate Taxes by Mortgage Status in Pleasant Hills
| Property Taxes | Without Mortgage | With Mortgage |
| Less than $800 | 0 (0.0%) | 0 (0.0%) |
| $800 to $1,499 | 9 (1.5%) | 0 (0.0%) |
| $800 to $1,499 | 573 (98.5%) | 0 (0.0%) |
| Total | 582 (100.0%) | 842 (100.0%) |
Health & Disability in Pleasant Hills
Health Insurance Coverage by Age in Pleasant Hills
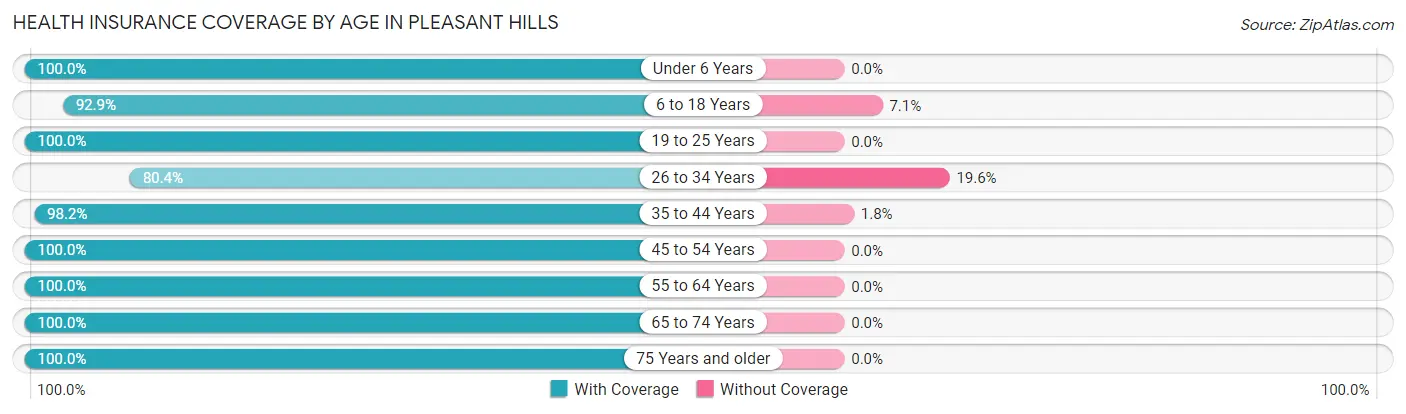
| Age Bracket | With Coverage | Without Coverage |
| Under 6 Years | 228 (100.0%) | 0 (0.0%) |
| 6 to 18 Years | 652 (92.9%) | 50 (7.1%) |
| 19 to 25 Years | 173 (100.0%) | 0 (0.0%) |
| 26 to 34 Years | 123 (80.4%) | 30 (19.6%) |
| 35 to 44 Years | 664 (98.2%) | 12 (1.8%) |
| 45 to 54 Years | 444 (100.0%) | 0 (0.0%) |
| 55 to 64 Years | 578 (100.0%) | 0 (0.0%) |
| 65 to 74 Years | 604 (100.0%) | 0 (0.0%) |
| 75 Years and older | 358 (100.0%) | 0 (0.0%) |
| Total | 3,824 (97.7%) | 92 (2.4%) |
Health Insurance Coverage by Citizenship Status in Pleasant Hills
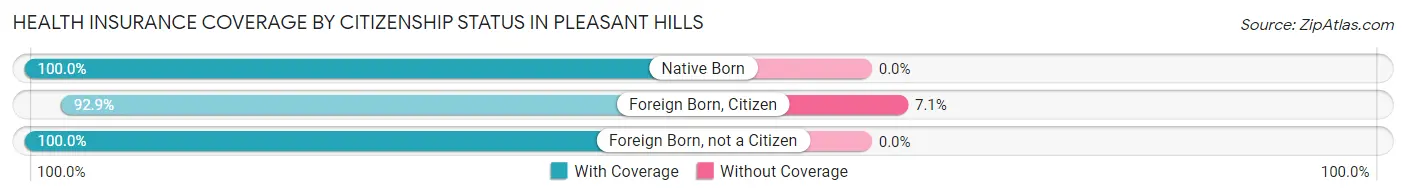
| Citizenship Status | With Coverage | Without Coverage |
| Native Born | 228 (100.0%) | 0 (0.0%) |
| Foreign Born, Citizen | 652 (92.9%) | 50 (7.1%) |
| Foreign Born, not a Citizen | 173 (100.0%) | 0 (0.0%) |
Health Insurance Coverage by Household Income in Pleasant Hills
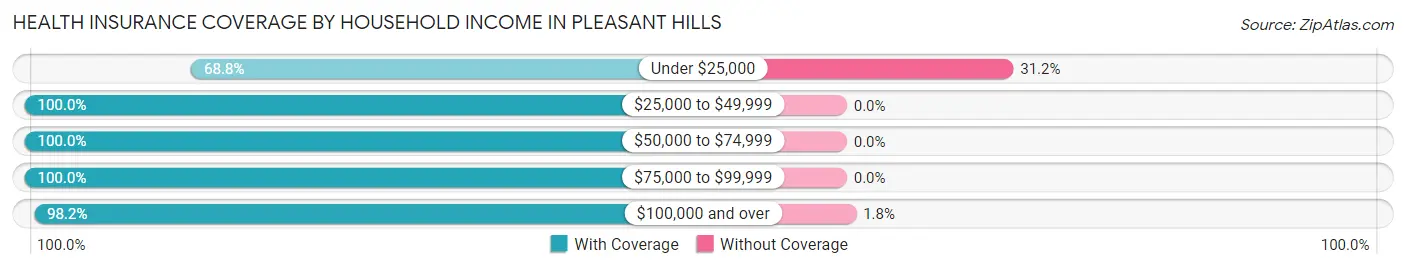
| Household Income | With Coverage | Without Coverage |
| Under $25,000 | 86 (68.8%) | 39 (31.2%) |
| $25,000 to $49,999 | 206 (100.0%) | 0 (0.0%) |
| $50,000 to $74,999 | 140 (100.0%) | 0 (0.0%) |
| $75,000 to $99,999 | 443 (100.0%) | 0 (0.0%) |
| $100,000 and over | 2,949 (98.2%) | 53 (1.8%) |
Public vs Private Health Insurance Coverage by Age in Pleasant Hills
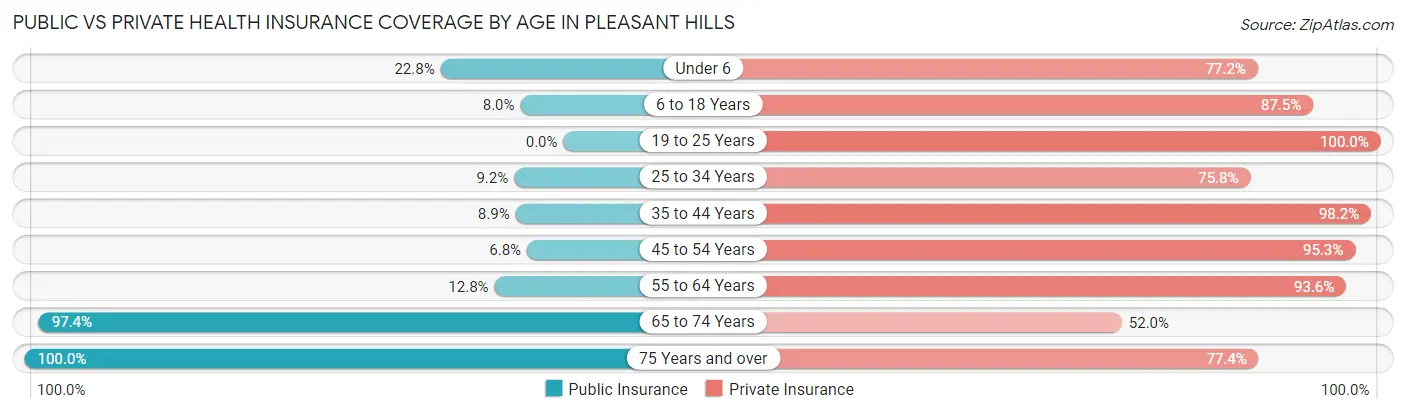
| Age Bracket | Public Insurance | Private Insurance |
| Under 6 | 52 (22.8%) | 176 (77.2%) |
| 6 to 18 Years | 56 (8.0%) | 614 (87.5%) |
| 19 to 25 Years | 0 (0.0%) | 173 (100.0%) |
| 25 to 34 Years | 14 (9.1%) | 116 (75.8%) |
| 35 to 44 Years | 60 (8.9%) | 664 (98.2%) |
| 45 to 54 Years | 30 (6.8%) | 423 (95.3%) |
| 55 to 64 Years | 74 (12.8%) | 541 (93.6%) |
| 65 to 74 Years | 588 (97.4%) | 314 (52.0%) |
| 75 Years and over | 358 (100.0%) | 277 (77.4%) |
| Total | 1,232 (31.5%) | 3,298 (84.2%) |
Disability Status by Sex by Age in Pleasant Hills
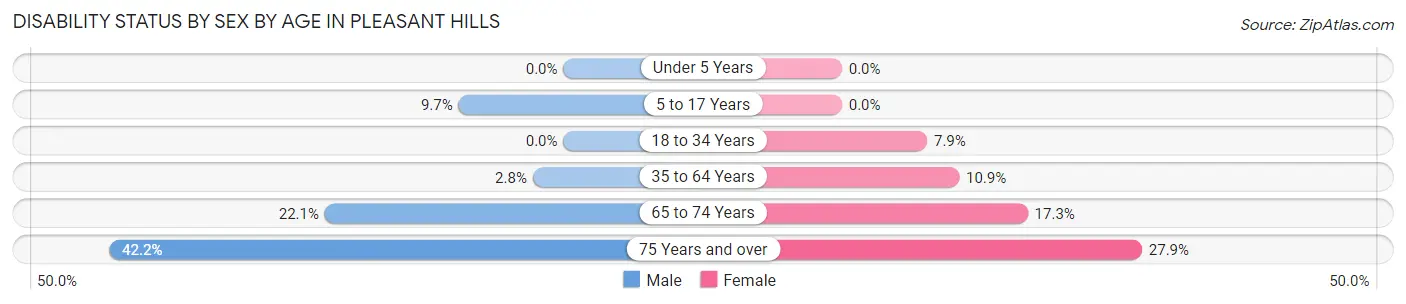
| Age Bracket | Male | Female |
| Under 5 Years | 0 (0.0%) | 0 (0.0%) |
| 5 to 17 Years | 33 (9.7%) | 0 (0.0%) |
| 18 to 34 Years | 0 (0.0%) | 14 (7.9%) |
| 35 to 64 Years | 26 (2.8%) | 85 (10.9%) |
| 65 to 74 Years | 58 (22.1%) | 59 (17.2%) |
| 75 Years and over | 51 (42.1%) | 66 (27.9%) |
Disability Class by Sex by Age in Pleasant Hills
Disability Class: Hearing Difficulty
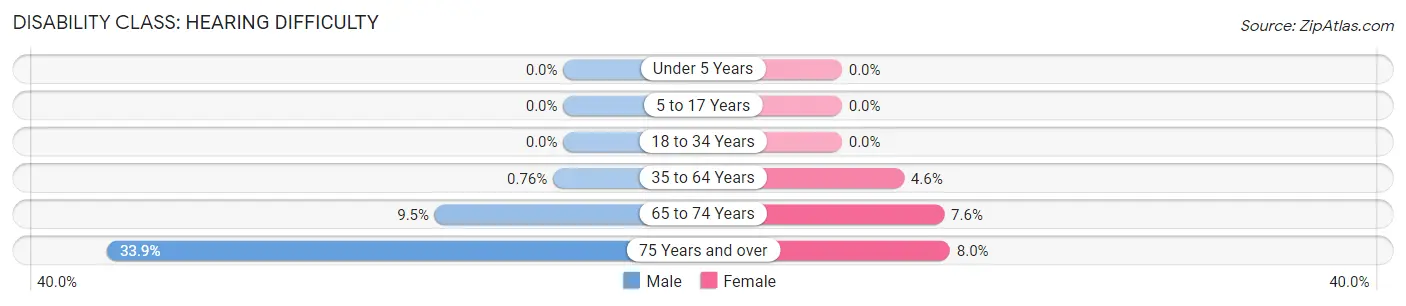
| Age Bracket | Male | Female |
| Under 5 Years | 0 (0.0%) | 0 (0.0%) |
| 5 to 17 Years | 0 (0.0%) | 0 (0.0%) |
| 18 to 34 Years | 0 (0.0%) | 0 (0.0%) |
| 35 to 64 Years | 7 (0.8%) | 36 (4.6%) |
| 65 to 74 Years | 25 (9.5%) | 26 (7.6%) |
| 75 Years and over | 41 (33.9%) | 19 (8.0%) |
Disability Class: Vision Difficulty
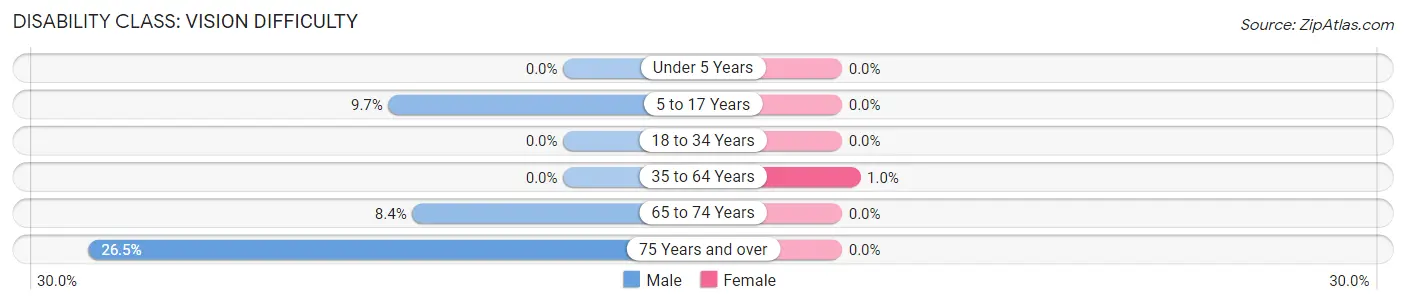
| Age Bracket | Male | Female |
| Under 5 Years | 0 (0.0%) | 0 (0.0%) |
| 5 to 17 Years | 33 (9.7%) | 0 (0.0%) |
| 18 to 34 Years | 0 (0.0%) | 0 (0.0%) |
| 35 to 64 Years | 0 (0.0%) | 8 (1.0%) |
| 65 to 74 Years | 22 (8.4%) | 0 (0.0%) |
| 75 Years and over | 32 (26.5%) | 0 (0.0%) |
Disability Class: Cognitive Difficulty
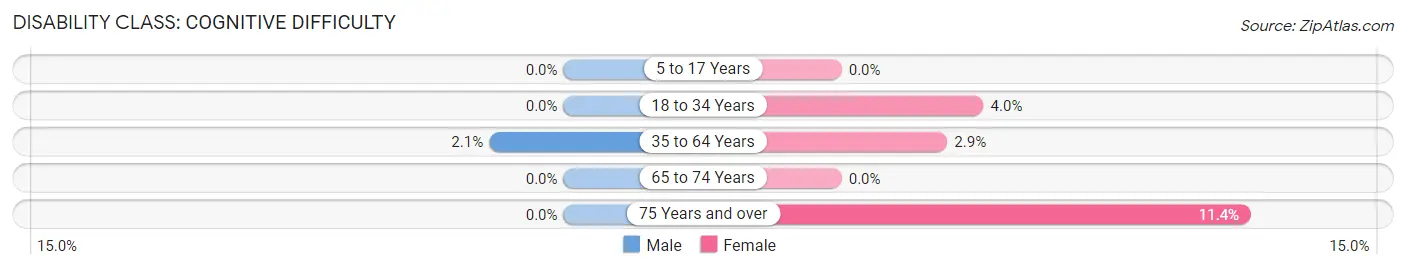
| Age Bracket | Male | Female |
| 5 to 17 Years | 0 (0.0%) | 0 (0.0%) |
| 18 to 34 Years | 0 (0.0%) | 7 (4.0%) |
| 35 to 64 Years | 19 (2.1%) | 23 (2.9%) |
| 65 to 74 Years | 0 (0.0%) | 0 (0.0%) |
| 75 Years and over | 0 (0.0%) | 27 (11.4%) |
Disability Class: Ambulatory Difficulty
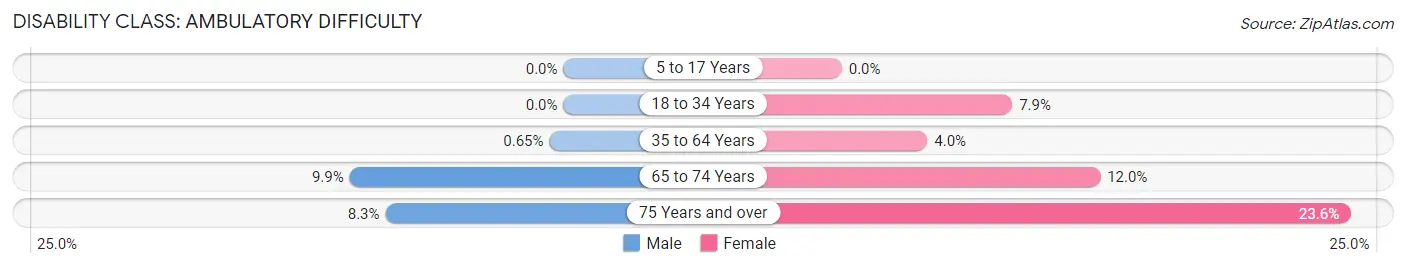
| Age Bracket | Male | Female |
| 5 to 17 Years | 0 (0.0%) | 0 (0.0%) |
| 18 to 34 Years | 0 (0.0%) | 14 (7.9%) |
| 35 to 64 Years | 6 (0.6%) | 31 (4.0%) |
| 65 to 74 Years | 26 (9.9%) | 41 (12.0%) |
| 75 Years and over | 10 (8.3%) | 56 (23.6%) |
Disability Class: Self-Care Difficulty
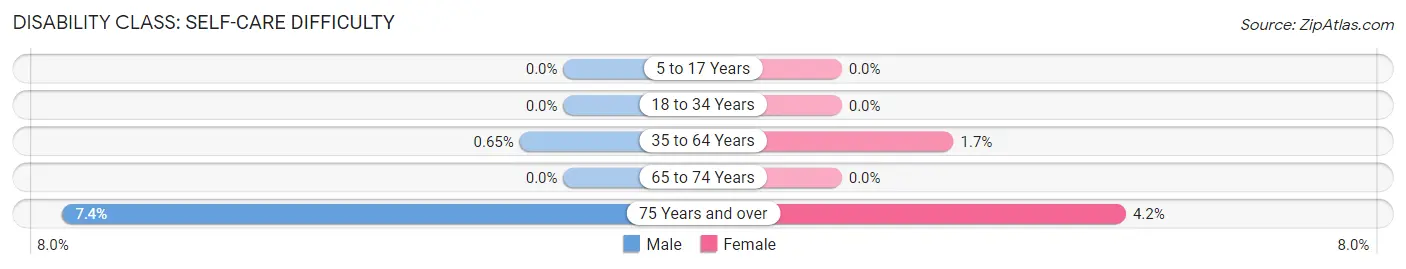
| Age Bracket | Male | Female |
| 5 to 17 Years | 0 (0.0%) | 0 (0.0%) |
| 18 to 34 Years | 0 (0.0%) | 0 (0.0%) |
| 35 to 64 Years | 6 (0.6%) | 13 (1.7%) |
| 65 to 74 Years | 0 (0.0%) | 0 (0.0%) |
| 75 Years and over | 9 (7.4%) | 10 (4.2%) |
Technology Access in Pleasant Hills
Computing Device Access in Pleasant Hills
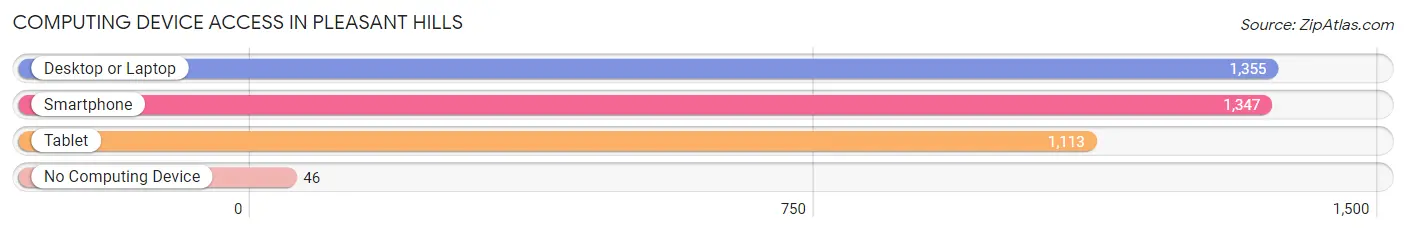
| Device Type | # Households | % Households |
| Desktop or Laptop | 1,355 | 90.8% |
| Smartphone | 1,347 | 90.2% |
| Tablet | 1,113 | 74.6% |
| No Computing Device | 46 | 3.1% |
| Total | 1,493 | 100.0% |
Internet Access in Pleasant Hills
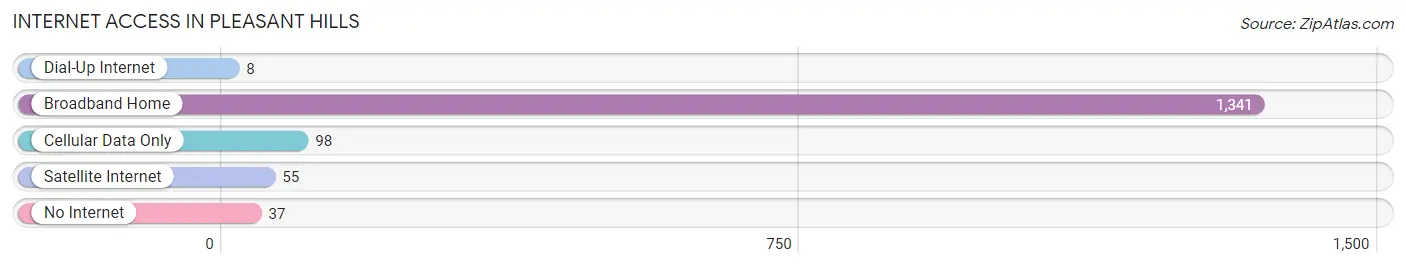
| Internet Type | # Households | % Households |
| Dial-Up Internet | 8 | 0.5% |
| Broadband Home | 1,341 | 89.8% |
| Cellular Data Only | 98 | 6.6% |
| Satellite Internet | 55 | 3.7% |
| No Internet | 37 | 2.5% |
| Total | 1,493 | 100.0% |
Pleasant Hills Summary
Pleasant Hills is a small unincorporated community located in Baltimore County, Maryland. It is situated in the southwestern corner of the county, just south of the city of Baltimore. The community is bordered by the Patapsco River to the east, the Patuxent River to the south, and the Chesapeake Bay to the west. The population of Pleasant Hills was estimated to be 1,845 in 2019.
History
Pleasant Hills was first settled in the late 1700s by a group of German immigrants. The area was originally known as “Pleasant Hill” and was part of the original Baltimore County. The community was officially established in 1812 and was named after the pleasant hills that surrounded the area.
In the early 1900s, Pleasant Hills was a rural farming community. The area was known for its dairy farms and orchards. The community also had a few small businesses, including a general store, a blacksmith shop, and a post office.
In the 1950s, the area began to experience rapid growth as more people moved to the area. The population of Pleasant Hills increased from 1,000 in 1950 to over 4,000 in 1960. This growth was due to the development of the nearby Patapsco Valley State Park and the construction of the Baltimore Beltway.
Geography
Pleasant Hills is located in the southwestern corner of Baltimore County, Maryland. It is bordered by the Patapsco River to the east, the Patuxent River to the south, and the Chesapeake Bay to the west. The community is situated on a plateau that is approximately 500 feet above sea level.
The climate in Pleasant Hills is classified as humid subtropical. The average temperature in the summer is around 80 degrees Fahrenheit and the average temperature in the winter is around 40 degrees Fahrenheit. The area receives an average of 44 inches of precipitation per year.
Economy
The economy of Pleasant Hills is largely based on the service industry. The area is home to a variety of restaurants, retail stores, and other businesses. The community also has a few manufacturing companies, including a furniture factory and a printing company.
The median household income in Pleasant Hills is $68,000, which is slightly higher than the national average. The unemployment rate in the area is 4.2%, which is lower than the national average.
Demographics
The population of Pleasant Hills was estimated to be 1,845 in 2019. The racial makeup of the community is 79.3% White, 11.2% African American, 4.2% Asian, and 5.3% Hispanic or Latino.
The median age in Pleasant Hills is 43.5 years, which is slightly higher than the national average. The median home value in the area is $310,000, which is higher than the national average.
Conclusion
Pleasant Hills is a small unincorporated community located in Baltimore County, Maryland. The area was first settled in the late 1700s and was officially established in 1812. The population of Pleasant Hills was estimated to be 1,845 in 2019. The economy of the area is largely based on the service industry and the median household income is $68,000. The racial makeup of the community is 79.3% White, 11.2% African American, 4.2% Asian, and 5.3% Hispanic or Latino.
Common Questions
What is Per Capita Income in Pleasant Hills?
Per Capita income in Pleasant Hills is $62,492.
What is the Median Family Income in Pleasant Hills?
Median Family Income in Pleasant Hills is $146,923.
What is the Median Household income in Pleasant Hills?
Median Household Income in Pleasant Hills is $138,531.
What is Income or Wage Gap in Pleasant Hills?
Income or Wage Gap in Pleasant Hills is 36.9%.
Women in Pleasant Hills earn 63.1 cents for every dollar earned by a man.
What is Inequality or Gini Index in Pleasant Hills?
Inequality or Gini Index in Pleasant Hills is 0.36.
What is the Total Population of Pleasant Hills?
Total Population of Pleasant Hills is 3,925.
What is the Total Male Population of Pleasant Hills?
Total Male Population of Pleasant Hills is 1,965.
What is the Total Female Population of Pleasant Hills?
Total Female Population of Pleasant Hills is 1,960.
What is the Ratio of Males per 100 Females in Pleasant Hills?
There are 100.26 Males per 100 Females in Pleasant Hills.
What is the Ratio of Females per 100 Males in Pleasant Hills?
There are 99.75 Females per 100 Males in Pleasant Hills.
What is the Median Population Age in Pleasant Hills?
Median Population Age in Pleasant Hills is 46.9 Years.
What is the Average Family Size in Pleasant Hills
Average Family Size in Pleasant Hills is 3.1 People.
What is the Average Household Size in Pleasant Hills
Average Household Size in Pleasant Hills is 2.6 People.
How Large is the Labor Force in Pleasant Hills?
There are 1,998 People in the Labor Forcein in Pleasant Hills.
What is the Percentage of People in the Labor Force in Pleasant Hills?
63.5% of People are in the Labor Force in Pleasant Hills.
What is the Unemployment Rate in Pleasant Hills?
Unemployment Rate in Pleasant Hills is 2.5%.