Zip Codes with the Highest Percentage of Population Employed in Legal Services & Support in Hyattsville, MD

RELATED REPORTS & OPTIONS

Legal Services & Support
Population
Families and Households
Female Fertility
Female Fertility (Unmarried)
Race (Community Size)
Race (Percentage)
Ancestry (Community Size)
AfghanAfricanAmericanApacheArabArgentineanArmenianAustrianBarbadianBasqueBelgianBermudanBhutaneseBlackfeetBolivianBrazilianBritishBritish West IndianBurmeseCanadianCape VerdeanCentral AmericanCentral American IndianCherokeeChileanColombianCroatianCubanCzechDanishDelawareDominicanDutchEastern EuropeanEcuadorianEgyptianEnglishEthiopianEuropeanFrenchFrench CanadianGermanGhanaianGreekGuatemalanGuyaneseHaitianHonduranHungarianIndian (Asian)IranianIrishIsraeliItalianJamaicanJapaneseKenyanKoreanLebaneseLiberianLithuanianMalaysianMalteseMexicanMexican American IndianMoroccanNative HawaiianNicaraguanNigerianNorthern EuropeanNorwegianPakistaniPanamanianPeruvianPolishPortuguesePuerto RicanRomanianRussianSalvadoranSamoanScandinavianScotch-IrishScottishSenegaleseSierra LeoneanSlavicSlovakSloveneSouth AfricanSouth AmericanSpaniardSpanishSri LankanSubsaharan AfricanSwedishSwissSyrianThaiTrinidadian and TobagonianTurkishU.S. Virgin IslanderUkrainianVenezuelanVietnameseWelshWest IndianYugoslavian
Ancestry (Percentage)
AfghanAfricanAmericanApacheArabArgentineanArmenianAustrianBarbadianBasqueBelgianBermudanBhutaneseBlackfeetBolivianBrazilianBritishBritish West IndianBurmeseCanadianCape VerdeanCentral AmericanCentral American IndianCherokeeChileanColombianCroatianCubanCzechDanishDelawareDominicanDutchEastern EuropeanEcuadorianEgyptianEnglishEthiopianEuropeanFrenchFrench CanadianGermanGhanaianGreekGuatemalanGuyaneseHaitianHonduranHungarianIndian (Asian)IranianIrishIsraeliItalianJamaicanJapaneseKenyanKoreanLebaneseLiberianLithuanianMalaysianMalteseMexicanMexican American IndianMoroccanNative HawaiianNicaraguanNigerianNorthern EuropeanNorwegianPakistaniPanamanianPeruvianPolishPortuguesePuerto RicanRomanianRussianSalvadoranSamoanScandinavianScotch-IrishScottishSenegaleseSierra LeoneanSlavicSlovakSloveneSouth AfricanSouth AmericanSpaniardSpanishSri LankanSubsaharan AfricanSwedishSwissSyrianThaiTrinidadian and TobagonianTurkishU.S. Virgin IslanderUkrainianVenezuelanVietnameseWelshWest IndianYugoslavian
Immigrant Origin (Total)
Immigrant Origin (Percentage)
Income
Income (Families)
Income (Households)
Poverty
Poverty (Families)
Unemployment
Employment Occupations
Employment Industries
Employer Class
Commute Time
Commute Means
School Enrollment
Education by Degree Field
Occupancy
Finances
Physical Characteristics
Hyattsville
Compare Zip Codes
Comparison Subject

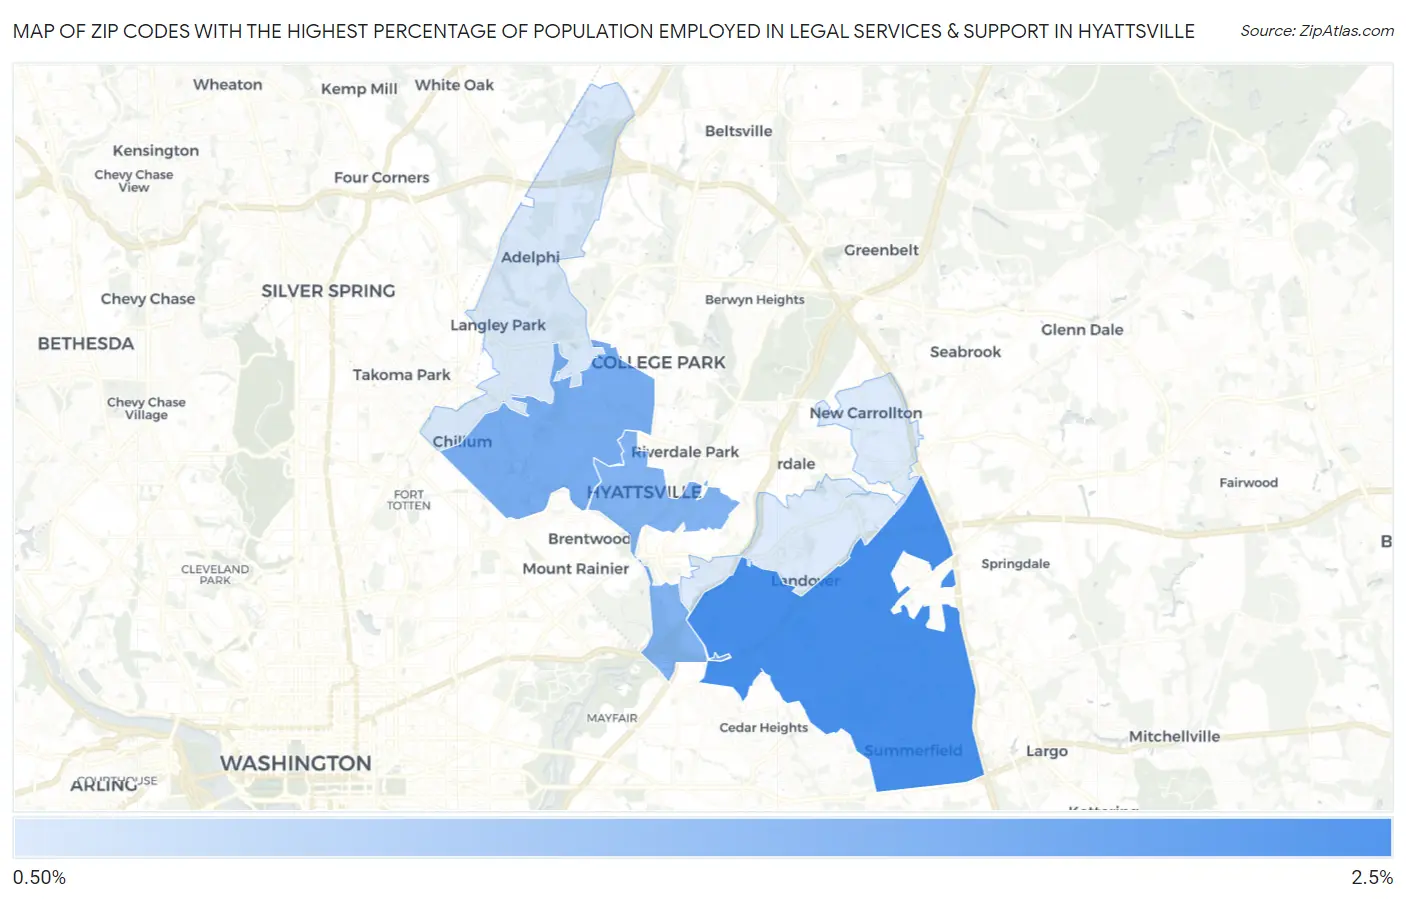
Map of Zip Codes with the Highest Percentage of Population Employed in Legal Services & Support in Hyattsville

0.0%
2.5%
Zip Codes with the Highest Percentage of Population Employed in Legal Services & Support in Hyattsville Map

Zip Codes with the Highest Percentage of Population Employed in Legal Services & Support in Hyattsville, MD

Zip Code % Employed vs State vs National
1.207852.2%1.8%(+0.412)#921.2%(+1.00)#3,062
2.207821.6%1.8%(-0.129)#1321.2%(+0.461)#4,502
3.207811.5%1.8%(-0.224)#1381.2%(+0.365)#4,850
4.207830.58%1.8%(-1.19)#2521.2%(-0.604)#11,686
5.207840.53%1.8%(-1.24)#2631.2%(-0.649)#12,208

Common Questions

What are the Top 3 Zip Codes with the Highest Percentage of Population Employed in Legal Services & Support in Hyattsville, MD?
Top 3 Zip Codes with the Highest Percentage of Population Employed in Legal Services & Support in Hyattsville, MD are:
#1
2.2%
#2
1.6%
#3
1.5%
What zip code has the Highest Percentage of Population Employed in Legal Services & Support in Hyattsville, MD?
20785 has the Highest Percentage of Population Employed in Legal Services & Support in Hyattsville, MD with 2.2%.
What is the Percentage of Population Employed in Legal Services & Support in Hyattsville, MD?
Percentage of Population Employed in Legal Services & Support in Hyattsville is 2.2%.
What is the Percentage of Population Employed in Legal Services & Support in Maryland?
Percentage of Population Employed in Legal Services & Support in Maryland is 1.8%.
What is the Percentage of Population Employed in Legal Services & Support in the United States?
Percentage of Population Employed in Legal Services & Support in the United States is 1.2%.